Embed Size (px)
Citation preview

0
a
Research Report: Identification of major economic drivers in Kasi economy of
Mangaung MARCH 2019/20
Economic Research Directorate

1
DISCLAIMER
The views and opinions expressed in this report are not necessarily those of, nor endorsed by the
Department of Economic, Small business development, Tourism and Environmental Affairs (DESTEA).
The empirical data collected is property of DESTEA. Comments and enquiries relating to this report are
welcomed and should be addressed to; [email protected] or [email protected].
This report was complied by:
_________________________
Mr S.T Belot
Assistant Director: Economic Research Management
Economic Research Mangement sub-directorate
Date: ____/ _____/ 2020
Checked by:
__________________________
Ms B.M Kruger-van Rooyen
Deputy Director: Economic Research Mangement
Economic Research Management sub-directorate
Date: _____/ ______/ 2020
Approved by:
_____________________________
Adv. J Mosia
Economic Research Director
Economic Research Directorate
Date: ______/ ______/ 2020

2
TABLE CONTENTS
1. Introduction .............................................................................................................................. 3
2. Background and significance of the study .................................................................................. 3
3. The Free State perspective......................................................................................................... 5
4. Mangaung Metropolitan Municipality ........................................................................................ 9
5. Research methodology ............................................................................................................ 12
6. Research findings ..................................................................................................................... 12
6.1 Sector Classification of Participants .................................................................................. 12
6.2 Gender and nationality of participants ............................................................................. 16
6.2.1 Nationality of Mangaung’s Kasi SMMEs .................................................................... 17
7. Youth participation in Mangaung’s Kasi economy .................................................................... 25
8. Challenges and Intervention required ...................................................................................... 26
8.1 Interventions required ..................................................................................................... 26
9. Recommendations ................................................................................................................... 29
9.1 Policy/ By-laws: towards creating a parallel approach ...................................................... 29
9.2 Assistance with Business Model ....................................................................................... 30
9.3 Training and Skills development ....................................................................................... 30
9.4 Infrastructure development/ maintenance ....................................................................... 31
9.5 Innovation required for products & services ..................................................................... 31
9.6 Township Revitalising Strategy and Fund .......................................................................... 32
10. Conclusion ........................................................................................................................... 32
11. Limitations of the study ....................................................................................................... 33
12. Direction for future research ................................................................................................ 33
13. References ........................................................................................................................... 35

3
1. Introduction
The Department of Economic, Small business development, Tourism and
Environmental Affairs (DESTEA) is tasked to be at the fore front in creating an enabling
environment to produce a transformed economy. During the 2019/20, DESTEA
assisted small medium and micro enterprises with financial and non-financial support.
The financial support for the 2019/20 financial year amounted to R3, 479,175 while
the non-financial support included pre-financial training and access to international
markets such as Brazil, China and Bulgaria.1. During the 2019/20 financial year,
DESTEA further provided extensive pre-financial training to beneficiaries before
disbursing equipment throughout the Free State province to the value of R3,
095,099.402. DESTEA is also in the processes of drafting its Township Revitalisation
Strategy and as such need this research to assist in mining information from the
ground. Therefore, specific objectives in support of the above-mentioned are:
To determine the sectors in which Kasi businesses currently participate, within
the Free State Province using Mangaung as a case study;
To determine which sectors are thriving and to determine their ownership
characteristics;
To determine the youth participation within Kasi businesses;
To identify the available opportunities for growth and development within the
townships economy; and
To identify gaps in the market in terms of supply and demand of Kasi products.
It is important for DESTEA to have a better understanding of the current township
economic drivers. This research seeks to assist DESTEA to determine which sectors
are dominating in Mangaung’s Townships and how they can be aligned with the priority
sectors as identified by the Free State Growth and Development Strategy.
2. Background and significance of the study
South Africa’s historical developments and spatial planning were dictated by the Group
Areas Act No.41 of the Apartheid administration. From the 19th century to the end of
1 DESTEA. SBD Disbursement of Equipment for 2018 Report. Free State: Bloemfontein 2 DESTEA. 2019. Final MEC Report on Enterprise Support. Free State: Bloemfontein.

4
Apartheid regime, the development of segregated and often under-developed urban
areas took place. The Group Areas Act No.41 was passed by the apartheid
government on the 27th April 1950 with a primary purpose to enhance white supremacy
in the country. The population census of 1960 indicated that Africans rep resented
68.3% of the population, followed by White 9.4%, Coloured 9.4% and Indian 3.0%.3
During the apartheid era, the majority (African) citizens were deprived of land, skills as
well as the opportunities to establish businesses. The history of South African
townships is therefore rooted in South Africa’s apartheid regime. The economic
infrastructure was left in an unfavourable state by the oppressive rules and regulations
of the apartheid government. The decision-makers at the time, navigated balancing
the tension between two needs: to keep black people close enough to provide cheap
labour and keep them away to ensure a clear social distance.4
Townships are situated quite the distance from the traditionally white population within
a geographic location and are surrounded by open buffer areas. Townships or Kasi as
they are more affectionately referred to; usually have land that is available for
expansion that is far away from the city centre. It normally consists of one road that
connects the Township to the central business district, however they are always within
reach of public transportation. Access to vital services such as sanitation and
electricity struggle to meet the demands of the growing population. The residents rely
on capital from outside the township because they are not positioned to take full
advantage of the broader economy.5 As a result, businesses in Townships were never
supported by the apartheid government. In an attempt to address the inequalities of
the past, the South African government has undertaken a number of economic
policies. At the heart of the economic transformation has been the adoption of a local
economic development framework, which underpins planning and employment
creation at the local level.6 The spatial planning legacy is still very evident in post-
apartheid South Africa. The first decade of South African Democracy saw the
development of the Reconstruction Development Programme (RDP) in an attempt to
3 Group Areas Act No.41 of 1950. South Africa’s Apartheid Segregation Act.
(https://www.thoughtco.com/group-areas-act-43476). 4 Economics of South African townships, special focus on Diepsloot 5 Township Economic Development and Integration, Mahmood Sonday, 2015 6 Department of Provincial and local Government 2003: 6
5
settle the needs of the nation by providing decent houses for Africans. Municipalities
were immediately under immense pressure to provide basic services, these pressures
are still persistent, with demands far exceeding the budget and capabilities. According
to a Strategic Insights expert GG Alock, during the Apartheid era, townships were
referred to as apartheid ghetto but since the dawn of democracy they have developed
into amazing transformed places. Additionally, many South African brands are losing
out on an opportunity to take advantage of the Kasi market which consists of exciting
businesses, enthusiastic people, and a tight network social community which provides
a snapshot of what the future could look like. Accordingly, this study focuses on the
township economy with special focus on Mangaung Metropolitan Municipality.
3. The Free State perspective
The Free State Growth and Development Strategy (FSGDS) outlines the key priority
sectors that should be supported by government. These key priorities include,
agriculture, mining, manufacturing, transport, tourism and transport that need to be
supported in order to achieve the objective of an inclusive economic environment and
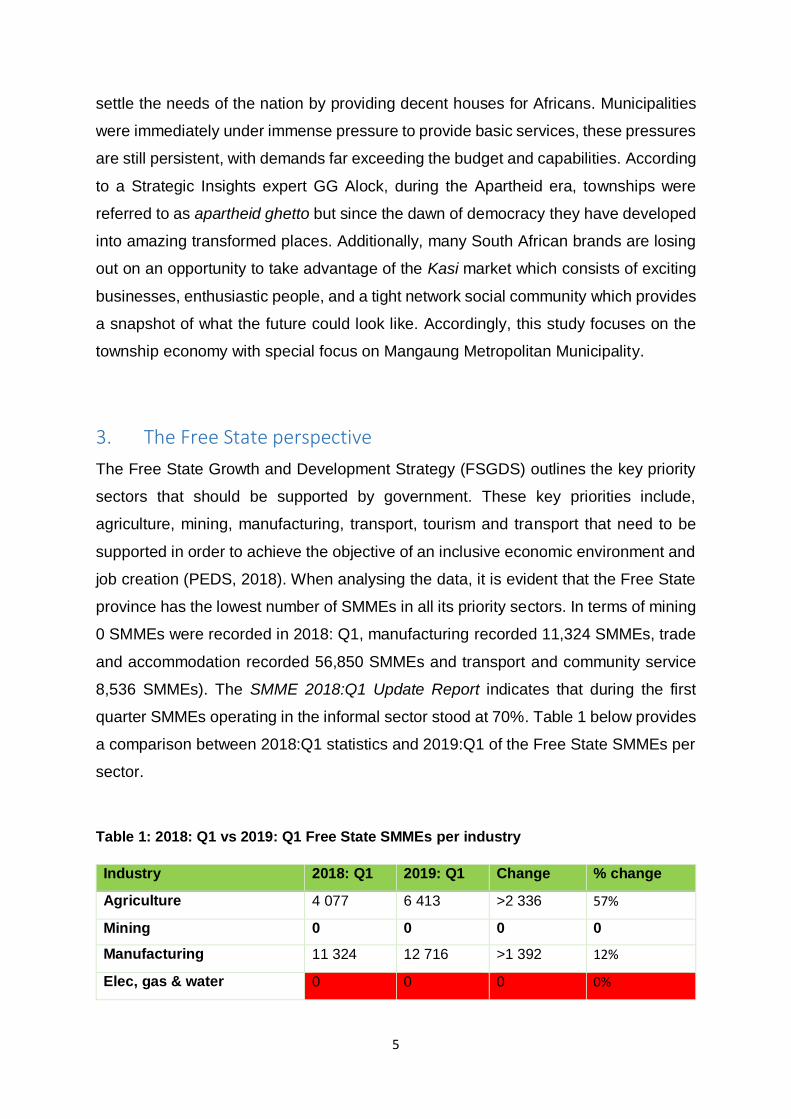
job creation (PEDS, 2018). When analysing the data, it is evident that the Free State
province has the lowest number of SMMEs in all its priority sectors. In terms of mining
0 SMMEs were recorded in 2018: Q1, manufacturing recorded 11,324 SMMEs, trade
and accommodation recorded 56,850 SMMEs and transport and community service
8,536 SMMEs). The SMME 2018:Q1 Update Report indicates that during the first
quarter SMMEs operating in the informal sector stood at 70%. Table 1 below provides
a comparison between 2018:Q1 statistics and 2019:Q1 of the Free State SMMEs per
sector.
Table 1: 2018: Q1 vs 2019: Q1 Free State SMMEs per industry
Industry 2018: Q1 2019: Q1 Change % change
Agriculture 4 077 6 413 >2 336 57%
Mining 0 0 0 0
Manufacturing 11 324 12 716 >1 392 12%
Elec, gas & water 0 0 0 0%

6
Construction 8 172 18 947 >10 775 132%
Trade & accommodation 56 850 55 487 <1 363 -2%
Transport & commu. 8 536 5 652 <5 884 -34%
Financial & business
services
8 661 9 384 >723 8%
Community 16 965 11 823 <5 142 -30%
Other 0 1 319 >1 319 0%
Total 114 584 121 740 >7156 6%
Source: (Small Enterprise Development Agency, 2018 & 2019).
The year-on-year comparison between 2018:Q1 and 2019:Q2 indicate that there was
an overall increase (6%) in the number of SMMEs in the following industries;
agriculture, manufacturing, construction, Finance and business services and other.
Table three further indicates that no growth in the mining sector was recorded in the
Free State. A further decrease in the number of SMMEs were recorded in the following
sectors; Financial and business services (- 5 884), community services decreased by
(-5 142) and in trade and accommodation recorded a decrease of (- 1 363) SMMEs.
Figure 1 below indicates the employment provided by SMMEs in the formal and
informal sectors in South Africa.
Figure 1: South African SMMEs in the formal and informal sector
Source: (Small Enterprise Development Agency, 2018, 2019: 13).
Own account worker16%
Employer8%
Private households0%Agriculture
5%
Informal sector10%
Formal sector61%
Employment provided by SMMEs
Own account worker Employer Private households Agriculture Informal sector Formal sector

7
The data from first quarter 2019 indicates that the small medium and macro
enterprises (SMMEs) sector employed 10.8 million people which is equivalent to 66%
of all employment in South Africa. Of the 10.8 million jobs, only 2.55 million jobs were
from the SMMEs owners themselves, while the remaining balance of 8.3 million jobs
were from their employees. Furthermore, the data indicated that the number of SMME
employees (non-owners) increased by 29% between 2018: Q1 and 2019: Q1. The
formal sector represented the majority of employment at (61%) and 10% in the
informal sector, while approximately 38% is occupied by female workers. Therefore,
the need to develop SMMEs is crucial due to its potential to increase job opportunities.
SMMEs are viewed as potential drivers for economic development. Hence advisors
have proposed that SMME development is the solution to joblessness in South Africa.
This is even more evident when considering the emphasis in all the “major policy
engagements of President Cyril Ramaphosa’s 2018 to 2019 state of the nation
address and that of the employment summit under the current administration”. 7
Characteristic of Youth in the informal sector
The South African Department of Trade and Industry and the Department of Small
Business Development launched a Youth Enterprise Development Strategy to
enhance mass youth enterprise development for youth-owned enterprises. However,
youth people in the rural areas still find it difficult to fully participate in South Africa’s
economy. According to the Youth Development Policy 2015 – 2020, in order to ensure
that youth have access to land, business skills, information and opportunities to
influence decisions the following should occur;
Young people should become more involved in decision-making institutions of
traditional authorities.
The National Youth Development Agency in collaboration with the Department
of Small and Medium Enterprises should promote the establishment of
ecotourism facilities in rural areas owned by youth.
7 Business Day. 2019. Creating jobs through SMMEs means creating a new market.
(https://www.businesslive.co.za/bd/opinion/2019-03-30-creating-jobs-through-smmes-means-creating-a-new-market/).

8
Young people in South Africa should be assisted by the Department of Land
Reform to access land (The Presidency, 2015).
The South African Government has prioritised enhancing sustainable entrepreneurial
development for Small, Medium and Micro Enterprises (SMMEs) in South Africa. The
importance of SMMEs are not only limited to its ability to create employment in a
country but also because it’s an opportunity to ensure that young people participate in
the economy and distribute that wealth which contributes towards the welfare of a state
(Madzivhandila & Dlamini, 2015). At provincial level, a study conducted in 2005 by the
African Institute for Community-Driven Development, concluded that 50% of the
population at the time in Mangaung was employed in the informal sector (African
Institute for Community-Driven Development, 2015). Although the data is relatively
old, it does provide an idea of the participation of Mangaung in the informal sector.
The working definition for this research report will focus so-called “burden of
unemployed” youth aged (15-34 years) in South Africa.8 The youth unemployment
statistics have been worrisome in South Africa and particularly in the Free State. When
reviewing the youth unemployment in the Free State from 2008 to 2018, it is evident
that unemployment rate has been on a steady increase over the past decade. The
overall youth unemployment in the Free State increased from 53.8% in 2008 to 68.8%
in 2018. Youth unemployment in Mangaung region increased from 49.8% in 2008 to
63.4% in 2018. 9This calls for drastic intervention on the part of the Free State
Government and the private sector.
Table 2: Youth Unemployment rate (Aged 15-24) (Official Definition) 2008 to 2018
Items 2008 2009 2010 2011 2012 2013 2014 2015 2016 2017 2018
Free State 53.8% 54.3% 56.1% 57.5% 61.5% 64.4% 65.2% 65.1% 66.4% 67.6% 68.8%
Mangaung 49.8% 50.0% 51.4% 52.6% 55.8% 58.4% 58.8% 58.6% 60.4% 62.2% 63.4%
Source: IHS Markit Regional eXplorer 1854 (2.6i)
8 The Department of Statistics South Africa. (http://www.statssa.gov.za/?p=12362). 9 The Department of Statistics South Africa. (http://www.statssa.gov.za/?p=12362).

9
4. Mangaung Metropolitan Municipality
Mangaung Metropolitan Municipality (hereafter referred to as the municipality) has the
largest population in the Free State province, made up of approximately 853 000
people or 29.9% of the total population in the Free State. Mangaung contributed R97.6
billion to the total Gross Domestic Product (GDP) of the Free State. 10The
Municipality's economy is made up of various industries. In 2018 the community
services sector was the largest contributing sector within the Mangaung Metropolitan
Municipality accounting for R29.2billion or 33.2% of the total Gross Value Added
(GVA) in the metro’s economy. 11The community sector is followed by the finance
sector at 21.5%, followed by trade at 17.0%. During that same period, the sector that
contributed the least to the economy of the municipality is the mining sector with a
mere 0.97% or R857 million of the total GVA. 12
Table 3: Gross Value Added GVA by Broad Economic Sectors
Mangaung Free State
National Total
Mangaung as % of province
Mangaung as % of national
Agriculture 1.6 11.1 106.1 14.0% 1.47%
Mining 0.9 23.3 350.9 3.7% 0.24%
Manufacturing 5.2 23.4 572.9 22.2% 0.90%
Electricity 3.0 9.4 166.0 31.4% 1.78%
Construction 2.5 5.6 170.3 44.4% 1.47%
Trade 15.0 31.7 652.7 47.2% 2.29%
Transport 11.8 22.3 426.7 53.1% 2.77%
Finance 18.9 36.4 854.4 52.0% 2.22%
Community services
29.2 55.6 1,041.3 52.5% 2.81%
Total Industries 88.0 218.7 4,341.3 40.2% 2.03%
Source: IHS Markit Regional eXplorer version 1854
10 IHS Markit Regional eXplorer version 1854
11 IHS Markit Regional eXplorer version 1854 12 IHS Markit Regional eXplorer version 1854
10
Mangaung is made up of Bloemfontein, Thaba Nchu, Botshabelo, Wepener, Soutpan,
Van Stadensrus and Dewetsdorp. The Mangaung townships display similar
characteristics to those of the rest of South African townships. There were a wide
range of occupations including hawkers, spaza shops, fast foods, traditional healers,
and hairdressers, illustrating the diversity of the sector. The informal sector should be
taken more seriously as they contribute 7% to the national gross product (GDP) in
South Africa and a further 22% of total employment in the country. Furthermore,
according to the Nevin (2004), the South Africa’s informal traders general
approximately R32 billion on an annual basis and provide employment for many
people13.
Youth unemployment is an important aspect to consider with regards to their limited
involvement in the Free State economy. The increase in youth unemployment over the
ten year period between 2008 and 2018 (as indicated in table 2) should be viewed in
conjunction with the self-employed youth in the informal sector. Table 4 below
indicates the number of self-employed youth in the Free State informal sector.
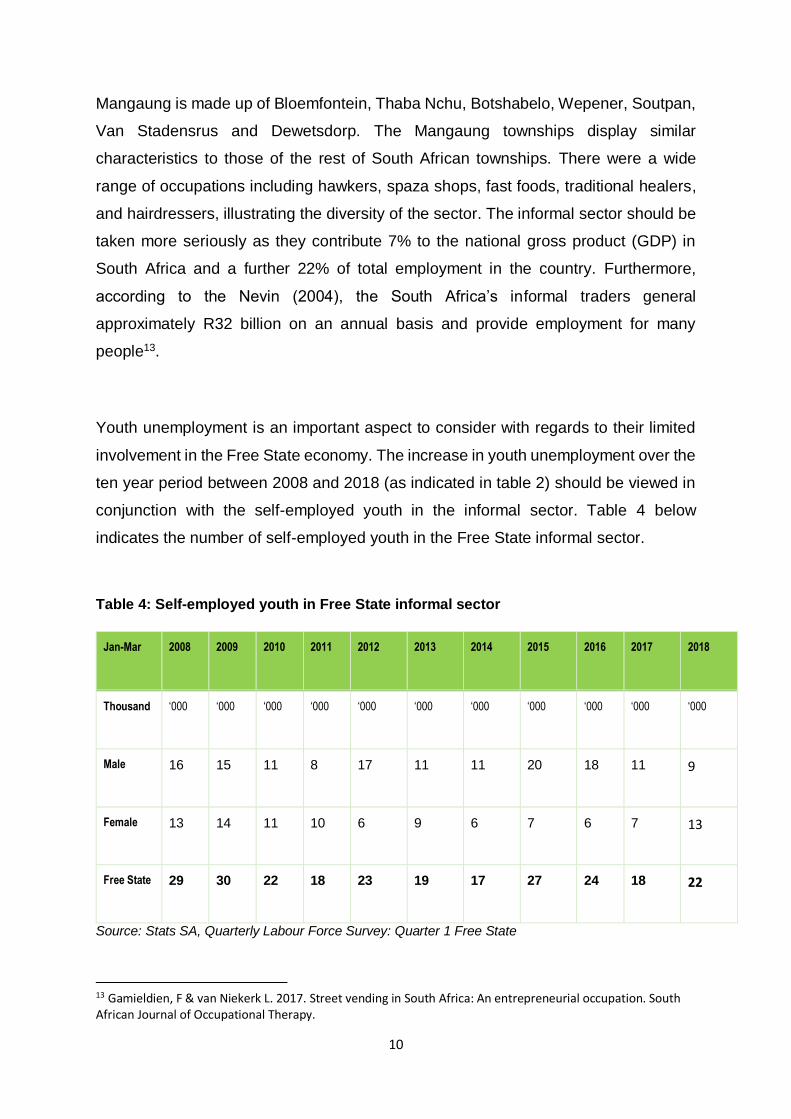
Table 4: Self-employed youth in Free State informal sector
Jan-Mar 2008 2009 2010 2011 2012 2013 2014 2015 2016 2017 2018
Thousand ‘000 ‘000 ‘000 ‘000 ‘000 ‘000 ‘000 ‘000 ‘000 ‘000 ‘000
Male 16 15 11 8 17 11 11 20 18 11 9
Female 13 14 11 10 6 9 6 7 6 7 13
Free State 29 30 22 18 23 19 17 27 24 18 22
Source: Stats SA, Quarterly Labour Force Survey: Quarter 1 Free State
13 Gamieldien, F & van Niekerk L. 2017. Street vending in South Africa: An entrepreneurial occupation. South African Journal of Occupational Therapy.

11
Table 3 indicates that the self-employed youth in the Free State’s informal sector
decreased from 29 000 in 2008 to 22 000 in 2018. Therefore, the numbers indicate
that a total of 7 000 businesses owned by youth in the informal sector of the Free State
has ceased to exist. The reason for this large number of why SMMEs failing in the
Free State could be linked to the numerous factors as indicated in SMME literature. In
an effort to respond to the growing concern of SMMEs failure, DESTEA has supported
a number of SMMEs in the Mangaung area of the Free State. These include individuals
which government considers vulnerable groups namely; youth and women. The
beneficiaries of DESTEA are operating in the following sectors; retail, services,
manufacturing, textile and automotive. The information of the beneficiaries
unfortunately does indicate whether these businesses operate within Mangaung’s
Kasis’.
Table 5: Summary of DESTEA’s beneficiaries in Mangaung 2008-2019
Town No. of
beneficiaries
Sectors Youth
Enterprise
No
indication
Non-youth
enterprise
Bloemfontein 179 Services, agro-processing,
manufacturing, transport
58 57 64
Botshabelo 5 Tourism, manufacturing, services No
indication
No
indication
No
indication
Thaba ‘Nchu 46 Services, transport, manufacturing,
tourism, ICT
25 11 10
Wepener 0 Not applicable 0 0 0
Soutpan 0 Not applicable 0 0 0
Van
Stadensrus
0 Not applicable 0 0 0
Dewetsdorp 1 Health care (Pharmacy) 1 0 0
*Source: DESTEA SBD, Long list updated14
14 The information provided in the table was provided by SBD Directorate at DESTEA.

12
5. Research methodology
This study is descriptive in nature and utilised a mixed method approach to enhance
the systematic integration of qualitative and quantitative date. This is done to ensure
that the research findings presents synergistic usage of data than to heavily rely on
either quantitative or qualitative data. The quantitative data was collected through the
literature review and qualitative was collected through distributing questionnaires in
Bloemfontein, Soutpan, Dewestdorp, Wepener, Thaba Nchu and Botshabelo. This
empirical research adhered to all ethical prescripts
6. Research findings
This section will discuss the research findings based on interviews and observations
by the Researchers. This section will further determine whether there is a correlation
between the empirical data collected and previous research conducted.
6.1 Sector Classification of Participants
South Africa reportedly has 50 000 informal take-away outlets selling a range of
products from a quarter-loaf of bread with filling, snoek, shisa nyama etc. with an
approximately R50 000 income a day, seven days a week. 15Statistics further indicate
that 50 000 table-top vendors (commonly known as hawkers) earn between R1500 to
R3000 profit per month. Regarding accommodation, backroom rental economy in the
township is worth approximately R30 billion per annum. 16The outlets and traders are
paying Value Added Tax (VAT) on their substantial purchases and they are employing
people which provides household incomes in South Africa. Statistics indicate that the
informal sector of South Africa is growing at a rapid pace in retail, fast food and other
segments compared to the formal sector (Financial mail, 2019). In terms of the
transport sector, minibuses, bus services and taxi industry are widely utilised by the
community, especially those commuting from Thaba ‘Nchu, Botshabelo and
15 Big Box. 2019. Repurposed shipping containers: at the heart of South Africa’s informal economy.
(https://www.bigboxcontainers.co.za/blog/repurposed-shipping-containers-at-the-heart-of-south-africas-informal-economy) 16 Financial mail. 2019. (https://www.businesslive.co.za/redzone/news-insights/2019-01-17-the-informal-market-its-the-townships-turn/.

13
Bloemfontein. The dominant players in the Free State in terms of the busses is
Itumeleng Bus Lines (Pty) Ltd t/a Interstate Bus Lines which owns 237 busses with 70
employees. Another big player in the transport sector is Scopefull 21 (Pty) Ltd t/a
Maluti Bus Service has 36 busses and employs 120 people (Who Owns Whom, 2020).

14
The empirical data affirms that retail is one of the fastest growing segments in the informal sector. According to the data obtained
retail is the largest segment representing (91%) of segment in Mangaung’s Kasis’ economy. The second largest segment is
manufacturing at (4.1%), followed by finance representing (1.4%). Figure 2 below addresses the main purpose of this study which is
to “identify major economic drivers in Kasi economy”. Figure two on the proceeding page demonstrate the major economic drivers in
Mangaung’s Kasis’.
Figure 2: Major economic drivers in Mangaung’s Kasis’
0,70%
4,10%
0,70%
2,10%
0%
0%
0%
0%
91%
1,40%
0,00% 10,00% 20,00% 30,00% 40,00% 50,00% 60,00% 70,00% 80,00% 90,00% 100,00%
1
Sectors in Mangaung's Kasi
Finance Retail Transport Tourism ICT Green economy Community service Construction & real estate Manufacture Agriculture

15
Table 6: Informal Sectors of Mangaung’s Kasi economy
Sectors Cluster
Retail Butchery Spaza Fruit & veg stall Take away General dealer
Service industry Car wash Hair Salons Burial Society
Construction & real estate
Property Construction Renting
Tourism Bed and Breakfast Backroom rentals17 *Backpackers *Self-catering units18
Manufacturing Auto body repairs Carpentry
Transport Logistics
Agriculture
Finance Stokvel Cash loans
Creative Industries Arts and craft entertainment fashion
Community services Childcare
ICT Internet solutions Electronics repairs
Green economy Waste management Coal and wood Clustering adapted from: Gauteng Kasi Revitalisation Strategy
17 The informal market: it’s the township’s turn. (https://www.businesslive.co.za/redzone/news-insights/2019-01-17-the-informal-market-its-the-townships-turn/). 18 *DESTEA. 2018. Study on the State and Ownership Patterns of the Hospitality Industry (Tourism Sector) in the Free State and the Linkages with Other Economic Sectors in the Province (http://www.edtea.fs.gov.za/wp-content/uploads/2012/09/Study-on-the-state-and-ownership-patterns-of-the-hospitality-industry-tourism-sector-in-the-Free-State-and-the-linkages-with-other-economic-sectors-final.pdf)

16
6.2 Gender and nationality of participants
A total of n=200 questionnaires were distributed throughout the townships of
Mangaung. A total of n=143 questionnaires were received back from the participants.
Figure 1 below indicates that 68% of the participants are male, while only 27% are
female-owned and a mere 4% are co-owned (husbands and wives). The remaining
6% of the participants did not want to indicate their gender.
Figure 3: Gender of Kasi enterprise owners
Despite the considerable efforts made by South African government to promote
gender equality in small, medium and micro-sized enterprises (SMMEs), 20% of
female-owned businesses fail annually. The Department of Trade and Industry (the
dti) have invested millions of Rands to support female-owned SMMEs with funding,
training, grants and consultation services. However, according to Bridget (2017), in an
article titled Women entrepreneurship in South Africa: Understanding the role of
competencies in business success; female-owned SMMEs fail due to over-
dependence on government’s initiatives (Bridget, 2017). It is crucial for the Free State
Provincial Government to provide development assistance to SMMEs, especially
focusing on women and youth because the first 2-3 years are a critical threshold for
68%
27%
4%
1%
GENDER OF KASI ENTERPRISE OWNERS
Male Female Co-owned No indication

17
an SMME in terms of longer term survival (Seda, 2018). The empirical data indicate
that there is a correlation between the empirical data and findings from previous
research conducted that demonstrates that SMMEs are predominately owned by
males. According to the 2016/17 GEM Global Report, 34% of South African small and
medium (SMEs) businesses are female-owned, while only 28% of SMEs that are co-
owned by male and females, and male led by 38%. 19Although these figures are a
cause for concern, the national figure is still better than the global average of 31% for
female-owned SMEs.
The report further found that female entrepreneurs’ barriers to entry are slightly
different to their male counterparts. Below are some of the common barriers
highlighted in various studies;
Greater levels of domestic responsibilities;
Lower levels of education especially amongst developing countries;
Insufficient female role models in the business sector;
Less business-orientated networks in their communities;
Lack of capital and assets;
Lower status in society; and
Women generally lack assertiveness and confidence in their ability to succeed
(SME South Africa, 2017).
6.2.1 Nationality of Mangaung’s Kasi SMMEs
Previous research conducted on SMMEs identified two types of entrepreneurs; (1)
opportunity entrepreneurs and (2) necessity entrepreneurs. The former refers to
entrepreneurs that discover or identify an opportunity in the marketplace and take
advantage of that opportunity. The latter refers to those entrepreneurs that start a
business out of a dire need to survive due to lack of employment opportunities (Botha,
Nieman & Van Vuuren, 2007). It is important to determine the number of SMMEs and
19 GEM 2016/2017 Global Report. 2017. Global Entrepreneurship Monitor.
(https://www.gemconsortium.org/report/gem-2016-2017-global-report).
18
whether they are in the formal or informal sector. The picture of the informal sector
has changed in South Africa, Free State and Mangaung in particular. The number of
foreign owned businesses are dominating the informal sector. In 2018, the Department
of Economic, Small business development, Tourism and Environmental Affairs
(DESTEA) commissioned a study on the Hair Salon Industry as a Contribution to
Growth of the Economy of the Free State, which found that 60% of the hair salons in
the Free State are owned by non-South Africans. Furthermore, a majority of these
small businesses were not registered, meaning they do not contribute to the GVA of
Mangaung (DESTEA, 2018).
This study found that foreign-owned SMMEs in Mangaung’s Kasi make up 47% of the
n=200 participants from the various city/ towns. A majority of 53% of SMMEs in
Mangaung region are owned by South Africans. The questionnaire asked the
participants to indicate their nationality and the feedback received is as follow;
Bangladesh makes up 22% a (dominating in Wepener, Thaba Nchu and
Bloemfontein);
The second largest group of foreigners are Ethiopians (7%), Zimbabweans
(2.2%), Ghanaians (2%) and Nigerians (1.4%);
People from Lesotho represents 1% of SMMEs;
Feedback received indicate that1.4% of the participants responded that they
are from the African continent but did not specify from which country; and
Unfortunately, 8% of the participants chose not to indicate their nationality due
to mistrust towards provincial government.
However, through observations by the researchers while conducting field work, it was
obvious that those participants who failed to respond were Africans but not necessarily
South African citizens. The figure below illustrates the country of origin based on the
data collected in Mangaung’s Kasis’.

19
Figure 4: Mangaung SMMEs Owners: Country of origin
The concern that has been raised and greatly publicised by media is the presence of
foreigners in South Africa. According to Liedeman, Charman, Piper and Petersen
(2013: 1), since 2015 a fierce competition had emerged between foreign-owned
businesses and South African owned spaza shops. This study further found that
foreign owned shops deliberately position themselves to compete with South African
shops, they are generally cheaper, utilise price discounting as a strategy, improved
stock and are generally favoured by local consumers (Liedeman, et.al. 2013). This
study conducted in Mangaung’s Kasi indicated that foreign-owned shops have taken
the poverty levels into account and have adjusted their products to be even more
affordable to the ordinary man on the street. The images below illustrate some of the
initiatives taken by foreign-owned shops.
1,40%
22%
7%2% 1% 1% 1% 1,40%
8%
53%
2,20%
0,00%
10,00%
20,00%
30,00%
40,00%
50,00%
60,00%
70,00%
80,00%
90,00%
100,00%

20
Photo 1: Mangaung Foreign-owned tuckshops sell 5 teabags for R0.50 and sugar
packets R2.00.
Photo supplied by: DESTEA researchers.
Photo 2: Sign display in foreign owned shops: meat & vegetables for sale
Photo supplied by: Destea researchers

21
Photo 3: Variety of Spices, Soya mince and seshabo
Photo supplied by: Destea researchers
The photos illustrate some initiatives taken by foreign-owned shops. They cater for
local people in the community, taking into account the high unemployment in the Free
State. Instead of selling Supreme Chicken at 5kg at R150.00, they repackage the
chicken into smaller bags, name them and sell them accordingly. For example,
Supreme 20 at R62.00, Supreme 4 at R38.00 and other options such as Bones for
R50.00, WMC R30.00 and Jackpot which includes meat and bones for R40.00. South
African shops in Mangaung’s Kasis are reluctant to sell their products in smaller
quantities, which in turn leads to them being out-competed by the non-South African
shop owners.
An ethnographic study that was conducted by Liedeman, Charman, Piper and
Petersen (2013), found that foreign-owned shops are usually micro- or small-scale
survivalist entrepreneurs with social networks. A case study conducted in a particular
area with Somalian shopkeepers found that they operate within a network that provide
the following:

22
Recruit cheap labour from Somalia;
Enforcement of contractual agreements through the network with clan elders
who are managing business deals;
Access to strategic investment in geographical areas to establish Somali
strongholds;
Group purchasing / Bulk purchasing deals to ensure discounts and operational
economies of scale; and
Facilitate micro-finance by organising investments and business partnerships
(Liedeman, et.al, 2013).
The Somalia business model is stronger in comparison to South African shopkeepers
who usually operate on poor social network with limited members who are relatives
that only provide labour. Although the case study of the Somalians demonstrates
strong networks, the empirical data from the Mangaung Kasi study goes a step further
and identify that there is also strong competition between foreigners. The
questionnaire asked the participants to indicate the challenges they experience and
below are some of the comments by the participants;
“Don’t know how the Somali guy do business. We buy e.g. something for R2.00 and sell it for
R3.00 he buys for R2.00 and sells for R2.00” – KEQ38 Wepener foreign participant
“More shops have opened in the past 5 years…things are more expensive” –KEQ53 Thaba
Nchu, Bangladesh participant.
The common challenges that were identified by the participants relate to greater
volume of competition, customer base, location and site, regulations and crime in the
areas. There appears to be consensus amongst the participants that too many shops
(spaza shops) exist in the townships of Mangaung. This has a huge impact on the
competition and providing clients with credit who in turn are slow to pay the shops.
Additional challenges that were identified relate to the following;
Poor financial management;
Transporting goods (public transport is limiting);
Poor infrastructure and low supply of electricity; and
Unable to repair broken equipment or purchase new equipment.
23
The questionnaire further asked the participants whether they were aware of any
funding opportunities available to them.
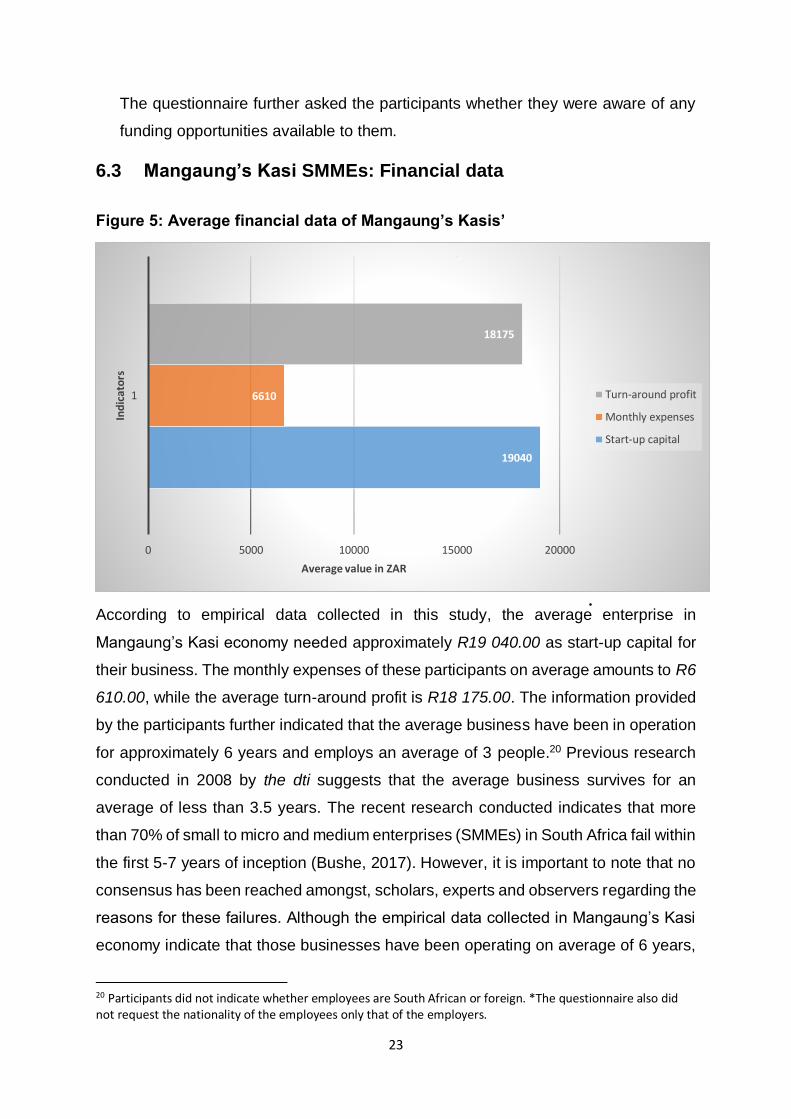
6.3 Mangaung’s Kasi SMMEs: Financial data
Figure 5: Average financial data of Mangaung’s Kasis’
According to empirical data collected in this study, the average enterprise in
Mangaung’s Kasi economy needed approximately R19 040.00 as start-up capital for
their business. The monthly expenses of these participants on average amounts to R6
610.00, while the average turn-around profit is R18 175.00. The information provided
by the participants further indicated that the average business have been in operation
for approximately 6 years and employs an average of 3 people.20 Previous research
conducted in 2008 by the dti suggests that the average business survives for an
average of less than 3.5 years. The recent research conducted indicates that more
than 70% of small to micro and medium enterprises (SMMEs) in South Africa fail within
the first 5-7 years of inception (Bushe, 2017). However, it is important to note that no
consensus has been reached amongst, scholars, experts and observers regarding the
reasons for these failures. Although the empirical data collected in Mangaung’s Kasi
economy indicate that those businesses have been operating on average of 6 years,
20 Participants did not indicate whether employees are South African or foreign. *The questionnaire also did not request the nationality of the employees only that of the employers.
19040
6610
18175
0 5000 10000 15000 20000
1
Average value in ZAR
Ind
icat
ors
Turn-around profit
Monthly expenses
Start-up capital

24
the latest literature cautions that they could still fold or fail in the next year. This is a
concern raised by South African shop owners in Mangaung:
“Competition has bigger volumes of stock, I pack 7 potatoes and he packs 14” –KEQ13
(55yr, South African male, Soutpan)
“Competition has risen, help support business” –KEQ125 (28yr, South African female,
Botshabelo)
“Competition from outside players e.g. Bangladesh and Somalia, turn our residence away” –
KEQ44 (55yr, South African male, Wepener)
The feedback from the enterprise owners that operate within Mangaung’s Kasi have
acknowledged the fact that there has been an increase in the number of foreign-owned
shops. As a result, competition has increased within these towns and South African
shop owners have been struggling to fairly compete with their foreign counterparts.
The questionnaire enquired where enterprise owners obtained their source of funding.
It should be noted that a majority of (46.8%) of the participants did not want to indicate
their source of funding. Of these participants who did not indicate their respective
source of funding; (25%) are South African, (17%) are Bangladeshi, (8%) Ethiopians,
(7%) indicated Africans, and (1%) of the participants are Zimbabweans. Figure six
below show the responses from the participants with regards to their source of funding.
Figure 6: Source of funding of SMMEs in Mangaung’s Kasis’
Family &friends
Soceity/Stockvel
OverseasFinancial
InstitutionsSaved No indication
Series1 19% 1,40% 3,50% 1,30% 28% 46,80%
0%
5%
10%
15%
20%
25%
30%
35%
40%
45%
50%
Sou
rce
of
fun
din
g

25
7. Youth participation in Mangaung’s Kasi economy
One of the objectives of this study was to determine Mangaung’s youth participation
within the Kasi economy. According to the South African National Youth Policy and its
National Youth Commission Act, youth in South Africa are defined as those persons
aged between 14 to 35 years of age. 21However, the working definition for this
research report will focus on the “burden of unemployed” youth aged 15-34 years.22
The empirical data collected indicated that 40.5% of n=143 participants are youth-
owned enterprises. Of those youth enterprises 25.9% are female-owned enterprises
with the highest qualification being a Diploma and lowest qualification being Grade 11.
The male-owned youth enterprises represents 74.1% of the participants of which their
highest qualification is a Bachelor degree and the lowest being Grade 8. The data
further indicated that out of the 40.5% of youth-owned enterprises, a mere 34% are
South African youth, in contrast to the 59% that are foreign-owned youth enterprises.
A total of 7% of the participants did not indicate their country of origin.
Chart 1: Youth owned enterprises
21 South African Youth. (https://www.youthpolicy.org/factsheets/country/south-africa/). 22 Department of Statistics South Africa. (http://www.statssa.gov.za/?p=12121).
Male74%
Female26%
Male
Female

26
8. Challenges and Intervention required
A number of challenges were raised by the participants and the common themes that
derived from the participants’ responses which include the following;
8.1 Interventions required
8.1.1 The anti-foreigner” narrative: It must be noted that immigration of non-South
African informal traders into South African townships has been perceived by
South African traders largely in three distinct ways: (1) the first, non-South
Africans in general are viewed to be in South Africa illegally, (2) local business
owners view the non-South African traders as participating in unfair business
practices such as selling expired goods, fake goods, etc. (3) non-South Africans
are viewed as having a deliberate strategy to oust the South African traders.
These perceptions amongst South African traders have added to the strained
relationships with their non-South African counterparts in the Mangaung
Township.
8.1.2 Regulation/ By-laws: The South African traders put blame on the municipality
for failing to regulate township trade, while other state departments such as the
Regulation and space
Broken equipment
Volatile businesses
Cash flow within business
Xenophobic attacks
Environmental challenges (weather unpredictable)
People who buy on credit, fail to pay their debt
27
Department of Home Affairs and the South African Police Service are being
blamed for turning a blind eye to these immigrants of whom the local traders
claim that a majority are both illegally staying in the country and being allowed
to trade illegally.23 South African traders are expected by the government to
comply with the two key documents regulating township trade: the National
Business Act 71 of 1991 and the National Health Act 61 of 2003, while the
majority of non-South African traders do not comply. Consequently, South
African traders feel they have been left unaided when dealing with the
consequences of unfair competition resulting from the alleged failure by their
own government to regulate the influx of non-South African traders.
8.1.3 Long and short term support needed: Supportive infrastructure, together
with development of township value chains where entrepreneurship is key,
playing a central part in the process. While conducting field work, the DESTEA’s
researchers reaffirms the findings by Phillip (2018) study that concluded that
majority of goods sold in Kasi are mass-produced by large companies and
associated brands that are usually found on the shopping list of all South
Africans. These products and brands include; maze meal (Iwisa, Ace, and
White Star), milk (Clover and Dairy Belle), bread (SASKO and Premier Milling)
and tea (Joko, Glen and Five Roses) just to mention a few. The dilemma here
is that those products are produced by macro enterprises and sold in local
markets hence it is nearly impossible for small-scale production to compete with
giants of the core economy. Lessons can be drawn from other developing
countries where their products are produced by small enterprises and sold in
local markets. Therefore, Kasi entrepreneurs need short term support to
compete with their non-South African counterparts and long-term support to
produce their own products and sell in the local market.
23 Liedeman R, Charman A, Piper L & Petersen L. 2013. Why are foreign-run spaza shops more successful? The rapidly changing spaza sector in South Africa. (http://www.econ3x3.org/article/why-are-foreign-run-spaza-shops-more-successful-rapidly-changing-spaza-sector-south-africa

28
8.1.4 Identify niche opportunities: In 7.1.3, this report identified the need for short
and long term support needed by Kasi entrepreneurs. This section goes further
and argue that there is a lack of innovation in Mangaung’s Kasi. It is
recommended that enterprises in Mangaung Kasi identify niche opportunities
that are not already taken. These entrepreneurs need to be sensitive to the fact
that there are different levels of disposable income which results in new
opportunities. For example, craft beer Soweto Gold which was produced for the
local market and has found itself in Johannesburg’s upmarket northern suburbs
or the case of Khayelitsha’s Department of Coffee which supply cappuccinos
to local commuters at the stations. 24
8.1.4 Group/ Bulk purchasing:
The empirical data found that a majority (87%) of the participants indicated that
they obtain their products from various wholesale shops in Bloemfontein. These
shops include the following; Makro, Jambo, Cosmetics, Cambridge, Fruit and
Vegetables, Econofoods, Shoprite and the Coca Cola Company. One of the
challenges which was also highlighted was transportation because most of the
South African shop owners utilise public transport and are therefore limited to
smaller quantities.
8.1.5 Assistance from the Free State Provincial Government: The questionnaire
asked the participants what the Free State Provincial Government should do to
stimulate Mangaung’s Kasi economy. The responses from participants were
very limited or poor at best. A small group of the responses mentioned service
delivery challenges that are being faced such as access to police stations,
recreational centres for youth development, 24 hour health care services,
proper housing and access to water. The majority (55%) of the participants
either did not respond to the question or they indicated “not applicable”. While
the minority (45%) indicated the following activities: develop local infrastructure,
24 Department of Treasury.
(https://csp.treasury.gov.za/Resource%20_Centre/Conferences/Documents/CSP%20Tools/Economic%20Development/Township%20Economies%20Series%201%20Paper.pdf).

29
build shopping malls/ centres, providing quality education and training, open
Banks, internet café, employing more people.
8.1.6 Township economy strategy: DESTEA need to develop a township economy
strategy that is responsive to the needs of Kasis around the province and
should refrain from a blanket approach to revitalise Kasi economy. However,
the objectives of township economy strategy should be universal and include
the following objectives:
Create jobs in the township;
Increase the income returns from various economic activities which
should include for workers employed in those enterprises;
Enhance asset creation and better usage of existing assets to create
value; and
To improve on these approaches with the use of public employment
such as EPWP and Community Work Programme (Department: National
Treasury, n.d).
9. Recommendations
This section discusses the recommendations based on the empirical findings and
previous research conducted pertaining to this topic.
9.1 Policy/ By-laws: towards creating a parallel approach
Policy makers in South Africa have a great task at hand; dealing with the spike in
foreign-owned shops and supporting local businesses especially those in the
townships who largely operate in the in the spaza shop. It is recommended that the
national and provincial governments focus on supporting South African entrepreneurs
from exiting the informal sector and grow towards participating in the formal sector.
Regarding foreign-owned shops there is an urgent need for the Mangaung
Metropolitan Municipality to ensure that those businesses comply with municipal by-
laws and registering their employees. Therefore, there is a need to establish municipal

30
by-laws offices in the townships to regulate those businesses. Furthermore, foreign-
owned shops should be providing employees with benefits, foreign-owners should
submit Value Added Tax (VAT) and income tax returns (Liedeman, et.al., 2013).
Therefore, a parallel approach is required that would formalise larger shops whilst
permitting and encouraging informal micro and survivalist businesses to become more
successful.
9.2 Assistance with Business Model
The lessons learned from this study and previous studies conducted which has been
incorporated into this report, suggest that townships entrepreneurs need to learn from
their foreign counterparts. Lessons learned from previous studies indicate the
following:
Foreign entrepreneurs purchase their products in bulk in order to ensure that
they obtain group discounts.
In Bloemfontein, foreigners have mobilised funding in order to manufacture their
own products. Therefore, foreigners now manufacturer their products and sell
their products to other foreigners at a cheaper price.
In addition, foreigners utilises their own people in order to determine and cap
the salaries/ wages paid to employees.
The Free State Provincial Government should facilitate a dialogue between South
African owned businesses to mobilise themselves and buy products in bulk. In turn,
South African enterprises should prioritise employing South Africans, and youth in
particular.
9.3 Training and Skills development
People who live in townships need lots of motivation because of the horrible conditions
they live in. The motivational messages should stress the abilities and potentials that
each person possesses. Many township dwellers have been crushed by poverty, and
consequently, their self-esteem is very low.25 The data collected is consistent with that
of the national data. Majority of the participants do not fall under the 15-34 labour
25 Manyaka 2010; 96

31
cohort of South Africa. According to SEDA, the majority (59%) of SMME owners are
older than 40 years and this ratio remained consistent up to 2018:Q1. Statistics
indicate that majority of new businesses ventures are formed by persons aged 25-34
years. This means that the higher failure rate of new ventures actually affect the youth
of South Africa. Therefore it is imperative that the Free State Provincial Government
focuses on equipping youth in the Free State especially those in the townships with
the necessary soft and hard skills of running a successful SMMEs (SEDA, 2018).
9.4 Infrastructure development/ maintenance The Free State Provincial Government should consider investing in infrastructure
within the respective townships of Mangaung. These facilities should be equipped
specifically according to the major economic drivers of Mangaung’s Kasis. The major
economic drivers in the township economy of Mangaung Kasi include the following
sectors; retail, tourism and finance sector. However, this study encourages the Free
State Provincial Government to campaign for innovation in products and services
provided in Mangaung’s Kasis. According to the township revitalisation strategy, the
focus on cluster development, township nodes with specific value such as where
national heritage, for example can be utilised as a foundation for entrepreneurship,
are identified. It is imperative to assess what can be done by government to assist
entrepreneurs to set up businesses in these spaces. Examples of such developments
include safe parking areas, user-friendly meeting places, connectivity streetlights and
other potential support services. Furthermore, close cooperation with municipalities
across the province is required to ensure the connection between township hubs and
CBDs. It was stated that municipalities have recognised that their own plans and that
of the province need to be aligned, to ensure proper access to roads and other
networks.
9.5 Innovation required for products & services South African townships presented spaces for economic activity that does not fully
serve their residents. Townships are energetic, vibrant entrepreneurship coexist

32
despite their poverty and deprived facilities. There is no shortage of economic activity
in the Kasi streets; there are spaza shops on every corner, backyards and garages
converted into work spaces, hair-braiding and snacks available on the sidewalks. Not
to mention the volumes of end customers within these markets, needing a wide range
of products and services, which should certainly warrant investment by the public and
private sectors alike.26
9.6 Township Revitalising Strategy and Fund
The Free State Provincial Government has tasked the Department of Economic, Small
business development, Tourism and Environmental Affairs (DESTEA) to create an
environment that is enabling for economic growth in the Free State. The DESTEA
provides financial and non-financial support to businesses in the Free State. This
research recommends that the department should make specific provision for funds
towards supporting SMMEs in Mangaung’s Kasi. This fund should be guided by the
Kasi economy strategy.
10. Conclusion
This research answered the main objectives of the study. It was determined that
the retail sector is a very big sector throughout South African townships, and that
Mangaung is no exception. The retail sector is dominant in Mangaung with tuckshops
at every corner, local fast food enterprises, hair salons etc. For Kasi traders and other
entrepreneurs informality has presented certain advantages. People operating in the
Kasi are afforded the opportunity to start small, often from their homes, taking
advantage of local networks and local relationships, and with virtually no compliance
costs. For many, this is the easiest entry-point into income generating activity, and it
makes a vital contribution to their livelihoods. The second objective of the study
was to determine which sectors are thriving and its ownership and its ownership
characteristics. The research found that majority of the enterprises owners in
Mangaung are owned by persons who are not characterised as youth. Pertaining to
the South African owned shops, majority of these are persons aged 36 years and older
26 Cities Support Programme, Why is there so little economic development in South Africa townships. 2018

33
and are Africans. The third objective of the study was to determine the youth
participation within Mangaung’s Kasis. The research was able to determine the
Free State’s youth participation in Kasi. The research found that a mere 40.5% of the
businesses that participated in this study were youth. These figures are consistent with
literature that suggest that youth are not fully participating in South Africa’s economy.
The final objective of this study was to identify the available opportunities for
growth and development within the townships economy. Due to the lack of youth
participation in Kasi economy and lack of innovation in Mangaung’s Kasis’, there is
opportunity to support the priority sectors as outlined by the Free State Development
Strategy. The research concluded that the retail sector is the only sector that is
dominating in Mangaung’s Kasis. However, this does not imply that it is “thriving”, there
is opportunity for the Free State Provincial Government to revitalise the township
economy.
11. Limitations of the study
This study had one major limitation in terms of methodological approach. The report
has noted that a total of n=200 questionnaires were distributed and only n=143 were
received back from the participants. The major limitation was collecting of the data,
participants were reluctant to provide information pertaining to the nature of their
business. The lack of transparency from participants were not only from foreign-owned
businesses but also from South African owned businesses in Mangaung Kasi. The
data does not necessarily paint a holistic picture of Kasi’s in the Free State but is only
limited to Mangaung Metropolitan Municipality.
12. Direction for future research
This study has identified the need for future research to be conducted especially
focusing on how non-South African business owners conduct their businesses in small
towns of Mangaung. Furthermore, a large number of non-South African owners and
South African owners indicated that their respective businesses are not registered.
This indicates that the respective businesses do not contribute towards the GVA of
Mangaung. This research therefore recommends that the Mangaung Metropolitan

34
Municipality need to conduct a campaign advocating that all small businesses should
be registered.
35
13. References
African Institute for Community-Driven Development. 2005. The informal economy in
Mangaung, Free State, South Africa.
(http://siteresources.worldbank.org/INTLED/Resources/339650-
1144099718914/ProPoorMangaung.pdf)
African Institute for Community-Driven Development. 2005. The informal economy of
Mangaung, Free State South Africa.
(http://siteresources.worldbank.org/INTLED/Resources/339650-
1144099718914/ProPoorMangaung.pdf).
AOSIS Micro-enterprise predicament in township economic development: Evidence
from Ivory Park and Tembisa.
AOSIS Social entrepreneurship as a way of developing sustainable township
economies
Big Box. 2019. Repurposed shipping containers: at the heart of South Africa’s
informal economy. (https://www.bigboxcontainers.co.za/blog/repurposed-shipping-
containers-at-the-heart-of-south-africas-informal-economy)
Botha, M., Nieman, G. & Van Vuuren, J., 2007, ‘Measuring the effectiveness of
women entrepreneurship programme on potential, start-up and established women
entrepreneurs in South Africa’, South African Journal of Economic and Management
Sciences 10(2), 163–183.
Bridget, N.O.I. 2017. Women entrepreneurship in South Africa: Understanding the
role of competencies in business success. The South African Journal of
Entrepreneurship and Small Business Management (SAJESBM).
Bushe B. 2017. The causes and impact of business failure among small to micro and
medium enterprise in South Africa.
(https://apsdpr.org/index.php/apsdpr/article/view/210/365).
Centre for Development Support (CDS). 2010. “Trade is in our blood”: Reflections on
trends and conflicts in township trade. CDS Research Report, LED and SMME
Development, 2010(1). Bloemfontein: University of the Free State (UFS).
Cities Support Programme, Why is there so little economic development in South
Africa townships. 2018
Department of Economic, Small business development, Tourism and Environmental
Affairs. 2018.
Department of Treasury. n.d.. Township economies Series 1.
(https://csp.treasury.gov.za/Resource%20_Centre/Conferences/Documents/CSP%2

36
0Tools/Economic%20Development/Township%20Economies%20Series%201%20P
aper.pdf).
Department: National Treasury. n.d. Township Economies Series 1.
(https://csp.treasury.gov.za/Resource%20_Centre/Conferences/Documents/CSP%2
0Tools/Economic%20Development/Township%20Economies%20Series%201%20P
aper.pdf).
DESTEA. 2019. Final MEC Report on Enterprise Support. Free State: Bloemfontein.
DESTEA. SBD Disbursement of Equipment for 2018 Report. Free State:
Bloemfontein.
Financial mail. 2019. The informal market: it’s the township’s turn.
(https://www.businesslive.co.za/redzone/news-insights/2019-01-17-the-informal-
market-its-the-townships-turn/).
Gamieldien, F & van Niekerk L. 2017. Street vending in South Africa: An
entrepreneurial occupation. South African Journal of Occupational Therapy.
GEM 2016/2017 Global Report. 2017. Global Entrepreneurship Monitor.
(https://www.gemconsortium.org/report/gem-2016-2017-global-report).
Infrastructure; Dialogue Township Economies: What is the role of infrastructure in
government’s strategy to revitalise township economies; September 2017
Liedeman R, Charman A, Piper L & Petersen L. 2013. Why are foreign-run spaza
shops more successful? The rapidly changing spaza sector in South Africa.
(http://www.econ3x3.org/article/why-are-foreign-run-spaza-shops-more-successful-
rapidly-changing-spaza-sector-south-africa).
Madzivhandila T, S & Dlamini M, S. 2015. Women and Youth Enterprises in South
Africa: Assessing the Needs, Opportunities and Challenges. SAAPAM 4th Annual
Conference Proceedings. South Africa: Limpopo. Pp 605-678.
Small Enterprise Development Agency (Seda). 2018. SMME Quarterly Update 1st
Quarter 2018.
(http://www.seda.org.za/Publications/Publications/SMME%20Quarterly%202018-
Q1.pdf).
Small Enterprise Development Agency (SEDA). 2019. SMME Quarterly Update 1st
Quarter 2019.
(http://www.seda.org.za/Publications/Publications/SMME%20Quarterly%202019-
Q1.pdf).
SME South Africa. 2017. What All The Entrepreneurship Stats Tell Us About The
Reality Of Being A Female Entrepreneur In SA.
(https://smesouthafrica.co.za/17480/women-entrepreneurs-report-survey/).
Statistics SA. 2019. Quarterly Labour Force Survey Quarter 3: 2019.
(http://www.statssa.gov.za/publications/P0211/P02113rdQuarter2019.pdf).

37
The Presidency Republic of South Africa. 2015. National Youth Policy 2015 – 2020.
(file:///C:/Users/Krugerb/Downloads/NYP%20Policy%202020%20Report%20(2).pdf).
Township economic development & integration. Mahmood Sonday. 2015
Township Economies, what’s the role of infrastructure in government’s strategy to
revitalise township economies. Infrastructure dialogues. 2015
Township Economy, the missed opportunity: SMME in South Africa. 2019
Training for township Renewal Initiative. THE PLACE OF TOWNSHIP
TRANSFORMATION WITHIN SOUTH AFRICAN POLICY AND STRATEGIES,
October 2007
Training for township Renewal Initiative. Townships in the South African Geographic
Landscape – Physical and Social Legacies and Challenges, October 2007
Tshepo 1Million Kasi Unltd/ Township Marketplace Platform and GPG SMME
Clearing house.
Who Owns Whom. 2020. The Minibus Taxi, Bus Service and Metered Taxi Industry.
Siccode 71211 & 71221. South Africa: Johannesburg.