Embed Size (px)
Citation preview

Research report ICL-UT-1301
Multi-criteria checkpointing strategies: optimizing
response-time versus resource utilization
Aurelien Bouteiller1, Franck Cappello2, Jack Dongarra1,Amina Guermouche3, Thomas Herault1 and Yves Robert1,4
1. University of Tennessee Knoxville, USA2. University of Illinois at Urbana Champaign, USA & INRIA, France
3. Univ. Versailles St Quentin, France4. Ecole Normale Superieure de Lyon, France
{bouteill|dongarra|herault|yrobert1}@eecs.utk.edu
[email protected], [email protected]
February 27, 2013
Abstract
Failures are increasingly threatening the efficiency of HPC systems,and current projections of Exascale platforms indicate that rollback recov-ery, the most convenient method for providing fault tolerance to general-purpose applications, reaches its own limits at such scales. One of thereasons explaining this unnerving situation comes from the focus that hasbeen given to per-application completion time, rather than to platformefficiency. In this paper, we discuss the case of uncoordinated rollbackrecovery where the idle time spent waiting recovering processors is usedto progress a different, independent application from the system batchqueue. We then propose an extended model of uncoordinated checkpoint-ing that can discriminate between idle time and wasted computation.We instantiate this model in a simulator to demonstrate that, with thisstrategy, uncoordinated checkpointing per application completion time isunchanged, while it delivers near-perfect platform efficiency.
1 Introduction
The progress of many fields of research, in chemistry, biology, medicine, aerospaceand general engineering, is heavily dependent on the availability of ever increas-ing computational capabilities. The High Performance Computing (HPC) com-munity strives to fulfill these expectations, and in recent years, has embracedparallel systems to increase computational capabilities. Although there is no
1
alternative technology in sight, the core logic of delivering more performancethrough ever larger systems bears its own issues, and most notably declining re-siliency. In the projections issued by the International Exascale Software Project(IESP) [10], even if individual components are expected to enjoy significant im-provements in reliability, their number alone will drive the system Mean TimeBetween Failures (MTBF) to plummet, entering a regime where failures are notuncommon events, but a normal part of application life [13].
Many approaches have been investigated, over the years, to resolve theformidable threat that process failures pose to both productivity and efficiencyof HPC applications. The most common approach has been the use of roll-back recovery, based on periodic, complete application checkpoint, and com-plete restart upon failure. While this scheme has been successful in the past,it appears that coordinated checkpoint/restart will suffer from unacceptableI/O overhead at the scale envisioned for future systems, leading to poor overallefficiency barely competing with replication [12].
Other options are available to design fault tolerant applications, such as Al-gorithm Based Fault Tolerance [17], or Naturally Fault Tolerant Methods [8].However, unlike checkpoint/restart, which can be provided automatically (with-out modifications to the application), these techniques are application-specific,because thet rely on intrinsic algorithmic properties. In addition, they oftenrequire excruciating software engineering efforts, resulting in generally low ap-plicability to production codes.
In recent years, an alternative automatic rollback recovery technique, namelyuncoordinated checkpoints with message logging, has received a lot of atten-tion [4, 14]. The key idea of this approach is to avoid the rollback of processesthat have not been struck by failures, thereby reducing the amount of lost com-putation that has to be re-executed, and possibly permitting overlap betweenrecovery and regular application progress. Unfortunately, under the reasonablehypothesis of tightly coupled applications (the most common type, whose com-plexity often compels automatic fault tolerance), processes that do not undergorollback have to wait for restarted processes to catchup before they can resumetheir own progression, thereby spending as much time idling than they wouldhave spent re-executing work in a coordinated approach.
In this paper, we propose to consider the realistic case of an HPC system witha queue of independent parallel jobs (typically submitted by different users). Inaddition to per-application completion time, which is strongly challenged bynumerous failures, the goal of such a system is to complete as much usefulcomputations as possible, while still retaining reasonable per-application com-pletion time. The proposed application deployment scheme addressed in thispaper makes use of automatic, uncoordinated checkpoint/restart, and overlapsidling time suffered by recovering applications by progress made on other ap-plications loaded on the resources, meanwhile uncoordinated rollback recoveryis taking place on the limited subset of the resources that needs to re-executework after a failure. Based on this strategy, we extend the model proposedin [1] to make a distinction between wasted computation and processor idletime. The waste incurred by the individual application, and the total waste
2

of the platform, are both expressed with the model, and we investigate thetradeoffs between optimizing for application efficiency or for platform efficiency.
The rest of this paper is organized as follows: Section 2 gives an informalstatement of the problem. Section 3 presents the model and the scenarios usedto analyze the behavior of the application-centric and platform-centric scenar-ios. The waste incurred for these scenarios is computed in Section 4. Section 5is devoted to a comprehensive set of simulations on relevant platform and ap-plication case studies. Section 6 provides an overview of related work. Finallywe give some concluding remarks and hints for future work in Section 7.
2 Uncoordinated Checkpointing Strategy to Max-imize Platform Efficiency
Rollback recovery protocols employ checkpoints to periodically save the stateof a parallel application, so that when a failure strikes some process, the appli-cation can be restored into one of its former states. The closer the checkpointdate is from the failure date, the smaller the amount of lost computation tobe re-executed. However, checkpointing is an expensive operation, and incursoverhead of its own, leading the best checkpoint frequency to be a compromisebetween minimizing the average lost computation per failure, and limiting theamount of computing power wasted on checkpoints. Young [21] and more re-cently Daly [9] proposed first-order formulas to compute the optimal checkpointfrequency based on the machine MTBF and checkpoint cost.
In a parallel application, the recovery line is the state of the entire applica-tion after some processes have been restarted from a checkpoint. Unfortunately,not all recovery lines are consistent; in particular, recovery lines that separatethe emission and matching reception event of a message are problematic [7].Two main families of rollback recovery techniques have been designed to resolvethe issues posed by these messages crossing the recovery line: coordinated check-point, and uncoordinated checkpoint with message logging. In the coordinatedcheckpoint approach, a collection of checkpoints is constructed in a way thatensures that consistency threatening messages do not exist between checkpointsof the collection (using a coordination algorithm). As the checkpoint collec-tion forms the only recovery line that is guaranteed to be correct, all processeshave to rollback simultaneously, even if they are not faulty. As a result, thebulk amount of lost work is increased and not optimal for a given number offailures. The non-coordinated checkpoint approach avoids duplicating the workcompleted by non-faulty processes. Checkpoints are taken at random dates,and only failed processes endure rollback. Obviously, the resulting recovery lineis not guaranteed to be correct without the addition of supplementary stateelements to resolve the issues posed by crossing messages. Typically, messagelogging and event logging [11] store the necessary state elements during the ex-ecution of the application. When a process has to rollback to a checkpoint, itundergoes a managed, isolated re-execution, where all non-deterministic event
3

outcomes are forced according to the event log, and messages from the past areserved from the message log without rollback of the original sender.
In the case of typical HPC applications, which are often tightly coupled, theability of restarting only faulty process (hence limiting duplicate computationto a minimum) does not translate into great improvements of the applicationcompletion time [1]. Despite being spared the overhead of executing duplicatework, surviving processes quickly reach a synchronization point where furtherprogress depends on input from rollback processes. Since the recovered pro-cesses have a significant amount of duplicate work to re-execute before they cancatchup with the general progress of the application, surviving process spendsignificant amount of time idling; altogether, the overall application completiontime is only marginally improved. However, this conclusion is the result of fo-cusing on the performance of a single application performance. It is clear that,given the availability of several independent jobs, idle time can be used to per-form other useful computations, thereby diminishing the wasted time incurredby the whole platform.
In this paper, we propose a scheduling strategy that complements uncoor-dinated rollback recovery, in order to decrease the waste of computing powerduring recovery periods. When a failure occurs, a set of spare processes are usedto execute the duplicate work of processes that have to rollback to a checkpoint.However, unlike regular uncoordinated checkpoint, instead of remaining activeand idling, the remainder of the application is stopped and flushed from memoryto disk. The resulting free resources are used to progress an independent appli-cation. When the processes reloaded from checkpoint have completed sufficientduplicate work, the supplementary application can be stopped (and its progresssaved with a checkpoint); the initial application can then be reloaded and its ex-ecution resumes normally. In the next section, we propose an analytical modelfor this strategy that permits to compute the supplementary execution timefor the initial application, together with the total waste of computing powerendured by the platform. We then use the model to investigate the appropriatecheckpoint period, and to predict adequate strategies that deliver low platformwaste while preserving application completion time.
3 Model
In this section, we introduce all model parameters, and we detail the executionscenarios: Application-oriented uses the whole platform for a single appli-cation, while Platform-oriented uses a fraction of the resources as spareresources that recover and re-execute work upon failures, while the rest of theresources loads, executes and stores another application.
3.1 Model parameters
All relevant parameters are summarized in Table 1. We give a few words ofexplanation form each of them. More details can be found in [1]:
4

Table 1: Key model parameters.
µp Platform MTBFG or G+ 1 Number of groupsT Length of periodW Work done every periodC Checkpoint timeD DowntimeR Restart (from checkpoint) timeα Slow-down execution factor when checkpointingλ Slow-down execution factor due to message loggingβ Increase rate of checkpoint size per work unit
• µp is the MTBF of the platform, meaning that failures strike every µpseconds in average. We have µp = µind
ptotal, where µind is the MTBF of
individual processors, and ptotal is the total number of processors. Ourapproach is agnostic of the granularity of the processor, which can beeither a single CPU, or a multi-core processor, or any relevant computingentity
• The platform is partitioned into processor groups. We have G+1 processorgroups, each of size q (hence (G+ 1)q = ptotal). One of these groups willbe used as spare group in the Platform-oriented scenario, while allG + 1 participate to execution in the Application-oriented scenario(see Section 3.2 below). We use a hierarchical protocol with message-logging in both cases.
• Checkpoints are taken periodically, every T seconds. All groups checkpointconcurrently, in time C. Hence, every period of length T , we performsome useful work W and take a checkpoint of duration C. Without lossof generality, we express W and T with the same unit: an unit of workexecuted at full speed takes one second. However, there are two factorsthat slow-down execution:
– During checkpointing, which lasts C seconds, we account for a slow-down due to I/O operations, and only αC units of work are executed,where 0 ≤ α ≤ 1. The case α = 0 corresponds to a fully blockingcheckpoint, while α = 1 corresponds to a fully overlapped checkpoint,and all intermediate situations can be represented;
– Throughout the period, we account for a slow-down factor λ dueto the extra-communications induced by message logging. A typicalvalue is λ = 0.98 [2, 14];
– Altogether, the amount of work W that is executed every period oflength T is
W = λ((T − C) + αC) = λ(T − (1− α)C) (1)
5

• In addition to the durations of the checkpoint C, we use D for the down-time and R for the time to restart from a checkpoint. We assume thatD ≤ C to avoid clumsy expressions, and because it is always the case inpractice. However, we can easily extend the analysis to the case whereD > C.
• Message logging has both a positive impact and a negative impact onperformance:
– On the positive side, message logging reduces the re-execution timeafter a failure, because inter-group messages are stored in memoryand directly accessible during the recovery. Our model accounts forthis by introducing a speed-up factor ρ during the re-execution. Typ-ical values for ρ lie in the interval [1; 2], meaning that re-executiontime can be reduced up to a half for some applications [5].
– On the negative side (in addition to execution slow-down by thefactor λ), message-logging increases the size of checkpoints. Becauseinter-group messages are logged, the size of the checkpoint increaseswith the amount of work per unit. To account for this increase, wewrite the equation
C = C0(1 + βW ) (2)
The parameter C0 is the time needed to write this application foot-print onto stable storage, without message-logging. The parameterβ quantifies the increase in the checkpoint time resulting from theincrease of the log size per work unit (which is itself strongly tied tothe communication to computation ratio of the application). Typicalvalues of β are given in the examples of Section 5.
• Combining Equations (1) and (2), we derive the final value of the check-point time
C =C0(1 + βλT )
1 + C0βλ(1− α)(3)
We point out that the same application is deployed on G groups insteadof G + 1 in the Platform-oriented scenario. As a consequence, whenprocessor local storage is available, C0 is increased by G+1
G in Platform-oriented, compared to the Application-oriented case.
3.2 Scenarios
In this section, we introduce some notations for both execution scenarios. Theobjective is to compare the overhead incurred for each of them. We define thewaste as the fraction of time where resources are not used to perform useful work,and we aim at comparing the value of the minimum waste for each scenario.This minimum waste will be achieved for some optimal value of the period,which will likely differ for each scenario.
6

Scenario Application-oriented. One single application executes on the en-tire platform, using all G+1 groups. Resilience is provided through the standarduncoordinated hierarchical protocol. We let Wasteapp(T ) denote the waste in-duced by this scenario, and T optapp the value of T that minimizes it.
Scenario Platform-oriented. One main application executes on G groupsand uses the spare group in case of failure. During the downtime, restart andre-execution, another application is loaded, if time permits. The utilization rateof the platform is higher this way, but at the price of using a spare group. Weuse the notations Wasteplat(T ) for the waste, and T optplat for the value of T thatminimizes it.
The major objective of this paper is to compare the minimum waste result-ing from each scenario. Intuitively, the period T optapp (single application) will be
smaller than the period T optplat (platform-oriented) because the loss due to a fail-ure is higher in the former scenario. In the latter scenario, we lose a constantamount of time (due to switching applications) instead of losing an average ofhalf the checkpointing period in the first scenario. We then aim at compar-ing the four values Wasteapp(T
optapp), Wasteapp(T
optplat), Wasteplat(T
optplat), and
Wasteplat(Toptapp), the later two values characterizing the tradeoff when using
the optimal period of a scenario for the other one.
4 Computing the waste
In this section, we show how to compute the waste for both scenarios. We startwith the generic approach to compute the waste, which we specialize later foreach scenario.
4.1 Generic approach
Let Tbase be the parallel execution time without any overhead (no checkpoint,failure-free execution). The first source of overhead comes the rollback-and-recovery protocol. Every period of length T , we perform some useful work W(whose value is given by Equation (1)) and take a checkpoint. Checkpointinginduces an overhead, even if there is no failure, because not all the time is spentcomputing: the fraction of useful time is W
T ≤ 1. The failure-free execution
time Tff is thus given by the equation WT Tff = Tbase, which we rewrite as
(1−Wasteff )Tff = Tbase, where Wasteff =T −WT
(4)
Here Wasteff denotes the waste due to checkpointing and message loggingin a failure-free environment. Now, we compute the overhead due to failures.Failures strike every µp units of time in average, and for each of them, we lose
7
an amount of time tlost. The final execution time Tfinal is thus given by theequation (1− tlost
µp)Tfinal = Tff which we rewrite as
(1−Wastefail)Tfinal = Tff , where Wastefail =tlostµp
(5)
Here Wastefail denotes the waste due to failures. Combining Equations (4)and (5), we derive that
(1−Wastefinal)Tfinal = Tbase (6)
Wastefinal = Wasteff + Wastefail −WasteffWastefail (7)
Here Wastefinal denotes the total waste during the execution, which we aimat minimizing by finding the optimal value of the checkpointing period T . Inthe following, we compute the values of Wastefinal for each scenario.
(a)
∆ = T + tlost
αC CT − CRDFT−C
P3
P2
P1
P0
Work Checkpointing Work with Checkpointing slowdown
Re-executing slowed-down workRestartDowntime
T
Time
(b)
CT − CαCRDFC
∆ = T + tlost
T − C
T
P3
P2
P1
P0
Work Checkpointing Work with Checkpointing slowdown
Re-executing slowed-down workRestartDowntimeTime
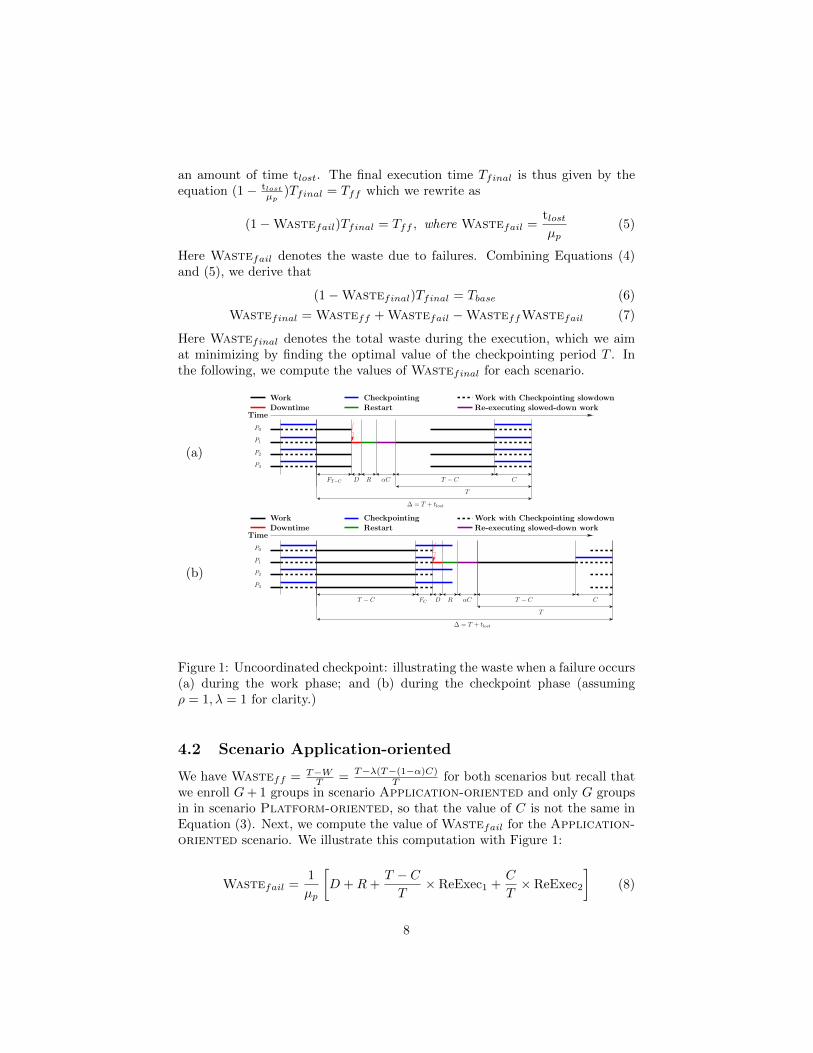
Figure 1: Uncoordinated checkpoint: illustrating the waste when a failure occurs(a) during the work phase; and (b) during the checkpoint phase (assumingρ = 1, λ = 1 for clarity.)
4.2 Scenario Application-oriented
We have Wasteff = T−WT = T−λ(T−(1−α)C)
T for both scenarios but recall thatwe enroll G+ 1 groups in scenario Application-oriented and only G groupsin in scenario Platform-oriented, so that the value of C is not the same inEquation (3). Next, we compute the value of Wastefail for the Application-oriented scenario. We illustrate this computation with Figure 1:
Wastefail =1
µp
[D +R+
T − CT
× ReExec1 +C
T× ReExec2
](8)
8

where
ReExec1 =1
ρ
(αC +
T − C2
)ReExec2 =
1
ρ
(αC + T − C +
C
2
)First, D + R is the duration of the downtime and restart. Then we add
the time needed to re-execute the work that had already completed during theperiod, and that has been lost due to the failure. Assume first that the failurestrikes during work interval (T −C), see Figure 1(a): we need to re-execute thework done in parallel with the last checkpoint (of duration C). This takes a timeαC since no checkpoint activity is taking place during that replay. Then we re-execute the work done in the work-only area. On average, the failure happensin the middle of the interval of length T − C, hence the time lost has expectedvalue T−C
2 . We derive the value of ReExec1 by accounting for the speedup inre-execution (parameter ρ). This value is weighted by the probability (T−C)/Tof the failure striking within the work interval. We derive the value of ReExec2with a similar reasoning ( see Figure 1(b)), and weight it by the probabilityC/T of the failure striking within the checkpoint interval. After simplification,we derive
Wastefail =1
µp
(D +R+
1
ρ
(T
2+ αC
))(9)
4.3 Scenario Platform-oriented
In this scenario, the first G groups are computing for the current application andare called regular groups. The last group is the spare group. As already pointedout, this leads to modifying the value of C, and hence the value of Wasteff . Inaddition, we also have to modify the value of Tbase, which becomes G+1
G Tbase, toaccount for the fact that it takes more time to produce the same work with fewerprocessors. We need to recompute Wastefinal accordingly so that Equation (6)still holds and we derive:
(1−Wastefinal)Tfinal =G+ 1
GTbase (10)
Wastefinal =1
G+ 1+
G
G+ 1
(Wasteff + Wastefail −WasteffWastefail
)(11)
We now proceed to the computation of Wastefail, which is intricate. SeeFigure 2 for an illustration:
• Assume that a fault occurs within group g. Let t1 be the time elapsedsince the completion of the last checkpoint. At that point, the amount ofwork that is lost and should be re-executed is W1 = αC + t1. Then:
1. The faulty group (number g) is down during D seconds;
9
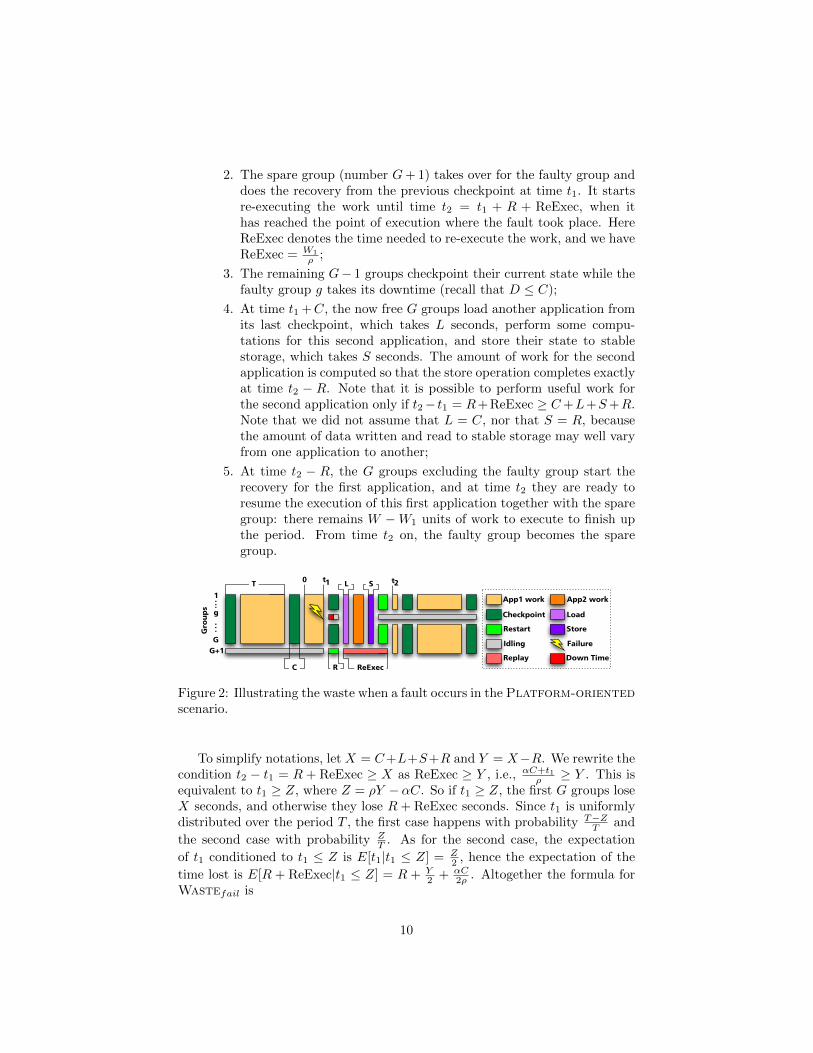
2. The spare group (number G+ 1) takes over for the faulty group anddoes the recovery from the previous checkpoint at time t1. It startsre-executing the work until time t2 = t1 + R + ReExec, when ithas reached the point of execution where the fault took place. HereReExec denotes the time needed to re-execute the work, and we haveReExec = W1
ρ ;
3. The remaining G− 1 groups checkpoint their current state while thefaulty group g takes its downtime (recall that D ≤ C);
4. At time t1 +C, the now free G groups load another application fromits last checkpoint, which takes L seconds, perform some compu-tations for this second application, and store their state to stablestorage, which takes S seconds. The amount of work for the secondapplication is computed so that the store operation completes exactlyat time t2 − R. Note that it is possible to perform useful work forthe second application only if t2− t1 = R+ReExec ≥ C+L+S+R.Note that we did not assume that L = C, nor that S = R, becausethe amount of data written and read to stable storage may well varyfrom one application to another;
5. At time t2 − R, the G groups excluding the faulty group start therecovery for the first application, and at time t2 they are ready toresume the execution of this first application together with the sparegroup: there remains W −W1 units of work to execute to finish upthe period. From time t2 on, the faulty group becomes the sparegroup.
App1 work
Checkpoint Load
Store
App2 work
Restart
Down TimeReplay
Idling Failure
T
C R
L S
ReExec
Gro
up
s
g
GG+1
.
.1
...
.
0 t t1 2
Figure 2: Illustrating the waste when a fault occurs in the Platform-orientedscenario.
To simplify notations, let X = C+L+S+R and Y = X−R. We rewrite thecondition t2 − t1 = R + ReExec ≥ X as ReExec ≥ Y , i.e., αC+t1
ρ ≥ Y . This isequivalent to t1 ≥ Z, where Z = ρY − αC. So if t1 ≥ Z, the first G groups loseX seconds, and otherwise they lose R + ReExec seconds. Since t1 is uniformlydistributed over the period T , the first case happens with probability T−Z
T and
the second case with probability ZT . As for the second case, the expectation
of t1 conditioned to t1 ≤ Z is E[t1|t1 ≤ Z] = Z2 , hence the expectation of the
time lost is E[R + ReExec|t1 ≤ Z] = R + Y2 + αC
2ρ . Altogether the formula forWastefail is
10

0
0.2
0.4
0.6
0.8
1
1 2 4 8 16 32 64 100
Was
te
MTBF of a single node (in years)
Application (Topt obtained by model)Application (Topt obtained by sampling)
Platform (Topt obtained by model)Platform (Topt obtained by sampling)
0
0.2
0.4
0.6
0.8
1
1000 2000 3000 4000 5000 6000 7000 8000 9000
Was
te
Checkpoint Interval (T) (in seconds)
ToptApp Topt
Plat
ApplicationPlatform
Figure 3: Waste as function of thecompute node MTBF, consideringa matrix multiplication, on the K-Computer model.
Figure 4: Waste as function of thecheckpoint period, considering a 2D-stencil operation, on the Fat ExascaleComputer model (20 years individualprocessor MTBF.)
Wastefail =1
µp
(T − ZT
×X +Z
T× (R+
Y
2+αC
2ρ)
)(12)
and is explained as follows:
• if the failure strikes during the first Z units of the period, which happenswith probability Z
T , there is not enough time to load the second applica-tion, and the regular groups all waste E[R + ReExec|t1 ≤ Z] seconds inaverage
• if the failure strikes during the last T − Z units of the period, whichhappens with probability T−Z
T , then the regular groups all wasteX units oftime, and they perform some useful computation for the second applicationin the remaining time that they have before the spare group catches up.
5 Experiments
We instantiated the proposed waste model with different scenarios. We firstdetail two scenarios that illustrate the benefits of the proposed approach. Thenwe provide comprehensive results for a wider set of experiments, whose resultsare similar.
The first scenario shown in Fig. 3, considers a model of the K-Computer([18]), and a matrix-matrix multiply operation, assuming that the whole ma-chine (less a group) is used and the problem size occupies the whole machinememory. Using the waste model, we computed the optimal checkpoint time, andsimulated the waste as a function of the node MTBF using an in-house simulatoradapted from [1], from the system perspective (green lines) and from the appli-cation perspective (red lines). We also sampled other checkpoint interval times,to take into account multiple failure scenarios: although mathematical limita-tions prevent us to compute a close formula for the waste in case of overlappingfailures, the simulator is not limited, and take into account all scenarios. Note,
11

however, that the model is still required, to provide a basis for the checkpointinterval, and that this interval provides a good approximation of the best, as isshown in the figure.
This figure demonstrates the huge benefit, from the application perspective,of introducing a spare node: indeed, when the application waste, due to I/Ocongestion at checkpoint time, starts from a relatively high level when the com-ponent MTBF is very low (and thus when the machine usability is low), thesystem waste itself is at significantly low levels.
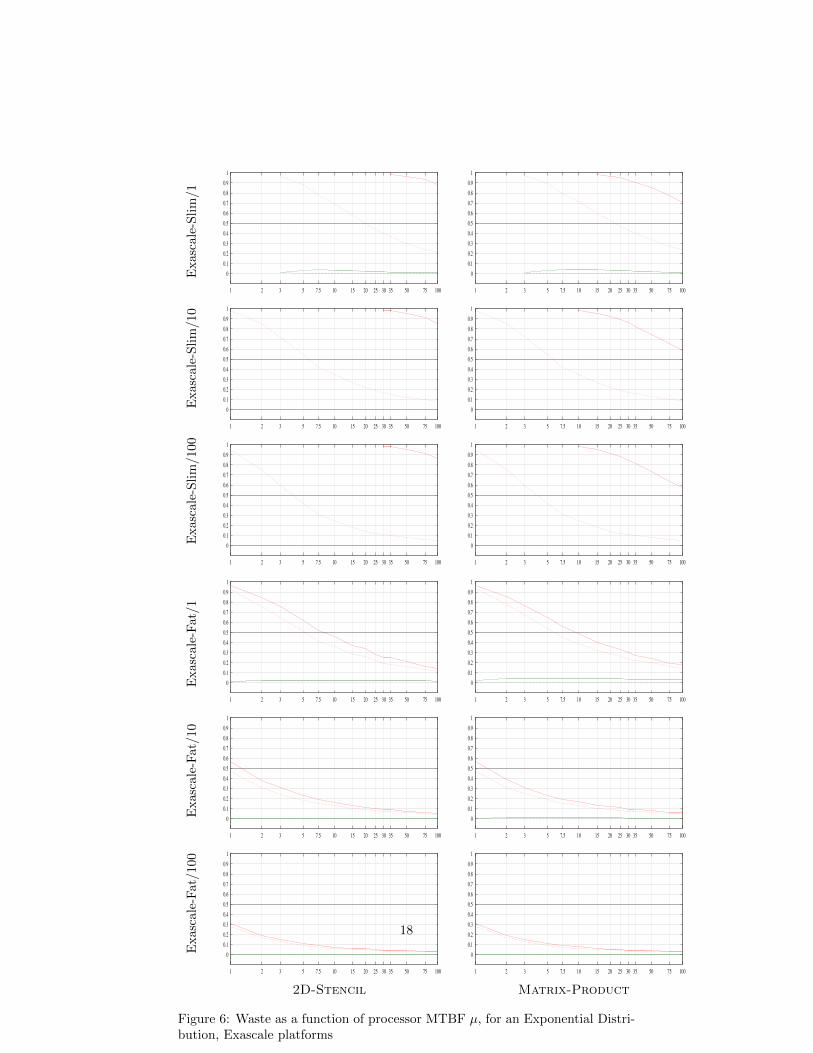
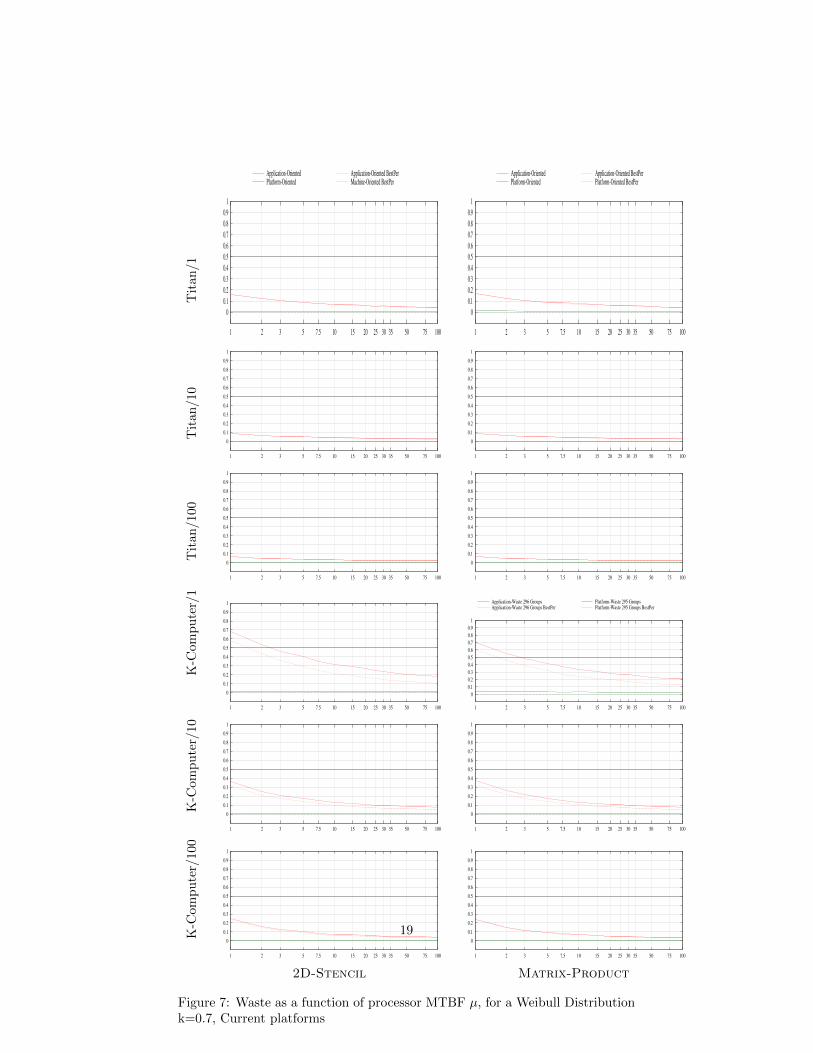
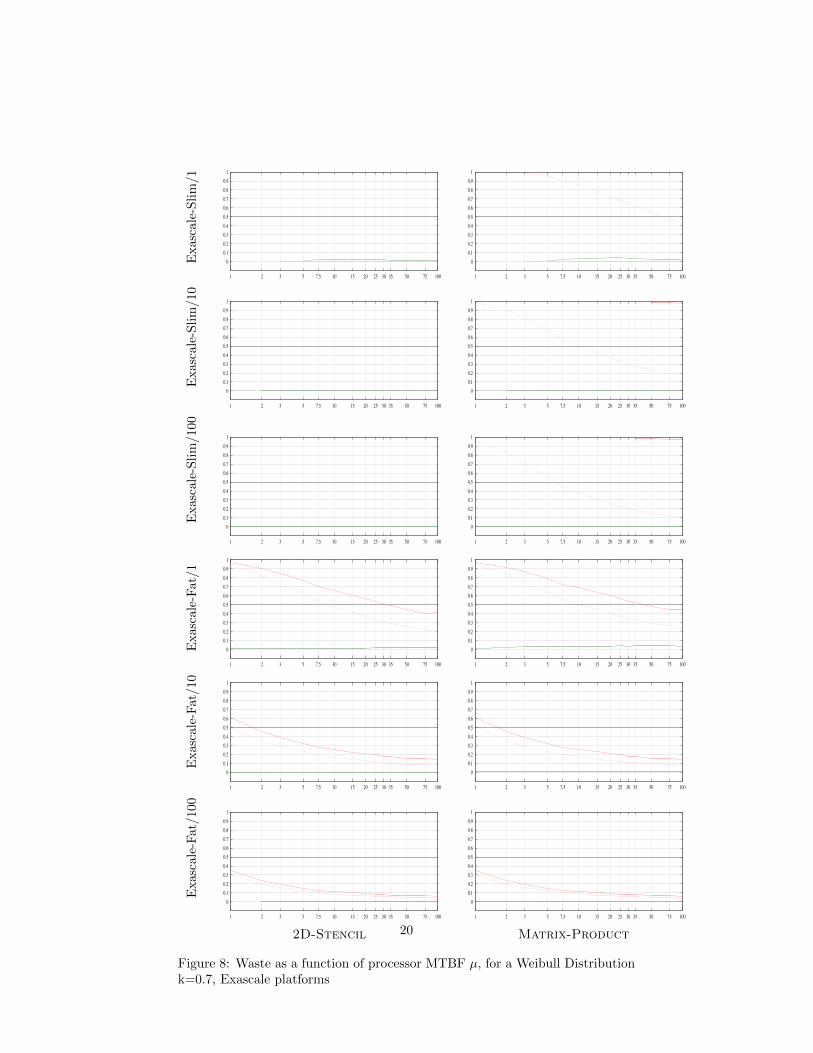
The second scenario is illustrated in Figure 4: here, we fix the MTBF ofa single component to 20 years, and study the impact of choosing the optimalcheckpoint interval targeting the system efficiency, or the application efficiency.To do so, we varied that checkpoint interval between the Application optimal,and the System optimal, as given by the model. To illustrate the diversity of ex-periments we conducted, the modeled system is one of the envisioned machinesfor exascale systems (the “Fat” version, featuring heavy multicore nodes), andthe modeled application is a 2D-Stencil application that fills the systems mem-ory. As evaluated in [1], rollback/recovery protocols will be efficient in such amachine, only if there is a 10 fold increase in performance (or more) of check-pointing techniques, so we place ourself in this scenario. Figures 5, 6, 7, and8present an exhaustive study on different sets of machines, applications andcheckpoint performance models, and they conclude to the same general behav-ior: system’s optimal checkpoint intervals are much higher than application’soptimal checkpoint intervals of the same scenario, and both system and appli-cation exhibit a waste that increases when taking a checkpoint interval far awayfrom their optimal. However, because the spare node is so much more beneficialto the general efficiency of the system than to the efficiency of the application, itis extremely beneficial to select the optimal application checkpoint interval: theperformance of the system remains close to an efficiency of 1, while the wasteof the application can be reduced significantly.
As a side note, one can also see that although replication (with a top effi-ciency of 50%) could be considered to improve the efficiency of the applications,in the scenarios where rollback-recovery can be less efficient than replication, ahierarchical checkpointing technique with dedicated spare node, as the one wepropose here, is the only one that can provide a waste for the system close to 0.
As already mentioned, results with other platforms, applications and failuredistributions exhibit similar behavior, as shown in Figures 5, 6, 7, and 8. In thesefigures, Platform/X corresponds to experiments on the corresponding Platform,where the checkpoint time C0 is divided by X, where X = {1, 10, 100}. Notethat C0 is the time to write the memory footprint of one application group ontostable storage; detailed information on the platform parameters are availablein [1]. Dividing by the factor X allows up to investigate whether, and up towhat extent, faster checkpointing can prove useful, or necessary, at very largescale.
12

6 Related work
Fault tolerance and rollback recovery has been a very active field of research [11].Recent optimizations and experimental studies outline that compelling perfor-mance can be obtained from uncoordinated checkpointing [4, 14], and havecharacterized with more precision the typical range of values for fixed overheads(such as the slowdown imposed by checkpointing, message logging, and messagelog growth rate). In some recent work, we have proposed a general model captur-ing the intricacies of these advanced rollback recovery techniques [1]. However,the model considered only the impact on application efficiency, and thereforelet one of the key advantages of uncoordinated recovery unaccounted for, in the(reasonable) hypothesis of tightly coupled applications.
Another interesting development designed to take advantage of the idlingtime left on surviving processors with uncoordinated rollback recovery is parallelre-execution of the lost workload. Upon restart, the workload initially executedby the failed processes is split and dispatched across all computing resources [6].In this work, the workload can be easily divided as the program is writtenwith Charm++. In practice, however, the deployment of such techniques forproduction MPI codes written in legacy Fortran/C is difficult, as it requires afull rewrite of the application to account for the different data and computationdistribution during recovery periods (some works propose to partially automatethis with compilation techniques [20]). Even when such splitting is practical,the resulting scalability is challenged, as the workload to be re-executed aftera partial rollback is (hopefully) orders of magnitude smaller than the initialapplication workload, which, in accordance with Gustafson law [15], typicallyresults in poor parallel efficiency at scale.
Overlapping downtime of programs blocked on I/O or memory accesses isan idea that has been investigated in many contexts, and has resulted in avariety of hardware and software techniques to improve throughput (Hyper-threads [19], massive oversubscription in task based systems [16], etc.) . Inter-estingly, checkpoint-restart can be used as a tool designed to improve overlap ofcomputation and computation with co-scheduling [3]. However, it has seldombeen considered to overcome the cost of rollback recovery itself, and modelingtools to assess the effectiveness of compensation techniques have not been avail-able yet, to the best of our knowledge. The model proposed here permits tocharacterize the difference in terms of platform efficiency when multiple inde-pendent applications must be completed.
7 Conclusion
In this paper, we have proposed a deployment strategy that permits to overlapthe idle time created by recovery periods in uncoordinated rollback recovery withuseful work from another application. We recall that this opportunity is uniqueto uncoordinated rollback recovery, since coordinated checkpointing requiresthe rollback of all processors, hence generates a similar re-execution time, but
13

without idle time. We designed an accurate analytical model that captures thewaste resulting from failures and protection actions, both in term of applicationruntime and in term of resource usage. The model results are compatible withexperimentally observed behavior, and simplifications to express the model asa closed formula introduce only a minimal imprecision, that we have quantifiedthrough simulations.
The model has been used to investigate the effective benefit of the uncoor-dinated checkpointing strategy to improve platform efficiency, even in the moststringent assumptions of tightly coupled applications. Indeed, the efficiencyof the platform can be greatly improved, even when using the checkpointingperiod that is the most amenable to minimizing application runtime. Finally,although replication (with a top efficiency of 50%) sometime delivers betterper-application efficiency, we point out that a hierarchical checkpointing tech-nique with dedicated spare nodes, as the one proposed in this paper, is the onlyapproach that can provide a global platform waste close to zero.
Acknowledgments. Y. Robert is with the Institut Universitaire de France. Thiswork was supported in part by the ANR Rescue project.
References
[1] Georges Bosilca, Aurelien Bouteiller, Elisabeth Brunet, Franck Cap-pello, Jack Dongarra, Amina Guermouche, Thomas Herault, Yves Robert,Frederic Vivien, and Dounia Zaidouni. Unified model for assessing check-pointing protocols at extreme-scale. Research report RR-7950, INRIA,2012.
[2] Aurelien Bouteiller, George Bosilca, and Jack Dongarra. Redesigning themessage logging model for high performance. Concurrency and Computa-tion: Practice and Experience, 22(16):2196–2211, 2010.
[3] Aurelien Bouteiller, Hinde-Lilia Bouziane, Thomas Herault, PierreLemarinier, and Franck Cappello. Hybrid preemptive scheduling of mes-sage passing interface applications on grids. International Journal of HighPerformance Computing Applications, 20(1):77–90, 2006.
[4] Aurelien Bouteiller, Thomas Herault, George Bosilca, and Jack J. Don-garra. Correlated set coordination in fault tolerant message logging pro-tocols. In Proc. of Euro-Par’11 (II), volume 6853 of LNCS, pages 51–64.Springer, 2011.
[5] Aurelien Bouteiller, Thomas Herault, Geraud Krawezik, Pierre Lemarinier,and Franck Cappello. MPICH-V: a multiprotocol fault tolerant MPI. IJH-PCA, 20(3):319–333, 2006.
14
[6] Sayantan Chakravorty and L.V. Kale. A fault tolerance protocol with fastfault recovery. In Parallel and Distributed Processing Symposium, 2007.IPDPS 2007. IEEE International, pages 1 –10, march 2007.
[7] K. M. Chandy and L. Lamport. Distributed snapshots : Determiningglobal states of distributed systems. In Transactions on Computer Systems,volume 3(1), pages 63–75. ACM, February 1985.
[8] Zizhong Chen, Graham E. Fagg, Edgar Gabriel, Julien Langou, TharaAngskun, George Bosilca, and Jack Dongarra. Fault tolerant high perfor-mance computing by a coding approach. In Proc. 10th ACM SIGPLANsymp. on Principles and practice of parallel programming, PPoPP ’05, pages213–223, New York, NY, USA, 2005. ACM.
[9] J. T. Daly. A higher order estimate of the optimum checkpoint interval forrestart dumps. FGCS, 22(3):303–312, 2004.
[10] Jack Dongarra, Pete Beckman, Patrick Aerts, Frank Cappello, ThomasLippert, Satoshi Matsuoka, Paul Messina, Terry Moore, Rick Stevens, AnneTrefethen, and Mateo Valero. The international exascale software project:a call to cooperative action by the global high-performance community. Int.J. High Perform. Comput. Appl., 23(4):309–322, 2009.
[11] E. N. (Mootaz) Elnozahy, Lorenzo Alvisi, Yi-Min Wang, and David B.Johnson. A survey of rollback-recovery protocols in message-passing sys-tems. ACM Survey, 34:375–408, 2002.
[12] K. Ferreira, J. Stearley, J. H. III Laros, R. Oldfield, K. Pedretti,R. Brightwell, R. Riesen, P. G. Bridges, and D. Arnold. Evaluating theViability of Process Replication Reliability for Exascale Systems. In Pro-ceedings of the 2011 ACM/IEEE Conf. on Supercomputing, 2011.
[13] G. Gibson. Failure tolerance in petascale computers. In Journal of Physics:Conference Series, volume 78, page 012022, 2007.
[14] A. Guermouche, T. Ropars, M. Snir, and F. Cappello. Hydee: Failurecontainment without event logging for large scale send-deterministic mpiapplications. In Parallel Distributed Processing Symposium (IPDPS), 2012IEEE 26th International, pages 1216 –1227, may 2012.
[15] John L. Gustafson. Reevaluating amdahl’s law. Communications of theACM, 31:532–533, 1988.
[16] Chao Huang, Gengbin Zheng, Laxmikant Kale, and Sameer Kumar. Perfor-mance evaluation of adaptive mpi. In Proc. 11th ACM SIGPLAN sympo-sium on Principles and practice of parallel programming, PPoPP ’06, pages12–21, New York, NY, USA, 2006. ACM.
[17] K.H. Huang and J.A. Abraham. Algorithm-based fault tolerance for matrixoperations. IEEE Transactions on Computers, 100(6):518–528, 1984.
15

[18] Hiroyuki Miyazaki, Yoshihiro Kusano, Hiroshi Okano, Tatsumi Nakada,Ken Seki, Toshiyuki Shimizu, Naoki Shinjo, Fumiyoshi Shoji, Atsuya Uno,and Motoyoshi Kurokawa. K computer: 8.162 petaflops massively parallelscalar supercomputer built with over 548k cores. In ISSCC, pages 192–194.IEEE, 2012.
[19] Radhika Thekkath and Susan J. Eggers. The effectiveness of multiple hard-ware contexts. In Proc. 6th int. conf. on Architectural support for program-ming languages and operating systems, ASPLOS VI, pages 328–337, NewYork, NY, USA, 1994. ACM.
[20] Xuejun Yang, Yunfei Du, Panfeng Wang, Hongyi Fu, and Jia Jia. Ftpa:Supporting fault-tolerant parallel computing through parallel recomputing.Parallel and Distributed Systems, IEEE Transactions on, 20(10):1471 –1486, oct. 2009.
[21] John W. Young. A first order approximation to the optimum checkpointinterval. Comm. of the ACM, 17(9):530–531, 1974.
16

Tit
an
0
0.1
0.2
0.3
0.4
0.5
0.6
0.7
0.8
0.9
1
1 2 3 5 7.5 10 15 20 25 30 35 50 75 100
Application-OrientedPlatform-Oriented
Application-Oriented BestPerMachine-Oriented BestPer
0
0.1
0.2
0.3
0.4
0.5
0.6
0.7
0.8
0.9
1
1 2 3 5 7.5 10 15 20 25 30 35 50 75 100
Application-OrientedPlatform-Oriented
Application-Oriented BestPerPlatform-Oriented BestPer
Tit
an/1
0
0
0.1
0.2
0.3
0.4
0.5
0.6
0.7
0.8
0.9
1
1 2 3 5 7.5 10 15 20 25 30 35 50 75 100
0
0.1
0.2
0.3
0.4
0.5
0.6
0.7
0.8
0.9
1
1 2 3 5 7.5 10 15 20 25 30 35 50 75 100
Tit
an
/100
0
0.1
0.2
0.3
0.4
0.5
0.6
0.7
0.8
0.9
1
1 2 3 5 7.5 10 15 20 25 30 35 50 75 100
0
0.1
0.2
0.3
0.4
0.5
0.6
0.7
0.8
0.9
1
1 2 3 5 7.5 10 15 20 25 30 35 50 75 100
K-C
omp
ute
r/1
0
0.1
0.2
0.3
0.4
0.5
0.6
0.7
0.8
0.9
1
1 2 3 5 7.5 10 15 20 25 30 35 50 75 100
0
0.1
0.2
0.3
0.4
0.5
0.6
0.7
0.8
0.9
1
1 2 3 5 7.5 10 15 20 25 30 35 50 75 100
K-C
omp
ute
r/10
0
0.1
0.2
0.3
0.4
0.5
0.6
0.7
0.8
0.9
1
1 2 3 5 7.5 10 15 20 25 30 35 50 75 100
0
0.1
0.2
0.3
0.4
0.5
0.6
0.7
0.8
0.9
1
1 2 3 5 7.5 10 15 20 25 30 35 50 75 100
K-C
omp
ute
r/10
0
0
0.1
0.2
0.3
0.4
0.5
0.6
0.7
0.8
0.9
1
1 2 3 5 7.5 10 15 20 25 30 35 50 75 100
0
0.1
0.2
0.3
0.4
0.5
0.6
0.7
0.8
0.9
1
1 2 3 5 7.5 10 15 20 25 30 35 50 75 100
2D-Stencil Matrix-Product
Figure 5: Waste as a function of processor MTBF µ, for an Exponential Distri-bution, Current platforms
17
Exas
cale
-Sli
m/1
0
0.1
0.2
0.3
0.4
0.5
0.6
0.7
0.8
0.9
1
1 2 3 5 7.5 10 15 20 25 30 35 50 75 100
0
0.1
0.2
0.3
0.4
0.5
0.6
0.7
0.8
0.9
1
1 2 3 5 7.5 10 15 20 25 30 35 50 75 100
Exas
cale
-Sli
m/1
0
0
0.1
0.2
0.3
0.4
0.5
0.6
0.7
0.8
0.9
1
1 2 3 5 7.5 10 15 20 25 30 35 50 75 100
0
0.1
0.2
0.3
0.4
0.5
0.6
0.7
0.8
0.9
1
1 2 3 5 7.5 10 15 20 25 30 35 50 75 100
Exas
cale
-Sli
m/1
00
0
0.1
0.2
0.3
0.4
0.5
0.6
0.7
0.8
0.9
1
1 2 3 5 7.5 10 15 20 25 30 35 50 75 100
0
0.1
0.2
0.3
0.4
0.5
0.6
0.7
0.8
0.9
1
1 2 3 5 7.5 10 15 20 25 30 35 50 75 100
Exasc
ale-
Fat
/1
0
0.1
0.2
0.3
0.4
0.5
0.6
0.7
0.8
0.9
1
1 2 3 5 7.5 10 15 20 25 30 35 50 75 100
0
0.1
0.2
0.3
0.4
0.5
0.6
0.7
0.8
0.9
1
1 2 3 5 7.5 10 15 20 25 30 35 50 75 100
Exas
cale
-Fat
/10
0
0.1
0.2
0.3
0.4
0.5
0.6
0.7
0.8
0.9
1
1 2 3 5 7.5 10 15 20 25 30 35 50 75 100
0
0.1
0.2
0.3
0.4
0.5
0.6
0.7
0.8
0.9
1
1 2 3 5 7.5 10 15 20 25 30 35 50 75 100
Exas
cale
-Fat
/100
0
0.1
0.2
0.3
0.4
0.5
0.6
0.7
0.8
0.9
1
1 2 3 5 7.5 10 15 20 25 30 35 50 75 100
0
0.1
0.2
0.3
0.4
0.5
0.6
0.7
0.8
0.9
1
1 2 3 5 7.5 10 15 20 25 30 35 50 75 100
2D-Stencil Matrix-Product
Figure 6: Waste as a function of processor MTBF µ, for an Exponential Distri-bution, Exascale platforms
18
Tit
an/1
0
0.1
0.2
0.3
0.4
0.5
0.6
0.7
0.8
0.9
1
1 2 3 5 7.5 10 15 20 25 30 35 50 75 100
Application-OrientedPlatform-Oriented
Application-Oriented BestPerMachine-Oriented BestPer
0
0.1
0.2
0.3
0.4
0.5
0.6
0.7
0.8
0.9
1
1 2 3 5 7.5 10 15 20 25 30 35 50 75 100
Application-OrientedPlatform-Oriented
Application-Oriented BestPerPlatform-Oriented BestPer
Tit
an/1
0
0
0.1
0.2
0.3
0.4
0.5
0.6
0.7
0.8
0.9
1
1 2 3 5 7.5 10 15 20 25 30 35 50 75 100
0
0.1
0.2
0.3
0.4
0.5
0.6
0.7
0.8
0.9
1
1 2 3 5 7.5 10 15 20 25 30 35 50 75 100
Tit
an
/100
0
0.1
0.2
0.3
0.4
0.5
0.6
0.7
0.8
0.9
1
1 2 3 5 7.5 10 15 20 25 30 35 50 75 100
0
0.1
0.2
0.3
0.4
0.5
0.6
0.7
0.8
0.9
1
1 2 3 5 7.5 10 15 20 25 30 35 50 75 100
K-C
omp
ute
r/1
0
0.1
0.2
0.3
0.4
0.5
0.6
0.7
0.8
0.9
1
1 2 3 5 7.5 10 15 20 25 30 35 50 75 100
0
0.1
0.2
0.3
0.4
0.5
0.6
0.7
0.8
0.9
1
1 2 3 5 7.5 10 15 20 25 30 35 50 75 100
Application-Waste 296 GroupsApplication-Waste 296 Groups BestPer
Platform-Waste 295 GroupsPlatform-Waste 295 Groups BestPer
K-C
omp
ute
r/10
0
0.1
0.2
0.3
0.4
0.5
0.6
0.7
0.8
0.9
1
1 2 3 5 7.5 10 15 20 25 30 35 50 75 100
0
0.1
0.2
0.3
0.4
0.5
0.6
0.7
0.8
0.9
1
1 2 3 5 7.5 10 15 20 25 30 35 50 75 100
K-C
omp
ute
r/10
0
0
0.1
0.2
0.3
0.4
0.5
0.6
0.7
0.8
0.9
1
1 2 3 5 7.5 10 15 20 25 30 35 50 75 100
0
0.1
0.2
0.3
0.4
0.5
0.6
0.7
0.8
0.9
1
1 2 3 5 7.5 10 15 20 25 30 35 50 75 100
2D-Stencil Matrix-Product
Figure 7: Waste as a function of processor MTBF µ, for a Weibull Distributionk=0.7, Current platforms
19
Exas
cale
-Sli
m/1
0
0.1
0.2
0.3
0.4
0.5
0.6
0.7
0.8
0.9
1
1 2 3 5 7.5 10 15 20 25 30 35 50 75 100
0
0.1
0.2
0.3
0.4
0.5
0.6
0.7
0.8
0.9
1
1 2 3 5 7.5 10 15 20 25 30 35 50 75 100
Exas
cale
-Sli
m/10
0
0.1
0.2
0.3
0.4
0.5
0.6
0.7
0.8
0.9
1
1 2 3 5 7.5 10 15 20 25 30 35 50 75 100
0
0.1
0.2
0.3
0.4
0.5
0.6
0.7
0.8
0.9
1
1 2 3 5 7.5 10 15 20 25 30 35 50 75 100
Exas
cale
-Sli
m/1
00
0
0.1
0.2
0.3
0.4
0.5
0.6
0.7
0.8
0.9
1
1 2 3 5 7.5 10 15 20 25 30 35 50 75 100
0
0.1
0.2
0.3
0.4
0.5
0.6
0.7
0.8
0.9
1
1 2 3 5 7.5 10 15 20 25 30 35 50 75 100
Exasc
ale-
Fat
/1
0
0.1
0.2
0.3
0.4
0.5
0.6
0.7
0.8
0.9
1
1 2 3 5 7.5 10 15 20 25 30 35 50 75 100
0
0.1
0.2
0.3
0.4
0.5
0.6
0.7
0.8
0.9
1
1 2 3 5 7.5 10 15 20 25 30 35 50 75 100
Exas
cale
-Fat
/10
0
0.1
0.2
0.3
0.4
0.5
0.6
0.7
0.8
0.9
1
1 2 3 5 7.5 10 15 20 25 30 35 50 75 100
0
0.1
0.2
0.3
0.4
0.5
0.6
0.7
0.8
0.9
1
1 2 3 5 7.5 10 15 20 25 30 35 50 75 100
Exas
cale
-Fat
/100
0
0.1
0.2
0.3
0.4
0.5
0.6
0.7
0.8
0.9
1
1 2 3 5 7.5 10 15 20 25 30 35 50 75 100
0
0.1
0.2
0.3
0.4
0.5
0.6
0.7
0.8
0.9
1
1 2 3 5 7.5 10 15 20 25 30 35 50 75 100
2D-Stencil Matrix-Product
Figure 8: Waste as a function of processor MTBF µ, for a Weibull Distributionk=0.7, Exascale platforms
20