Embed Size (px)
Citation preview
Research Report
February - March 2017 Survey
South Gloucestershire Council
Report produced by:
Corporate Research & Consultation
Department for Environment and Community Services
Page 2
Table of Contents
1 Key findings 4
2 Introduction 6
2.1 Background 6
2.2 Methodology and analysis 6
2.3 Reporting 7
3 Fair Treatment by the Council 8
4 Community Safety 11
4.1 Contact between residents 11
4.2 Feeling safe in the local area 14
4.3 Anti-social behavior in the local area 16
4.4 Police and other public services 17
5 Community resilience 18
5.1 Community participation 18
5.2 Where I live 19
5.3 Employment, training and skills 21
5.4 Health and wellbeing 22
5.5 Any other comments 22
6 Registration services 23
7 Appendix 32
Page 3
Table of figures Figure 1: Map of priority neighbourhoods Figure 2: Influencing decision making Figure 3: Fair decisions by the council Figure 4: Feeling discriminated against by the council Figure 5: Contact between residents Figure 6: Contact between residents by priority neighbourhood vs. rest of district Figure 7: Respect between residents Figure 8: Respect between residents by priority neighbourhood vs. rest of district Figure 9: Feeling safe outside in South Gloucestershire Figure 10: Feeling safe after dark by priority neighbourhoods vs. rest of the district Figure 11: Feeling safe during the day by priority neighbourhood vs. rest of the district Figure 12: Anti-social behaviour in the local area Figure 13: Police and other public services Figure 14: Community participation Figure 15: Where I live Figure 16: Employment, training and skills Figure 17: Health and wellbeing Figure 18: Any other comments Figure 19: Register office Figure 20: Registration services usage Figure 21: How they heard about the registration service Figure 22: Register office location Figure 23: Awareness of registration services Figure 24: Ways to contact the registration service Figure 25: Preferred ways to contact the registration service Figure 26: Preferred ways to apply for a certificate Figure 27: Aspects of the registration service Figure 28: Any other comments
Table of tables Table 1: Sample profile
© South Gloucestershire Council, 2017 www.southglos.gov.uk/viewpoint

Page 4
1 Key findings In February 2017, members of South Gloucestershire Council’s Viewpoint citizens panel were asked for their views on community safety, community resilience and registration services. The survey was sent to 1,150 panel members and received a response rate of 70% (804 surveys). Fair treatment by the Council Survey participants were asked if they thought they could influence decisions affecting their local area. The largest proportion of respondents, almost one third, tended to disagree with this statement (32%), followed by slightly over one quarter who neither agreed nor disagreed (28%). Respondents were also asked if they agreed or disagreed that the Council considers the needs of its customers when making decisions and that the Council makes fair decisions. Slightly over one third of respondents agreed with both statements (36%). Community safety Questions regarding community safety explored whether residents thought that people from different backgrounds get on well together in their local area. Over half of participants tended to agree that this was the case (56%) and almost one quarter neither agreed nor disagreed (23%). People not treating each other with respect and consideration was mostly considered to be a fairly small problem (51%) or not a problem at all (32%). Almost half of participants stated that they felt very safe in their local area during the day (49%) and fairly safe after dark (55%). The largest problem for respondents was rubbish and litter lying around in their local area. This was viewed as a very big problem by 11% of respondents and a fairly big problem by one quarter of respondents (25%). Around one third of survey participants agreed that the police and other local public services sought people’s views on local issues (35%) and were successfully dealing with anti-social behaviour and crime in their local area (33%). Community resilience Questions regarding community resilience explored different topics related to the community. When asked for their opinions on community participation in their local area, the statements with the highest level of agreement referred to feeling part of my community (49%) and knowing where to get help from my community (44%). Survey participants were then asked about where they live. The statement with the highest level of disagreement referred to feeling optimistic about my community and its future (19%), which also received the greatest neutral score (43%). Survey participants were also asked for their opinions on employment, training and skills. The statements with the highest level of agreement referred to enjoying learning and new experiences (67%), followed by feeling that what I do is worthwhile (59%). When asked about health and wellbeing, the statements with the highest level of agreement referred to being able to make the decisions I need to (91%) and knowing what I want for myself and my family (90%).
Page 5
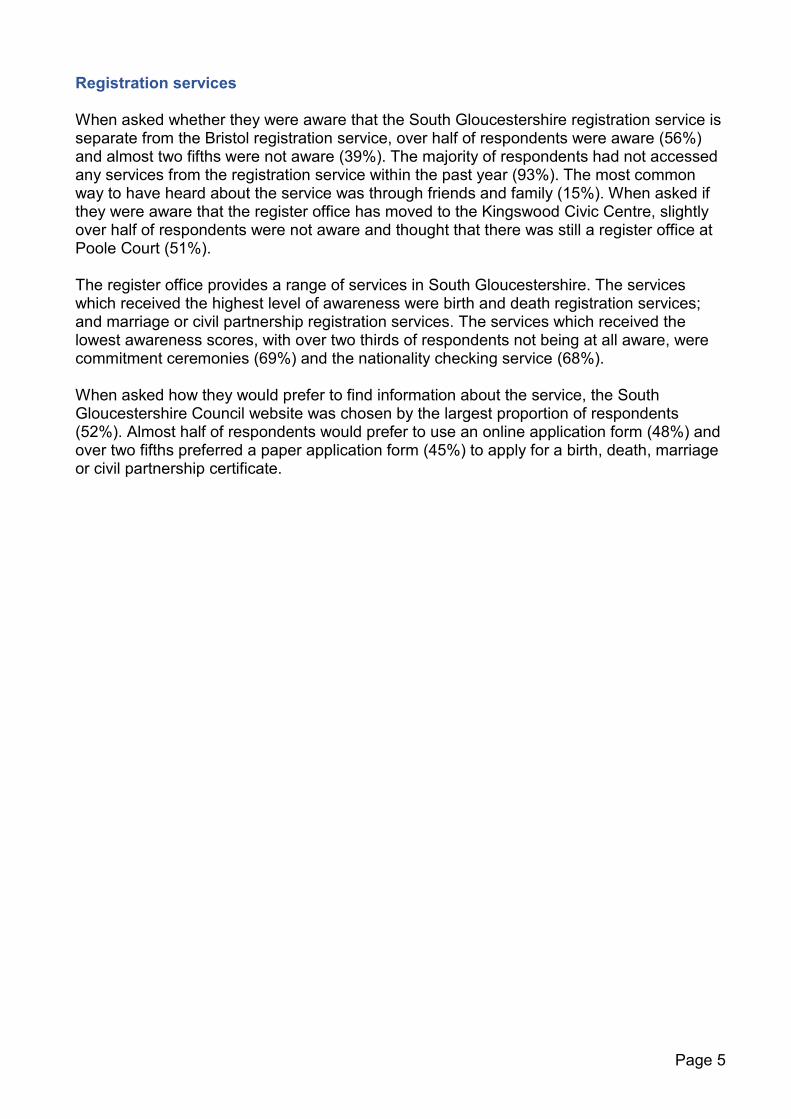
Registration services When asked whether they were aware that the South Gloucestershire registration service is separate from the Bristol registration service, over half of respondents were aware (56%) and almost two fifths were not aware (39%). The majority of respondents had not accessed any services from the registration service within the past year (93%). The most common way to have heard about the service was through friends and family (15%). When asked if they were aware that the register office has moved to the Kingswood Civic Centre, slightly over half of respondents were not aware and thought that there was still a register office at Poole Court (51%). The register office provides a range of services in South Gloucestershire. The services which received the highest level of awareness were birth and death registration services; and marriage or civil partnership registration services. The services which received the lowest awareness scores, with over two thirds of respondents not being at all aware, were commitment ceremonies (69%) and the nationality checking service (68%). When asked how they would prefer to find information about the service, the South Gloucestershire Council website was chosen by the largest proportion of respondents (52%). Almost half of respondents would prefer to use an online application form (48%) and over two fifths preferred a paper application form (45%) to apply for a birth, death, marriage or civil partnership certificate.
Page 6
2 Introduction
2.1 Background The following report provides a summary of findings from a survey undertaken among members of South Gloucestershire Council’s ‘Viewpoint’ citizens panel. The survey was conducted between February and March 2017. Members of South Gloucestershire Council’s Viewpoint citizens panel were asked for their feedback on community safety, community resilience and registration services. The results will inform the relevant service areas and support their decision making processes. Some questions are also used to monitor council performance.
2.2 Methodology and analysis All 1,150 panel members were sent an invitation to take part in the survey either by post (37%) or by email (63%). The survey received a response rate of 70% (804 surveys). The panel aims to be as representative of the population of South Gloucestershire as possible and any over- or under-representations with regards to certain demographics are balanced by weighting the data to match the proportions present in the population. Quantitative data has been weighted by priority neighbourhood and the rest of the district, ward, gender and ethnicity according to population information taken from the 2011 census (Office for National Statistics). Data has not been weighted by age due to large discrepancies between the distribution of age groups within the sample and the South Gloucestershire population. This is to avoid any distortion of results. When reviewing the results it should be considered that the over 45 age group is significantly over-represented and the under 25 age group is significantly under-represented. A full breakdown of the sample profile is available in the Appendix as Table 1. Qualitative data (comments questions) has not been weighted. The priority neighbourhood areas are:
o Cadbury Heath o Filton o Kingswood o Patchway o Staple Hill o Yate & Dodington
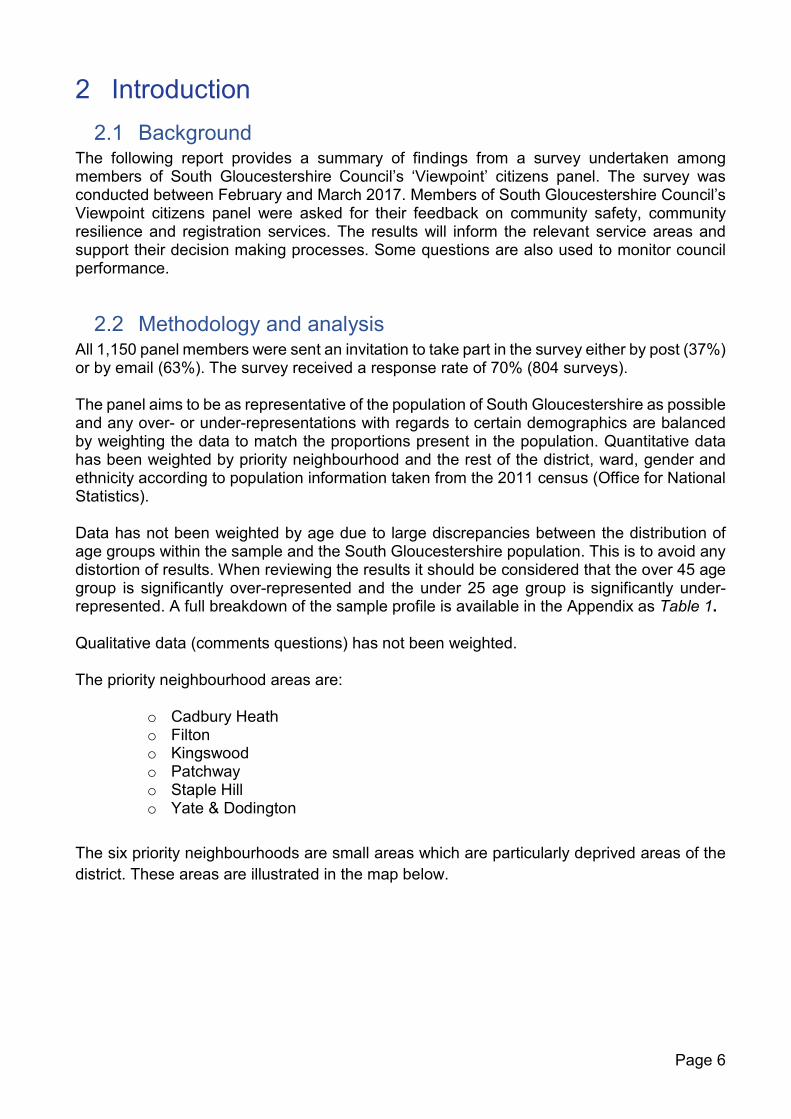
The six priority neighbourhoods are small areas which are particularly deprived areas of the
district. These areas are illustrated in the map below.
Page 7
Figure 2: Map of priority neighbourhoods
© Copyright South Gloucestershire Council 2014. All rights reserved. © Crown Copyright and database rights 2014 Ordnance Survey 100023410. All rights reserved. Contains National Statistics data © Crown Copyright and database right 2014.
For each survey question, the difference in views of different sample groups have been tested for significance at a 95% confidence level. The sample groups are: non-working and working age, gender and priority neighbourhoods vs rest of district. These differences are discussed throughout the report.
2.3 Reporting This report presents survey findings by subject area. Some of the key significant findings for gender, working age (under 65) in comparison to non-working age (65+), and priority neighbourhoods in comparison to the rest of the district are included in this report. Sums of percentages reported in this document may deviate from the actual total by 1% due to rounding. Greater deviations from 100% occur where respondents were able to choose multiple options and percentages are based on the number of respondents. The following separate outputs have been prepared: Data report - A separate spreadsheet has been produced which shows cross tabulations and significant findings between percentages of respondents for the following independent variables: Gender, working age / non-working age, priority neighbourhoods, priority neighbourhood / rest of district, ethnicity, disability and wards. Open text responses - A separate document listing all open responses for each open text question has been prepared.
Page 8
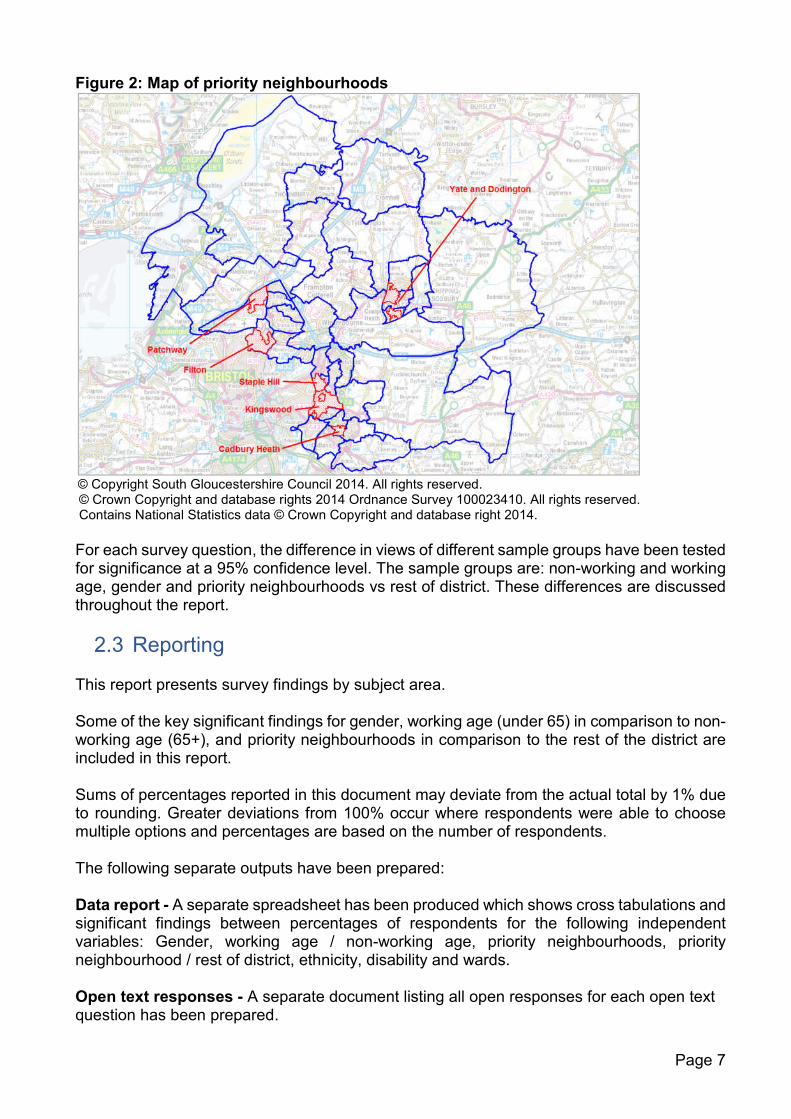
3 Fair Treatment by the Council This question is taken from the November 2016 Budget survey but has been included in this survey for reporting purposes. Survey participants were asked whether they feel they can influence decisions in their local area. The largest proportion of respondents, almost one third, tended to disagree with this statement (32%), followed by slightly over one quarter who neither agreed nor disagreed (28%). Figure 2: Influencing decision making How strongly do you agree or disagree with the following statement? I can influence decisions affecting my local area Base: 780 Male respondents were significantly more likely to strongly disagree with this statement (21% compared to 14%), whereas female respondents were significantly more likely to tend to agree (21% compared to 15%). There were no other significant differences.
0% 5% 10% 15% 20% 25% 30% 35%
Strongly agree2%
Don't know3%
Strongly disagree17%
Tend to agree18%
Neither agree nor disagree28%
Tend to disagree32%
Page 9
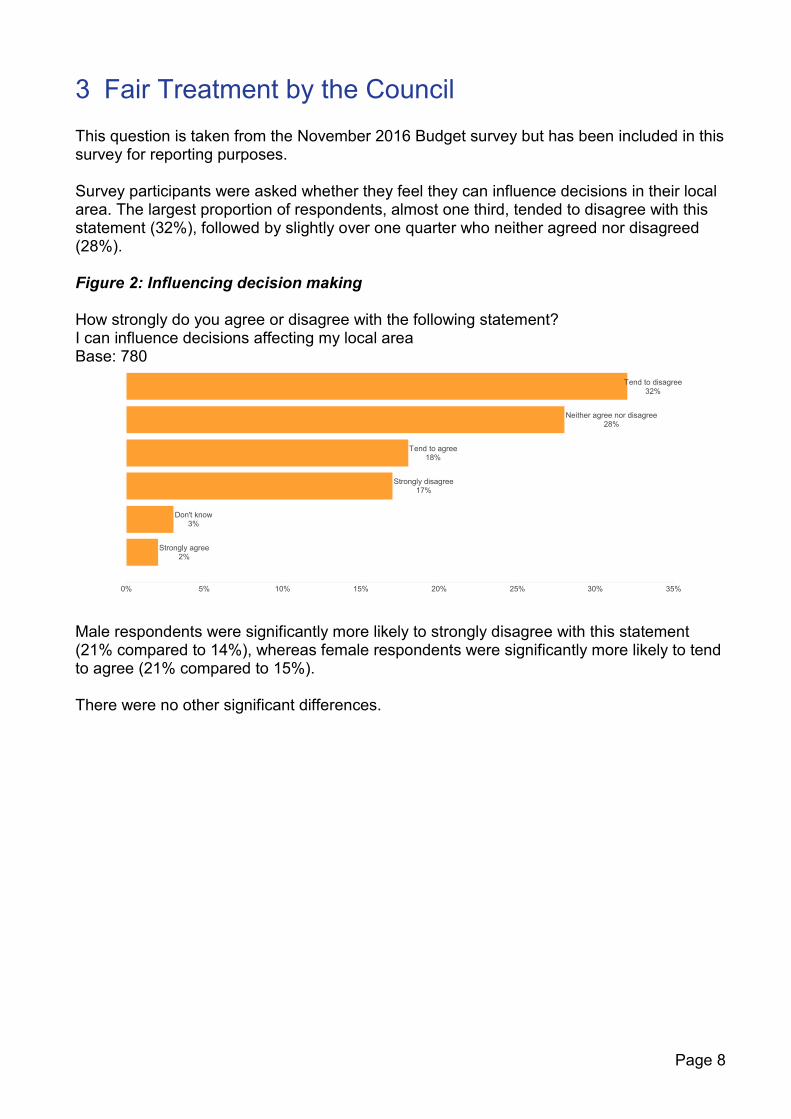
Respondents were asked if they agreed or disagreed that the Council makes fair decisions and that they consider the needs of customers when making these decisions. Slightly over one third of respondents agreed with both statements (36%). A greater proportion of respondents neither agreed nor disagreed with the ‘council makes fair decisions’ statement when compared to the first statement (35% compared to 28%). Over one quarter of respondents disagreed that ‘the council considers the needs of all its customers when making decisions’ (29%) and slightly over one fifth disagreed that ‘the council makes fair decisions’ (22%). Figure 3: Fair decisions by the council Based on your own experience of South Gloucestershire Council and anything else you may have seen, read or heard about the council, to what extent do you agree or disagree that..? Base: see chart labels
Respondents of non-working age were significantly more likely to agree that the council considers the needs of it’s customers (39.8% compared to 32.3%), while respondents of working age were significantly more likely to disagree (32.3% compared to 23.8%). Respondents of non-working age were also significantly more likely to agree that the council makes fair decisions (40.5% compared to 30.1%) when compared to respondents of working age who were significantly more likely to disagree (27.9% compared to 17.1%). There was not a significant difference between the views of respondents from priority neighbourhoods and the rest of the district, nor different genders.
The council considers the needs of all its customers when making decisions (796)
The council makes fair decisions (772)
36% 28% 29% 8%
36% 35% 22% 7%
Agree (combined) Neither agree nor disagree Disagree (combined) Don't know

Page 10
Survey participants were then asked if they have been discriminated against by the council on the grounds of any equalities issues. The majority of respondents felt as though they have never been discriminated against by the council (702 respondents or 94%). However, twenty respondents felt as though they had been discriminated against for their age, twelve for other equalities issues, seven for disability, two for ethnicity, two for gender, two for marital status and one for pregnancy or maternity. Figure 4: Feeling discriminated against by the council
Do you feel you have been discriminated against by the council on the grounds of any of the following equalities issues in the last year? Base: 739
36 comments were left in response to this question. These comments have been shared with the relevant teams.
No, never
Age
Any other equalities issues
Disability
Ethnicity
Gender
Marital status
Pregnancy and maternity
Gender reassignment
Religion or belief
Sexual orientation
1
2
2
2
702
20
12
7

Page 11
4 Community safety
4.1 Contact between residents Several of the survey questions explored community safety and anti-social behaviour. As part of this respondents were asked if they thought that people from different backgrounds got on well together in their local area. Over half of respondents tended to agree (56%), followed by almost one quarter who neither agreed nor disagreed (23%). The remainder either strongly agreed (10%), tended to disagree (6%), didn’t know (4%) or strongly disagreed (2%). Figure 5: Contact between residents To what extent do you agree or disagree that your local area is a place where people from different backgrounds get on well together? Base: 802
When compared to respondents of working age, respondents of non-working age were significantly more likely to not know whether people from different backgrounds get on well together in their local area (5% compared to 2%). Male respondents were significantly more likely than female respondents to disagree (10% compared to 6%).
There was not a significant difference between the views of respondents from priority neighbourhoods and the rest of the district, as demonstrated by the following graph.
Figure 6: Contact between residents by priority neighbourhood vs. rest of district To what extent do you agree or disagree that your local area is a place where people from different backgrounds get on well together? Base: Priority Neighbourhood (133), Rest of district (669)
0% 10% 20% 30% 40% 50% 60% 70%
Tend to agree
Neither agree nor disagree
Strongly agree
Tend to disagree
Don't know
Strongly disagree2%
3%
5%
11%
23%
56%
3%
6%
60%
20%
4%
7%
Priority Neighbourhood Rest of district
0% 10% 20% 30% 40% 50% 60%
Strongly disagree2%
Don't know4%
Tend to disagree6%
Strongly agree10%
Neither agree nor disagree23%
Tend to agree56%

Page 12
Another survey question asked how much of a problem there was with people not treating each other with respect and consideration in their local area. Slightly over half of respondents felt as though people not treating each other with respect and consideration was a fairly small problem (51%). Almost one third felt as though this was not a problem at all (32%) and the remainder either felt that this was a fairly big problem (8%), didn’t know (8%) or a very big problem (2%).
Figure 7: Respect between residents In your local area, how much of a problem do you think there is with people not treating each other with respect and consideration? Base: 801
When compared to respondents of non-working age, respondents of working age were significantly more likely to feel people not treating each other with respect and consideration was a very big problem (3% compared to 1%) or a fairly small problem (56% compared to 46%). Respondents of non-working age were significantly more likely to feel this was not a problem at all (38% compared to 26%).There was not a significant difference in the views of respondents of different genders.
When compared to respondents from the rest of the district, respondents from priority neighbourhoods were significantly more likely to feel there was a fairly big problem with people not treating each other with respect and consideration (17% compared to 6%), whereas respondents from the rest of the district were significantly more likely to feel there was not a problem at all (35% compared to 15%).The chart below illustrates the differences between priority neighbourhoods and the rest of South Gloucestershire.
Figure 8: Respect between residents by priority neighbourhood vs. rest of district In your local area, how much of a problem do you think there is with people not treating each other with respect and consideration? Base: Priority Neighbourhood (133), Rest of district (669)
0% 10% 20% 30% 40% 50% 60%
A very big problem2%
Don't know8%
A fairly big problem8%
Not a problem at all32%
A fairly small problem51%
0% 10% 20% 30% 40% 50% 60%
A fairly small problem
Not a problem at all
A fairly big problem
Don't know
A very big problem
50%
2%
7%
6%
35%
2%
57%
15%
17%
10%
Priority Neighbourhood Rest of district
Page 13
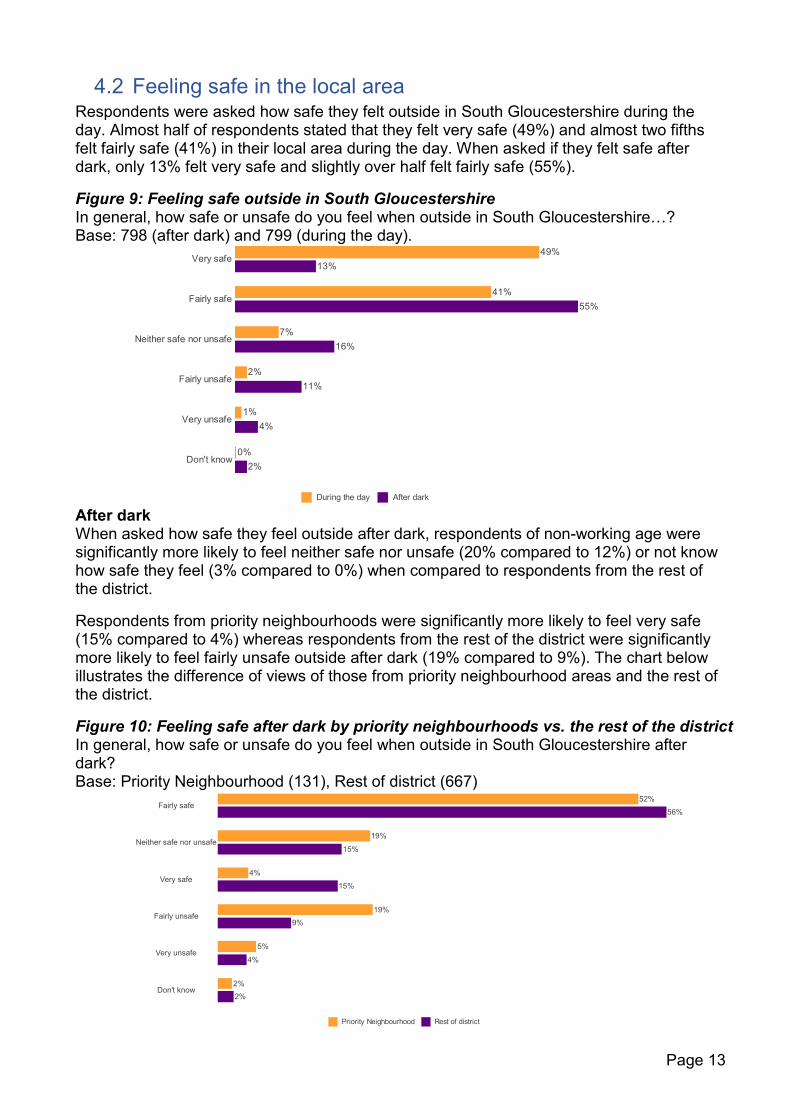
4.2 Feeling safe in the local area Respondents were asked how safe they felt outside in South Gloucestershire during the day. Almost half of respondents stated that they felt very safe (49%) and almost two fifths felt fairly safe (41%) in their local area during the day. When asked if they felt safe after dark, only 13% felt very safe and slightly over half felt fairly safe (55%).
Figure 9: Feeling safe outside in South Gloucestershire In general, how safe or unsafe do you feel when outside in South Gloucestershire…? Base: 798 (after dark) and 799 (during the day).
After dark When asked how safe they feel outside after dark, respondents of non-working age were significantly more likely to feel neither safe nor unsafe (20% compared to 12%) or not know how safe they feel (3% compared to 0%) when compared to respondents from the rest of the district.
Respondents from priority neighbourhoods were significantly more likely to feel very safe (15% compared to 4%) whereas respondents from the rest of the district were significantly more likely to feel fairly unsafe outside after dark (19% compared to 9%). The chart below illustrates the difference of views of those from priority neighbourhood areas and the rest of the district.
Figure 10: Feeling safe after dark by priority neighbourhoods vs. the rest of the district In general, how safe or unsafe do you feel when outside in South Gloucestershire after dark? Base: Priority Neighbourhood (131), Rest of district (667)
Very safe
Fairly safe
Neither safe nor unsafe
Fairly unsafe
Very unsafe
Don't know2%
4%
11%
16%
55%
13%
0%
1%
49%
41%
7%
2%
During the day After dark
Fairly safe
Neither safe nor unsafe
Very safe
Fairly unsafe
Very unsafe
Don't know2%
4%
9%
15%
15%
56%
2%
5%
52%
19%
4%
19%
Priority Neighbourhood Rest of district
Page 14
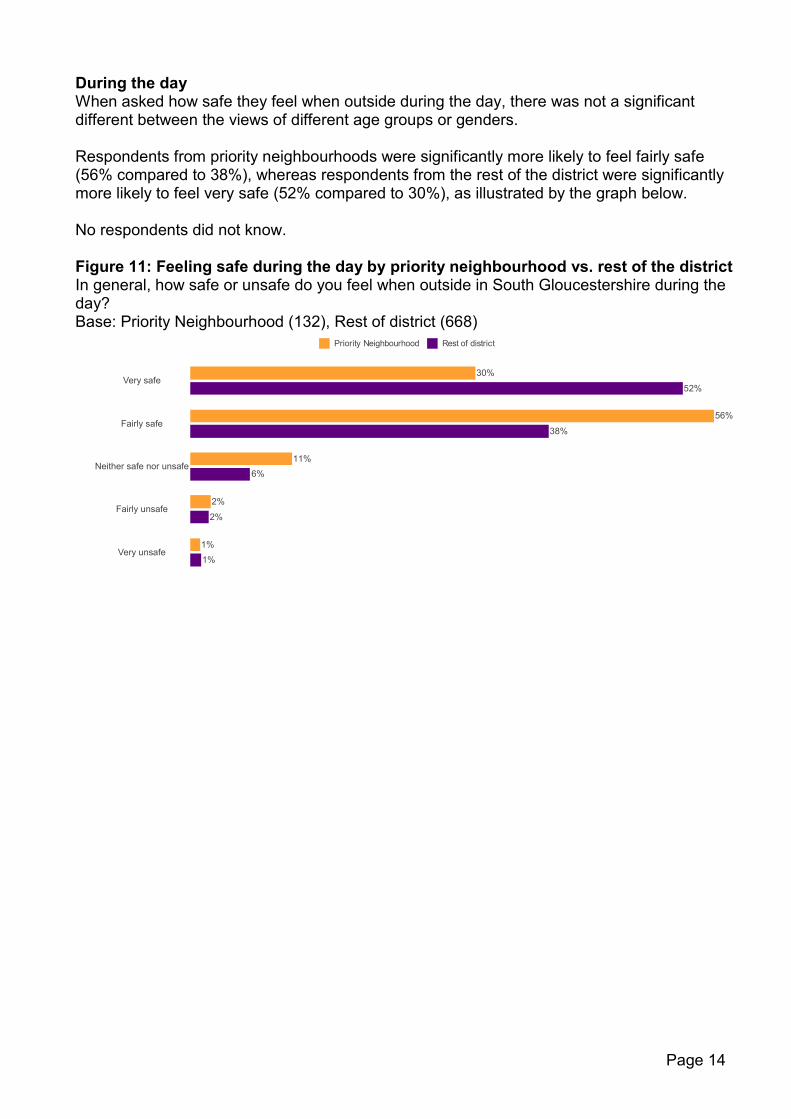
During the day When asked how safe they feel when outside during the day, there was not a significant different between the views of different age groups or genders. Respondents from priority neighbourhoods were significantly more likely to feel fairly safe (56% compared to 38%), whereas respondents from the rest of the district were significantly more likely to feel very safe (52% compared to 30%), as illustrated by the graph below. No respondents did not know. Figure 11: Feeling safe during the day by priority neighbourhood vs. rest of the district In general, how safe or unsafe do you feel when outside in South Gloucestershire during the day? Base: Priority Neighbourhood (132), Rest of district (668)
Very safe
Fairly safe
Neither safe nor unsafe
Fairly unsafe
Very unsafe1%
2%
6%
38%
52%
1%
30%
56%
11%
2%
Priority Neighbourhood Rest of district
Page 15
4.3 Anti-social behaviour in the local area
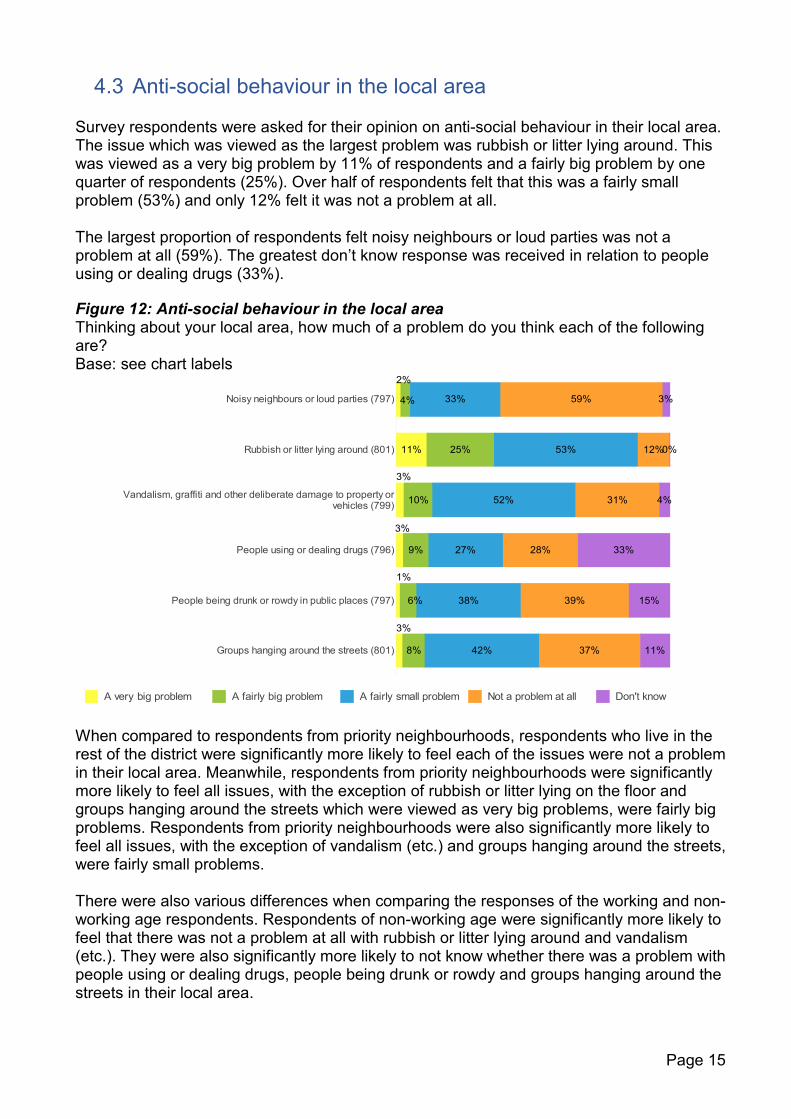
Survey respondents were asked for their opinion on anti-social behaviour in their local area. The issue which was viewed as the largest problem was rubbish or litter lying around. This was viewed as a very big problem by 11% of respondents and a fairly big problem by one quarter of respondents (25%). Over half of respondents felt that this was a fairly small problem (53%) and only 12% felt it was not a problem at all. The largest proportion of respondents felt noisy neighbours or loud parties was not a problem at all (59%). The greatest don’t know response was received in relation to people using or dealing drugs (33%). Figure 12: Anti-social behaviour in the local area Thinking about your local area, how much of a problem do you think each of the following are? Base: see chart labels
When compared to respondents from priority neighbourhoods, respondents who live in the rest of the district were significantly more likely to feel each of the issues were not a problem in their local area. Meanwhile, respondents from priority neighbourhoods were significantly more likely to feel all issues, with the exception of rubbish or litter lying on the floor and groups hanging around the streets which were viewed as very big problems, were fairly big problems. Respondents from priority neighbourhoods were also significantly more likely to feel all issues, with the exception of vandalism (etc.) and groups hanging around the streets, were fairly small problems. There were also various differences when comparing the responses of the working and non-working age respondents. Respondents of non-working age were significantly more likely to feel that there was not a problem at all with rubbish or litter lying around and vandalism (etc.). They were also significantly more likely to not know whether there was a problem with people using or dealing drugs, people being drunk or rowdy and groups hanging around the streets in their local area.
Noisy neighbours or loud parties (797)
Rubbish or litter lying around (801)
Vandalism, graffiti and other deliberate damage to property orvehicles (799)
People using or dealing drugs (796)
People being drunk or rowdy in public places (797)
Groups hanging around the streets (801)
11% 25% 53% 12%0%
3%
8% 42% 37% 11%
2%
4% 33% 59% 3%
3%
10% 52% 31% 4%
1%
6% 38% 39% 15%
3%
9% 27% 28% 33%
A very big problem A fairly big problem A fairly small problem Not a problem at all Don't know
Page 16
When compared to respondents of non-working age, respondents of working age were significantly more likely to feel that noisy neighbours or loud parties (3% compared to 1%), people using or dealing drugs (4% compared to 1%) and groups hanging around the streets (4% compared to 1%) were very big problems. They were also significantly more likely to feel all issues, with the exception of rubbish or litter lying around, were fairly big problems. Respondents of working age were significantly more likely to feel people being drunk or rowdy and groups hanging around the streets were fairly small problems when compared to respondents of non-working age. When comparing the responses of male and female respondents, male respondents were significantly more likely to feel rubbish or litter lying around was a fairly big problem (29% compared to 21%), while female respondents were significantly more likely to feel this was a fairly small problem (56% compared to 48%). When compared to male respondents, female respondents were significantly more likely to feel there was not a problem at all with people using or dealing drugs in their local area (32% compared to 24%).
Page 17
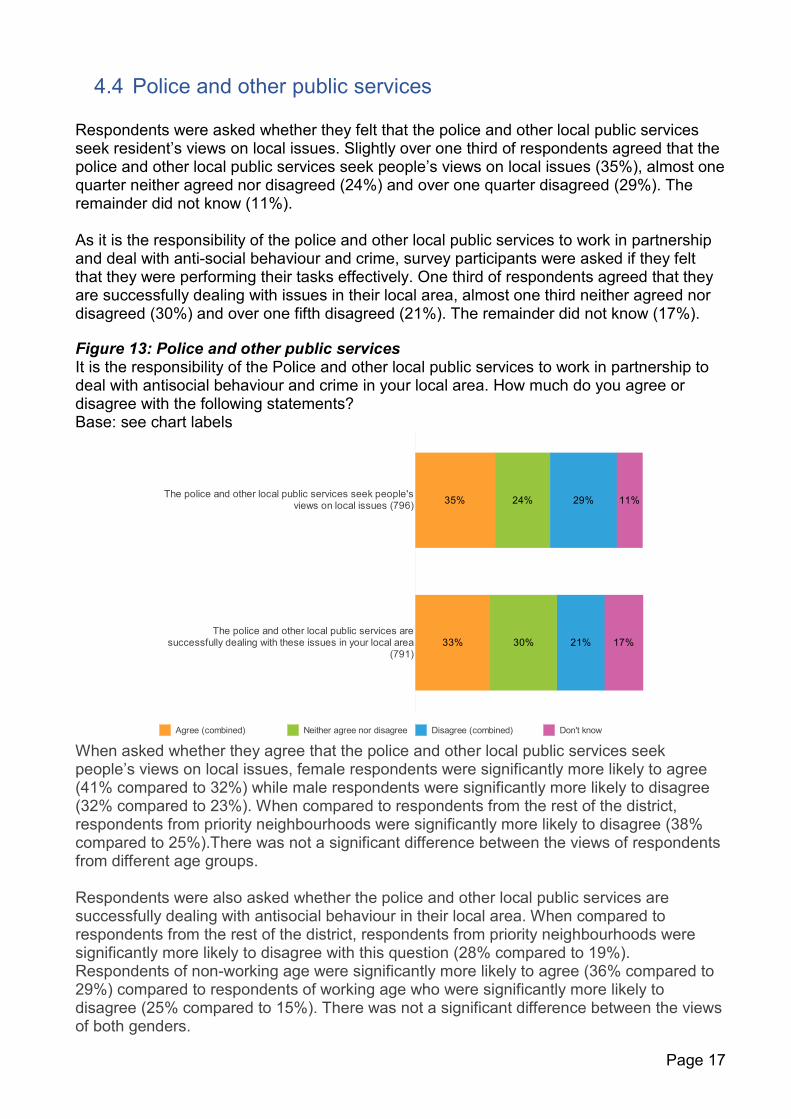
4.4 Police and other public services Respondents were asked whether they felt that the police and other local public services seek resident’s views on local issues. Slightly over one third of respondents agreed that the police and other local public services seek people’s views on local issues (35%), almost one quarter neither agreed nor disagreed (24%) and over one quarter disagreed (29%). The remainder did not know (11%). As it is the responsibility of the police and other local public services to work in partnership and deal with anti-social behaviour and crime, survey participants were asked if they felt that they were performing their tasks effectively. One third of respondents agreed that they are successfully dealing with issues in their local area, almost one third neither agreed nor disagreed (30%) and over one fifth disagreed (21%). The remainder did not know (17%). Figure 13: Police and other public services It is the responsibility of the Police and other local public services to work in partnership to deal with antisocial behaviour and crime in your local area. How much do you agree or disagree with the following statements? Base: see chart labels When asked whether they agree that the police and other local public services seek people’s views on local issues, female respondents were significantly more likely to agree (41% compared to 32%) while male respondents were significantly more likely to disagree (32% compared to 23%). When compared to respondents from the rest of the district, respondents from priority neighbourhoods were significantly more likely to disagree (38% compared to 25%).There was not a significant difference between the views of respondents from different age groups. Respondents were also asked whether the police and other local public services are successfully dealing with antisocial behaviour in their local area. When compared to respondents from the rest of the district, respondents from priority neighbourhoods were significantly more likely to disagree with this question (28% compared to 19%). Respondents of non-working age were significantly more likely to agree (36% compared to 29%) compared to respondents of working age who were significantly more likely to disagree (25% compared to 15%). There was not a significant difference between the views of both genders.
The police and other local public services seek people'sviews on local issues (796)
The police and other local public services aresuccessfully dealing with these issues in your local area
(791)33% 30% 21% 17%
35% 24% 29% 11%
Agree (combined) Neither agree nor disagree Disagree (combined) Don't know

Page 18
5 Community resilience Several of the survey questions explored different topics related to respondent’s local communities.
5.1 Community participation
Survey participants were asked for their opinions on community participation in their local area. The statements with the highest level of agreement related to feeling part of my community (49%) and knowing where to get help from my community (44%).
The statement which received the greatest neutral score was wanting to be more involved in the community, where almost two thirds of respondents felt neutral (64%). The highest disagreement scores related to regularly volunteering in my community (45%), doing more in my community than last year (38%) and being actively involved in my local community (25%).
Figure 14: Community participation Do you agree or disagree with the following statements? Base: see chart labels
Male respondents were significantly more likely to feel neutral about doing more in my community now than last year (50% compared to 41%), while females were significantly more likely to disagree with knowing where to get help from my community (23% compared to 15%) and wanting to be more involved in my community (19% compared to 13%).
When compared to respondents from priority neighbourhoods, respondents from the rest of the district were significantly more likely to agree with all statements, with the exception of regularly volunteering in my community and wanting to be more involved in my community. Respondents from priority neighbourhoods were significantly more likely to disagree with being able to influence what happens in my community (42% compared to 32%) and feel neutral about feeling part of my community (49% compared to 35%).
When compared to respondents of non-working age, respondents of working age were significantly more likely to disagree with feeling actively involved, doing more in my community than last year, regularly volunteering and knowing where to get help in my community.
I am actively involved in my local community (785)
I do more in my community now than I did last year (781)
I can influence what happens in my community (784)
I regularly volunteer in my community (780)
I know where to get help from my community (788)
I feel part of my community (787)
I want to be more involved in my community (784)
44% 37% 19%
16% 46% 38%
19% 64% 17%
20% 47% 33%
49% 38% 13%
21% 34% 45%
29% 46% 25%
Agree Neutral Disagree
Page 19
I feel safe where I live (794)
I am proud of where I live (794)
I am happy with where I live (793)
I feel safe in my community (791)
I feel optimistic about my community and its future (792)
I get on well with my neighbours (795)
I can trust people in my community (789)
I can get to where I need to go to outside of my community (792)
I can get around my community (792)
I have a safe and secure place to live (792) 85% 12%3%
63% 33% 4%
75% 16% 9%
83% 14%3%
84% 12%4%
38% 43% 19%
76% 20% 4%
68% 26% 6%
83% 14%3%
82% 14%3%
Agree Neutral Disagree
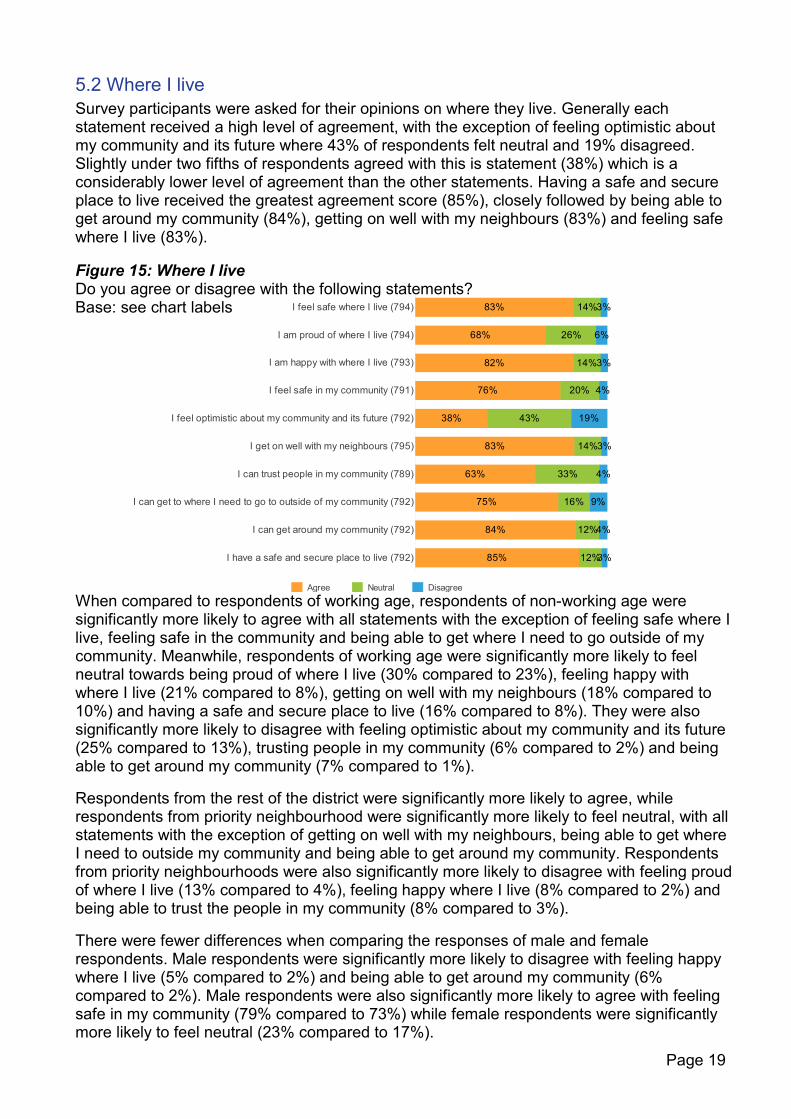
5.2 Where I live Survey participants were asked for their opinions on where they live. Generally each statement received a high level of agreement, with the exception of feeling optimistic about my community and its future where 43% of respondents felt neutral and 19% disagreed. Slightly under two fifths of respondents agreed with this is statement (38%) which is a considerably lower level of agreement than the other statements. Having a safe and secure place to live received the greatest agreement score (85%), closely followed by being able to get around my community (84%), getting on well with my neighbours (83%) and feeling safe where I live (83%).
Figure 15: Where I live Do you agree or disagree with the following statements? Base: see chart labels When compared to respondents of working age, respondents of non-working age were significantly more likely to agree with all statements with the exception of feeling safe where I live, feeling safe in the community and being able to get where I need to go outside of my community. Meanwhile, respondents of working age were significantly more likely to feel neutral towards being proud of where I live (30% compared to 23%), feeling happy with where I live (21% compared to 8%), getting on well with my neighbours (18% compared to 10%) and having a safe and secure place to live (16% compared to 8%). They were also significantly more likely to disagree with feeling optimistic about my community and its future (25% compared to 13%), trusting people in my community (6% compared to 2%) and being able to get around my community (7% compared to 1%).
Respondents from the rest of the district were significantly more likely to agree, while respondents from priority neighbourhood were significantly more likely to feel neutral, with all statements with the exception of getting on well with my neighbours, being able to get where I need to outside my community and being able to get around my community. Respondents from priority neighbourhoods were also significantly more likely to disagree with feeling proud of where I live (13% compared to 4%), feeling happy where I live (8% compared to 2%) and being able to trust the people in my community (8% compared to 3%).
There were fewer differences when comparing the responses of male and female respondents. Male respondents were significantly more likely to disagree with feeling happy where I live (5% compared to 2%) and being able to get around my community (6% compared to 2%). Male respondents were also significantly more likely to agree with feeling safe in my community (79% compared to 73%) while female respondents were significantly more likely to feel neutral (23% compared to 17%).
Page 20
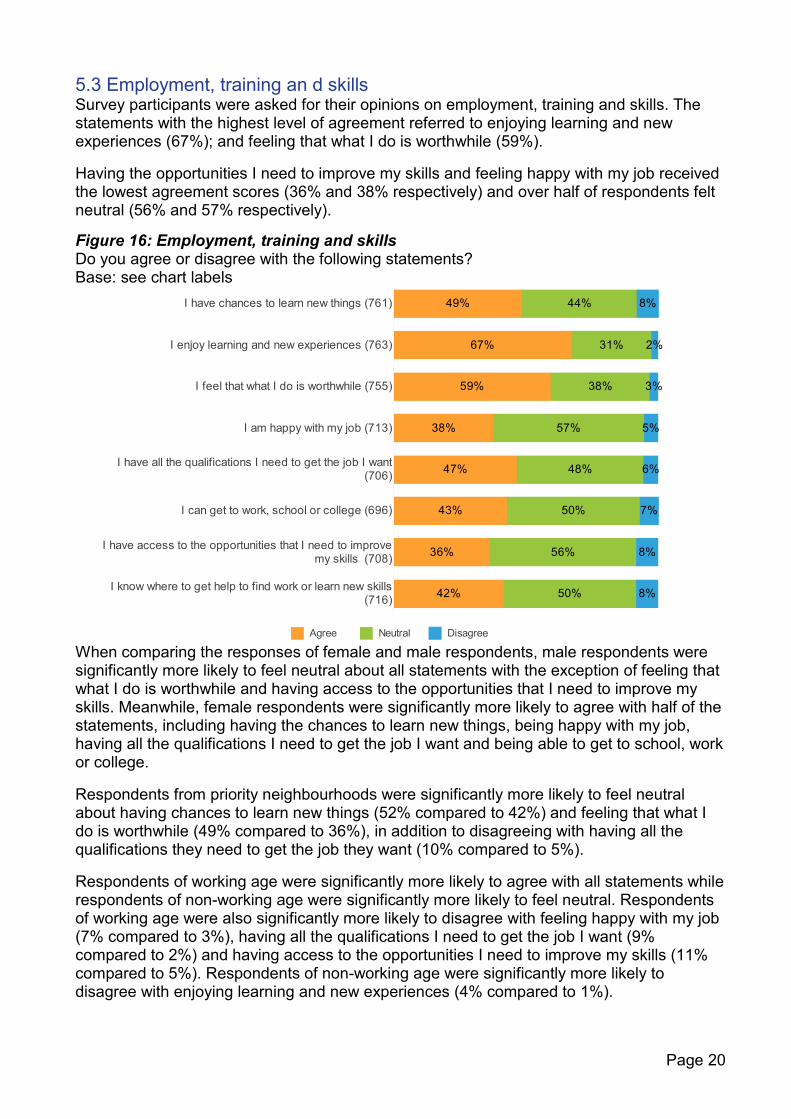
5.3 Employment, training an d skills Survey participants were asked for their opinions on employment, training and skills. The statements with the highest level of agreement referred to enjoying learning and new experiences (67%); and feeling that what I do is worthwhile (59%).
Having the opportunities I need to improve my skills and feeling happy with my job received the lowest agreement scores (36% and 38% respectively) and over half of respondents felt neutral (56% and 57% respectively).
Figure 16: Employment, training and skills Do you agree or disagree with the following statements? Base: see chart labels
When comparing the responses of female and male respondents, male respondents were significantly more likely to feel neutral about all statements with the exception of feeling that what I do is worthwhile and having access to the opportunities that I need to improve my skills. Meanwhile, female respondents were significantly more likely to agree with half of the statements, including having the chances to learn new things, being happy with my job, having all the qualifications I need to get the job I want and being able to get to school, work or college.
Respondents from priority neighbourhoods were significantly more likely to feel neutral about having chances to learn new things (52% compared to 42%) and feeling that what I do is worthwhile (49% compared to 36%), in addition to disagreeing with having all the qualifications they need to get the job they want (10% compared to 5%).
Respondents of working age were significantly more likely to agree with all statements while respondents of non-working age were significantly more likely to feel neutral. Respondents of working age were also significantly more likely to disagree with feeling happy with my job (7% compared to 3%), having all the qualifications I need to get the job I want (9% compared to 2%) and having access to the opportunities I need to improve my skills (11% compared to 5%). Respondents of non-working age were significantly more likely to disagree with enjoying learning and new experiences (4% compared to 1%).
I have chances to learn new things (761)
I enjoy learning and new experiences (763)
I feel that what I do is worthwhile (755)
I am happy with my job (713)
I have all the qualifications I need to get the job I want(706)
I can get to work, school or college (696)
I have access to the opportunities that I need to improvemy skills (708)
I know where to get help to find work or learn new skills(716)
43% 50% 7%
59% 38% 3%
47% 48% 6%
36% 56% 8%
67% 31% 2%
38% 57% 5%
49% 44% 8%
42% 50% 8%
Agree Neutral Disagree

Page 21
5.4 Health and wellbeing Survey participants were asked for their opinions on health and wellbeing. The statements with the highest level of agreement referred to being able to make the decisions I need to (91%) and knowing what I want for myself and my family (90%). Feeling optimistic about my future received the greatest neutral score, with over one third of respondents feeling neutral (35%), closely followed by feeling healthy and happy with my health where one quarter of respondents felt neutral. Figure 17: Health and wellbeing Do you agree or disagree with the following statements? Base: see chart labels
When compared to respondents of non-working age, respondents of working age were significantly more likely to disagree with all statements, with the exception of having people I can ask for help, having regular contact with different people and feeling healthy and happy with my health. Respondents of non-working age were significantly more likely to feel neutral towards being optimistic about the future (40% compared to 29%) and feeling healthy and happy with my health (29% compared to 21%). They were also more likely to agree with being in full control of my life (77% compared to 70%) and feeling cheerful (79% compared to 73%). When comparing the responses of both genders, the only statement where there was a significant difference was feeling healthy and happy with my health, where female respondents were significantly more likely to agree (68% compared to 60%). Respondents from priority neighbourhoods were significantly more likely to feel neutral about being optimistic about the future (44% compared to 33%), while respondents from the rest of the district were significantly more likely to disagree with feeling optimistic about the future (10% compared to 4%). When compared to respondents from the rest of the district, respondents from priority neighbourhoods were significantly more likely to feel neutral about having people I can ask for help (26% compared to 18%).
I feel optimistic about my future (788)
I know who to ask if I need help (792)
I have people I can ask for help (793)
I have regular contact with different people (789)
I am able to make the decisions I need to (793)
I know what I want for myself and my family (794)
I am in full control of my life (794)
I feel cheerful (794)
I feel healthy and I am happy with my health (790)
74% 22% 5%
79% 15% 6%
56% 35% 9%
76% 20% 4%
91% 8%1%
70% 22% 8%
64% 25% 11%
73% 19% 7%
90% 9%1%
Agree Neutral Disagree
Page 22
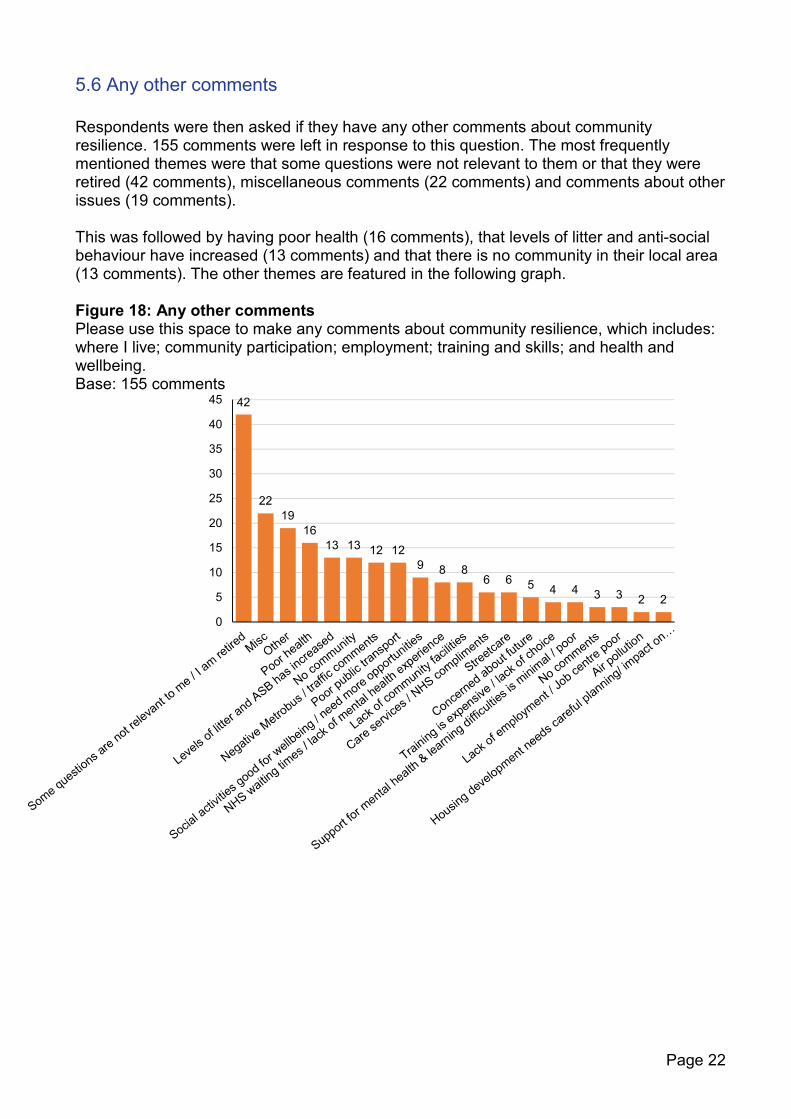
5.6 Any other comments Respondents were then asked if they have any other comments about community resilience. 155 comments were left in response to this question. The most frequently mentioned themes were that some questions were not relevant to them or that they were retired (42 comments), miscellaneous comments (22 comments) and comments about other issues (19 comments). This was followed by having poor health (16 comments), that levels of litter and anti-social behaviour have increased (13 comments) and that there is no community in their local area (13 comments). The other themes are featured in the following graph. Figure 18: Any other comments Please use this space to make any comments about community resilience, which includes: where I live; community participation; employment; training and skills; and health and wellbeing. Base: 155 comments
42
2219
1613 13 12 12
9 8 86 6 5 4 4 3 3 2 2
0
5
10
15
20
25
30
35
40
45

Page 23
6 Registration services The next section asked respondents about their awareness and use of registration services. This data will be used to help the registration service understand public awareness of the service and how they can develop the service in the future. When asked whether they were aware that the South Gloucestershire registration service is separate from the Bristol registration service, over half of respondents were aware (56%), almost two fifths were not aware (39%) and the remaining 6% did not know. Figure 19: Register office Each local authority has its own Registration Service. Events such as births, deaths and marriages can only be officially recorded in the registration district where they occur.
Were you aware that South Gloucestershire Register Office is separate from the Bristol Register Office? Base: 784 There was not a significant difference in views when comparing the responses of different age groups, genders or where they live.
0% 10% 20% 30% 40% 50% 60%
Don't know6%
No39%
Yes56%

Page 24
Respondents were then asked whether they had accessed any services from the South Gloucestershire registration service in the last year. The majority of respondents had not accessed any services from the registration service within the past year (93%). The remaining 7% had accessed one or more of the services, including registering a death (4%), giving notice of marriage (2%) and registering a birth (2%).
Figure 20: Registration services usage Have you accessed any of the following services from the South Gloucestershire Registration Service within the last year? (Please tick all that apply) Base: 776
When asked how they heard about the registration service, slightly over two fifths of respondents said that they were not aware of the South Gloucestershire registration service (42%). The largest proportion of respondents heard about the service through friends and family (15%). This was followed by the South Gloucestershire Council website (13%), a professional (10%) and ‘other’ ways (10%).
Respondents who chose ’other’ were asked to provide further detail, 77 comments were made in response to this question. The majority of these comments referred to this being general knowledge or not remembering how they became aware of the service.
Figure 21: How they heard about the registration service Where did you hear about the South Gloucestershire Registration Service? Base: 766
When compared to those of working age, respondents of non-working age were significantly more likely to hear about the South Gloucestershire registration service through a library (6% compared to 3%) or a One Stop Shop (5% compared to 1%). Male respondents were also significantly more likely than female respondents to hear about the registration service from a One Stop Shop (5% compared to 1%).
0% 10% 20% 30% 40% 50% 60% 70% 80% 90% 100%
None of the above93%
Registered a death4%
Gave notice of marriage2%
Registered a birth2%
Arranged a wedding ceremony1%
Obtained a copy of a certificate (birth, marriage, civil partnership or death)1%
Arranged a naming ceremony1%
Arranged a renewal of vows ceremony0%
Arranged a commitment ceremony0%
0% 5% 10% 15% 20% 25% 30% 35% 40% 45%
A One Stop Shop3%
A Register Office4%
A library5%
Internet7%
Other - please specify below10%
A professional (eg, hospital, doctor, midwife, coroner, funeral directors)10%
South Gloucestershire Council website13%
Friends and family15%
I was not aware of the South Gloucestershire Registration Service42%
Page 25
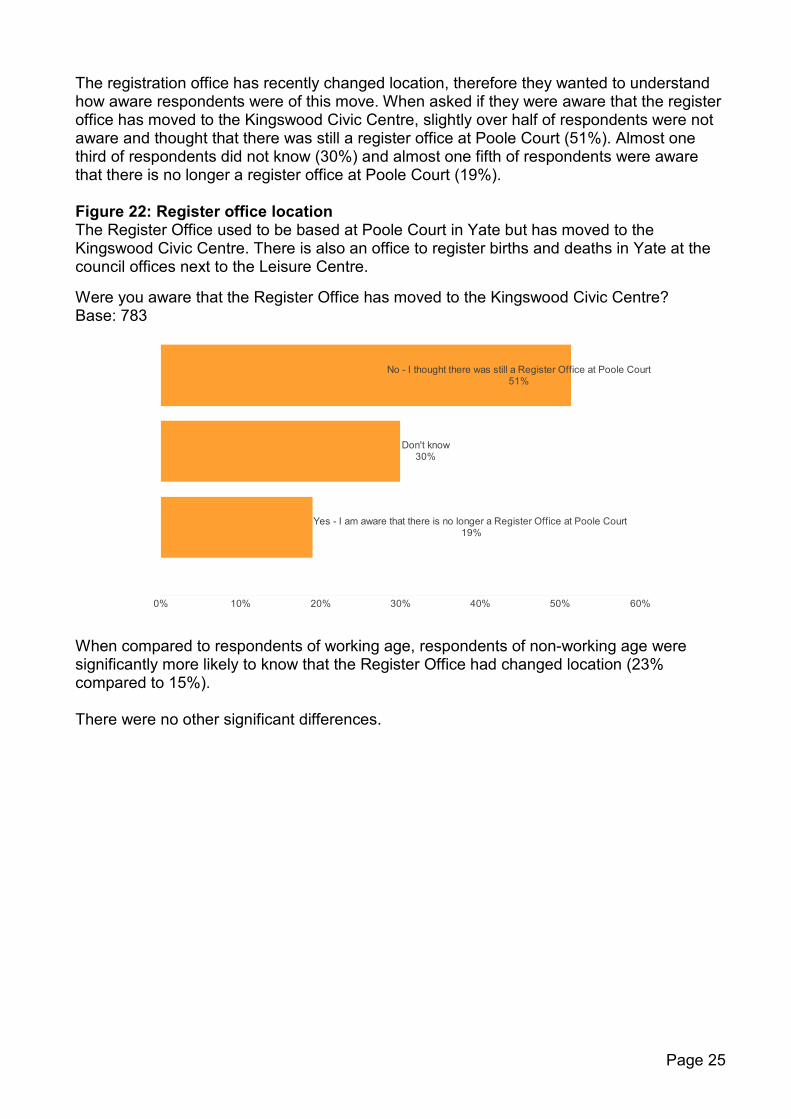
The registration office has recently changed location, therefore they wanted to understand how aware respondents were of this move. When asked if they were aware that the register office has moved to the Kingswood Civic Centre, slightly over half of respondents were not aware and thought that there was still a register office at Poole Court (51%). Almost one third of respondents did not know (30%) and almost one fifth of respondents were aware that there is no longer a register office at Poole Court (19%). Figure 22: Register office location The Register Office used to be based at Poole Court in Yate but has moved to the Kingswood Civic Centre. There is also an office to register births and deaths in Yate at the council offices next to the Leisure Centre.
Were you aware that the Register Office has moved to the Kingswood Civic Centre? Base: 783 When compared to respondents of working age, respondents of non-working age were significantly more likely to know that the Register Office had changed location (23% compared to 15%). There were no other significant differences.
0% 10% 20% 30% 40% 50% 60%
Yes - I am aware that there is no longer a Register Office at Poole Court 19%
Don't know30%
No - I thought there was still a Register Office at Poole Court51%
Page 26
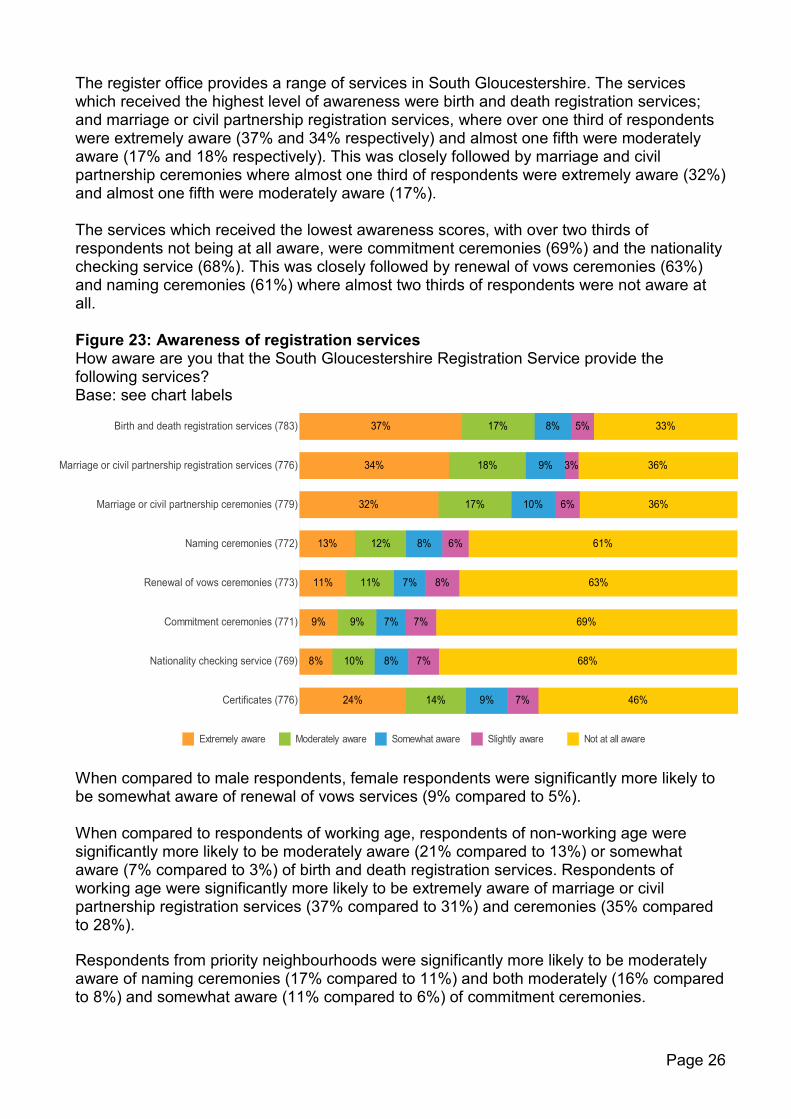
The register office provides a range of services in South Gloucestershire. The services which received the highest level of awareness were birth and death registration services; and marriage or civil partnership registration services, where over one third of respondents were extremely aware (37% and 34% respectively) and almost one fifth were moderately aware (17% and 18% respectively). This was closely followed by marriage and civil partnership ceremonies where almost one third of respondents were extremely aware (32%) and almost one fifth were moderately aware (17%). The services which received the lowest awareness scores, with over two thirds of respondents not being at all aware, were commitment ceremonies (69%) and the nationality checking service (68%). This was closely followed by renewal of vows ceremonies (63%) and naming ceremonies (61%) where almost two thirds of respondents were not aware at all. Figure 23: Awareness of registration services How aware are you that the South Gloucestershire Registration Service provide the following services? Base: see chart labels
When compared to male respondents, female respondents were significantly more likely to be somewhat aware of renewal of vows services (9% compared to 5%). When compared to respondents of working age, respondents of non-working age were significantly more likely to be moderately aware (21% compared to 13%) or somewhat aware (7% compared to 3%) of birth and death registration services. Respondents of working age were significantly more likely to be extremely aware of marriage or civil partnership registration services (37% compared to 31%) and ceremonies (35% compared to 28%). Respondents from priority neighbourhoods were significantly more likely to be moderately aware of naming ceremonies (17% compared to 11%) and both moderately (16% compared to 8%) and somewhat aware (11% compared to 6%) of commitment ceremonies.
Birth and death registration services (783)
Marriage or civil partnership registration services (776)
Marriage or civil partnership ceremonies (779)
Naming ceremonies (772)
Renewal of vows ceremonies (773)
Commitment ceremonies (771)
Nationality checking service (769)
Certificates (776)
34% 18% 9% 3% 36%
11% 11% 7% 8% 63%
13% 12% 8% 6% 61%
37% 17% 8% 5% 33%
32% 17% 10% 6% 36%
9% 9% 7% 7% 69%
8% 10% 8% 7% 68%
24% 14% 9% 7% 46%
Extremely aware Moderately aware Somewhat aware Slightly aware Not at all aware
Page 27
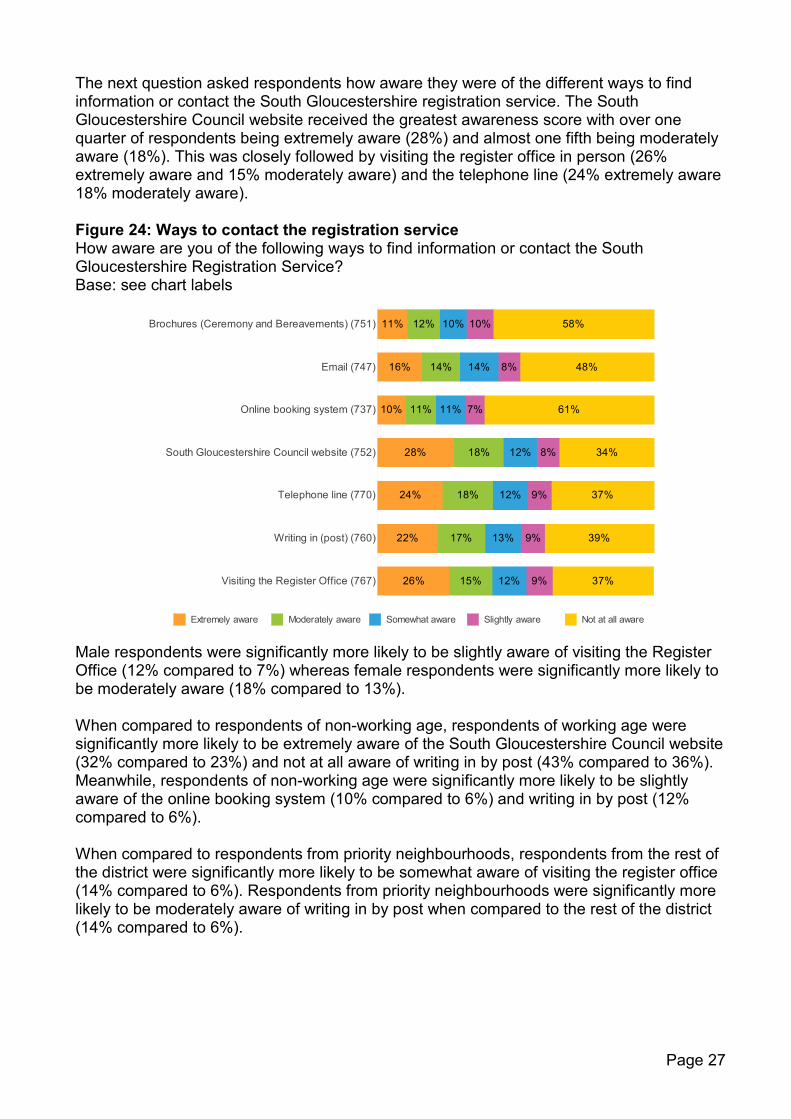
The next question asked respondents how aware they were of the different ways to find information or contact the South Gloucestershire registration service. The South Gloucestershire Council website received the greatest awareness score with over one quarter of respondents being extremely aware (28%) and almost one fifth being moderately aware (18%). This was closely followed by visiting the register office in person (26% extremely aware and 15% moderately aware) and the telephone line (24% extremely aware 18% moderately aware). Figure 24: Ways to contact the registration service How aware are you of the following ways to find information or contact the South Gloucestershire Registration Service? Base: see chart labels Male respondents were significantly more likely to be slightly aware of visiting the Register Office (12% compared to 7%) whereas female respondents were significantly more likely to be moderately aware (18% compared to 13%). When compared to respondents of non-working age, respondents of working age were significantly more likely to be extremely aware of the South Gloucestershire Council website (32% compared to 23%) and not at all aware of writing in by post (43% compared to 36%). Meanwhile, respondents of non-working age were significantly more likely to be slightly aware of the online booking system (10% compared to 6%) and writing in by post (12% compared to 6%). When compared to respondents from priority neighbourhoods, respondents from the rest of the district were significantly more likely to be somewhat aware of visiting the register office (14% compared to 6%). Respondents from priority neighbourhoods were significantly more likely to be moderately aware of writing in by post when compared to the rest of the district (14% compared to 6%).
Brochures (Ceremony and Bereavements) (751)
Email (747)
Online booking system (737)
South Gloucestershire Council website (752)
Telephone line (770)
Writing in (post) (760)
Visiting the Register Office (767)
10% 11% 11% 7% 61%
24% 18% 12% 9% 37%
28% 18% 12% 8% 34%
26% 15% 12% 9% 37%
11% 12% 10% 10% 58%
22% 17% 13% 9% 39%
16% 14% 14% 8% 48%
Extremely aware Moderately aware Somewhat aware Slightly aware Not at all aware
Page 28
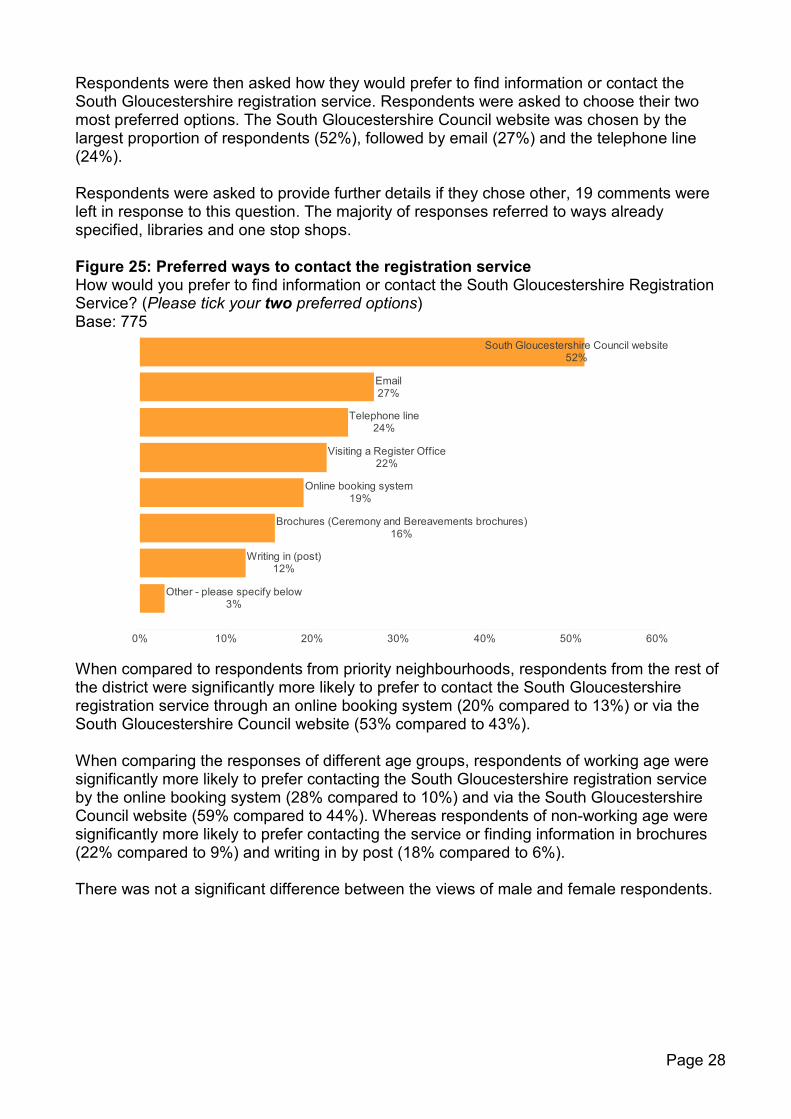
Respondents were then asked how they would prefer to find information or contact the South Gloucestershire registration service. Respondents were asked to choose their two most preferred options. The South Gloucestershire Council website was chosen by the largest proportion of respondents (52%), followed by email (27%) and the telephone line (24%). Respondents were asked to provide further details if they chose other, 19 comments were left in response to this question. The majority of responses referred to ways already specified, libraries and one stop shops. Figure 25: Preferred ways to contact the registration service How would you prefer to find information or contact the South Gloucestershire Registration Service? (Please tick your two preferred options) Base: 775 When compared to respondents from priority neighbourhoods, respondents from the rest of the district were significantly more likely to prefer to contact the South Gloucestershire registration service through an online booking system (20% compared to 13%) or via the South Gloucestershire Council website (53% compared to 43%). When comparing the responses of different age groups, respondents of working age were significantly more likely to prefer contacting the South Gloucestershire registration service by the online booking system (28% compared to 10%) and via the South Gloucestershire Council website (59% compared to 44%). Whereas respondents of non-working age were significantly more likely to prefer contacting the service or finding information in brochures (22% compared to 9%) and writing in by post (18% compared to 6%). There was not a significant difference between the views of male and female respondents.
0% 10% 20% 30% 40% 50% 60%
Other - please specify below3%
Writing in (post)12%
Brochures (Ceremony and Bereavements brochures)16%
Online booking system 19%
Visiting a Register Office22%
Telephone line24%
Email27%
South Gloucestershire Council website52%

Page 29
When asked how they would prefer to apply for a birth, death, marriage or civil partnership certificate, almost half of respondents would prefer to use an online application form (48%) and over two fifths preferred a paper application form (45%). Seven percent of respondents chose other and 50 comments were left in response to this question. The majority of comments referred to preferring to visit the register office and doing this in person. Figure 26: Preferred ways to apply for a certificate How would you prefer to apply for a birth, death, marriage or civil partnership certificate? (Please tick one option) Base: 780 Respondents of working age were significantly more likely to prefer using an online application to apply for a certificate (61% compared to 35%), whereas respondents of non-working age were significantly more likely to prefer a paper application for (58% compared to 31%). When compared to female respondents, male respondents were significantly more likely to prefer an online application form (52% compared to 44%). Respondents from priority neighbourhoods were significantly more likely to prefer to apply for a certificate using a paper application form (59% compared to 42%) whereas respondents from the rest of the district preferred an online application form (51% compared to 32%).
0% 5% 10% 15% 20% 25% 30% 35% 40% 45% 50%
Other - please specify below7%
Paper application form45%
Online application form - this option is not currently available48%

Page 30
The next question asked respondents whether the following aspects were important when visiting the register office. The majority of respondents agreed with all aspects, with the level of agreement being fairly consistent across all areas (between 53% and 63%). Figure 27: Aspects of the registration service We have previously asked our customers what things were most important to them when they have needed to use the registration service. The following elements were highlighted as most important to most people.
How strongly do you agree or disagree that the following aspects of the registration service are important? Base: see chart labels When comparing the responses of both genders, female respondents were significantly more likely to agree, whereas, male respondents were significantly more likely to neither agree nor disagree with all statements, with the exception of the final statement. When comparing the responses of different age groups, respondents of working age were significantly more likely to agree that the level of professionalism (87% compared to 82%), services running to time (86% compared to 81%) and the clarity of explanations (88% compared to 83%) were important. Respondents of non-working age were significantly more likely to neither agree nor disagree with the level of professionalism (18% compared to 13%) and the clarity of explanations (17% compared to 12%) being important. For the final two statements, respondents from priority neighbourhoods were significantly more likely to neither agree nor disagree (20% compared to 13%, and 21% compared to 13% respectively), while respondents from the rest of the district were significantly more likely to agree (87% compared to 80%, and 86% compared to 79% respectively).
The level of professionalism and knowledge shown bystaff (771)
How friendly and helpful the staff are (772)
The ability of staff to be efficient and keep servicesrunning to time (770)
The clarity and accuracy of our answers to yourquestions (769)
The clarity of our explanations as to how to access / useour services (766)
63% 22% 15%
60% 25% 15%
53% 30% 16%1%
55% 30% 15%0%
61% 25% 14%
Strongly agree
Agree
Neither agree nor disagree
Disagree
Strongly disagree

Page 31
Respondents were asked if they had any other comments about registration services. 118 comments were left in response to this question. The most frequently mentioned themes were that they have not had to contact the registration service before or were unaware of the service (36), miscellaneous comments (19) and other comments about the service (19). This was followed by the survey increased their knowledge or that they did not know the office had moved (14), positive comments about the service (14) and that they were not aware of the South Gloucestershire registration service and thought they had to go to Bristol or London (10). The other comments are mentioned in the graph below. Figure 28: Any other comments Please use this space to make any other comments about registration services in South Gloucestershire: Base: 118
36
19 19
14 14
10 9
6 53
1 1
0
5
10
15
20
25
30
35
40

Page 32
7 Appendix The table below shows the sample profile prior to weighting. Table 1: Sample profile
Unweighted sample base Unweighted %
Sample base 804 100%
Priority neighbourhoods and rest of district
Kingswood 49 6.1%
Filton 34 4.2%
Yate & Dodington 28 3.5%
Staple Hill 27 3.4%
Cadbury Heath 16 2.0%
Patchway 10 1.2%
Rest of district 640 79.6%
Gender
Male 501 62.3%
Female 288 35.8%
Prefer not to say 15 1.9%
Age group
16-24 1 0.1%
25-34 18 2.2%
35-44 78 9.7%
45-64 292 36.3%
65+ 414 51.5%
Prefer not to say 1 0.1%
Ethnicity
White 743 92.4%
BME 16 2.0%
Prefer not to say 45 5.6%