Embed Size (px)
Citation preview

Canadian Securities Administrators
Performance Report Testing
Prepared by:Allen Research CorporationFebruary, 2011
ARC – Allen Research Corporation 2
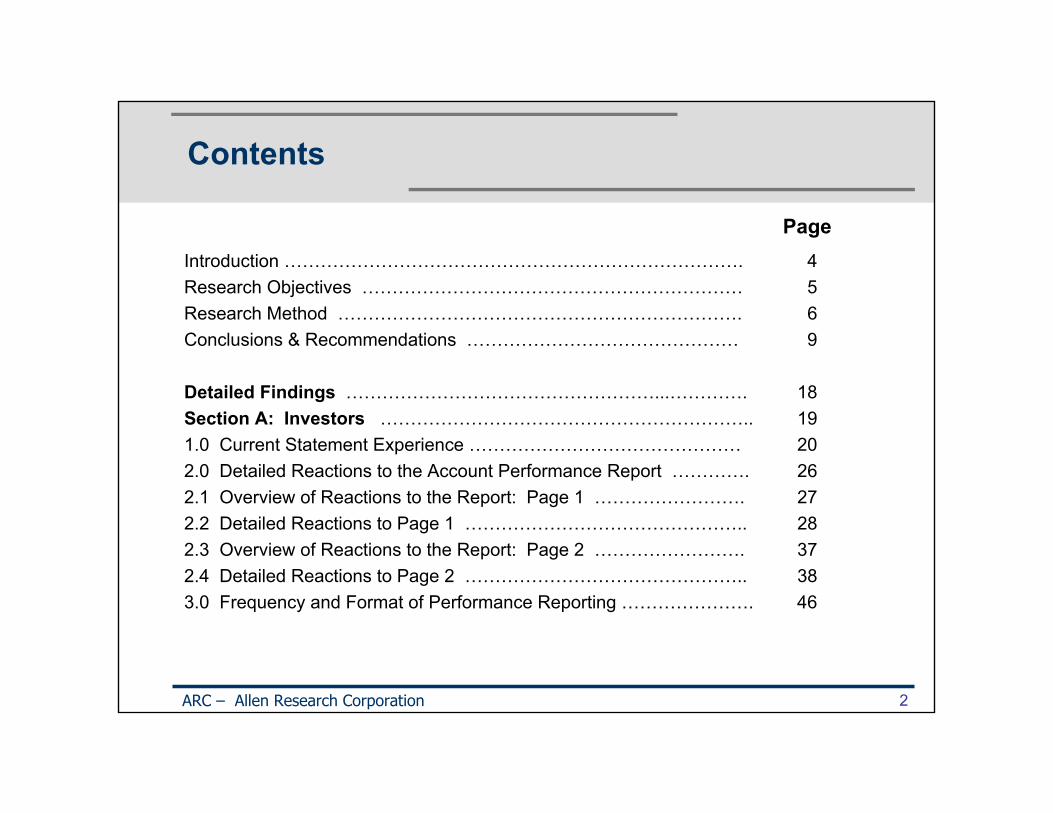
Introduction …………………………………………………………………. 4Research Objectives ……………………………………………………… 5Research Method …………………………………………………………. 6Conclusions & Recommendations ……………………………………… 9
Detailed Findings ……………………………………………...…………. 18Section A: Investors …………………………………………………….. 191.0 Current Statement Experience ……………………………………… 202.0 Detailed Reactions to the Account Performance Report …………. 262.1 Overview of Reactions to the Report: Page 1 ……………………. 272.2 Detailed Reactions to Page 1 ……………………………………….. 282.3 Overview of Reactions to the Report: Page 2 ……………………. 372.4 Detailed Reactions to Page 2 ……………………………………….. 383.0 Frequency and Format of Performance Reporting …………………. 46
Contents
Page

Contents cont’d
Section B: Registrants ……………………………………………………….. 474.0 Overview of Reactions of Registrants of Performance Report ………. 484.1 Detailed Reactions to Page 1 ……………………………………………. 514.2 Overview of Registrants’ Reactions to Page 2 ………………………… 584.3 Detailed Reactions to Page 2 ……………………………………………. 595.0 Reactions of Exempt Market Dealers ………………………….………… 656.0 Reactions of Scholarship Plan Dealers ……………………………….. 677.0 Frequency and Format of Performance Reporting …………………….. 69Appendix …………………………………………………………………………. 70• Performance Reporting Test Document [English] ………………………. 71• Performance Reporting Test Document [French] ……………………….. 72
ARC – Allen Research Corporation 3

ARC – Allen Research Corporation 4
Introduction
• As part of the Client Relationship Model Project [CRM], the Canadian Securities Administrators [CSA] with the Investment Industry Regulatory Organization of Canada [IIROC] and the Mutual Fund Dealers Association of Canada [MFDA] have been working to harmonize requirements in a number of key areas relating to the client relationship between retail investors and their dealers and advisers [registrants]. Initial stages of this work resulted in requirements in National Instrument 31-103 Registration Requirements and Exemptions [NI 31-103], on relationship disclosure information and conflict of interest requirements, which came into effect September 28, 2009.
• CRM will address requirements for cost disclosure and performance reporting to clients by registrants. Its goal is to ensure that all clients of registered firms receive clear and complete disclosure of all costs associated with the products and services they receive and meaningful reporting on how their investments perform.
• The Ontario Securities Commission [OSC], in consultation with CSA staff, IIROC and the MFDA, developed a personalized, performance reporting document that reflects the CRM rule amendments. Document research was requested to evaluate the prototype document with retail investors and registrants.

ARC – Allen Research Corporation 5
• Research was requested to evaluate among investors –Their current experience in receiving performance informationThe level of understanding of the performance report documentThe usefulness of the document in communicating how well an investment account is performing Clarity and understanding of specific termsUsefulness of charts and graphsUsefulness and understanding of benchmarks and ability to use them Overall appeal of the document
• And to evaluate among registrants –Their perceptions of how well investors will understand the documentIts usefulness and clarityHow they might use the information
• The performance report was tested in both English and French to ensure clarity in both official languages.
Research Objectives

ARC – Allen Research Corporation 6
Research Method
Investors• 18 one-on-one document interviews, 12 in Toronto and 6 in Montreal, were completed.
Investors were recruited by ARC.
• Metropolitan Toronto, January 27, 28, 31, 2011• Montreal, Quebec, February 1, 2, 2011.
Male Female Level of knowledgeToronto Naïve Moderate Sophisticated
12 8 4 4 4 4
Montreal6 4 2 3 2 1
Total [18] 12 6 7 6 5
InvestmentsHeld
GICs Bonds Stocks Mutual funds
ScholarshipPlan
Toronto 6 6 11 11 3
Montreal 2 2 4 3 1

ARC – Allen Research Corporation 7
Research Method cont’dRegistrants• 15 one-on-one in-depth interviews were completed with registrants, 9 in Toronto
and 6 in Montreal. • The staff from the registrants were representatives or advisers who have direct
relationships with clients. Four of the registrants in Toronto brought additional staff with them, usually legal counsel, a compliance officer or IT professionals. In Montreal, one respondent was a compliance officer who dealt with clients only if they had a complaint.
• Registrants were recruited by ARC with the assistance of the regulators.• Toronto, January 28, 31, and February 7, 2011; Montreal, February 1, 2, 2011.• In the report EMD means Exempt Market Dealer; ID, Investment Dealer; MF,
Mutual Fund Dealer; N/A, not attributed, PM, Portfolio Manager; SPD, Scholarship Dealer.
Toronto EMD IIROC MF PM SPD
9 2 2 2 2 1
Montreal
6 0 2 2 2 0
15 2 4 4 4 1

ARC – Allen Research Corporation 8
The findings of this report are based on qualitative research. Because of the exploratory nature of the technique and the small sample size, findings may not be generalizable to the target populations as a whole. Rather they constitute hypotheses to be used as a guide to judgment or as the basis for further quantitative research.
Performance ReportingConclusions & Recommendations

ARC – Allen Research Corporation 10
Conclusions & Recommendations
• Investors were surprised by the performance information which is new to them and much valued even if not always correctly understood. Many registrants noted that they can provide a great deal of information if clients ask for it; but many clients do not know what to ask for. The performance report helps here substantially.
• Many investors particularly liked the simplicity and brevity of the report. They wanted to receive the performance report quarterly as a separate report from their current lengthy statements. There is a possibility that many will read only the performance report.
• By contrast, many registrants liked the concepts involved in the performance report, but believe the simplicity of the report may be misleading. Often their issues were substantive and need to be considered in drawing up the rules for performance reporting.
• Detailed comment on the issues of both segments can be found in the report. The comments below highlight the most important issues.
Investors reacted positively to the concepts in the performance report as did many registrants, but for different reasons. In both segments many would like to see performance reporting as part of their communications, but both segments also want a number of revisions.

Conclusions & Recommendations cont’d
Page 1• Overall, for investors the ideal performance report would have considerably less
text and be reduced to one page. Registrants would also like the text to be considerably reduced especially on page 2. Both investors and registrants like the references to financial advisers.
• Masthead – add qualifier to date, e.g., ‘Up to December 31, 2010’• The ‘Total value summary’ is much liked and many investors want both the text
and the bar graph, but many jump to the conclusion that the bar graph shows large gains in their account and very good performance. They fail to do the arithmetic showing it covers a 12-year period.
• Many registrants thought the bar graph was too simple. It fails to show fluctuations over time. A line graph would be preferred.
• At a minimum the graph should be titled to the effect that it shows ‘Past 12-year performance’.
• English investors understand the margin note on ‘Net amount invested’, but French speakers find it more challenging. It may be that more punctuation or blocking can help. Investors much like the concept. Registrants on the other hand, believe this number will be difficult to calculate if going back many years.
ARC – Allen Research Corporation 11

Conclusions & Recommendations cont’d
• ‘Change in the value of your account’ was also much liked by both segments, but presented some easily fixed problems.
The heading of the first column should be relabeled to indicate the period covered, e.g., Jan. 1 – Dec. 31, 2010’ or ‘This past year’. The second column was especially liked by investors. Registrants do not object to giving it, but again it will be difficult for many to do so. Regulators may want to consider how to define origin of the account, since opening the account, since joining the current firm, a reset permitted if certain activities occur.The line ‘Net amount invested’ should be added to match the number $16,300 found in the total value summary and further clarify the meaning of the term.Neither investors nor registrants understand in French or English ‘Increase or decrease in the value of your investments’. Investors would like to see interest and dividends as a separate line; some registrants would combine them with the last line. They liked the idea of ‘realized and unrealized capital gains’ – a phrase many investors would not understand. The last line may be clearer if it read ‘Increase and decrease in the market value of your investments. Some registrants would also like to see fees added to the table.
ARC – Allen Research Corporation 12
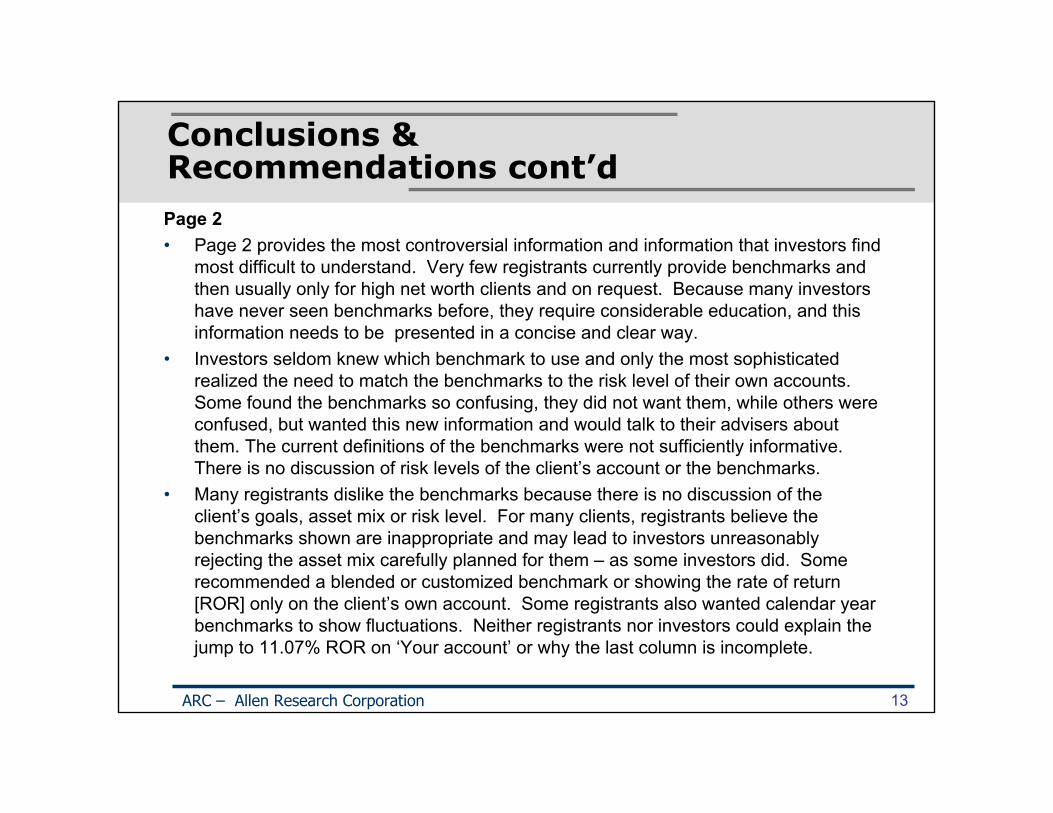
Conclusions & Recommendations cont’dPage 2• Page 2 provides the most controversial information and information that investors find
most difficult to understand. Very few registrants currently provide benchmarks and then usually only for high net worth clients and on request. Because many investors have never seen benchmarks before, they require considerable education, and this information needs to be presented in a concise and clear way.
• Investors seldom knew which benchmark to use and only the most sophisticated realized the need to match the benchmarks to the risk level of their own accounts. Some found the benchmarks so confusing, they did not want them, while others were confused, but wanted this new information and would talk to their advisers about them. The current definitions of the benchmarks were not sufficiently informative. There is no discussion of risk levels of the client’s account or the benchmarks.
• Many registrants dislike the benchmarks because there is no discussion of the client’s goals, asset mix or risk level. For many clients, registrants believe the benchmarks shown are inappropriate and may lead to investors unreasonably rejecting the asset mix carefully planned for them – as some investors did. Some recommended a blended or customized benchmark or showing the rate of return [ROR] only on the client’s own account. Some registrants also wanted calendar year benchmarks to show fluctuations. Neither registrants nor investors could explain the jump to 11.07% ROR on ‘Your account’ or why the last column is incomplete.
ARC – Allen Research Corporation 13

Conclusions & Recommendations cont’d
• Regulators should consider finding a compromise that will begin the education of investors in the use of benchmarks without confusing or misleading them.
• Suggestions include revising the current table by --Showing ROR for the client’s account plus one benchmark closest to the client’s risk level if a customized benchmark is not available.Adding a sentence or two on the client’s goals, risk level, and asset mix and providing a brief sentence explaining the results of the comparison.Relabeling the columns since investors read the years backwards.Showing calendar years and completing the final column [Regulators may want to require past 5 years, 7 years, or 10 years. Calendar years for 30-year old accounts would not be reasonable, easy to read or necessarily helpful to clients.]Referring investors to their financial adviser for a full discussion of their account’s performance.
• Several registrants would also prefer a T-Bill index to a GIC Index; many wanted a global and US index added since the TSX makes up such a small percentage of world markets. Registrants also wanted the currency used explained.
ARC – Allen Research Corporation 14

Conclusions & Recommendations cont’d
Text• Detailed comment on the text on page 2 is available in the report [pp. 58-64].
Broader comments are given below.• In the text, it might be helpful to put differences between benchmarks and the
client’s account in a table or bullet points.• ‘Annual compound rate of return’ needs to be defined briefly.• The definitions of the benchmarks need to be revised to be more factual,
informative, and concise. They might be relegated to the margin or a footnote.• Investors jumped to the table before looking at the text. It might be helpful to put
the table first.• The margin note referring to the Dietz method is controversial. Several investors
and registrants wanted this note, even though they don’t understand it. It reassures them there is a standard method, but others find it confusing and don’t want it. Furthermore, several firms do not use it. It might be easier to explain the main difference between time-weighted and dollar-weighted rates of return and state which method is used here.
• In the French prototype, readers had little difficulty with the words chosen with the exception of ‘mouvements’ and ‘l’exercice’ in the ‘Change in the value of your account’. Clearer vocabulary might be used.
ARC – Allen Research Corporation 15

Conclusions & Recommendations cont’d
• Both segments wanted the performance report to appear quarterly though a few think annually is sufficient. Investors wanted it separate from their regular statement [though in the same envelope] while registrants wanted the two to be integrated.
• Regulators should consider an integrated report, with a recommendation that the performance reporting be at the beginning of the statement so that investors can find it easily. Hopefully this integration will encourage ownership of the performance report by firms and lead investors directly into their regular statements, encouraging them to read more of their regular statements. Few people today want more pieces of paper.
• Of those asked, investors and registrants said they wanted performance reporting by each account. A few are interested in reporting by household account, but still want to see individual accounts too.
ARC – Allen Research Corporation 16

Conclusions & Recommendations cont’d
• There is no doubt that these changes will be difficult and expensive for firms to implement, though many of the larger firms are already well on their way. Regulators may want to consider phasing in the changes over time or initially limiting them to a certain size of account – perhaps $100,00 plus – or to apply to accounts only after year 2.
ARC – Allen Research Corporation 17
With the performance report, Canada’s regulators have started a valuable discussion with registrants which promises to provide enhanced communication value for investors and registrants alike.

Detailed Findings

Section A: Investors

1.0 Current Statement Experience

Current Statement Experience
• There was very little difference in statement experience between investors in Montreal and Toronto. Where there are differences they are identified in the report.
• Investors in this research in both cities have a variety of accounts usually with more than one type of investment vehicle –
Stocks, mutual funds, and GICsStocks, mutual funds, bonds, and GICsStocks, mutual funds, bondsStocks, mutual fundsMutual funds, bonds
• Only a very few have stocks only or bonds only or deal only with one financial institution. Some also have Tax-Free Savings Accounts or scholarship plans.
• As a result, many receive multiple statements, often monthly and quarterly as well as, in some cases, an annual report or meeting with their adviser.
• Investors report spending as little as 5 minutes with their statements – usually GICsor mutual funds or as long as 30 minutes. Some of those spending the least time with their paper statement, however, are also going online.
• Investors mainly check whether their investments have gone up or down. A few of those more knowledgeable check their asset mix or dividends and interest paid.
ARC – Allen Research Corporation 21

Current Experience cont’d
• Several said there is no difference between a ‘report’ and a ‘statement’. Some said they get monthly or quarterly statements, but an annual report that is more detailed.
• Some describe a ‘statement’ as current account reporting or day-to-day transactions or a description of the investments they own and current value of their account.
• These investors describe a ‘report’ as more detailed. It gives a more over time update, but usually for one year.
• In the interviews, investors frequently mixed the two terms.• Overall many describe their statements as sometimes confusing and some always
find them difficult. “I understand 70% to 80% of them.”“I find the statement hard to read. I call customer service a lot.”“I have some confusion about my statements. I have to work at it. I’dlike a better presentation.”
“They’re adequate, but they can be ambiguous.”
ARC – Allen Research Corporation 22

Current Experience cont’d
• Based on this small sample, the worst statements may be those provided by scholarship plans.
“The scholarship statement is very ambiguous and involved.”“It’s not clear. I’m not sure how the government investment works.”
• Those with accounts with some of the larger firms like their statements and usually find them informative, though sometimes too detailed.
• Several of these investors receive paper statements but also go online to check their accounts more often. Only one respondent receives only online statements.
• An important point to note is that many of these investors do not know what ‘performance reporting’ consists of, nor do they always understand ’book value’. Several said they did receive performance reporting, but when queried they meant they received last month’s or last quarter’s real numbers. A few of the more sophisticated use ‘book value’ as a point of comparison against current market value for performance. They also take ‘book value’ as a measure for ‘point of inception’.
ARC – Allen Research Corporation 23

Current Experience cont’d
• Very few actually receive a percentage ROR. Some who claimed they did meant the interest rate on their GICs. A few said they did receive a percentage ROR quarterly or semi-annually; a few others said they got an ROR on mutual funds. A few others with major firms said they received performance reporting on real numbers but not as a percentage.
• Even fewer actually receive statements showing value at inception, though again some use book value for this. Investors do receive this information on GICs and scholarship plans. A few report that they do so on mutual funds.
• A prime source, however, seems to be online accounts which provide much more detailed information. Several online users said they could get from inception information online and a few said they can get a percentage ROR online too.
ARC – Allen Research Corporation 24

Current Experience cont’d
• Among these investors, none reported receiving benchmarks with few exceptions.“[My statement] showed me what other institutions are paying. I checked and it’s true.”“If I want to see how my account’s performance compared to the rest of the market, I go to Google.”
• Also important is the finding that investors, even the more sophisticated, do not always know what they can or should ask for. After seeing the prototype report, one sophisticated investor remarked –
“I don’t understand my reports as well as I thought. I don’t have these things. I’m confused.”
ARC – Allen Research Corporation 25
2.0 Detailed Reactions to the Account Performance Report

2.1 Overview of Reactionsto the Report: Page 1
• Overall investors very much liked the account performance report. It was described as short – some even wanted it reduced to one page – clearly written in plain language, and it offered most of them information they do not currently receive.
• While there were mixed feelings about the introduction, many wanted the ‘Total value summary’ including both text and graph. The graph, however, encouraged many investors to jump to the conclusion that their accounts were doing very well without considering the time frame. Some sophisticated investors thought the graph too simple because it does not show a timeline or fluctuations over time.
• Reactions to the ‘Change in the value of your account’ were also positive, but with more confusion. Several investors did not understand that the first column represents January to December, 2010 and stumbled trying to understand what the $51k represented. The heading of the column is confusing. Some also looked for the $16,300 from the total value summary and were surprised not to find it. Finally very few understood the line item ‘Increase or decrease in the value of your investments’ either in French or English. At the same time the second column was highly valued; investors liked seeing the 12-year summary of the account from origin.
ARC – Allen Research Corporation 27
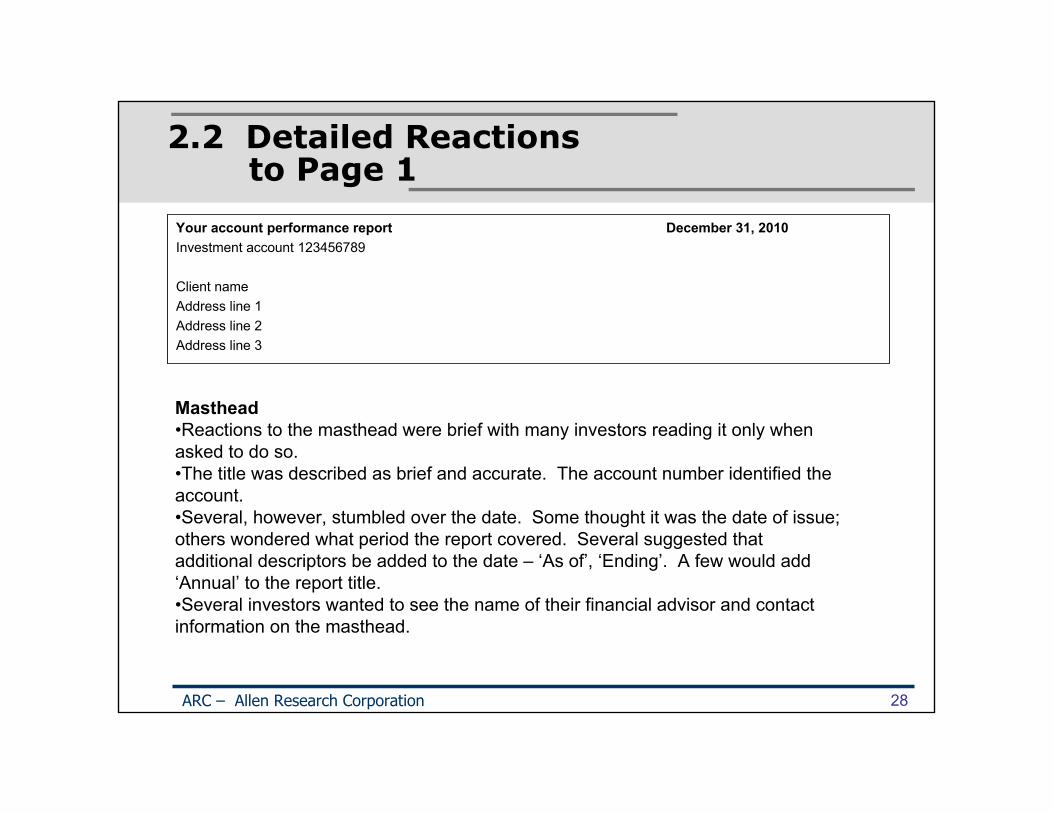
2.2 Detailed Reactions to Page 1
Your account performance report December 31, 2010Investment account 123456789
Client nameAddress line 1Address line 2Address line 3
ARC – Allen Research Corporation 28
Masthead•Reactions to the masthead were brief with many investors reading it only when asked to do so.•The title was described as brief and accurate. The account number identified the account.•Several, however, stumbled over the date. Some thought it was the date of issue; others wondered what period the report covered. Several suggested that additional descriptors be added to the date – ‘As of’, ‘Ending’. A few would add ‘Annual’ to the report title.•Several investors wanted to see the name of their financial advisor and contact information on the masthead.

Page 1 cont’d
This report tells you how your account has performed to December 31, 2010. This information can help you assess whether you are on track to meeting your investment goals. Speak to your adviser if you have questions about this report or how your account is doing.
You should also contact your adviser if your personal or financial situation, your investment goals or the amount of risk you’re comfortable with has changed. Your adviser can recommend any changes to your investments that may be needed to help you meet your goals.
ARC – Allen Research Corporation 29
• Reactions to the opening paragraphs were mixed. Some investors thought the information was not needed; others appreciated the reminder.
“This is standard. I don’t need it, but it should be there.”“It’s not useful….a given, maybe [needed] for others.”“It’s great but I don’t need this.”“I don’t need this. If my tooth hurts I go the dentist.”“I like this. If there’s an issue I can call my adviser.”
• Several investors also noted that if these paragraphs appeared too frequently they would stop reading them.
• A few wanted only paragraph 1. Some wanted less text.
Introduction

Page 1 cont’d
Introduction cont’d• The first sentence explains the date in the masthead and was appreciated by many,
though investors would rather have the date better described in the masthead.• A few found the second sentence of paragraph 1 unclear. They did not know how
the report could track whether they were meeting their goals. Some said they wanted to see their goals spelled out in the report.
“Where are my goals? Remind me please.”• The second paragraph was more valuable. Many said they knew they should
contact their adviser if anything changed, but others liked the reminder, and some seemed surprised by it. They were not entirely sure what personal changes would apply.
• Investors liked the recommendations to speak to their adviser and did not think they were too repetitive –
“It says your adviser is there for you.”
ARC – Allen Research Corporation 30
Page 1 cont’d
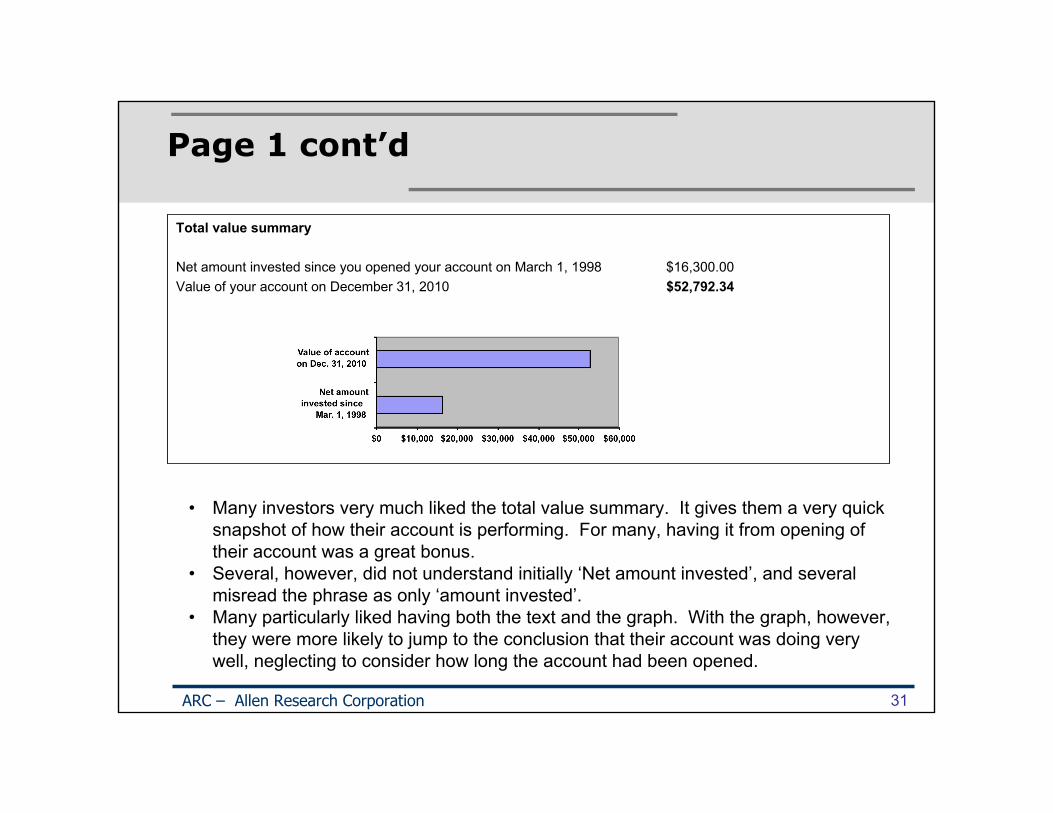
Total value summary
Net amount invested since you opened your account on March 1, 1998 $16,300.00Value of your account on December 31, 2010 $52,792.34
ARC – Allen Research Corporation 31
• Many investors very much liked the total value summary. It gives them a very quick snapshot of how their account is performing. For many, having it from opening of their account was a great bonus.
• Several, however, did not understand initially ‘Net amount invested’, and several misread the phrase as only ‘amount invested’.
• Many particularly liked having both the text and the graph. With the graph, however, they were more likely to jump to the conclusion that their account was doing very well, neglecting to consider how long the account had been opened.

Page 1 cont’d
Total value summary cont’d“I want both. The words clarify what the graph is telling you, but the graph is the place to see it growing.”“I want to see both. The graph is based on data, but the visual is a picture of the data.”“The graph is a nice feature, a nice touch. It illustrates large increases. Keep both.”“I like the graphs and tables…so much easier to read.”
• A few investors in both cities did not want the graph. Some of these argued that the numbers speak for themselves or they do not like or understand graphs.
• A few of the more sophisticated investors said the graph was too simple, since it does not show fluctuations over time.
• Before examining page 2, a few also observed,“I seem to have done well, but could I have done better?”“It’s a fine result, but if I invested elsewhere I might have more.”
ARC – Allen Research Corporation 32
Page 1 cont’d
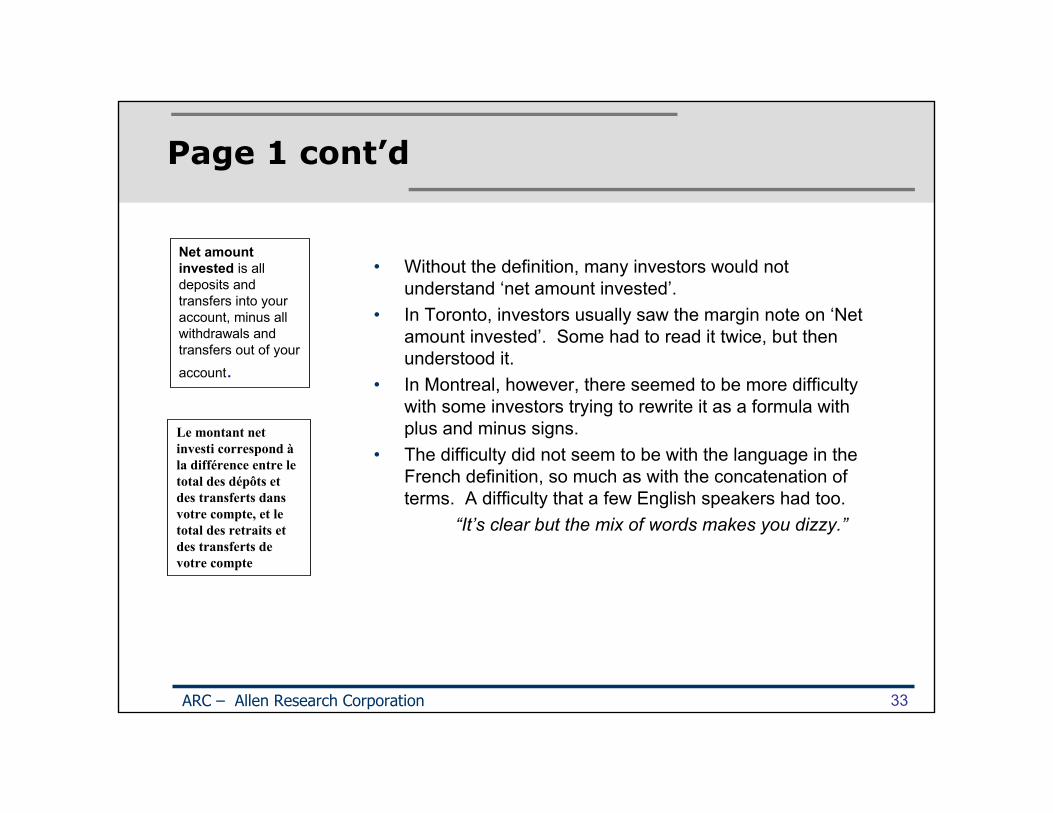
• Without the definition, many investors would not understand ‘net amount invested’.
• In Toronto, investors usually saw the margin note on ‘Net amount invested’. Some had to read it twice, but then understood it.
• In Montreal, however, there seemed to be more difficulty with some investors trying to rewrite it as a formula with plus and minus signs.
• The difficulty did not seem to be with the language in the French definition, so much as with the concatenation of terms. A difficulty that a few English speakers had too.
“It’s clear but the mix of words makes you dizzy.”
ARC – Allen Research Corporation 33
Net amount invested is all deposits and transfers into your account, minus all withdrawals and transfers out of your
account.
Le montant net investi correspond àla différence entre le total des dépôts et des transferts dansvotre compte, et le total des retraits et des transferts de votre compte

Page 1 cont’d
Change in the value of your account
This table is a summary of the activity in your account. It shows how the value of your account has changed based on the type of activity.
ARC – Allen Research Corporation 34
• The section ‘Change in the value of your account’ with its table was one of the most appreciated parts of the Performance Report though some revision is necessary. Many investors find the detailed transaction data they currently receive hard to read and much liked the summary. They also like that the table goes back to inception. Several said they do not have anything like this table.
“I like the idea of my journey since 1998, all the highlights, but it needs to be cleared up.”
A few wanted a zero here.

Page 1 cont’d
Change in the value of your account cont’d
• Investors did not understand the heading to column one and consequently were not sure where the $51k balance came from. They needed to understand that the Dec. 31, 2010 did not identify this balance, but rather January 1, 2010. The eye is tricked by the proximity of the date to the $51k, as well as by the content.
• A better title might be ‘Jan.1 – Dec. 31, 2010’ or ‘This past year’. Other headings are also possible.
• Some, but not all, investors looked for the $16,300 figure from the total value summary above, but could not find it. Once explained, it became very clear and also helped to clarify ‘Net amount invested’ if there was still any confusion.
• The CSA might consider adding this figure to the table, labeled ‘Net amount invested’.
ARC – Allen Research Corporation 35

Page 1 cont’d
Change in the value of your account cont’d• Investors had no trouble with ‘Deposits and transfers in’, ‘Withdrawals and transfer
out’, or ‘Interest and dividends’.• Almost all in both cities understood the parentheses as a minus sign.• The same was not true of ‘Increase or decrease in the value of your investments’/
‘Variation de la valeur de vos placements’. Some kept reading interest and dividends into this line – though they liked the separate record.
• ‘Gain or loss’ did not help. Understanding increased when rephrased as ‘the market value of your investments’.
• Investors very much liked column two since it gives a summary of activity over the 12-year period.
• In Montreal, there was some discussion that ‘mouvements’ in the first paragraph was not the right word for ‘activity’. ‘Activité’ may be a better term. A few also hesitated over ‘l’exercice’ without a ‘financial’ modifier.
ARC – Allen Research Corporation 36

2.3 Overview of Reactions to the Report: Page 2
• Reactions to Page 2 were much more mixed than those to Page 1, in part because of the density of text and in part because of the number of unknown terms – ‘annual compound rates of return’, ‘benchmark’, ‘market indexes’. Some investors said they would not read Page 2 --
“It’s too much.”“There’s so much information; I’d only retain 10% of it.”
• The margin note on the Dietz Method is not helpful though some wanted very much to see it.
• Investors had considerable trouble interpreting the table including ‘DEX Universe Bond Index’ , the sudden jump in the ROR of ‘Your account’ to 11.07%, and the blanks in the final column for the benchmarks. They also read the columns and years in the wrong order.
• Some investors thought the order of presentation of page 2 wrong. They wanted to see the table first; a few, the section ‘About the benchmarks’ first.
• At the end of the session, several investors wanted to keep the table which they valued very much even if they did not fully understand it, as well as many of the points in the text, though made more briefly. Several investors wanted to keep only the first line of the table, the ROR on their own account. Another group felt equally strongly that they did not want any of the benchmarks because they find them confusing and do not know what to do with the information.
ARC – Allen Research Corporation 37
2.4 Detailed Reactions to Page 2
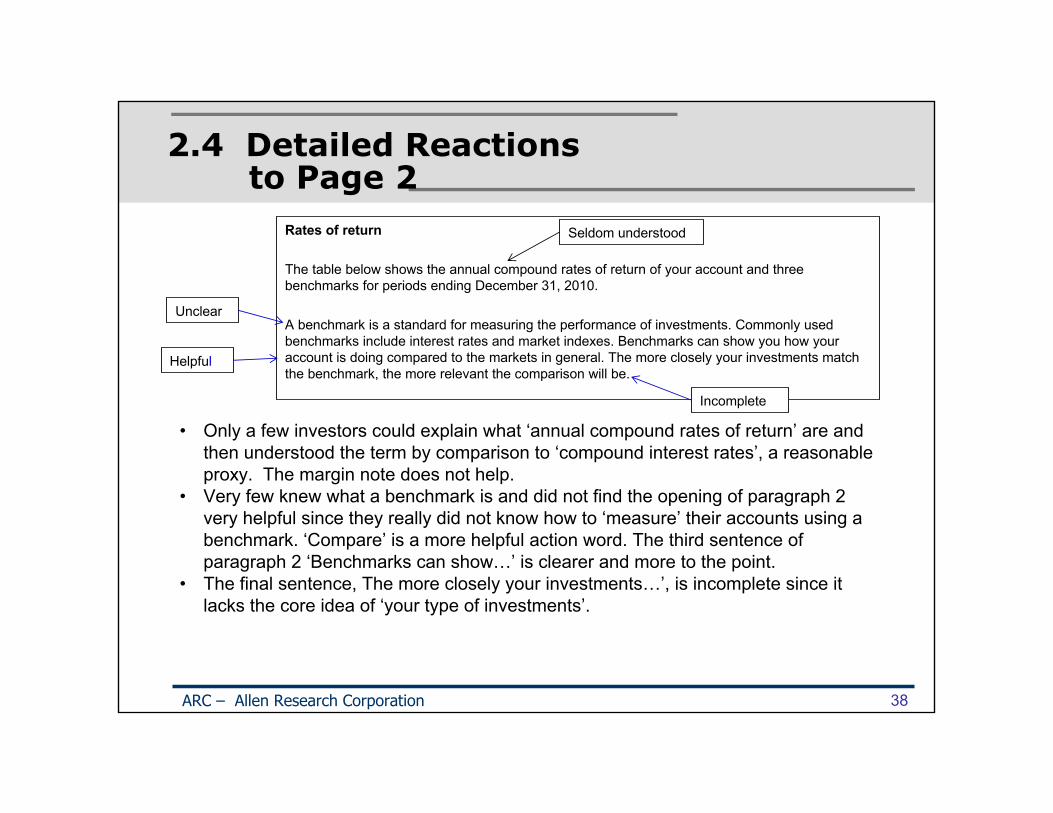
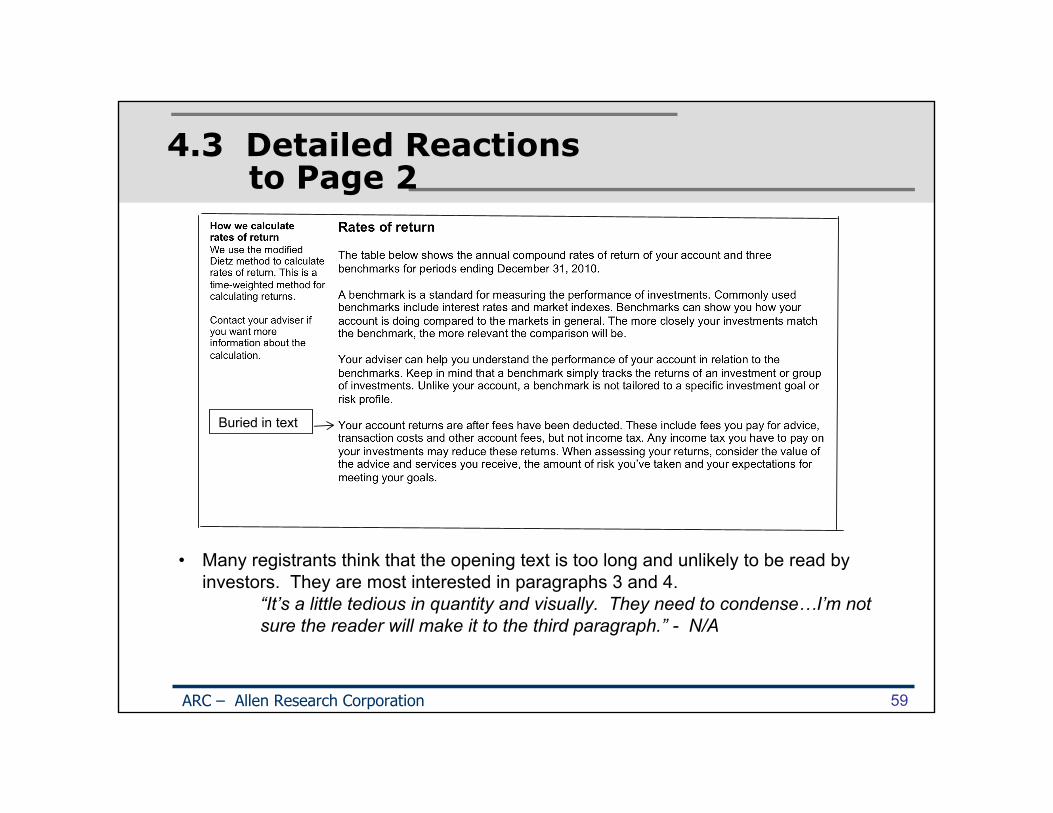
Rates of return
The table below shows the annual compound rates of return of your account and three benchmarks for periods ending December 31, 2010.
A benchmark is a standard for measuring the performance of investments. Commonly used benchmarks include interest rates and market indexes. Benchmarks can show you how your account is doing compared to the markets in general. The more closely your investments match the benchmark, the more relevant the comparison will be.
ARC – Allen Research Corporation 38
• Only a few investors could explain what ‘annual compound rates of return’ are and then understood the term by comparison to ‘compound interest rates’, a reasonable proxy. The margin note does not help.
• Very few knew what a benchmark is and did not find the opening of paragraph 2 very helpful since they really did not know how to ‘measure’ their accounts using a benchmark. ‘Compare’ is a more helpful action word. The third sentence of paragraph 2 ‘Benchmarks can show…’ is clearer and more to the point.
• The final sentence, The more closely your investments…’, is incomplete since it lacks the core idea of ‘your type of investments’.
Seldom understood
Unclear
Helpful
Incomplete

Page 2 cont’d
How we calculate rates of returnWe use the modified Dietz method to calculate rates of return. This is a time-weighted method for calculating returns.
Contact your adviser if you want more information about the calculation.
ARC – Allen Research Corporation 39
• None of the investors had heard of the modified Dietz method or of a time-weighted method for calculating returns.
• Some said they would rather not have the note since they could not understand it.
• Several investors, however, liked the note, though they did not know what the Dietz method was either. A few of them said they would Google the term.
“It’s very helpful. I feel like they’re trying to standardize…everybody on the same page.”“I want it if it has been used in my portfolio.”“It’s OK. I don’t know it, but it shows a way to do this.”“My company doesn’t just play with numbers, but has a method for everybody, so can compare.”“Drop it. I don’t understand it.”“It’s confusing.”
Page 2 cont’d
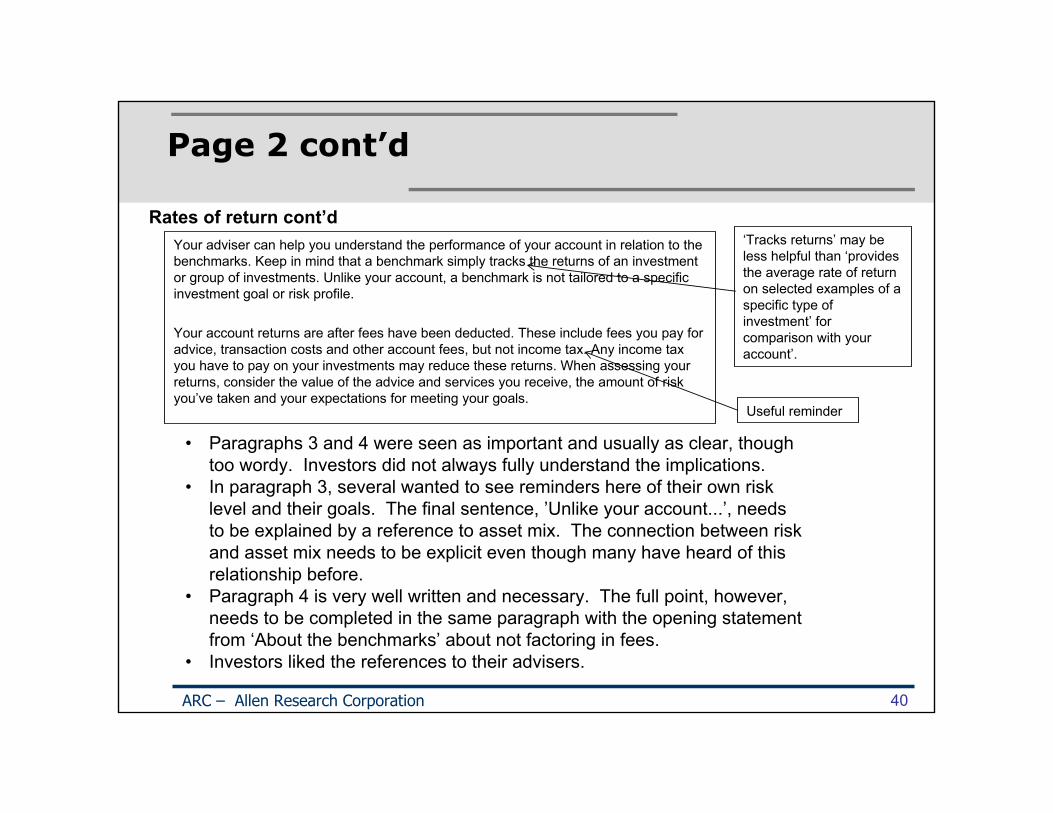
Your adviser can help you understand the performance of your account in relation to the benchmarks. Keep in mind that a benchmark simply tracks the returns of an investment or group of investments. Unlike your account, a benchmark is not tailored to a specific investment goal or risk profile.
Your account returns are after fees have been deducted. These include fees you pay for advice, transaction costs and other account fees, but not income tax. Any income tax you have to pay on your investments may reduce these returns. When assessing your returns, consider the value of the advice and services you receive, the amount of risk you’ve taken and your expectations for meeting your goals.
ARC – Allen Research Corporation 40
Rates of return cont’d
• Paragraphs 3 and 4 were seen as important and usually as clear, though too wordy. Investors did not always fully understand the implications.
• In paragraph 3, several wanted to see reminders here of their own risk level and their goals. The final sentence, ’Unlike your account...’, needs to be explained by a reference to asset mix. The connection between risk and asset mix needs to be explicit even though many have heard of this relationship before.
• Paragraph 4 is very well written and necessary. The full point, however, needs to be completed in the same paragraph with the opening statement from ‘About the benchmarks’ about not factoring in fees.
• Investors liked the references to their advisers.
‘Tracks returns’ may be less helpful than ‘provides the average rate of return on selected examples of a specific type of investment’ for comparison with your account’.
Useful reminder

Page 2 cont’d
• Investors were intrigued by the table and often jumped to it before reading the text. They found it difficult to understand. Many did not know what the benchmarks are, especially the DEX Universe Bond Index; the definitions follow the table, not precede it. Few associated different levels of risk with each benchmark and often did not stop to think about the asset mix of their own accounts or their own risk level.
• They did not understand that the years work backwards – over the past 10 years – and read them in the opposite order. The plethora of numbers was in itself confusing.
• Several were also confused by the sharp increase to 11.07%. The data do not seem to support it. They did not know why the RORs for the benchmarks were missing in the last and most important column.
ARC – Allen Research Corporation 41
Rate of Return Table Title for table needed. New headers needed, i.e., ‘over the past x years’
Confusing

Page 2 cont’d
• Given this confusion, many were unsure how to use the benchmarks to judge their accounts. Some said they would talk to their advisers. Others thought they should reconsider the types of investments they hold.
“I’d talk to my adviser.”“I don’t know how this applies to mutual funds.”“I don’t go for stocks, but maybe I feel I’m missing the boat…Maybe I should go with bonds. I feel maybe I should review my account.”
• Several said they only wanted to see the first line, the ROR on their own accounts.“The benchmarks are not that relevant. It’s tempting but instead I’m concerned about what my account did….It makes me feel stupid, so why go there.”“I’ve never had benchmarks. I don’t want them. The only thing useful is my ROR. I could use it for a conversation with my financial adviser and reconsider my investments.”
ARC – Allen Research Corporation 42
ROR Table cont’d

Page 2 cont’d
• Investors who understood the relationship of the benchmarks to risk and their own asset mix were also somewhat divided –
“It’s difficult to assess the ROR of my account on the table. There are a lot fluctuations. The benchmarks are far more profitable, but in my view they’re higher risk. I don’t exactly know if it is useful.”“I learned something today. I was least comfortable with my rate of return. It’s a good basis to do some proper comparisons.”“An interesting table. I can see if my adviser is doing a good job. I asked how I did compared to last year, but how really I don’t know. I love this. This is terrific. I like the comparison with the GIC – no risk, no fees. The S&P is too far removed from me, but the GIC is not. It did better, so what am I doing wrong? I’d ask my adviser.”“You should only have the index that is appropriate to your account.”
ARC – Allen Research Corporation 43
ROR Table cont’d

Page 2 cont’d
• A very few of the most sophisticated investors wanted the data year by year.“There are gaps in the data. Finance is very precise.”
• Few investors said that they receive benchmarks now. A few of these find them useful. Others say there are so many pages that they do not read the benchmarks at the end of their report.
ARC – Allen Research Corporation 44
ROR Table cont’d
Page 2 cont’d
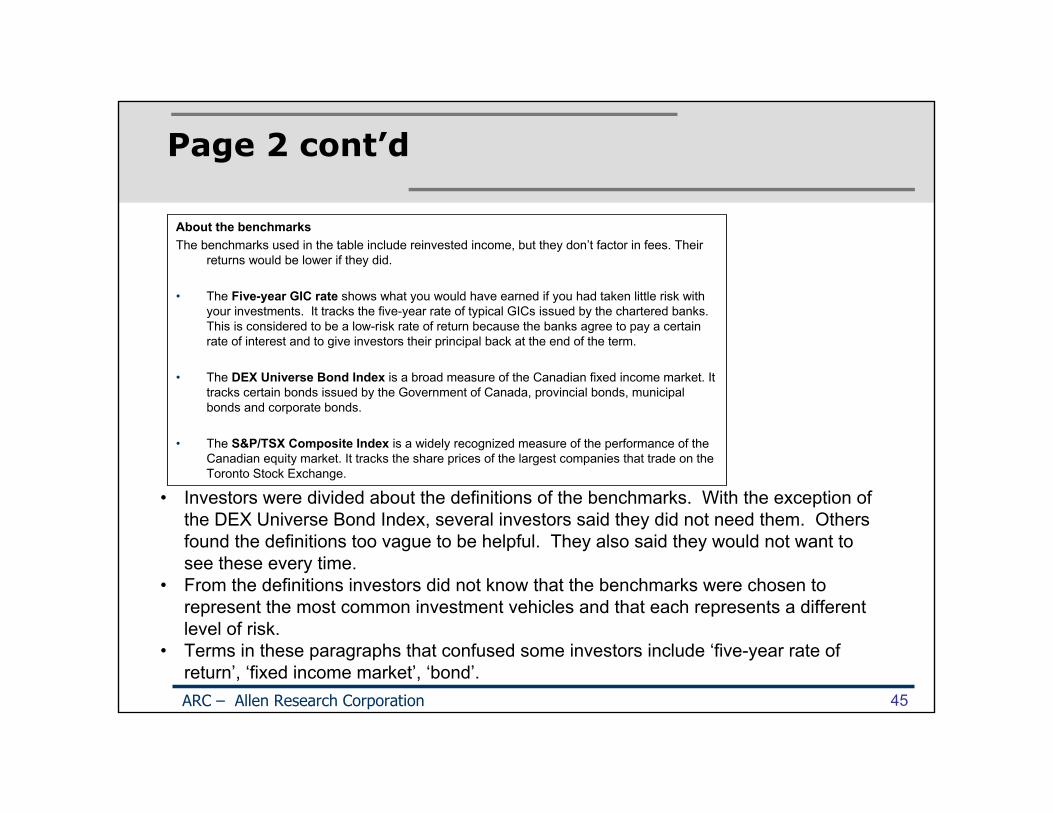
About the benchmarksThe benchmarks used in the table include reinvested income, but they don’t factor in fees. Their
returns would be lower if they did.
• The Five-year GIC rate shows what you would have earned if you had taken little risk with your investments. It tracks the five-year rate of typical GICs issued by the chartered banks. This is considered to be a low-risk rate of return because the banks agree to pay a certain rate of interest and to give investors their principal back at the end of the term.
• The DEX Universe Bond Index is a broad measure of the Canadian fixed income market. It tracks certain bonds issued by the Government of Canada, provincial bonds, municipal bonds and corporate bonds.
• The S&P/TSX Composite Index is a widely recognized measure of the performance of the Canadian equity market. It tracks the share prices of the largest companies that trade on the Toronto Stock Exchange.
ARC – Allen Research Corporation 45
• Investors were divided about the definitions of the benchmarks. With the exception of the DEX Universe Bond Index, several investors said they did not need them. Others found the definitions too vague to be helpful. They also said they would not want to see these every time.
• From the definitions investors did not know that the benchmarks were chosen to represent the most common investment vehicles and that each represents a different level of risk.
• Terms in these paragraphs that confused some investors include ‘five-year rate of return’, ‘fixed income market’, ‘bond’.

3.0 Frequency and Format of Performance Reporting
• Many investors asked that the performance report be sent in the same envelope as their regular report, but that it should be separate. Investors looking for the shortest and simplest report may read only the one or two page performance report, especially if it is separate.
• Those asked wanted the performance report to be by account. Only a few were asked about a household performance report and they agreed, but still wanted this report by account too.
• Those who hold multiple accounts at different institutions who were asked said they would prefer the language of the performance report to be consistent for easier understanding. They also wanted the same format for the tables, but were less concerned about overall design.
• Many were clear that they wanted the performance report to come quarterly, though a few thought annually would be often enough.
ARC – Allen Research Corporation 46
Section B: Registrants

4.0 Overview of Reactions of Registrants to Performance Report
• Registrants received the performance report in advance of the interviews. Most had gone through the report in some detail. During the interviews they were taken through the report page by page, but they were not taken through it word by word. Instead they were asked to comment directly on the concepts in the report as well as their perceptions of how well investors would understand various terms and approaches.
• Not surprisingly, registrants often reacted in terms of the types of investments they sell or manage and the types of clients they serve. Portfolio managers and IIROC registrants who handle higher net worth clients, for example, reacted differently from bank registrants who serve the mass retail market. Mutual fund dealers again have their own operations and statements. Exempt market dealers operate in a very specialized niche in the market as do scholarship plan dealers.
• With few exceptions, many registrants were positive about many aspects of the prototype performance report, but with substantive changes.
“As an exempt market dealer, I can’t do this, and the government exempts us from stringent requirements. As a portfolio manager, it is similar to what I do now. If I had all the information I would do it.” - EMD
ARC – Allen Research Corporation 48
Overview cont’d
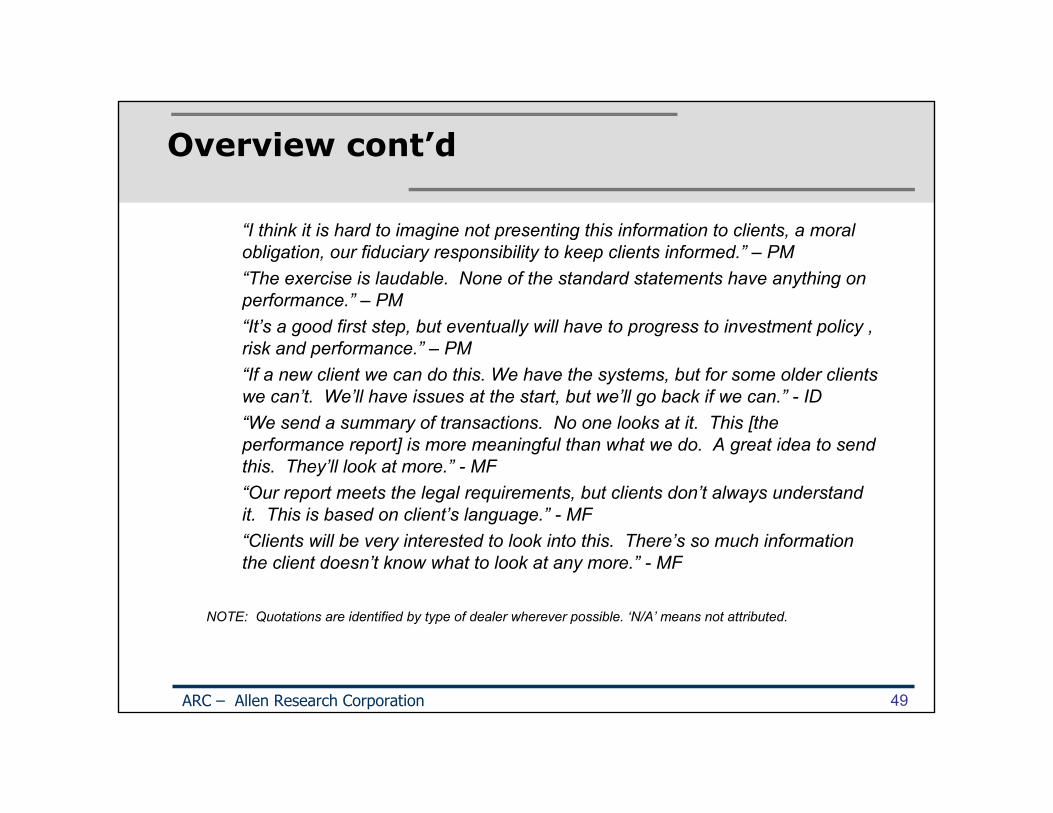
“I think it is hard to imagine not presenting this information to clients, a moral obligation, our fiduciary responsibility to keep clients informed.” – PM“The exercise is laudable. None of the standard statements have anything on performance.” – PM“It’s a good first step, but eventually will have to progress to investment policy , risk and performance.” – PM“If a new client we can do this. We have the systems, but for some older clients we can’t. We’ll have issues at the start, but we’ll go back if we can.” - ID“We send a summary of transactions. No one looks at it. This [the performance report] is more meaningful than what we do. A great idea to send this. They’ll look at more.” - MF“Our report meets the legal requirements, but clients don’t always understand it. This is based on client’s language.” - MF“Clients will be very interested to look into this. There’s so much information the client doesn’t know what to look at any more.” - MF
NOTE: Quotations are identified by type of dealer wherever possible. ‘N/A’ means not attributed.
ARC – Allen Research Corporation 49

Overview cont’d
• Registrants’ reservations focus primarily on five areas:1. Lack of data to provide value at inception 2. Failure to tie client goals and asset mix to benchmarks. There is no discussion of the
client’s risk level, and consequently there is fear that the benchmarks may be misleading3. Failure to show fluctuations in performance over time4. Failure of clients to understand the report appropriately5. Cost of changing systems
• Investment dealers and portfolio managers from the larger firms may find performance reporting easier to implement than other registrants since often they claim already to provide much of this information, but even they have reservations.
• Some from major firms also noted that the regulators should be looking at fees. The prototype does not go far enough.
“If it was more descriptive [calendar years] and added in fees it would be helpful.”“The prototype literally tells me nothing…absolutely useless. A lot of numbers are aggregates – 12 years, 5 years. It’s hard to know how well the account has done or what fees were charged. Clients need year-to-year performance and fees charged in real numbers and percents.” - PM
• The few who object to the prototype per se, do so quite strongly. “Clients understand nothing and aren’t interested…..CRM’s existing rules are already too restrictive.” – ID
ARC – Allen Research Corporation 50

4.1 Detailed Reactions to Page 1
This report tells you how your account has performed to December 31, 2010. This information can help you assess whether you are on track to meeting your investment goals. Speak to your adviser if you have questions about this report or how your account is doing.
You should also contact your adviser if your personal or financial situation, your investment goals or the amount of risk you’re comfortable with has changed. Your adviser can recommend any changes to your investments that may be needed to help you meet your goals.
ARC – Allen Research Corporation 51
•Registrants accepted the title of the report, but, like investors, wanted the date more closely defined – ‘As of December 31, 2010’.•Registrants paid little attention to the opening paragraphs. Some thought they were unnecessary or should be shown only once, but others liked paragraph 2 for its emphasis on the ‘client relationship model’.•A few asked that a description of the client’s goals and risk level be included in the introduction, though admitted it would be challenging to do.
“It misses the foundation, the client’s goals.” - N/A
Introduction

Page 1 cont’d
Total value summary
Net amount invested since you opened your account on March 1, 1998 $16,300.00Value of your account on December 31, 2010 $52,792.34
ARC – Allen Research Corporation 52
• Some registrants liked the ‘Total value summary’ and described it as useful, but many thought it was too simplified. It does not show the fluctuations in the market place year by year.
• Several said they already provide this, but when examined what they provide is usually based on book value vs. current market value and may be for the quarter or year, but usually not since inception.
• Several liked the definition in the margin of ‘net amount invested’, but also said it would be difficult to calculate. Often they do not have the net amount invested, since clients change firms and transfer of accounts is on average book value for tax purposes.
Page 1 cont’d
Total value summary cont’d• Those who liked the Total value summary said they could do this and that it would
answer some clients’ questions.“I like the text and graph. Custodians hold the records and could generate the numbers. We do 95% of this. If mandated we’ll have to figure out how to differentiate ourselves again” - PM. “We show net amount invested from beginning of the account and a graph and change table. It will motivate clients to want to know more and help them to dive into the numbers. It covers a lot of questions clients might have.” - MF “We already do this using the readjusted basic cost. Net amount invested is very difficult. They may invest three times and withdraw four times.” – ID
• Many registrants believed the bar graph was too simple. Some wanted a line graph over time similar to what their firms currently use, but others didn’t want a graph at all, considering the text sufficient.
“The summary is not conducive to understanding. It doesn’t show how he made money…want a flow instead. This [the prototype] will become the de facto report. They won’t go to our detail.” – ID
ARC – Allen Research Corporation 53
Page 1 cont’d
“It [Summary of total value] needs a context…gain vs. risk.” – PM“The graph is useless. You can’t tell when the bulk of the $52k was earned. I want a line graph by year. Without the history it’s virtually useless.” – PM“I don’t want the bar graph – too simple.” – ID“The graph is totally unnecessary. They have the numbers. It’s irrelevant to decisions going forward.” – MF“It’s creating another book value system while still needing average book value for tax.” - ID“Our systems are very complicated. We could never modify them to do this…hundreds of thousands of dollars.” – ID
ARC – Allen Research Corporation 54

Page 1 cont’d
Change in the value of your account
This table is a summary of the activity in your account. It shows how the value of your account has changed based on the type of activity.
ARC – Allen Research Corporation 55
• Many registrants like the ‘Change in the value of your account’ section and many claim already to provide something similar to this to selected clients, usually high net worth clients.
• Three issues were discussed:1) The lack of data from origin of account, 2) the preference by many for more year to year reporting, and 3) trouble understanding ‘increase or decrease in the value of your investments’.

Page 1 cont’d
“I’d like to do the change in value and historical data if we can.” – ID“Sometimes clients get emotional. This [Change in value] will help us to follow through his account when he calls on the phone.” –MF“Most firms have very good systems and can generate all this information. Need to work to ensure that it is consistent across all firms….If done consistently then clients can compare across firms.” – PM“From the legal standpoint this information is interesting to prevent abuse against customers….Statements do this over a short period of time. This is historical.” -- N/A“This is an interesting concept. The information is well done.” - N/A•At the same time many of the firms said it would be difficult to get original value.“Original value is tough, if it was 30 years ago. When they move from one firm to another the information doesn’t come over.” – ID“We show since inception now, based on original cost and then we have to show why it doesn’t match capital gain.” – ID“The main question is the meaning of of book value vs. market value vs. origin.”– MF“From inception? How can we keep all that data…much cost to upgrade and to store.” - MF
ARC – Allen Research Corporation 56
Page 1 cont’d
• Some questioned what ‘since origin’ should mean, the start of a new account or when an account is transferred to a new firm or since the client began investing in the account.
• Only a few strongly opposed the idea of giving some kind of historical data.“There’s no need for information from opening of the account. Clients already have previous data. They have to file tax returns. We have 500,000 clients. How many computers would have to be changed if you [regulators] require continuity. I’m not sure what you [regulators] are trying to do with this.” - ID“I’d like to present historical data, but all kinds of events happen. It’s risky. It could easily be wrong. I’m not saying it can’t be done, but is it accurate over the long term?….There are missing entries and may not indicate cost for client.” - ID
• Finally several registrants said they did not understand ‘increase or decrease in the value of investments’ and said clients would not either. Some wanted the line ‘Interest and dividends’ combined with the last line. Several preferred the concept of realized and unrealized gains.
ARC – Allen Research Corporation 57

4.2 Overview of Registrants’Reactions to Page 2
ARC – Allen Research Corporation 58
• Overall, registrants were more comfortable with page 1 than with page 2. Despite the difficulties, page 1 is simple compared to page 2 and offers a number of talking points for advisers without being too confusing for clients. As well, many firms already provide a variant of the change in value section.
• Page 2, on the other hand, is dense with text and the benchmarks are seen as either incomplete or seriously misleading. Few firms currently give benchmarks and then usually on request or during an annual discussion when the adviser chooses which benchmark to show. Large firms have a number of benchmarks available but these seem to be used by the financial advisers for themselves, not their clients.
• The benchmarks chosen were also questioned as too limited or not relevant to their clients’ asset mix. Many of the larger firms wanted to see an international and US index and some did not like the GIC index preferring the T-bill index.
• Several registrants wanted the ROR given on a calendar year basis or limited to the investor’s own ROR.
4.3 Detailed Reactions to Page 2
ARC – Allen Research Corporation 59
• Many registrants think that the opening text is too long and unlikely to be read by investors. They are most interested in paragraphs 3 and 4.
“It’s a little tedious in quantity and visually. They need to condense…I’m not sure the reader will make it to the third paragraph.” - N/A
Buried in text

Page 2 cont’d
The Dietz Method• Registrants are divided over whether to keep the margin note on the Dietz method,
but all are sure it will raise a red flag for clients. Some think this should be included since different firms do use different methods. Those who do not use the Dietz method would like instead a general statement about how the rates of return are calculated. A few would keep this but put it in a footnote. Others would drop it altogether.
“The client doesn’t expect this at all and it’s hard to explain.”“Only 1% will understand. Leave it off.” – MF“Keep it. It’s the one most use.” – PM“Clients prefer money-weighted returns. Time-weighted is an institutional basis.” - PM
ARC – Allen Research Corporation 60
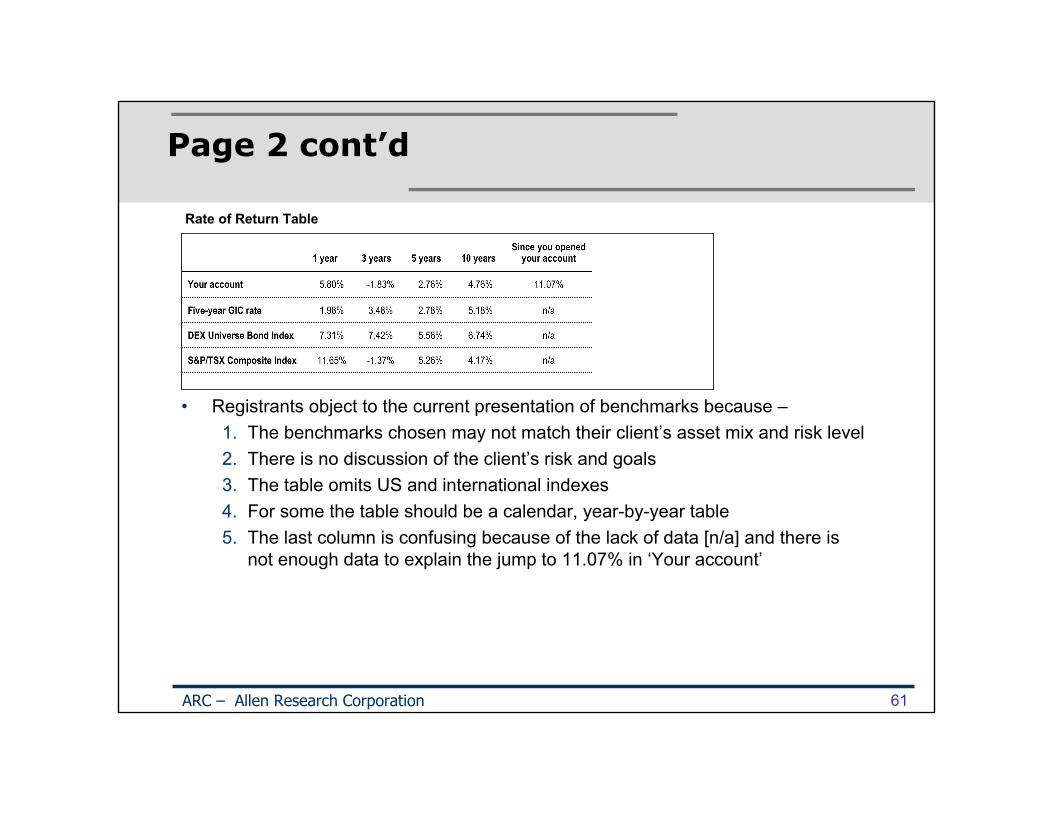
Page 2 cont’d
• Registrants object to the current presentation of benchmarks because –1. The benchmarks chosen may not match their client’s asset mix and risk level2. There is no discussion of the client’s risk and goals3. The table omits US and international indexes4. For some the table should be a calendar, year-by-year table5. The last column is confusing because of the lack of data [n/a] and there is
not enough data to explain the jump to 11.07% in ‘Your account’
ARC – Allen Research Corporation 61
Rate of Return Table

Page 2 cont’d
• As a rule, very few of those interviewed provide benchmarks at this time. They would solve their problems with the performance report in four ways. Some would drop the benchmarks altogether; some would keep only the ROR on ‘Your account’, others would expand the number of indexes shown, some of the largest companies would provide a customized benchmark. Several registrants said benchmarks should not be used except in the context of a discussion.
“If the client sees the TSX at 20% and his is at 10%, [he says] why not take this one, but can’t get any better because of blend of assets. It doesn’t mean anything. There’s insufficient data to see if a good or bad manager. This couldbe very damaging.” – ID“It doesn’t matter whether the benchmark is up or down, but whether they are meeting their goal.” - ID“We spend a lot of time explaining a balanced account and then the client sees the DEX and a well planned account goes out the window.” - ID“The benchmarks are a little touchy. The client may be in gold and look at DEX, but the risk is greater by 36. Of course it should be adjusted by risk.” –ID“I don’t want benchmarks. Clients won’t understand. If we have to, then use a blended one…fewer questions. You can’t invest in an index, but it is difficult to customize.” – MF
ARC – Allen Research Corporation 62

Page 2 cont’d
“Portfolio managers use benchmarks but clients want absolute numbers.” – PM“Benchmarks are dangerous if not used with thought. Leave it to the financial adviser.” – ID“Benchmarks are a can of worms, they add confusion not value.” – MF“If 80% is in bonds and the benchmark is the TSX it’s irrelevant.” – PM
• Several registrants argued strongly that they would prefer to show only the ROR on the investor’s own account. It would be of greatest interest and provide a sound foundation for discussion with the adviser.
• There were also a number of technical comments on the benchmarks chosen for the prototype.
Several registrants would like to see the currency indicated and international and US indexes added. Several noted that the TSX is only about 2% of global markets and can be skewed by large firms such as Nortel in the past.Several also objected to the use of the 5-year GIC. Others wanted to see the ROR on the T-bill instead of the DEX.Still others suggested advising clients to refer to other reports like the MRFP on the Internet or the return on various mutual funds online.
ARC – Allen Research Corporation 63
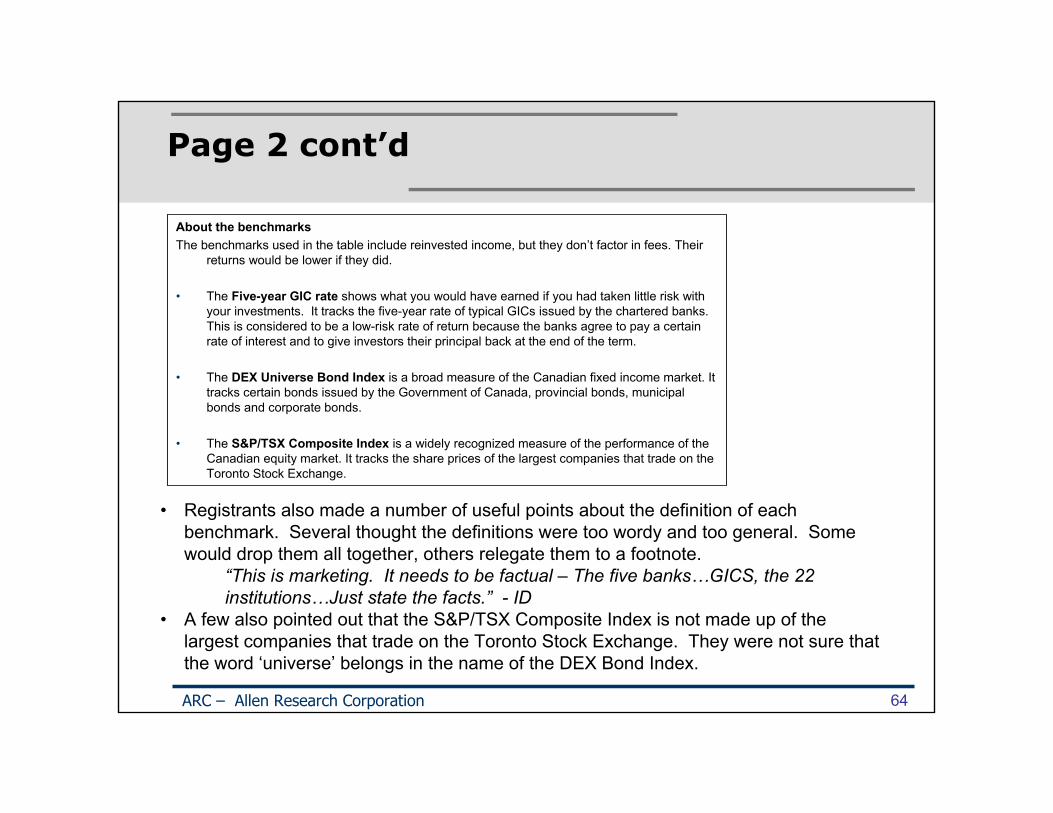
Page 2 cont’d
About the benchmarksThe benchmarks used in the table include reinvested income, but they don’t factor in fees. Their
returns would be lower if they did.
• The Five-year GIC rate shows what you would have earned if you had taken little risk with your investments. It tracks the five-year rate of typical GICs issued by the chartered banks. This is considered to be a low-risk rate of return because the banks agree to pay a certain rate of interest and to give investors their principal back at the end of the term.
• The DEX Universe Bond Index is a broad measure of the Canadian fixed income market. It tracks certain bonds issued by the Government of Canada, provincial bonds, municipal bonds and corporate bonds.
• The S&P/TSX Composite Index is a widely recognized measure of the performance of the Canadian equity market. It tracks the share prices of the largest companies that trade on the Toronto Stock Exchange.
ARC – Allen Research Corporation 64
• Registrants also made a number of useful points about the definition of each benchmark. Several thought the definitions were too wordy and too general. Some would drop them all together, others relegate them to a footnote.
“This is marketing. It needs to be factual – The five banks…GICS, the 22 institutions…Just state the facts.” - ID
• A few also pointed out that the S&P/TSX Composite Index is not made up of the largest companies that trade on the Toronto Stock Exchange. They were not sure that the word ‘universe’ belongs in the name of the DEX Bond Index.

5.0 Reactions of Exempt Market Dealers
• Exempt market dealers operate in a very tightly defined niche in the market place. Of those interviewed, one issues no reports at all, the other a report of purchases only.
“For me and EMDs it would be a near impossible feat to accomplish accurately [the performance report]. As a basic principle we do not custody financial assets. All investments are made in [the client’s] Bob Smith’s name and the issuer sends the documents to Bob Smith, not to me. Bob Smith could sell, gift or die; the estate could sell, and we wouldn’t know. His relationship is with the issuer of the security and the ongoing client care is with the issuer….I can’t record dividends, interest, or transfers in as an EMD. It would be the same as asking Panasonic to tell how many clients watch their TV.”“I don’t have any ongoing relationship with clients. It’s that transaction only…may be years between transactions.”“My clients are CEOS and CIOs.”
ARC – Allen Research Corporation 65

Exempt Market Dealers cont’d
“Benchmark? The types of products we sell are different from these benchmarks.”“Most investments are illiquid and therefore not in public markets….biotech financing…real estate.”“Clients don’t look to me to communicate how they are doing. They do that themselves. …They do it for working capital and don’t care….extraordinarily sophisticated investors.”
ARC – Allen Research Corporation 66

6.0 Reactions of Scholarship Plan Dealers
• Scholarship plan dealers consisted of a very small sample. Nevertheless some of their comments are representative of this section of the market place. They argued that several aspects of their situation are unique:
Their investments are long term, often 18 years.They already report against a specific goal – how much clients contribute from inception and the expected return in 18 years.Exact value is difficult to determine since investors gain from those who drop out and other discretionary enhancements.
• Specific comments on the performance reporting document are given below.
Page 1:• The bar chart is not appropriate since all fees are paid up front. In the first two
years the return is very small and could misrepresent value of account.• Change in value oversimplifies how a scholarship plan works, but they already do
something similar to this. They show two columns, this period and since inception.
ARC – Allen Research Corporation 67

Scholarship Plan cont’d
Page 2• Currently these scholarship plan dealers use the DEX Universe Bond Index as a
benchmark and sometimes the Bank of Nova Scotia Index.• They show pooled and unpooled returns, and the amount a client would receive
from each.
ARC – Allen Research Corporation 68

7.0 Frequency and Format of Performance Reporting
• Unlike investors, registrants largely agreed that they would distribute the performance reporting concepts integrated into their own reports.
“We need one single document. It’s hard to get them to open them now.” – ID“Integrate. If 2,000 to 5,000 clients how many pieces of paper?” – PM
• Several thought they should be quarterly, but a few said annual would be sufficient.• When asked about regulating consistency of terms, very few objected.
“There is value in some standards across the industry like Fund Facts.” – MF“Absolutely.” - PM“I don’t want the language mandated….It’s part of competition.” – N/A
• Of those asked, the larger firms said they would provide performance reporting by household and also by account.
ARC – Allen Research Corporation 69

Appendix

Performance Report - English
ARC – Allen Research Corporation 71

Performance Report - French
ARC – Allen Research Corporation 72