Embed Size (px)
Citation preview

HSE Health & Safety
Executive
Health and safety responsibilities of company directors and management board members
Prepared by Greenstreet Berman Ltd for the Health and Safety Executive 2003
RESEARCH REPORT 135

HSE Health & Safety
Executive
Health and safety responsibilities of company directors and management board members
Michael Wright and Sara Marsden Greenstreet Berman Ltd
Fulcrum House 5 Southern Ct, South St
Reading, Berkshire RG1 4QS
Jacki Holmes Woodholmes Marketing
15 Lansdowne Terrace Newcastle Upon Tyne
NE3 1HN
The Health and Safety Commission have issued guidance (INDG 343 “Directors’ responsibilities for health and safety”) advising that organisations assign directorial responsibility to a Board Director and outlining the range of board level tasks. This report summarises the results of a 2001/02 baseline survey and a 2003 follow up survey of the extent to which there is board level direction of health and safety in large private and public sector organisations.
This report and the work it describes were funded by the Health and Safety Executive (HSE). Its contents, including any opinions and/or conclusions expressed, are those of the authors alone and do not necessarily reflect HSE policy.
HSE BOOKS

© Crown copyright 2003
First published 2003
ISBN 0 7176 2713 6
All rights reserved. No part of this publication may bereproduced, stored in a retrieval system, or transmitted inany form or by any means (electronic, mechanical,photocopying, recording or otherwise) without the priorwritten permission of the copyright owner.
Applications for reproduction should be made in writing to: Licensing Division, Her Majesty's Stationery Office, St Clements House, 2-16 Colegate, Norwich NR3 1BQ or by e-mail to [email protected]
ii
CONTENTS
EXECUTIVE SUMMARY
1 INTRODUCTION ............................................................................................................................1
1.1 AIMS AND SCOPE OF THIS WORK.................................................................................................1
1.2 BACKGROUND............................................................................................................................2
2 PRELIMINARY DISCUSSIONS AND PILOT EXERCISE........................................................5
2.1 INTRODUCTION...........................................................................................................................5
2.2 SEMI-STRUCTURED DISCUSSIONS ...............................................................................................5
2.2.1 Findings regarding Director’s health and safety responsibilities ........................................5
2.2.2 Findings regarding questionnaire design.............................................................................6
2.3 TELEPHONE PILOTING.................................................................................................................7
3 MAIN SURVEY ................................................................................................................................8
3.1 INTRODUCTION...........................................................................................................................8
3.1.1 Sample size and structure .....................................................................................................8
3.1.2 Survey method ......................................................................................................................9
3.2 OVERVIEW OF RESPONDENTS..............................................................................................10
3.3 CHECK OF HALO EFFECT...........................................................................................................17
3.4 BOARD LEVEL HEALTH AND SAFETY ARRANGEMENTS .............................................................19
3.5 APPOINTMENT OF HEALTH AND SAFETY DIRECTORS ................................................................29
3.6 FACTORS INFLUENCING DESIGN OF ARRANGEMENTS................................................................49
3.7 BOARD LEVEL HEALTH AND SAFETY ACTIVITIES.......................................................................62
3.7.1 Introduction ........................................................................................................................62
3.7.2 Policy review & publicity ...................................................................................................62
3.7.3 Audit and performance reports...........................................................................................68
3.7.4 Workforce consultation.......................................................................................................75
3.7.5 Health and safety tasks .......................................................................................................81
3.7.6 Checking of board’s health and safety work.......................................................................90
3.8 PLANS FOR FURTHER REVIEW...................................................................................................94
4 DISCUSSION ................................................................................................................................104
APPENDIX A: FINAL TELEPHONE QUESTIONNAIRE
i

Executive Summary
Introduction
The Health and Safety Commission have issued guidance (INDG 343, “Directors’ responsibilities for health and safety”) on the role of board level directors and their equivalent in the public sector in the direction of occupational health and safety. The guidance advises that organisations should assign directorial responsibility to a Board Director and outlines a range of board level tasks, such as policy formation and performance review.
This report summarises the results of a 2001/02 baseline survey and a 2003 follow-up of the extent to which there is board level direction of health and safety in large private and public sector organisations. The survey is restricted to organisations with over 250 employees. The survey has been designed to:
· Establish the proportion of large firms that have appointed a board level director for health and safety;
· Develop a profile of board level health and safety management arrangements;
· Develop an understanding of the factors influencing the design of board level health and safety arrangements, and;
· Measure the extent to which organisations are aware of the HSC guidance for directors, INDG 343.
The survey results can be used for a number of purposes. Firstly, the survey results help answer the question of whether organisations are already directing health and safety at board level. Thus, the survey findings can inform the debate on the extent to which the HSC need to further promote board level direction of health and safety.
Secondly, the baseline survey was completed in the period November 2001 to January 2002. The follow-up second survey was completed in January – March 2003. Therefore, it is possible to gauge the extent to which organisations have increased board level direction of health and safety.
Thirdly, the survey findings can be used to guide the HSC’s strategy in a number of ways, including:
· Identifying the reasons cited by organisations for providing board level direction of health and safety and the perceived benefits of board level direction – such reasons can be used to further promote the uptake of board level direction, and;
· Identifying those aspects of board level direction wherein there is scope for improvement.
ii

Approach to the surveys
The baseline survey comprised two main stages of work. First a series of semi-structured discussions were held with seven organisations. These discussions served the purpose of ensuring the main survey covered all important issues and used appropriate terminology. The second stage of the baseline survey comprised a telephone survey of 403 organisations using a questionnaire.
The follow-up survey applied the same questionnaire, with minor alterations, to the same 403 respondents (securing 200 repeat interviews from the original 403) and a sample of 200 new interviewees. The sample of new interviewees was acquired to allow a check to be completed of whether the original respondents were prompted by the baseline survey to enact changes. A comparison of responses from original and new respondents to the follow-up survey did not find any consistent pattern of “better” responses from the original respondents. On the whole, there are few marked differences in the findings of the two surveys.
Who responded?
The telephone survey of covered four groups of organisation, namely:
Baseline survey Follow-up survey
Top 350 of the FTSE 39 29
Large firms (>250 employees) 228 243
Large Public sector 108 133
Large Voluntary sector 28 31
The respondents were predominantly Managing Directors, Operations Directors, HR/Personnel directors, CEOs and Other – of whom about 30% were board members.
Number of boards
Previous debates and research highlighted the point that an organisation may have more than one board, especially where a group of companies are owned by a holding company. It has been suggested that this can affect the design of board level arrangements. This survey found that:
· The majority of Top 350 firms have two or more boards;
· About half of large firms have two or more boards;
· The majority of public sector and voluntary organisations have only one board.
It is also pertinent to note in the baseline survey that Top 350 respondents usually comprise the highest level board, whilst about 60% of large firms and public sector organisations respondents report to another board or their public sector equivalent. In the follow-up survey a larger % of public sector and voluntary sector respondents sat on the highest board.
iii

Where is health and safety directed?
The surveys found, as summarised for all respondents in Figure E.1, that:
· The % who report that health and safety is directed at board level has risen from 58% to 66% between the baseline and follow-up survey;
· The % of respondents who report that health and safety is directed at “their” board increased from 48% to 58%;
· The % of public sector and Top 350 who direct health and safety at board level is largely unchanged at ~55% and ~73% respectively;
· The % of large firms who direct health and safety at board level has increased from 59% to 71%;
· The % who delegate health and safety has fallen from 38% to 26%.
Thus, Top 350 firms are most likely to have board level direction of health and safety, with public sector organisations the least likely.
The baseline survey found that local government reported the highest level of delegation. The degree of delegation amongst local government is much less in the follow-up survey. However, the degree of delegation has increased amongst NHS respondents.
0% is Del
i i ll
isi /
/ Dil
i
10%
20%
30%
40%
50%
60%
Directed at threspo ndents bo ard
egated to ndiv dua co mpany
boards
De egated to co mpany
div o ns department
do not kno w unsure rected at a higher leve
Perc
enta
ge o
f Res
pond
ents
2001 Basel ne 2003
Figure E.1: Where is Health and Safety Directed?
When asked whether an individual member of the board has responsibility for health and safety the survey found, as summarised in Figure E.2, that:
iv
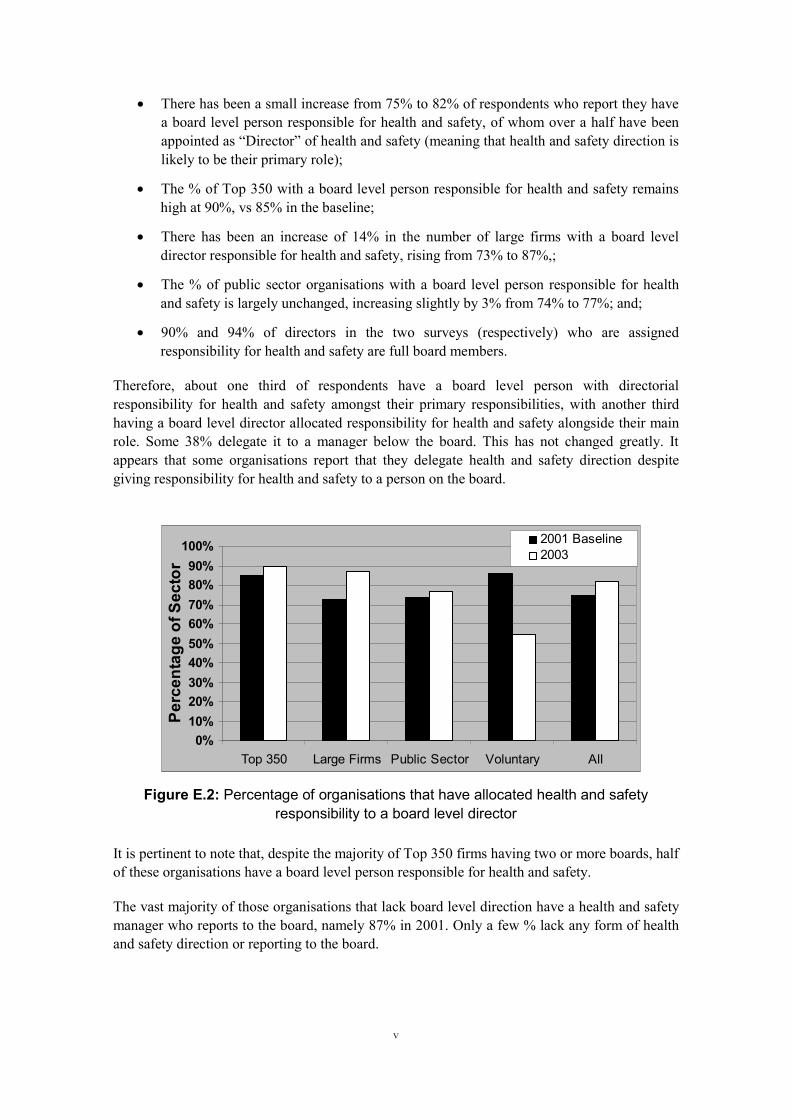
· There has been a small increase from 75% to 82% of respondents who report they have a board level person responsible for health and safety, of whom over a half have been appointed as “Director” of health and safety (meaning that health and safety direction is likely to be their primary role);
· The % of Top 350 with a board level person responsible for health and safety remains high at 90%, vs 85% in the baseline;
· There has been an increase of 14% in the number of large firms with a board level director responsible for health and safety, rising from 73% to 87%,;
· The % of public sector organisations with a board level person responsible for health and safety is largely unchanged, increasing slightly by 3% from 74% to 77%; and;
· 90% and 94% of directors in the two surveys (respectively) who are assigned responsibility for health and safety are full board members.
Therefore, about one third of respondents have a board level person with directorial responsibility for health and safety amongst their primary responsibilities, with another third having a board level director allocated responsibility for health and safety alongside their main role. Some 38% delegate it to a manager below the board. This has not changed greatly. It appears that some organisations report that they delegate health and safety direction despite giving responsibility for health and safety to a person on the board.
0% i li l All
li
10% 20% 30% 40% 50% 60% 70% 80% 90%
100%
Top 350 Large F rms Pub c Sector Vo untary
Perc
enta
ge o
f Sec
tor
2001 Base ne 2003
Figure E.2: Percentage of organisations that have allocated health and safety responsibility to a board level director
It is pertinent to note that, despite the majority of Top 350 firms having two or more boards, half of these organisations have a board level person responsible for health and safety.
The vast majority of those organisations that lack board level direction have a health and safety manager who reports to the board, namely 87% in 2001. Only a few % lack any form of health and safety direction or reporting to the board.
v

The majority of organisations reported in 2001 that they have announced these arrangements publicly either internally or externally. This has fallen from 63% to 49% between the two surveys.
The surveys also explored who was the person who led the last review of health and safety policy. This question aimed to “test” the extent of directorial involvement in safety leadership. Both surveys found that:
· There is a very diverse range of people leading the review of policy– no one job title stands out, and;
· Chief Executive Officers, Managing Directors, Health and Safety Directors, Operations Directors, and Human Resource Directors account for 60% of responses.
Why are these arrangements in place?
The main reasons cited for these arrangements are summarised below in two parts. First we present the results for organisations who do have board level direction. Then we present the results for organisations that delegate health and safety to departments and divisions.
Board level direction (where it is directed at the respondent’s board)
The main reasons cited for board level direction are, in rank order:
Baseline survey Follow-up survey
1 Corporate direction is needed Board level direction is best practice
2 Board level direction is best practice Power and control is at board level
3 Power and control is at board level Corporate direction is needed
4 Health and safety is an operational New legislation / health and safety law matter (in which the board takes an interest).
There has been little change in the reasons for board level direction.
Delegated management (delegated to company divisions/departments)
The main reasons for delegating management are:
Baseline survey Follow-up survey
1 Health and safety is an operational matter
2 A general policy of delegation
3 Operations are too diverse
4 Best practice policies
Health and safety is an operational matter
A general policy of delegation
Best practice policies
Health and safety is not an issue for directors
vi

Whilst diversity of operations has fallen as a reason for delegation, the perception that health and safety is not a matter for directors remains a significant finding.
It is pertinent to note that whilst only 50% of all respondents report that they have a specific reason for appointing a board level health and safety director, 88% of the Top 350 respondents have a specific reason. In the majority of cases the board /CEO/MD decided on these arrangements.
What influenced these arrangements?
It is apparent that there are a wide range of factors that influenced respondents’ decisions on how to direct health and safety. In addition, with the exception of voluntary organisations, respondents do believe there are very strong pressures on organisations in their sector to manage health and safety.
The survey found that Top 350 respondents gave more weight to factors in general. This can be interpreted to imply that the Top 350 organisations are more aware of or more sensitive to the demands for board level direction of health and safety.
Both surveys found that the most highly rated factors are:
· Top 350 – A general increase in the importance of health and safety, concern about corporate responsibility, general concern about their occupational health performance and fear about the company being prosecuted;
· Large Firms – More influenced by the HSC guidance, and less by corporate responsibility; otherwise the same factors as the Top 350;
· Public Sector – General increase in importance of health and safety, general concern about occupational health, HSC guidance, corporate responsibility, and;
· Voluntary organisations – HSC guidance, general importance of health and safety, general concern about occupational health performance.
It is pertinent to note that neither shareholder pressure, media pressure nor the Turnbull Report were cited as big influences. Overall, the general increase in the importance of health and safety is the top factor, followed closely by HSC guidance and concern about occupational health performance.
The perception that their organisation has high risk operations has a lower rank in 2003, having been equal first in 2001.
As illustrated in figures E.3 and E.4 the vast majority of respondents (75% and 80%) have heard of the HSC guide INDG 343 in the two surveys respectively, a slight increase. Respondents who have heard of INDG 343 (“Directors’ responsibilities for health and safety”) are slightly more likely to have board level direction of health and safety, this difference increasing in the later survey.
vii

0% l
i ( ) l ( )
All
No
10%
20%
30%
40%
50%
60%
70%
80%
90%
100%
Board leve H&S respons bility n=303
No board leve H&S responsibility n=95
Yes
Figure E.3: Have you heard of HSC's guide "Directors responsibilities for health & safety?" (INDG 343) (2001)
0%
10%
20%
30%
40%
50%
60%
70%
80%
90%
100%
l l ibili ( )
l libili
All
No
Board eve H&S respons ty n=358
No board eve H&S respons ty (n=80)
Yes
Figure E.4: Have you heard of HSC's guide "Directors responsibilities for health & safety"(INDG 343) (2003)
viii
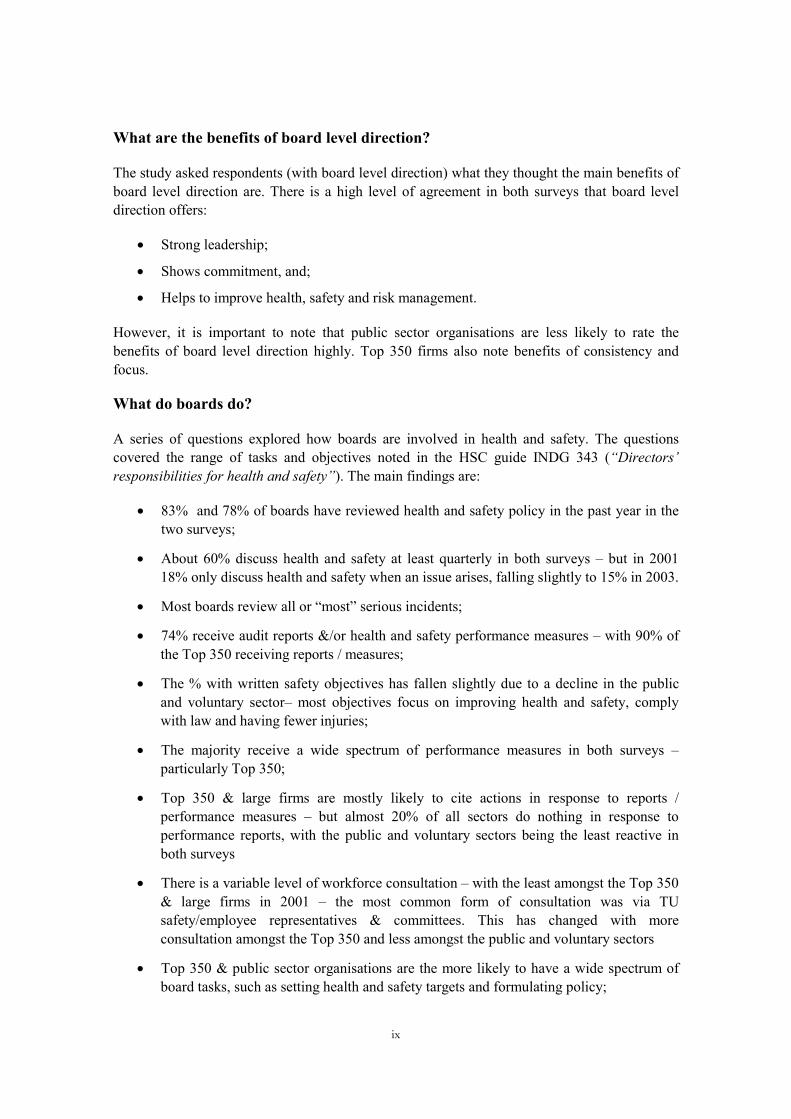
What are the benefits of board level direction?
The study asked respondents (with board level direction) what they thought the main benefits of board level direction are. There is a high level of agreement in both surveys that board level direction offers:
· Strong leadership;
· Shows commitment, and;
· Helps to improve health, safety and risk management.
However, it is important to note that public sector organisations are less likely to rate the benefits of board level direction highly. Top 350 firms also note benefits of consistency and focus.
What do boards do?
A series of questions explored how boards are involved in health and safety. The questions covered the range of tasks and objectives noted in the HSC guide INDG 343 (“Directors’ responsibilities for health and safety”). The main findings are:
· 83% and 78% of boards have reviewed health and safety policy in the past year in the two surveys;
· About 60% discuss health and safety at least quarterly in both surveys – but in 2001 18% only discuss health and safety when an issue arises, falling slightly to 15% in 2003.
· Most boards review all or “most” serious incidents;
· 74% receive audit reports &/or health and safety performance measures – with 90% of the Top 350 receiving reports / measures;
· The % with written safety objectives has fallen slightly due to a decline in the public and voluntary sector– most objectives focus on improving health and safety, comply with law and having fewer injuries;
· The majority receive a wide spectrum of performance measures in both surveys – particularly Top 350;
· Top 350 & large firms are mostly likely to cite actions in response to reports / performance measures – but almost 20% of all sectors do nothing in response to performance reports, with the public and voluntary sectors being the least reactive in both surveys
· There is a variable level of workforce consultation – with the least amongst the Top 350 & large firms in 2001 – the most common form of consultation was via TU safety/employee representatives & committees. This has changed with more consultation amongst the Top 350 and less amongst the public and voluntary sectors
· Top 350 & public sector organisations are the more likely to have a wide spectrum of board tasks, such as setting health and safety targets and formulating policy;
ix

· In both surveys, board level health and safety directors are more likely to perform tasks than the board as a whole, and;
· The health and safety work of 80 to 90% of boards was audited – internally or externally in 2001 and 2003.
It is pertinent to note that, on the whole, the Top 350 boards report a higher level of “good practices” than other respondents, with public sector organisations relatively less likely to report “good practices”.
Are you going to review arrangements?
The surveys found that:
· 51% of respondents report that their organisation plans to review the level of board direction of health and safety in 2001, falling to 47% in 2003;
· About 40% plan to increase the role of Directors in safety leadership in 2001, falling to 35% in 2003.
The fall in the review plans may reflect the point that some respondents report they have increased board level direction in the interim.
It is also important to note that those organisations that do not have a director responsible for health and safety are less likely to plan to review arrangements. Respondents that are aware of the HSC guide INDG343 are twice as likely to report that they plan to review board level arrangements and twice as likely to have plans to increase the role of directors in health and safety.
Conclusions
Most organisations have board level representation already and display many examples of good practice. The surveys indicate that there is “room” for a significant increase in the number of boards where a person is appointed as director for health and safety with that as their primary responsibility. The public sector has the greatest scope for change, whilst Top 350 firms are the “best”.
As regards areas of management, boards could look at:
· Regularity of board discussions of health and safety;
· The scope of performance measures and reports received;
· Their response to the reports and performance measures, and;
· The level of consultation with the workforce.
As regards promotional strategy, there is a wide range of reasons that can be cited for boards to take these issues forward, including:
· Concern for corporate responsibility;
· General concern for health and safety (i.e. it’s moving up the agenda);
x

· Avoiding prosecution, and;
· Better risk / health and safety management.
HSC promotion could highlight the following benefits of board level direction;
· Strong leadership;
· Demonstrable commitment;
· Better health and safety management.
Top 350 firms, on the whole, could be cited as examples of “good practice”.
It is concluded that the HSC guidance is a significant factor in prompting boards to review their arrangements. Given that it is CEOs/MDs and other board members who decide upon board responsibilities, any further promotional work should target these people.
xi

1 INTRODUCTION
1.1 AIMS AND SCOPE OF THIS WORK
Government ministers and the Health and Safety Commission attach great importance to the Revitalising Health and Safety (RHS) strategy, as launched by Ministers and the Health and Safety Commission (HSC) in June 2000. The Government and the HSC place particular emphasis on the recommendation that organisations appoint an individual director for health and safety and that the board play a greater role in health and safety. It is thought that the promotion of greater corporate responsibility will make a significant contribution to meeting the RHS targets.
The aim of this research is to identify the extent to which companies and other organisations currently operate in accordance with the HSC guidance for directors, INDG 343. The issues explored by the study are summarised in Table 1.
The study involved a baseline assessment in 2001/02 and a follow up survey in 2003.
Table 1: Issues explored by the study
I. What proportion of surveyed organisations has appointed a director or board member equivalent to be responsible for health and safety?
II. What proportion of the same companies and other organisations consider health and safety matters at a board level and what is the frequency with which health and safety matters come before the board?
III. Further, where companies and organisations have appointed a health and safety director or equivalent board member, ascertain how that person’s responsibilities have been determined and by whom and the arrangements in place regulating how they operate.
IV. Identify perceived benefits to the business and to health and safety performance derived from having a health and safety director.
As part of this the study considers:
· The extent to which organisations promote collective responsibility for health and safety performance and policy;
· What prompted these changes;
· To what extent the HSE guidance INDG 343 promoted these changes.
1

This report provides a summary of the results of the two surveys regarding the uptake of health and safety responsibilities by Directors, Boards and their equivalent in the public sector. The comparison of findings between the 2001/02 and 2003 surveys is intended to provide an indication of trends in the uptake of health and safety responsibilities by Directors, Boards and their equivalent in the public sector. The 2003 study involved re-contacting the same sample of companies from the baseline survey and a number of broadly comparable organisations that had not previously been contacted. The contact with a new sample of other organisations in the 2003 follow-up survey provided a check that changes in behaviour amongst the initial sample were not a result of the “Hawthorne effect”, whereby respondents change their behaviour due to being contacted in this baseline survey.
1.2 BACKGROUND
Safety professionals have long argued that effective safety leadership from the top of organisations is essential. Safety leadership is an element of many safety culture and safety management guides and best practice models. Indeed, directors in organisations that excel in safety demonstrate personal “ownership” for safety. Without support from the top it is thought that efforts made by other people in the organisation will either be hampered by lack of resources or undermined by perceived conflicts with other organisational priorities. On the other hand, effective leadership has been found to lead to greater concern for safety throughout the organisation and a belief that the corporate commitment to safety is “real”.
At the same time, the Turnbull Report has made it clear that managing risks is a key issue for all organisations. One key risk is health and safety. Effective management of health and safety risks will help to avoid reputational damage, business interruption / losses and prosecution. Indeed, the ethical behaviour of firms is now the subject of active monitoring and media reporting by Non-Governmental Organisations.
At the same time, there have been moves to introduce a Corporate Killing bill and to facilitate corporate manslaughter cases. As stated in the Home Office report “The Law Commission considered that it would benefit both companies and the enforcement authorities, if companies were to take health and safety issues more seriously. …. There should be a special offence of corporate killing, broadly corresponding to the proposed offence of killing by gross carelessness.” The Government responded by indicating that it believes the creation of a new offence of corporate killing would give useful emphasis to the seriousness of health and safety offences and would give force to the need to consider health and safety as a management issue. The prospect of individual directors and corporate bodies being prosecuted for manslaughter is thought to be a significant motivator for greater corporate responsibility for health and safety.
The apparent recognition of such liability is reflected by the uptake of “Directors and Officers liability insurance” by 60% of UK companies that provides protection against the legal costs and exemplary damages arising from being sued personally for failing to prevent an incident. One source indicates that 30% of companies have made a “D and O” claim and that such claims have risen by nearly 200% since 1989.
On a positive note, good health and safety performance is considered to deliver business benefits, including productivity, better relationships with staff and contractors, better public
2

image and relations with key stakeholders such as regulators and the government. Previous work for the HSE1 has shown that larger firms are prompted to give greater attention to safety by fear of poor PR, fear of major losses and prosecution as well as a wish to demonstrate a caring image.
In the context of these benefits and potential costs it is apparent that health and safety should, and needs to be, a board level issue. Accordingly, the HSE has published the guidance for directors (INDG343), the contents of which are as summarised in Table 2. Also In accordance with Action Point 2 of the Revitalising Health and Safety strategy the Health and Safety Commission has asked top companies to report on health and safety in annual reports. This follows previous initiatives, such as the Good Health is Good Business Campaign, to promote concern for health and safety amongst employers.
In the context of this study, it is clear that there are a number of prompts for firms to give greater attention to health and safety at board and director level, with more than one HSE initiative aimed at employers/ directors. Indeed, ROSPA has been running the DASH initiative (Director Action on Safety and Health) and has been promoting the inclusion of safety in MBA’s, both of which may have also influenced directors’ behaviours. One aim of this study is to explore the impact of the (INDG 343) guidance in promoting and encouraging greater corporate responsibility. Accordingly it has been important for the study to discern the reasons for changes in behaviour as well as to identify such changes. For example, are changes in directors’ behaviour due to Turnbull, prospects of a corporate killing bill, the HSC’s new guidance or other reasons? Other research has shown that many firms give greater attention to health and safety after a major incident, after exposure to best practice and other “internal” reasons. Indeed, executive safety leadership is a key element of the DuPont model that many firms aim to replicate. Accordingly, it is also possible that organisations will have changed their behaviour due to internal events and /or exposure to best practice in other organisations rather than in response to the HSC’s guidance.
It is pertinent to note that the CBI has rejected the need for appointing an individual named director as “this detracts from the team requirements for good health and safety standards to be owned by all…”. Also, our previous work indicates that health and safety responsibilities may be discharged under the guise of risk management, corporate governance, external affairs, human resources and other directorships. Thus, it is possible that organisations may have taken a different approach to directors’ health and safety responsibilities and / or use different terminology. The study has been designed to be sensitive to these points.
Indeed, we believe that it is useful to explore the reasons for the approaches adopted by organisations and whether they have plans for further change in this area. An understanding of what is motivating organisations to either increase or hold back on increasing the board’s responsibilities would inform the HSC’s decision on whether there is a need to take further action – or whether organisations already have sufficient reasons to change their behaviour.
1 Factors motivating proactive health and safety management. M. Wright. HSE Books. Contract Research Report 179/1998.
Evaluation of Good Health is Good Business. Wright, M. Lancaster, R. and Jacobson-Maher,C. 2000. Contract Research Report
272. HSE Books. ISBN 0717618056.
3

Thus, this study has been designed both to identify changes in behaviour and ascertain the reasons for these changes, specifically assessing the extent to which changes in behaviour relate to the HSC’s work and whether organisations are already motivated to change their approach to corporate health and safety responsibility.
Table 2: Summary of INDG 343 “Directors’ responsibilities for health and safety”
Action point 1: The board needs to accept formally and publicly its collective role in providing health and safety leadership in its organisation.
Action point 2: Each member of the board needs to accept their individual role in providing health and safety leadership in their organisation.
Action point 3: The board needs to ensure that all board decisions reflect its health and safety intentions, as articulated in the health and safety policy statement.
Action point 4: The board needs to recognise its role in engaging the active participation of workers in improving health and safety.
Action point 5: The board needs to ensure that it is kept informed of, and alert to, relevant health and safety risk management issues. The Health and Safety Commission recommends that boards appoint one of their number to be the “health and safety director”.
The guide also provides a summary of legal responsibilities.
4

2 PRELIMINARY DISCUSSIONS AND PILOT EXERCISE
2.1 INTRODUCTION
This section of the report provides a summary of the preliminary discussions, development and piloting of the survey proformas and the findings from the pilot process all of which were completed as part of the 01/02 baseline assessment. The pilot was split into two phases, namely:
· A phase of semi-structured sessions, and;
· A phase of structured pilot telephone interviews.
This approach was adopted to facilitate the elicitation of “rich” information from the semistructured sessions through a process of probing questions. The information from the semistructured sessions was used for:
· Developing more sensitive questions for the telephone questionnaire;
· Testing and identifying terms that interviewees can understand;
· Providing a forum to capture issues and ideas that may not have been foreseen by the researchers;
· Testing the interview method, and;
· Providing some initial findings.
The semi-structured sessions were guided by a topic guide. The guide was subsequently turned into the telephone questionnaire shown in Appendix A.
Semi-structured discussions were held with 7 individuals from a range of large firms. Thisincluded representatives from a range of Top 350 firms operating in high and low risk sectors.
A telephone questionnaire was subsequently developed and piloted in two stages.
2.2 SEMI-STRUCTURED DISCUSSIONS
2.2.1 Findings regarding Director’s health and safety responsibilities
The key findings from the semi-structured sessions are summarised below. These findings were used to review and refine the questionnaire.
· A number of respondents indicated that their Boards have taken on health and safety directorial duties for many years, pre-dating the HSC guidance (INDG 343) – this was particularly the case in higher risk companies;
· Few respondents could explicitly identify any specific factors that prompted their design of board level arrangements, beyond the general increase in the importance of health and safety;
5

· Boards typically focus on tasks such as target setting, policy and strategy and performance review –with most boards receiving health and safety performance data;
· Most respondents indicated that the whole board was responsible for health and safety leadership, in addition to having a dedicated health and safety director;
· The health and safety director role is often included within the responsibilities of another post such as Human Resource Director;
· Most boards are assisted by health and safety managers, regardless of their board level arrangements;
· In some cases, boards address health and safety on an exceptional basis, when an issue arises, with a lower level meeting considering health and safety on a more routine basis – reporting up when an issue arises;
· All respondents noted that their organisations had arrangements for employee participation but that these typically operated at a lower (non-board) level in the organisation, typically health and safety committees, and;
· The respondents considered board level direction to offer benefits such as focus, ensuring health and safety gets attention and resources; in the case of corporations board level direction also offers the benefit of cross company learning and consistency.
2.2.2 Findings regarding questionnaire design
The output from these discussions indicated that it is possible to acquire a meaningful profile of board level arrangements and the factors underlying their design from telephone interviews. Accordingly, the technique of telephone interviews was retained. The semi-structured discussions indicated that the questionnaire needed to be modified to:
· Allow for the possibility of the company having more than one board, and hence the need to allow for the possibility that health and safety was directed at another board than the one attended by the respondent;
· Capture the point that there is a difference between asking a Director to take an interest in health and safety and appointing a person as a Director of Health and Safety;
· Capture the point that some firms are holding companies with no substantive operational role, wherein health and safety is directed at the level of lower company boards along with other company specific business;
· Ensure the questions about board level tasks cover their work in setting health and safety targets, policy and reviewing performance – which are typical roles;
· Recognise that a health and safety manager often assists the board in their duties, and;
· Include questions that “test” the level of board activity.
It was also noted that a number of questions required clarification and more specific examples.
6

Finally, it was apparent from these sessions that it is important to interview either a board level director or a manager who reports to the board in order to acquire a full explanation of their arrangements and the reasoning behind them.
2.3 TELEPHONE PILOTING
The telephone questionnaire was designed using:
· Directors’ feedback from the initial stage of semi-structured discussions;
· Review of INDG 343;
· Review of research into the factors influencing corporate health and safety behaviour;
· Review of the current initiatives that may be influencing corporate health and safety behaviour, and;
· Review of the range of ways in which organisations may choose to manage health and safety at a corporate level.
The telephone questionnaire was designed so as to support a shorter (approximately 15 minutes) interview and to enable “coding” of responses for subsequent quantitative analysis. Key pilot issues include:
· Acceptability of the interview duration;
· Interviewees’ comprehension of the questions;
· Whether the questions generate the information needed by this study, and;
· Practicality.
The questionnaire was first piloted by phone with 10 individuals. The outcome of these interviews was reviewed and edits made to the questionnaire. The final version of the questionnaire was tested by a further set of 6 interviews. The questionnaire remained largely unaltered after these sessions.
The final version of the telephone questionnaire is shown in Appendix A.
The questionnaire has been designed to cover the following issues:
· The arrangements for the direction of health and safety;
· Examples of health and safety tasks carried out by the board and the director responsible for health and safety;
· The reasons for developing these arrangements, and;
· Awareness of INDG343 and plans for further review of board level arrangements.
7

3 MAIN SURVEY
3.1 INTRODUCTION
3.1.1 Sample size and structure
Overall sample
A sample size of 403 respondents from large organisations was sought in the baseline survey to achieve adequate statistical confidence in the results. A comparable sample size and similar industry profile was sought in the follow up survey, with 436 interviews achieved. As with all sample-based surveys there is a degree of statistical “error” in the results. That is, it is expected that there would be a difference between the responses from a complete census of all employers and the responses from this sample. The range of error associated with any one sample is linked to the sample size and the extent to which respondents provide a common response. Table 3 provides the ranges of error for each part of the sample and the total sample for a number of responses.
The sample size was also designed to enable detection of changes in responses between the baseline and follow-up survey. Thus, a (say) 10% change in results between the baseline and follow on survey would exceed the 3% to 5% range of error in the baseline survey. Clearly, only changes of over 5% can confidently be declared to be real changes.
Table 3 Ranges of error (95% confidence)
Percentage of respondents giving a Total sample (n = 400) response
50% 5%
30% or 70% 4.6%
10% or 90% 3.0%
Sample sub-sectors
The sample in both surveys was split into four main sectors, namely:
· Top 350 firms (as listed in the FTSE);
· Large Firms (from manufacturing, retail and repair, hotels and catering, construction, finance, transport, utilities, telecommunications and other services (e.g. business, recreation, legal services etc.)) (see Figure 2) ;
· Large public sector organisations (education, NHS trusts, local authority, emergency services) (see Figure 3), and;
8
· Large voluntary organisations (such as charities and social clubs).
All organisations had to have at least 250 employees to qualify for the study. We intentionally restricted the sample to large organisations on the presumption that they are most likely to have assigned responsibility for health and safety to a director and hence would provide a robust “test” of current practices.
The sample was split into sub-sectors to ensure it represented all types of organisations. The study did not aim to secure statistically significant samples for each of the four types of organisations. Indeed, there are an insufficient number of large voluntary organisations in the UK from which to secure a statistically robust sample.
Thus, the results were used for all respondents to assess changes in behaviour between the baseline and follow-up survey. The results for each of the four types of organisations are presented individually, for some questions, and compared. However, it should be noted that small differences in responses between the four types of organisations are unlikely to be statistically significant.
3.1.2 Survey method
Interviewee recruitment
Contact details were acquired from:
· Greenstreet Berman Ltd’s own databases;
· Public sources such as Dun and Bradstreet;
· A contacts database developed by the HSE for Top 350 organisations.
In each case data was acquired on the name of the company director, usually the Managing Director, or the Director of Health and Safety, telephone, facsimile number, company address and (for large firms and government sector) their industry categorisation. The follow up survey returned to the same contacts, and over 200 new contacts.
In each case for new contacts the contact process involved:
· Sending a facsimile to the named person with a “To whom it may concern” letter from the HSE requesting their participation;
· Telephoning the individual and asked for contact details of someone who can speak on behalf of the board in connection with a Health and Safety Executive commissioned study. The general purpose of the survey was explained along with our need to speak with a senior member of management, such as a director for health and safety or operations director;
· Phoning the named contact and ask for their participation and / or an alternative contact point – thereafter making an appointment for a telephone interview;
9

· Contact was made with the firms on at least three separate occasions in order to seek and agree an interview.
A very similar process was followed for re-interviews in the follow-up survey, with the additional reference to and thanks for their previous contribution.
Self-selection amongst interviewees was minimised by (1) re-assuring them as to the intent of the survey (i.e. that their individual firm is not under scrutiny) and (2) by keeping questions about INDG343 to the end of the interview.
Survey management
Both surveys were managed in accordance with the British Market Research Association standards. A cascade system was adopted whereby a supervisor had responsibility for the interviewing quality of a number of staff with central quality control exercised over the supervisors. Also, all interviews are completed in compliance with the Interviewer Quality Control Scheme and the BMRA and Market Research Society’s Codes of Conduct. This includes a random check on 10% of interviews and double entry of a sample of data.
3.2 OVERVIEW OF RESPONDENTS
Table 4 to Table 8, and Figure 1 to Figure 5 provide an overview of respondents in both surveys.
Large Firms and public sector organisations dominate the samples. This reflects the predominance of these organisations in the population of large organisations, i.e. there are thousands of large private and public sector organisations compared to 350 firms in the Top 350 group and a few hundred large voluntary organisations. The sample of large firms reflects the make up of private industry, covering retail, manufacturing, financial services, construction and other sectors. The public sector sample covered the main services of education, health and local authorities.
The job titles of the respondents is shown in Figure 4 (2001) and Figure 5 (2003). The respondents were predominantly Health and Safety Manager / Officers and this is more marked in 2003. Various directors, head teachers /principals and various senior managerial titles are also quoted.
10

0%
Firms ic l
i
10% 20% 30% 40% 50% 60%
Top 350 Large PublSector
Vo untary Perc
enta
ge o
f Res
pond
ents
2001 Basel ne 2003
Figure 1: Sub-division of respondents by type of organisation
0%
10%
20%
30%
40%
il f l li
li
Reta Manu acture Construction Finance Hote Te ecom Transport Utilities Other Serv ces
2001 Base ne 2003
Figure 2: Sub-division of large firms
11

0% i
i
i
10%
20%
30%
40%
50%
Educat on Local Government
Emergency Servces
NHS
Perc
enta
ge o
f Sec
tor 2001 Basel ne
2003
Figure 3: Sub-division of public sector organisations
Table 4: Percentage of respondents from each type of organisation
Category Percentage 2001 Number 2001 Percentage 2003 Number 2003
Top 350 10% 39 7% 29
Large Firms 57% 228 56% 243
Public Sector 27% 108 30% 133
Voluntary 7% 28 7% 31
All 100% 403 100% 436
12

Table 5: Sub-division of large firms by industrial sector
Sector Percentage of large
firms 2001 Number
2001 Percentage of large
firms 2003 Number
2003
Retail 30% 68 32% 77
Manufacture 27% 61 24% 58
Construction 6% 13 7% 16
Finance 7% 16 5% 13
Hotel 2% 4 2% 5
Telecom 2% 4 2% 6
Transport 2% 4 2% 5
Utilities 3% 6 2% 6
Other services 23% 52 23% 57
Total 100% 228 100% 243
Table 6: Sub-division of public sector respondents
Sector
Percentage of public sector respondents
2001 Number 2001
Percentage of public sector respondents
2003 Number 2003
Education 44% 48 38% 50
NHS 20% 22 24% 27
Emergency services
15% 16 18% 24
Local authority 20% 22 20% 32
Total 100% 108 100% 133
13
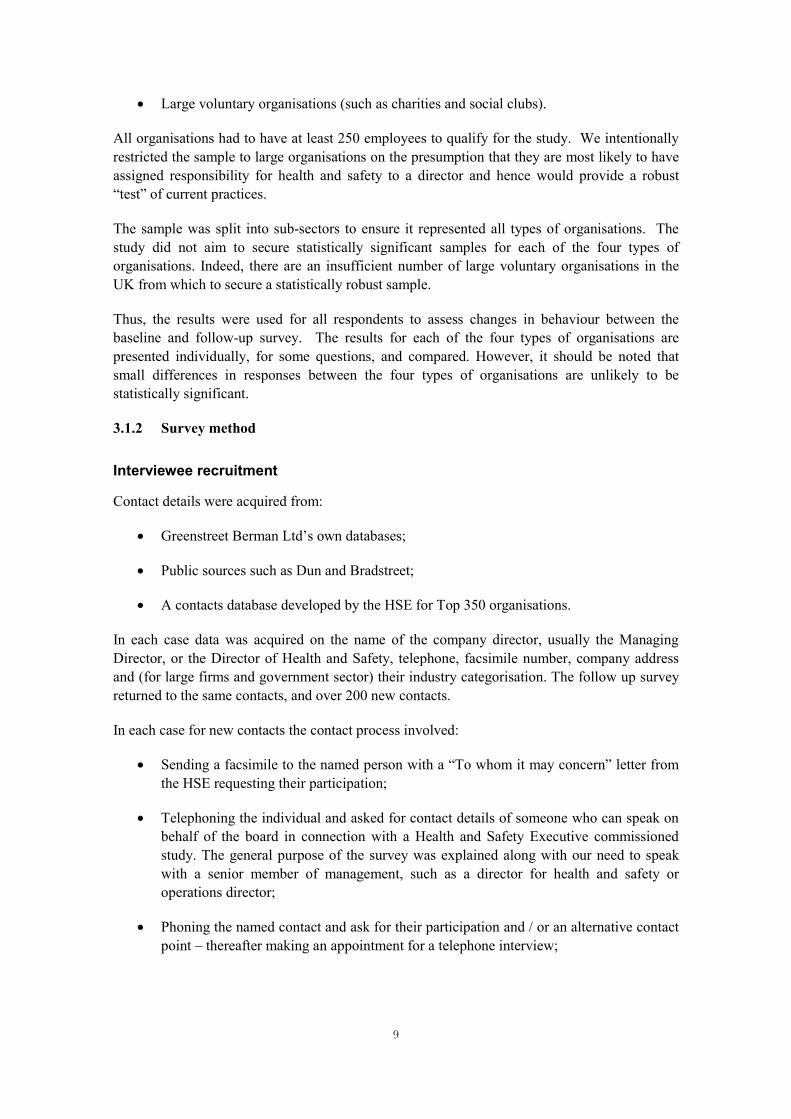
Table 7: Percentage of respondents that were Board Members
Category Percentage 2001 Number 2001 Percentage 2003 Number 2003
Top 350 31% 12 24% 12
Large Firms 24% 54 16% 38
Public Sector 38% 41 18% 24
Voluntary 29% 8 19% 6
All 28.5% 115 18% 80
Table 8: Percentage of respondents in the baseline survey agreeing to re-interview for follow-up survey
Category Percentage Number
Top 350 87% 34
Large Firms 78% 178
Public Sector 79% 85
Voluntary 100% 28
All 81% 325
14

0
10
20
30
40
50
60
70
80
90
10 0
H&S manag
er H&S Offic
er
Head t
each
er etc
Othe
r Dire
ctor
H&S Dir Misc
man
ager
Finan
ce Dir
HR dir
Other m
anag
er HR man
ager
Facili
ties m
anag
er Cha
riman
Compa
ny Sec
retary
Genera
l man
ager
Manag
ing Dir
Exec
utive
Dir Ope
ration
s Dir
Marketi
ng Dir
CEO
Produ
ction
Dir Le
gal D
ir
Job title of respondent
Num
ber
Figure 4: Wh o r esponded (2001)?
15

0
20
40
60
80
100
120
140
160
H&S man
ager
H&S Offic
er
Misc se
nior m
anag
er HR m
anage
r Othe
r Dire
ctor
Head t
eache
r etc
Facilit
ies m
anag
er H&S D
ir HR di
r
Compa
ny Sec
retary
Othe
r Ope
ration
s Dir
CEO Man
aging D
ir Mark
eting
Dir
Finance
Dir
Chairm
an
Genera
l mana
ger
Execu
tive D
ir Prod
uctio
n Dir
Lega
l Dir
Job title of respondents
Num
ber
Figure 5: Wh o r esponded (2003)?
16
3.3 CHECK OF HALO EFFECT
The follow-up survey included a sample of ~200 “new” respondents as well as ~200 of the original respondents. These “new” respondents were surveyed in order to allow a check to be completed on whether “improvements” in the responses (between the first and second survey) from the original respondents were due to a “halo” effect. That is, were improvements in the responses of the original respondents due to their being contacted as part of the baseline survey, i.e. did the baseline survey prompt a change in their responses. Comparing the responses of the “new and old” respondents in the follow-up survey can check this.
Table 9 presents a comparison of the responses to a selection of questions from the follow-up survey. New and original respondents’ results are shown along with the margin of error. The margin of error (+/-) indicates the range of results that a complete census is assumed would give with 95% confidence. Thus, a margin of error of 5.7% for a result of 81% indicates that a complete census is assumed to give a result in the range of 75.3% to 86.7% with 95% confidence. The margin of error (+/-) varies according to the proportion of respondents who give a certain answer. The table also notes if the new and original respondent’s results come within the margin of error of the original respondents.
It can be noted that:
· The responses from the new respondents are more favourable in some cases;
· Although the new responses do fall outside the original respondents’ margin of error in some cases, there are no major differences in the two sets of responses;
· The direction of differences is not consistent, with the new responses being more favourable in different cases and less favourable in other cases.
It is judged that there is not a consistent pattern of responses from the original respondents being more favourable than the responses from the new respondents. The differences in responses between the new and original respondents are probably simply sample variation.
It should also be noted that the overall results for the baseline and follow-up surveys are very similar. The follow-up survey does not report a major improvement or change in directors’ / board level health and safety arrangements. Hence, there is no significant “halo” effect to be assessed.
17

Table 9: Comparison of selected results from new and original respondents in the follow-up survey.
Question Original respondents New respondents Comments
Result Margin of Result Margin of
error (+/ ) error (+/-)
Does the board receive health 72% - 5.7% 81% - 6.5% Original respondents give and safety performance and Yes Yes “poorer” response. audit reports?
“New” responses are beyond original respondents margin of error.
To what extent has your board 47% - A 7% 49% - A 7% Responses are statistically sought the opinions of the lot lot the same workforce in developing and implementing your H&S policy?
Has a board level director been 81% 5% 83% 6% Responses are statistically given responsibility for health Yes Yes the same and safety?
Has that board member been 57% 7% 62% 7% New responses are within specifically appointed as a Yes Yes margin of error of original director (or equivalent) of respondents H&S?
Do you have plans to increase 32% - 6.5% 39% 7% New responses are outside of the role of directors’ and board Yes Yes the margin of error of members in safety leadership? original responses - but new
responses more “favourable”.
Have you heard of the HSC’s 78% 5% 82% 5% New responses are within guide “Directors’ Yes Yes original responses margin of responsibilities for health and error. safety”
New responses more favourable.
Do you have plans to further 49% 7% 44% 7% New responses are within review, within the next year, Yes Yes original responses margin of your board / director level error. health and safety arrangements against the HSC guide?
18

3.4 BOARD LEVEL HEALTH AND SAFETY ARRANGEMENTS
Number of boards
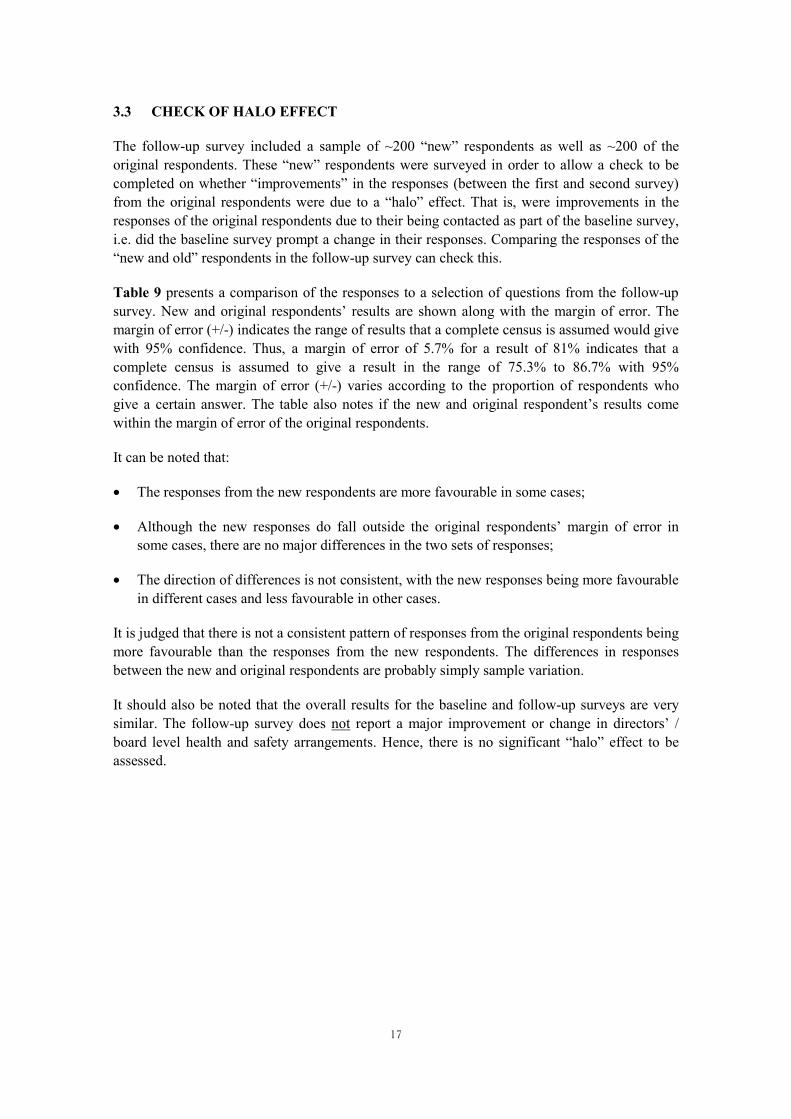
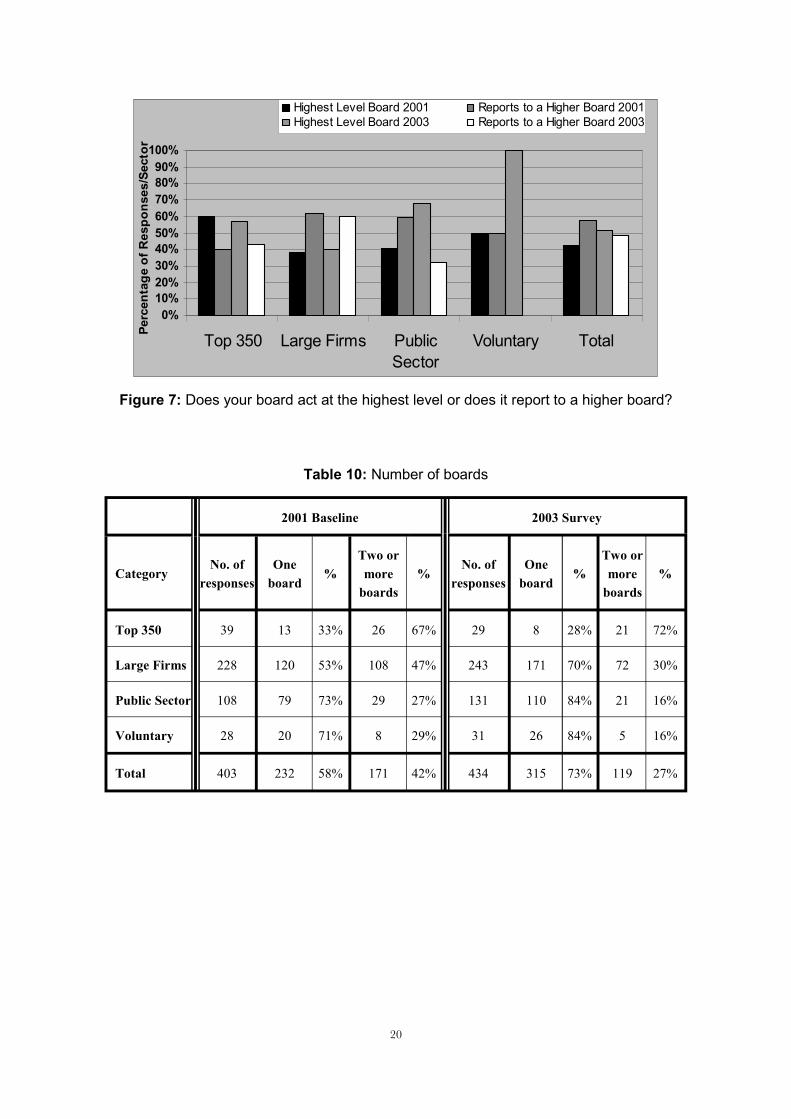
Figure 6 shows the number of boards that respondents’ organisations had, and Figure 7 shows where the respondent’s board sat in the structure. It is pertinent to note that:
· In the case of the Top 350 firms, the majority have two or more boards within their organisation. In 2001, in 60% of the sample the respondent’s board is the highest board, and in 2003 the equivalent figure is 57%. And in only 40% of cases in 2001 did the respondent’s board report to a higher-level board, this figure rising only slightly in 2003. In contrast a slight majority of Large Firms had only one board in 2001 but only 38% constituted the highest board, with 62% reporting to a higher board. In 2003 there is a larger majority with just one board but a very similar proportion constituting the highest board. This presumably reflects the point that Top 350 firms are more often “corporations” or holding companies with a number of subsidiary companies.
· A small minority of public sector and voluntary organisations have more than one board, 27% and 29% respectively in 2001, and falling to 16% for both in 2003. In 2001 about half of these organisations report to another board (or their equivalent) but this falls to a third for public sector organisations in 2003.
· Table 11 shows that there was an increase over the two surveys in respondents representing boards that act at the highest level, and this is particularly the case for public sector and voluntary organisations.
100%90%80%70%60%50%40%30%20%10%0%Pe
rcen
tage
of S
ecto
r
One board 2003 Two or More Boards 2003 One board 2001 Two or More Boards 2001
Top 350 Large Firms Public Voluntary Total Sector
Figure 6: Number of boards
19
0% 10% 20% 30% 40% 50% 60% 70% 80% 90%
100%
i
/
Hi l iHi l i
Top 350 Large F rms Public Sector
Voluntary Total
Perc
enta
ge o
f Res
pons
esSe
ctor
ghest Leve Board 2001 Reports to a Hgher Board 2001 ghest Leve Board 2003 Reports to a Hgher Board 2003
Figure 7: Does your board act at the highest level or does it report to a higher board?
Table 10: Number of boards
2001 Baseline 2003 Survey
Category No. of
responses One
board %
Two or more
boards %
No. of responses
One board
% Two or more
boards %
Top 350 39 13 33% 26 67% 29 8 28% 21 72%
Large Firms 228 120 53% 108 47% 243 171 70% 72 30%
Public Sector 108 79 73% 29 27% 131 110 84% 21 16%
Voluntary 28 20 71% 8 29% 31 26 84% 5 16%
Total 403 232 58% 171 42% 434 315 73% 119 27%
20

Table 11: Does your board act at the highest level?
2001 Baseline 2003 Survey
Category
No. of responses
2001 Highest
level %
Reports to another board %
No. of responses
2003 Highest
level %
Reports to another board %
Top 350 25 15 60% 10 40% 21 12 57% 9 43%
Large Firms 108 41 38% 67 62% 72 29 40% 43 60%
Public Sector 29 12 41% 17 59% 28 19 68% 9 32%
Voluntary 8 4 50% 4 50% 5 5 100% 0 0
Total 170 72 42% 98 58% 126 65 52% 61 48%
Where is health and safety directed?
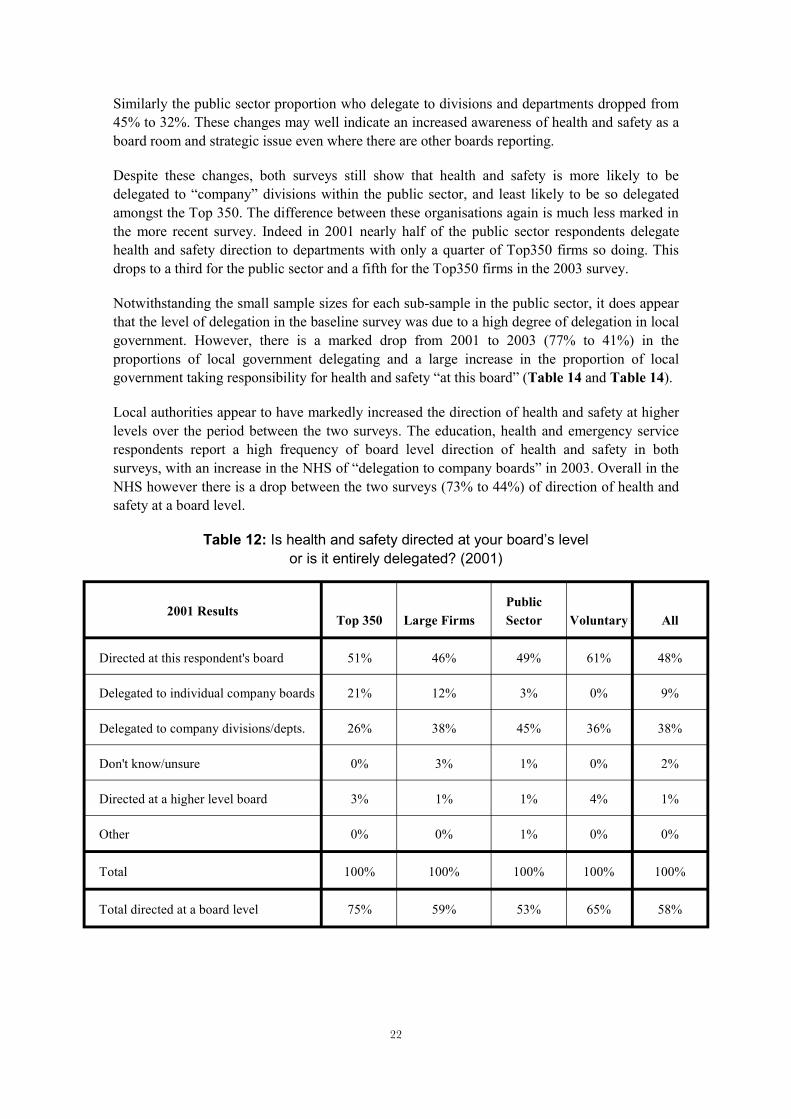
58% of respondents’ organisations directed health and safety at board level in 2001. This figure rose to 66% in 2003 though this was entirely due to rises in the proportions directing “at this level” or “above” for Top 350 and Large Firms. The 2003 survey also shows a marked drop compared to the baseline survey (38% to 26%) in delegation of health and safety to company divisions / departments. In both surveys there appear to be differences between the four types of organisations, though generally less marked in the later survey, as can be seen from Table 12 to Table 14 and Figure 8.
In 2001, the direction of health and safety was more likely to be delegated to an individual company board level in Top 350 firms than the other types of organisations. Indeed, whilst 21% of the Top 350 and 12% of large firms delegated health and safety to individual company boards, virtually none of the public sector and voluntary organisations delegated health and safety to individual company boards (or equivalent). In all likelihood this reflected the differences in organisational structure of the types of organisations, wherein large private organisations have more boards than the public or voluntary sector.
However, in 2003 only 7% of Top 350 firms delegated to individual company boards and the Large Firm equivalent had dropped to 5%. The differences across the types of organisations in this respect are minimal in 2003 all being around 5% of organisations. It is also pertinent to note that the proportion of large firms delegating to company divisions and departments dropped from 38% in 2001 to 23% in 2003.
21
Similarly the public sector proportion who delegate to divisions and departments dropped from 45% to 32%. These changes may well indicate an increased awareness of health and safety as a board room and strategic issue even where there are other boards reporting.
Despite these changes, both surveys still show that health and safety is more likely to be delegated to “company” divisions within the public sector, and least likely to be so delegated amongst the Top 350. The difference between these organisations again is much less marked in the more recent survey. Indeed in 2001 nearly half of the public sector respondents delegate health and safety direction to departments with only a quarter of Top350 firms so doing. This drops to a third for the public sector and a fifth for the Top350 firms in the 2003 survey.
Notwithstanding the small sample sizes for each sub-sample in the public sector, it does appear that the level of delegation in the baseline survey was due to a high degree of delegation in local government. However, there is a marked drop from 2001 to 2003 (77% to 41%) in the proportions of local government delegating and a large increase in the proportion of local government taking responsibility for health and safety “at this board” (Table 14 and Table 14).
Local authorities appear to have markedly increased the direction of health and safety at higher levels over the period between the two surveys. The education, health and emergency service respondents report a high frequency of board level direction of health and safety in both surveys, with an increase in the NHS of “delegation to company boards” in 2003. Overall in the NHS however there is a drop between the two surveys (73% to 44%) of direction of health and safety at a board level.
Table 12: Is health and safety directed at your board’s level or is it entirely delegated? (2001)
2001 Results Top 350 Large Firms
Public Sector Voluntary All
Directed at this respondent's board 51% 46% 49% 61% 48%
Delegated to individual company boards 21% 12% 3% 0% 9%
Delegated to company divisions/depts. 26% 38% 45% 36% 38%
Don't know/unsure 0% 3% 1% 0% 2%
Directed at a higher level board 3% 1% 1% 4% 1%
Other 0% 0% 1% 0% 0%
Total 100% 100% 100% 100% 100%
Total directed at a board level 75% 59% 53% 65% 58%
22

Table 13: Is health and safety directed at your board’s level or is it entirely delegated? (2003)
2003 Results Top 350 Large Firms
Public Sector Voluntary All
Directed at this respondent's board 62% 63% 50% 61% 58%
Delegated to individual company boards 7% 5% 4% 3% 5%
Delegated to company divisions/depts. 21% 23% 32% 32% 26%
Don't know/unsure 3% 3% 2% 0% 3%
Directed at a higher level board 3% 3% 4% 3% 3%
Other 3% 3% 10% 0% 5%
Total 100% 100% 100% 100% 100%
Total directed at a board level 72% 71% 58% 67% 66%
Table 14: Where health and safety is directed within the public sector (2001)
Sample no.
Directed at this board
Delegated company boards
Delegated depts
Higher board
Other Unsure Totals Total
directed at board
Education 48 52% 2% 42% 0% 2% 2% 100% 54%
Local government
22 9% 9% 77% 5% 0% 0% 100% 23%
Emergency services
16 63% 0% 38% 0% 0% 0% 100% 63%
NHS 22 73% 0% 27% 0% 0% 0% 100% 73%
23

Table 15: Where health and safety is directed within the public sector (2003)
Sample no.
Directed at this board
Delegated company boards
Delegated depts
Higher board
Other Unsure Totals Total
directed at board
Education 50 52% 4% 30% 2% 8% 4% 100% 58%
Local government
32 56% 0% 41% 3% 0% 0% 100% 59%
Emergency services
24 63% 0% 25% 4% 8% 0% 100% 67%
NHS 22 26% 11% 30% 7% 26% 0% 100% 44%
0% Di is
indivil
isi /
/ il
li
10%
20%
30%
40%
50%
60%
rected at threspo ndents bo ard
Delegated to dual co mpany bo ards
De egated to co mpany
div o ns department
do no t kno w unsure Directed at a h gher leve
Perc
enta
ge o
f Res
pond
ents
2001 Base ne 2003
Figure 8: Where is health and safety directed?
24
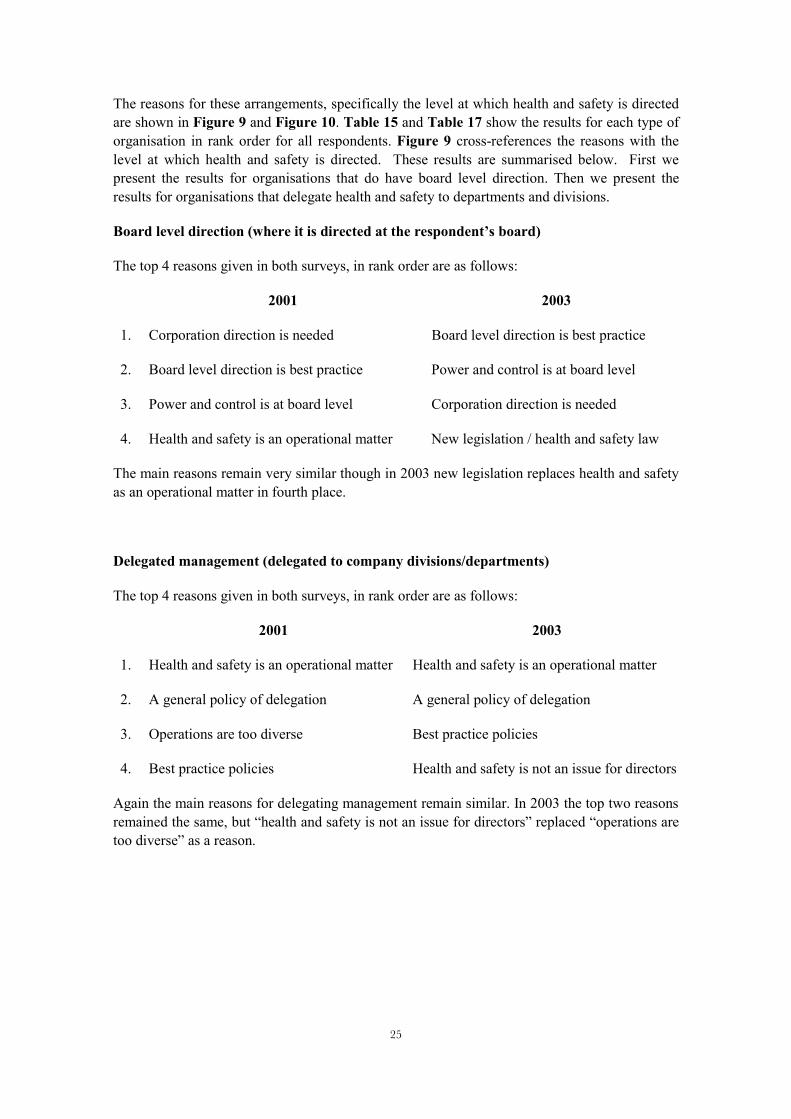
The reasons for these arrangements, specifically the level at which health and safety is directed are shown in Figure 9 and Figure 10. Table 15 and Table 17 show the results for each type of organisation in rank order for all respondents. Figure 9 cross-references the reasons with the level at which health and safety is directed. These results are summarised below. First we present the results for organisations that do have board level direction. Then we present the results for organisations that delegate health and safety to departments and divisions.
Board level direction (where it is directed at the respondent’s board)
The top 4 reasons given in both surveys, in rank order are as follows:
2001 2003
1. Corporation direction is needed Board level direction is best practice
2. Board level direction is best practice Power and control is at board level
3. Power and control is at board level Corporation direction is needed
4. Health and safety is an operational matter New legislation / health and safety law
The main reasons remain very similar though in 2003 new legislation replaces health and safety as an operational matter in fourth place.
Delegated management (delegated to company divisions/departments)
The top 4 reasons given in both surveys, in rank order are as follows:
2001 2003
1. Health and safety is an operational matter Health and safety is an operational matter
2. A general policy of delegation A general policy of delegation
3. Operations are too diverse Best practice policies
4. Best practice policies Health and safety is not an issue for directors
Again the main reasons for delegating management remain similar. In 2003 the top two reasons remained the same, but “health and safety is not an issue for directors” replaced “operations are too diverse” as a reason.
25

0%
5%
i ipolici
f i ial l at
l
l lati / l
i
l
poli
j i
i i
ibusi
tage
wit
til
Dil i i
ivis i /Di l l All
10%
15%
20%
25%
30%
35%
40%
45%
Corporate direct on is
needed
Best pract ce
es
Pow er and nanc
controboard leve
New egis onH&S aw s
Operat ons are too
diverse to direct at a corporate
leve
Company has a
general cy of
delegation
Corporate body is ust a holding company
H&S s an operat onal
matter
H&S s not an issue
for directors
H&S is a part cular
ness risk
Other
Perc
enh
par
cuar
boa
rd a
rrang
emen
t
rected at this respondent’s board De egated to ndiv dual company boards Delegated to company d ons department
rected at a higher eve board
Figure 9: Reasons for level at which health and safety is directed (by board arrangement) 2001
0%
5%
i ice fi ial l at
l
l /
l
l policy of
i
i il
i
ii
Di
l ivi /
Di
10%
15%
20%
25%
30%
35%
40%
45%
Corporate direct on is
needed
Best practpolicies
Power and nanc
controboard leve
New legis ationH&S laws
Operations are too
diverse to direct at a corporate
leve
Company has a
genera
delegat on
Corporate body s just a holding company
Health & safety s an operationa
matter
H&S is not an issue for
directors
H&S is a part cular business
risk
Other
Perc
enta
ge w
th p
artc
ular
boa
rd a
rrang
emen
t
rected at this respondent’s board
Delegated to individual company boards
De egated to company d sionsdepartment
rected at a higher level board
All
Figure 10: Reasons for level at which health and safety is directed(by board arrangement) 2003
26

Turning now to the results for all organisations / types of organisations (Table 16 and Table 17) we can see that the reasons for board level arrangements remained similar in 2001 and 2003. Best practice policies, corporate direction and health and safety being an operational matter remained in the top 4 in both surveys.
It is pertinent to note that:
· Power and financial control resting with the board is cited more than twice as frequently in 2003 than in 2001;
· There is a marked decrease over the two surveys of those citing diversity of operations being too great as a reason for board arrangements. In 2001 11% cited this as a reason whilst in 2003 only 4% did. Most markedly was the change in frequency of the Top 350 firms, 15% of whom cited this as a reason for delegation in 2001 and only 2% in 2003.
· There was a slight decrease over the two surveys in the frequency of companies saying that they had a policy of delegation, 12% in 2001 and 9% in 2003 with the greatest drop being again amongst the Top 350 respondents.
· Public Sector organisations, which are most likely to delegate health and safety direction, in 2001 more frequently cite health and safety being an operational matter as a reason for arrangements, but in 2003 the public sector cites this no more frequently than the private sector.
· Top 350 firms are most likely to cite the need for corporate direction. In both surveys they were more likely than Large Firms to do this. And in 2003 the public sector was less likely than in 2001 to cite this reason (17% compared to 8%).
27

Table 16: Reasons for level at which health and safety is directed (by sector, percentage by total number of responses given, ranked by “All”).(2001)
Top 350 Large Firms Public Sector Voluntary All
Best practice policies 13% 23% 14% 23% 19%
Corporate direction is needed 21% 15% 17% 19% 17%
H&S is an operational matter 9% 14% 21% 23% 16%
Co. has a general policy of delegation 10% 14% 11% 6% 12%
Ops too diverse to direct corporately 15% 12% 9% 6% 11%
Other 15% 4% 11% 3% 7%
Power & financial control at board 4% 6% 7% 10% 6%
New legislation / H&S Laws 6% 5% 4% 6% 5%
H&S is not an issue for directors 0% 4% 4% 0% 3%
H&S is a particular business risk 6% 3% 2% 3% 3%
Corporate body is just a holding co. 0% 1% 1% 0% 1%
100% 100% 100% 100% 100%
28

Table 17: Reasons for level at which health and safety is directed (by sector, percentage by total number of responses given, ranked by “All”).(2003)
Top 350 Large Firms Public Sector Voluntary All
Best practice policies 24% 19% 20% 26% 20%
Power & Financial control at board 7% 16% 13% 9% 14%
Corporate direction is needed 26% 14% 8% 14% 13%
H&S is an operational matter 12% 11% 11% 23% 12%
Other 12% 8% 14% 3% 10%
Co. has a general policy of delegation 2% 10% 9% 9% 9%
New legislation/H&S Laws 10% 9% 8% 6% 9%
H&S is a particular business risk 5% 4% 6% 6% 5%
Ops too diverse to direct corporately 2% 5% 4% 0% 4%
H&S is not an issue for directors 0% 3% 4% 3% 3%
Corporate body is just a holding co. 0% 1% 1% 3% 1%
100% 100% 100% 100% 100%
3.5 APPOINTMENT OF HEALTH AND SAFETY DIRECTORS
These results are presented in a mixture of tables and figures over the following pages, from Table 18 to Table 28, and Figure 11 to Figure 27.
Has a director been assigned responsibility for health and safety?
When asked whether an individual member of the board has responsibility for health and safety the surveys found that:
· There was a slight rise in board level responsibility for health and safety between the two surveys. In 2001, 75% of respondents have a board level person responsible for health and safety rising to 82% in 2003 (see Figure 11 and Table 18). In 2001 just over half (54%) of these were appointed as “Director” of health and safety rising to around 4/5s in 2003 (see Table 20 and Table 21);
29
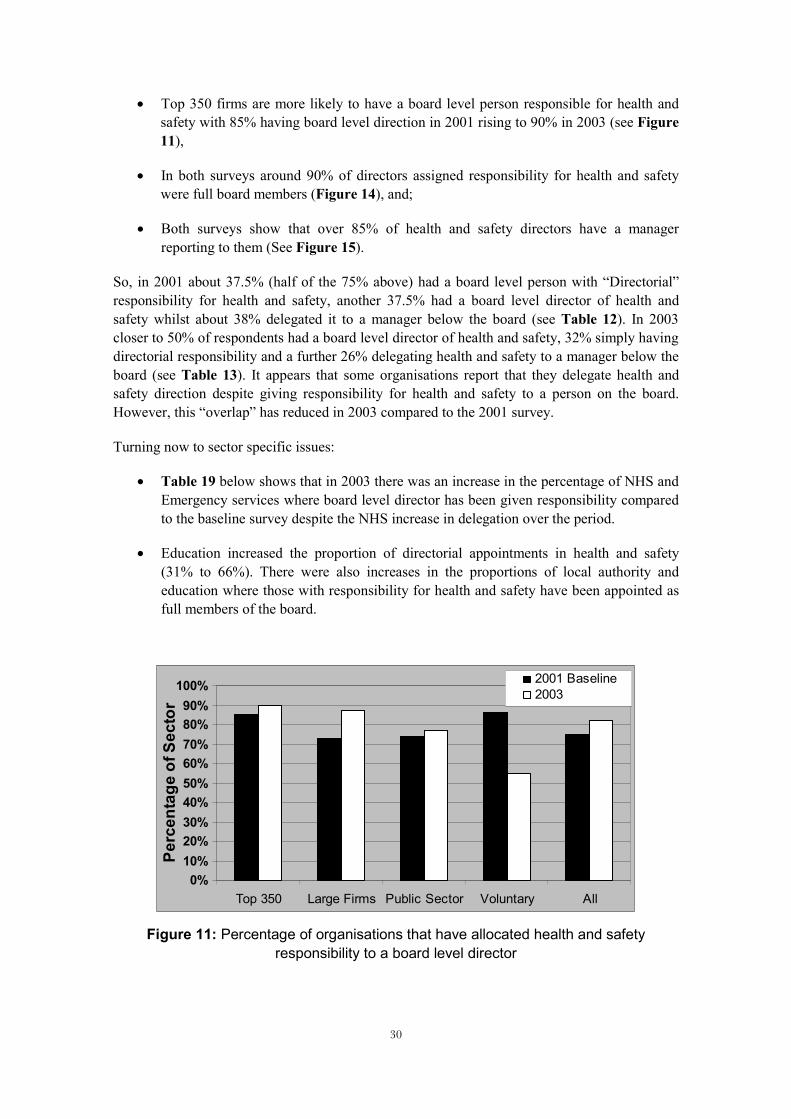
· Top 350 firms are more likely to have a board level person responsible for health and safety with 85% having board level direction in 2001 rising to 90% in 2003 (see Figure 11),
· In both surveys around 90% of directors assigned responsibility for health and safety were full board members (Figure 14), and;
· Both surveys show that over 85% of health and safety directors have a manager reporting to them (See Figure 15).
So, in 2001 about 37.5% (half of the 75% above) had a board level person with “Directorial” responsibility for health and safety, another 37.5% had a board level director of health and safety whilst about 38% delegated it to a manager below the board (see Table 12). In 2003 closer to 50% of respondents had a board level director of health and safety, 32% simply having directorial responsibility and a further 26% delegating health and safety to a manager below the board (see Table 13). It appears that some organisations report that they delegate health and safety direction despite giving responsibility for health and safety to a person on the board. However, this “overlap” has reduced in 2003 compared to the 2001 survey.
Turning now to sector specific issues:
· Table 19 below shows that in 2003 there was an increase in the percentage of NHS and Emergency services where board level director has been given responsibility compared to the baseline survey despite the NHS increase in delegation over the period.
· Education increased the proportion of directorial appointments in health and safety (31% to 66%). There were also increases in the proportions of local authority and education where those with responsibility for health and safety have been appointed as full members of the board.
0% 10% 20% 30% 40% 50% 60% 70% 80% 90%
100%
i i l All
line 2003
Top 350 Large F rms Publ c Sector Vo untary
Perc
enta
ge o
f Sec
tor
2001 Base
Figure 11: Percentage of organisations that have allocated health and safety responsibility to a board level director
30

Table 18: Percentage where a board level director has been given responsibility for health and safety (all sectors).
2001 Baseline 2003 Survey
Category Number Percentage of type Number Percentage of type
Top 350 33 85% 26 90%
Large Firms 166 73% 212 87%
Public Sector 80 74% 103 77%
Voluntary 24 86% 17 55%
All 303 75% 358 82%
Table 19: In the public sector percentage where a board level director has been given responsibility for health and safety
2001 Baseline 2003 Survey
Category Number Percentage of
category Number
Percentage of category
Education 33 69% 32 64%
Emergency services
13 81% 24 100%
Local authority
17 77% 22 69%
NHS 17 77% 25 93%
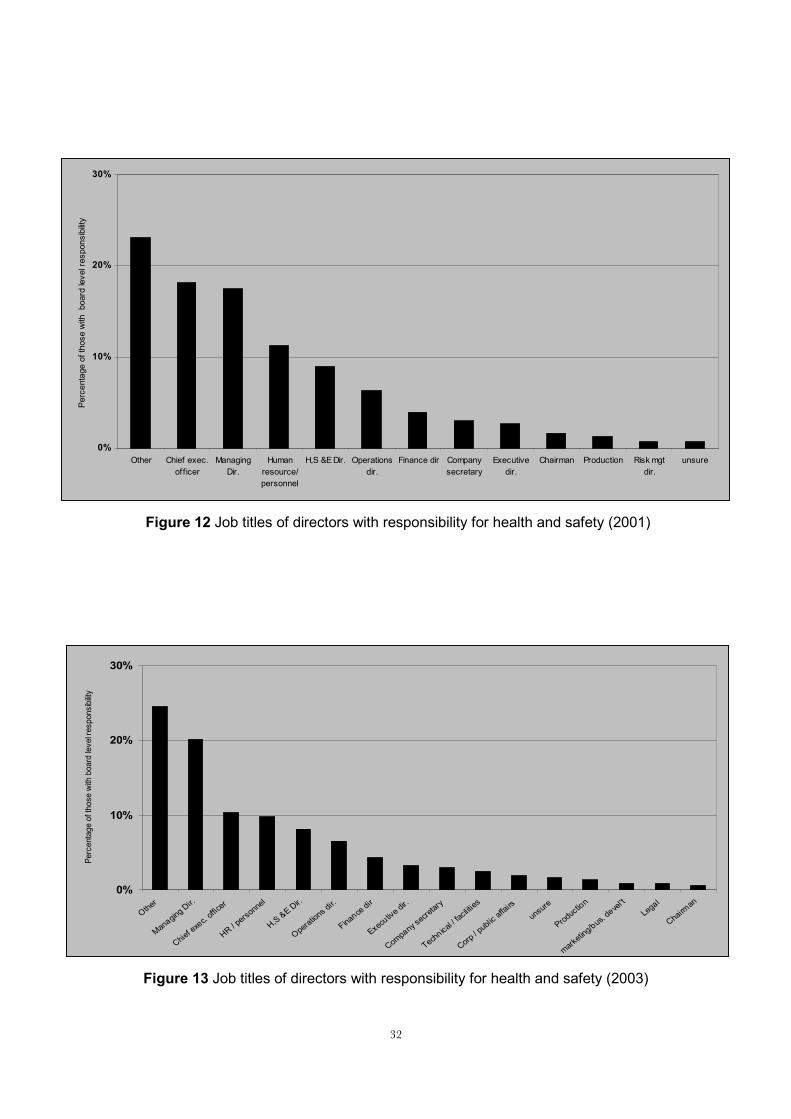
Figure 12 and Figure 13 summarise the job titles of those board level persons given responsibility for health and safety. The most common titles include Chief Executive Officer, Managing Director and Human Resource Directors. The “Other” category includes many public sector job titles, such as Head Teacher, Vice Principal, Chief Constable and so on.
31
0%
10%
20%
30%
Other Chief exec. of ficer
Managing Dir.
Human resource/ personnel
H,S &E Dir. Operations dir.
Finance dir Company secretary
Executive dir.
Chairman Production Risk mgt dir.
unsure
Perc
enta
ge o
f tho
se w
ith b
oard
leve
l res
pons
ibilit
y
32
Figure 12 Job titles of directors with responsibility for health and safety (2001)
Figure 13 Job titles of directors with responsibility for health and safety (2003)
0%
10%
20%
30%
Other
Managing Dir.
Chief exec. off
icer
HR / personnel
H,S&E Dir.
Operations dir.
Financedir
Executive dir.
Company secretary
Technical / facilities
Corp/ public
affairs
unsure
Productio
n
marketing/bus. devel't
Legal
Chairman
Perc
enta
ge o
f tho
se w
ith b
oard
leve
l res
pons
ibility

0%
10%
20%
30%
40%
50%
60%
70%
80%
90%
irms
100%
Top 350 Large F Public Sector Voluntary All
Board Member appointed as director of H&S 2001 Full member of the board 2001 Board Member appointed as director of H&S 2003 Full member of the board 2003
Figure 14: Percentage of directors with health and safety responsibility that are full board members and have been appointed as a “director” of health and safety
20032001 Baseline
100%
90%
80%
70%
60%
50%
40%
30%
20%
10%
0% Top 350 Large Firms Public Sector Voluntary All
Figure 15 : Percentage of health and safety directors who have a health and safety manager reporting to them.
33

Table 20: Percentage of directors with health and safety responsibility who have been appointed as a “director” of health and safety, and who are full board members (2001)
Category 2001
The person with health and safety responsibility is appointed as director
of H&S
The person with health and safety responsibility is a full
member of the board
Number % Number %
Top 350 22 67% 27 82%
Large Firms 88 53% 154 93%
Public Sector 43 54% 69 86%
Voluntary 11 46% 21 88%
All 164 54% 271 89%
Table 21: Percentage of directors with health and safety responsibility who have been appointed as a “director” of health and safety, and who are full board members (2003)
Category 2003
The person with health and safety responsibility is appointed as director
of H&S
The person with health and safety responsibility is a full
member of the board
Number % Number %
Top 350 15 57.5% 23 88%
Large Firms 124 58% 199 94%
Public Sector 66 64% 96 93%
Voluntary 6 35% 17 100%
All 211 59% 335 94%
34

Table 22: In the public sector percentage of directors with health and safety responsibility who have been appointed as a “director” of health and safety, and who
are full board members (2001)
The person with health and safety responsibility is
appointed as director of H&S
The person with health and safety responsibility is a full
member of the board
Category Number % Number %
Education 15 31% 30 63%
Emergency services 9 56% 12 75%
Local authority 11 50% 12 55%
NHS 9 41% 15 68%
Table 23: In the public sector percentage of directors with health and safety responsibility who have been appointed as a “director” of health and safety, and who
are full board members (2003)
The person with health and safety responsibility is appointed as director
of H&S
The person with health and safety responsibility is a full
member of the board
Category Number % Number %
Education 32 66% 31 97%
Emergency services 24 67% 21 88%
Local authority 22 59% 21 95%
NHS 25 64% 23 92%
35

Table 24: Percentage of health and safety directors with a manager reporting to them
Category Number 2001 % 2001 Number 2003 % 2003
Top 350 28 85% 20 77%
Large Firms 151 91% 188 89%
Public Sector 62 78% 96 93%
Voluntary 21 88% 16 94%
All 262 86% 320 89%
Check questions on directors’ role in health and safety
Two additional questions were included in the follow-up survey to check the status of health and safety directors. In those cases where a respondent stated that a board level director been given responsibility for health and safety, the respondent was then asked:
12a1 Has this been stated in writing in, for example, in the director’s job description or the company’s health and safety manual?
12a2 Does this person actively direct health and safety, e.g. set company health and safety policy and strategy, recommend targets etc?
Table 25 summarises the proportion of respondents who stated Yes to the two additional questions. It is apparent that the vast majority of health and safety directors do have a substantive role.
36
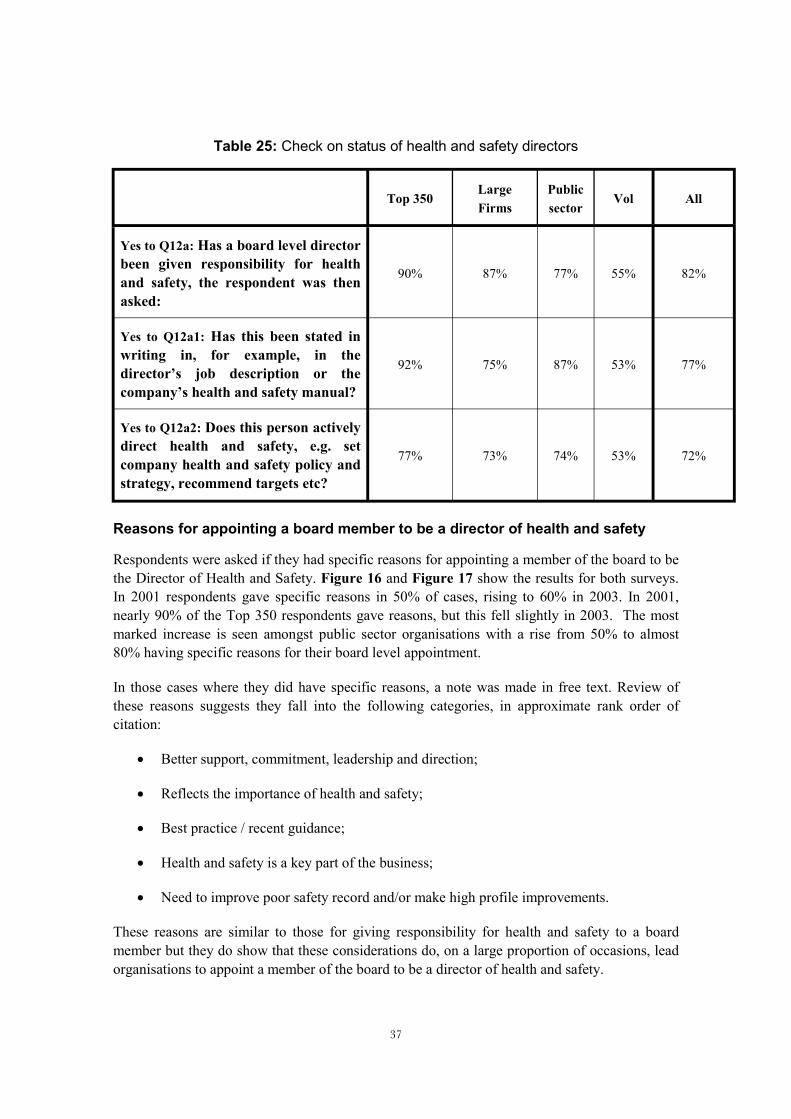
Table 25: Check on status of health and safety directors
Top 350 Large Firms
Public sector
Vol All
Yes to Q12a: Has a board level director been given responsibility for health and safety, the respondent was then asked:
90% 87% 77% 55% 82%
Yes to Q12a1: Has this been stated in writing in, for example, in the director’s job description or the company’s health and safety manual?
92% 75% 87% 53% 77%
Yes to Q12a2: Does this person actively direct health and safety, e.g. set company health and safety policy and strategy, recommend targets etc?
77% 73% 74% 53% 72%
Reasons for appointing a board member to be a director of health and safety
Respondents were asked if they had specific reasons for appointing a member of the board to be the Director of Health and Safety. Figure 16 and Figure 17 show the results for both surveys. In 2001 respondents gave specific reasons in 50% of cases, rising to 60% in 2003. In 2001, nearly 90% of the Top 350 respondents gave reasons, but this fell slightly in 2003. The most marked increase is seen amongst public sector organisations with a rise from 50% to almost 80% having specific reasons for their board level appointment.
In those cases where they did have specific reasons, a note was made in free text. Review of these reasons suggests they fall into the following categories, in approximate rank order of citation:
· Better support, commitment, leadership and direction;
· Reflects the importance of health and safety;
· Best practice / recent guidance;
· Health and safety is a key part of the business;
· Need to improve poor safety record and/or make high profile improvements.
These reasons are similar to those for giving responsibility for health and safety to a board member but they do show that these considerations do, on a large proportion of occasions, lead organisations to appoint a member of the board to be a director of health and safety.
37
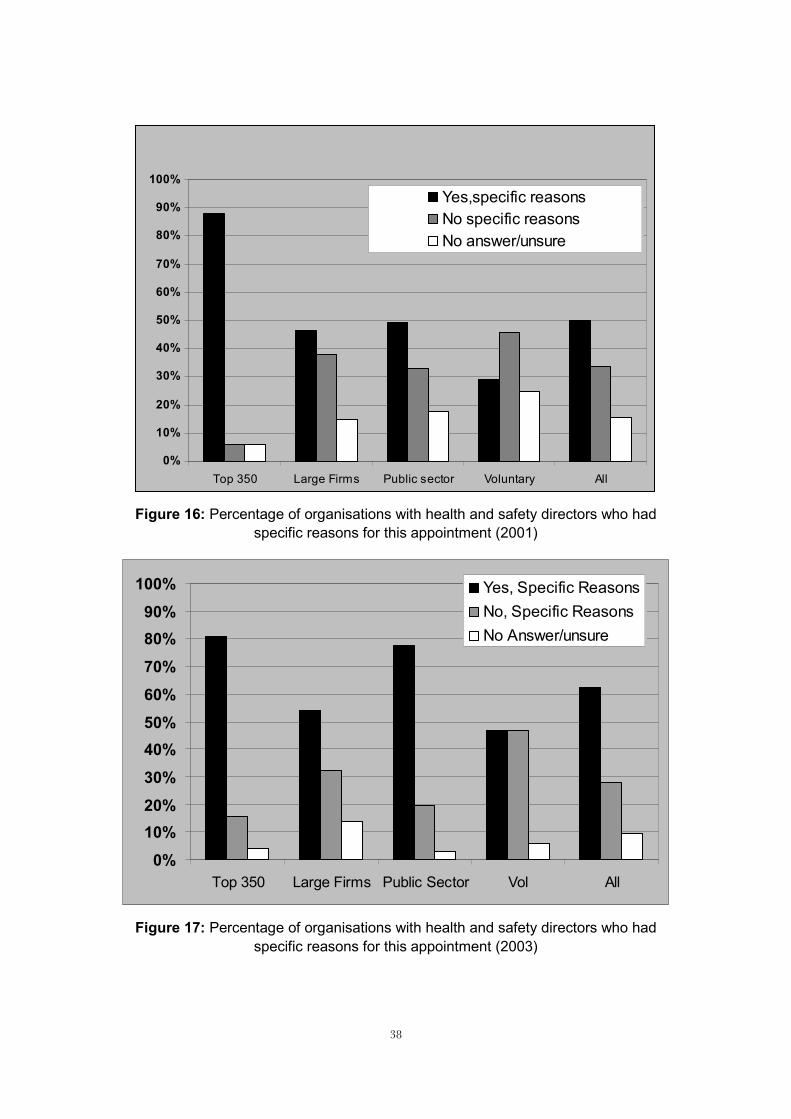
0%
10%
20%
30%
40%
50%
60%
70%
80%
90%
i
i
/
100%
Top 350 Large F rms Public sector Voluntary All
Yes,specif c reasons No specific reasons No answer unsure
Figure 16: Percentage of organisations with health and safety directors who had specific reasons for this appointment (2001)
0% 10% 20% 30% 40% 50% 60% 70% 80% 90%
100%
i l All
i/
Top 350 Large F rms Public Sector Vo
Yes, Specific Reasons No, Specif c Reasons No Answer unsure
Figure 17: Percentage of organisations with health and safety directors who had specific reasons for this appointment (2003)
38

Organisations without board level health and safety directors
As shown in Figure 18, Figure 19, Table 26, and Table 27 in the vast majority of those cases where organisations lack board level health and safety directors both surveys find that there is a person with a reporting line into the board.
Table 26: Of those respondents who do not have someone on the board, does the most senior health and safety person have a reporting line to the board? (2001)
2001 Yes No Unsure
Number % Number % Number %
Top 350 5 83% 1 17% 0 0%
Large Firms 54 87% 3 5% 4 6%
Public Sector 25 89% 2 7% 1 4%
Voluntary 3 75% 1 25% 0 0%
All 87 87% 7 7% 5 5%
Table 27: Of those respondents who do not have someone on the board, does the most senior health and safety person have a reporting line to the board? (2003)
2003 Yes No Unsure
Number % Number % Number %
Top 350 2 67% 0 0% 1 33%
Large Firms 26 84% 1 3% 4 13%
Public Sector 22 73% 4 13% 4 13%
Voluntary 14 100% 0 0% 0 0%
All 64 82% 5 6% 9 12%
39

0%
10%
20%
30%
40%
50%
60%
70%
80%
90%
100%
i
No
Top 350 Large F rm s Public sector Voluntary All
Yes Unsure
Figure 18: Of those respondents who do not have someone on the board, does the most senior health and safety person have a reporting line to the board? (2001)
0% 10% 20% 30% 40% 50% 60% 70% 80% 90%
100%
lic Vol All
No
Top 350 Large Firms PubSector
Yes
Unsure
Figure 19: Of those respondents who do not have someone on the board, does the most senior health and safety person have a reporting line to the board? (2003)
40

Who led the last review of health and safety policy
As a “test” of which director is responsible for health and safety direction, respondents were asked who led the last review of the company’s health and safety policy. The results are shown in Figure 20 and Figure 21(for each of the four types of organisations) and Figure 23 (for all respondents). The job titles of the person who led the last review of policy have similar job titles to those of the director responsible for health and safety, namely Managing Directors, CEOs, Other, Health and Safety Directors and Operations Directors.
41

0%
5%
10%
15%
20%
25%
30%
35%
i i i /Vi i ir / i
l i) Dir
i /
FiDi /
i
l
Ent re BoardCha rman Ch ef Exec Officer
Exec Dir. Dep. ce Chair
Manag ng Dir.
Ops DOff cer
HR/PersoneDir.
Product on Dir
Risk Mngt Dir.
H&S (& Envt
Corp & Public
affa rsComs.
nance r. Officer
Company Sec.
Other None No Answ er / Unsure
Top 350
Large f rms
Public s ector
Vo untary
Figure 20: Who led the last review of health and safety policy (by type of organisation) (2001)
42

43
Figure 21: Who led the last review of health and safety policy (by type of organisation, where over 4%) (2003)
0%
5%
10%
15%
20%
25%
30%
35%
Entire b
oard
Chairm
an
Chief E
xec O
fficer
Exec Dir.
Manag
ingD
ir. Ops
Dir/Offic
er HR/Pers
onel
Dir. H&S (&
Envt) D
ir
Corp& P
ublic
affair
s/Com
ms Fina
nce Dir./
Officer
Co. Sec
retary
Top 350 Large Firms Govt Vol

0%
2%
4%
6%
8%
ti i f Offi
/Vi ir / Offi
ti t ) lic i /
FiDi i
Ot /
10%
12%
14%
16%
18%
20%
En re Board Cha rman Chie Exec cer
Exec Dir. Dep. ce Chair
Managing Dir.
Ops Dcer
HR/Personel Dir.
Produc on Dir
Risk MngDir.
H&S (& EnvtDir
Corp & Pubaffa rsComs.
nance r./Off cer
Company Sec.
her None No AnswerUnsure
Figure 22: Who led the last review of health and safety policy (for all respondents)? (2001)
44

ir.
ir/
/
i
ir i i /
ir./ i
ir
/
i
/Vi
i
/ j
0%
5%
10%
15%
20%
25%
Chairman
Chief Exec Officer
Exec Dir.
Managing D
Ops D Officer
HR Personel Dir.
Product on Dir
H&S (&Envt) Dir
Risk Mngt DCorp & Publ c affa rs Comms
Finance D Off cer
Treasury D
Co. Secretary
Other
None No answer unsure
No pol cy
Dep. ce Chair
Ent re board
Invstment Ma or Projs.
Legal Dir. Mktg/Bus Dev Man
Security director
Figure 23: Who led the last review of health and safety policy (for all respondents)? (2003)
45

Who decided upon the health and safety responsibilities of the board?
In the vast majority of cases shown by both surveys the board as a whole or the CEO decided upon the board’s health and safety responsibilities. This is illustrated in Figure 24 and Figure 25.
0%
10%
20%
30%
40%
50%
60%
/ il l / i
i
li
l
All
The Board Chief Exec Manag ng
Director
Hea th & Safety Manager
ExternaConsultant
HR Personel Director
Operat ons Director
Don't Know Other
Perc
enta
ge o
f sec
tor
Top 350
Large F rms
Pub c Sector
Vo untary
Figure 24: Who decided upon board’s health and safety responsibilities (2001)
0%
10%
20%
30%
40%
50%
imanager
/
irms
Vol All
The board The Chief Execut ve / Managing Director
A health & safety
External consultant
HR personnel director
Operations director
Don’t Know Other
Perc
enta
ge o
f sec
tor
Top 350 Large FGovt
Figure 25: Who decided upon board’s health and safety responsibilities (2003)
46

Public description of health and safety role of the board.
Table 28 indicates that in 2001 almost two thirds of respondents published a description of their roles but this fell to around a half in 2003. Figure 26 and Figure 27 show that far fewer of those organisations without board level health and safety direction have published their arrangements in both surveys. This is more marked in 2003 with just over 70% in 2001 and almost 90% of those with board level health and safety direction publishing a description of their roles.
Table 28: Percentage of organisations who have assigned health and safety responsibility to a director, that have formally/publicly described the role of this person
2001 Baseline 2003 Survey
Category Number Percentage Number Percentage
Top 350 24 73% 19 73%
Large Firms 100 60% 92 43%
Public Sector 51 64% 57 55%
Voluntary 16 67% 6 35%
All 191 63% 174 49%
47

0%
10%
20%
30%
40%
50%
60%
70%
80%
90%
i l l ibi
fi
/wi
i le
le
100%
Board level respons bility a located No board leve respons lity allocated
Perc
enta
ge o
thos
e w
thth
out
resp
onsi
bility
allo
cate
d
Descr bed ro
Not described ro
Figure 26: Relationship between board level health and safety responsibility allocation and the public description of the board’s health and safety role (2001)
0%
10%
20%
30%
40%
50%
60%
70%
80%
90%
100%
l l
/
le
i
Board level responsibility allocated No board leve responsibi ity allocated
Perc
enta
ge o
f tho
se w
ithw
ithou
t re
spon
sibi
lity
allo
cate
d
Described Ro
Not Descr bed Role
Figure 27: Relationship between board level health and safety responsibility allocation and the public description of the board’s health and safety role (2003)
48
3.6 FACTORS INFLUENCING DESIGN OF ARRANGEMENTS
Factors influencing board level arrangements.
Respondents were asked to rate on a scale of 1 to 3 how much each of a list of factors influenced the design of board level health and safety arrangements, where:
1 = Not at all
2 = Somewhat
3 = A lot
The responses are presented as an average score on a scale of 1 to 3 in Table 29, Table 30Figure 28, and Figure 29.
It can be noted that, in both surveys:
· Many factors have very similar scores;
· No one factor stands out as being very highly rated;
· Common to the top 5 ranked factors in both surveys are:
o The general increase in the importance of health and safety,
o HSC/HSE guidance,
o Concern about occupational health performance; and,
o Corporate responsibility.
· The Turnbull report, media and shareholder pressure are the lowest ranked factors in both surveys.
49

r i ions l
i in i
/ l i
f
i
f i Dii
ii
k i
ii i i
l ia l
i
lAll
1.0
1.2
1.4
1.6
1.8
2.0
2.2
2.4
2.6
We have high sk operat
Generancrease
mport ance of H&S
HSE HSC guidance
Gen concern about occ.
healt h perf ormance
Concern about corporat e
r esponsibilit y
Increased H&S regu at ons
Fear o Co. being
prosecut ed
Corporat e governance requ rement
Risk o be ng sued
rect or 's f ear of prosecut on
An acc dent or near m ss
Gen concern about saf et y perf ormance
The prospect of corporat e
ll ing law
Regulat or pressure
Best pract ce benchmark ng
The ROSPA init at ve
The Turnbulreport
MedPr essur e
Shareho der pressure
Average sec t or scor e
Top 350 Large F rms Public sector Vo untary
Figure 28: Ranked (by “All”) factors influencing design of board level arrangements (1 - no influence, 3 - a lot of influence) (2001)
50

ibili / i
l i
l
ional &/ ion
signifiisk
iregul i
Di i / i
igh ions i
Ki l
l ll i
“Di ion
l
i
Vol All
1.0
1.2
1.4
1.6
1.8
2.0
2.2
2.4
2.6
General increase in
importance of H&S
Concern about corporate
respons tyeth cal image
Generaconcern about
Safety performance
HSE / HSC gu dance
Generaconcern about occupat
health performance
Corporate governance
requirements or percept
that H&S is a cant
business r
Fear of the company being
prosecuted
Risk of be ng sued
Increased H&S at ons
rectors feared they’d be prosecuted
An acc dent or near m ss
We have hrisk operat
Best practice benchmark ng
The prospect of a Corporate
lling aw
Regu ator pressure
Media pressure The Turnbureport
The ROSPA initiat ve
rector Acton Safety and
Health”
Shareho der pressure
Top 350 Large F rms Govt
Figure 29: Ranked (by “All”) factors influencing design of board level arrangements (1 - no influence, 3 - a lot of influence) (2003)51

Table 29: Ranked factors influencing design of board level arrangements (2001)
Top 350 Large Firms Public Sector Voluntary All
General increase in importance of H&S 2.4 2.2 1.9 1.9 2.2
We have high risk operations 2.4 2.2 2.3 1.9 2.2
HSE/HSC guidance 2.2 2.2 2.1 2.0 2.1
Gen concern about occ. health performance 2.3 2.1 2.2 1.9 2.1
Corporate governance requirement &/ or perception that H&S is a significant business risk
2.4 2.0 2.1 1.6 2.1
Corporate governance requirement 2.2 2.0 2.0 1.5 2.0
Fear of Co. being prosecuted 2.3 2.1 2.0 1.7 2.0
Risk of being sued 2.2 2.0 2.0 1.7 2.0
Increased H&S regulations 1.9 2 2.1 1.9 2.0
Director's fear of prosecution 1.9 2.0 1.9 1.6 2.0
Gen concern about safety performance 2.1 1.8 2.0 1.7 1.9
An accident or near miss 2.0 1.9 1.9 1.7 1.9
Regulator pressure 1.7 1.9 1.8 1.9 1.9
Best practice benchmarking 2.1 1.9 1.8 1.5 1.9
The prospect of corporate killing law 1.9 1.9 1.9 1.6 1.9
The ROSPA initiative “Director Action on Safety and Health”
1.9 1.8 1.9 1.6 1.8
The Turnbull report 2.0 1.6 1.7 1.6 1.7
Media Pressure 1.8 1.6 1.8 1.5 1.7
Shareholder pressure 1.8 1.5 1.4 1.3 1.5
Average score for all factors 2.1 1.9 1.9 1.7 1.9
52

Table 30: Ranked factors influencing design of board level arrangements (2003)
Top 350 Large Firms Public Sector
Voluntary All
General increase in importance of H&S 2.3 2.1 2.2 2.0 2.1
Concern about corporate responsibility/ ethical image
2.4 2.1 2.2 1.6 2.1
General concern about safety performance 2.3 2.1 2.1 1.7 2.1
HSE/HSC guidance 2.1 2.1 2.1 1.8 2.0
General concern about occupational health performance
2.1 2.0 2.1 1.7 2.0
Corporate governance requirement &/ or perception that H&S is a significant business risk
2.2 2.0 2.1 1.6 2.0
Fear of Co. being prosecuted 2.2 2.0 2.1 1.4 1.9
Risk of being sued 2.1 2.0 2.0 1.5 1.9
Increased H&S regulations 2.0 2.0 1.9 1.6 1.9
Director's fear of prosecution 2.1 2.0 2.0 1.3 1.8
An accident / or near miss 1.9 1.9 1.9 1.4 1.8
We have high risk operations 2.0 1.7 1.9 1.5 1.8
Best practice benchmarking 1.9 1.8 1.9 1.5 1.8
The prospect of corporate killing law 1.9 1.8 1.7 1.4 1.7
Regulator Pressure 1.7 1.7 1.8 1.3 1.6
Media pressure 1.7 1.4 1.9 1.4 1.6
The Turnbull report 1.8 1.6 1.7 1.3 1.6
The ROSPA initiative “Director Action on Safety and Health”
1.7 1.7 1.5 1.3 1.6
Shareholder pressure 1.7 1.4 1.3 1.0 1.4
Average score for all factors 2.0 1.9 1.9 1.5 1.8
53

Extent of pressures on directors to manage health and safety
Respondents were asked to rate (on a scale of 1 to 5) the extent to which they agreed that there are VERY strong pressures in their area of business for directors to manage health and safety. Figure 30, Table 31 and Table 32 show, for both surveys the percent of participants giving each response. Figure 30 presents both sets of results as average scores for each type of organisation. It can be noted from these tables and figures that:
· On average, organisations agree that there are very strong pressures in their business sectors on Directors and boards to proactively manage health and safety. However, average scores are below 4 (Agree) (though above 3 (Unsure)) in both surveys so this agreement is not strong.
· The perceived pressure on organisations to proactively manage health and safety seems to have fallen slightly – in 2001 almost 70% agreed or strongly agreed that there were very strong pressures compared with 62% in 2003;
· Around 20% disagree that there are very strong pressures, and;
· There are no obvious differences in responses between the four types of organisations, except that more voluntary organisations may disagree.
0
1
2
3
4
5
i
) 2003
Top 350 Large F rms Public Sector Voluntary All
Aver
age
Scor
es: S
tron
gly
disa
gree
(1) t
o st
rong
ly a
gree
(5
2001 Baseline
Figure 30: Extent of agreement that there are very strong pressures to manage health and safety
54
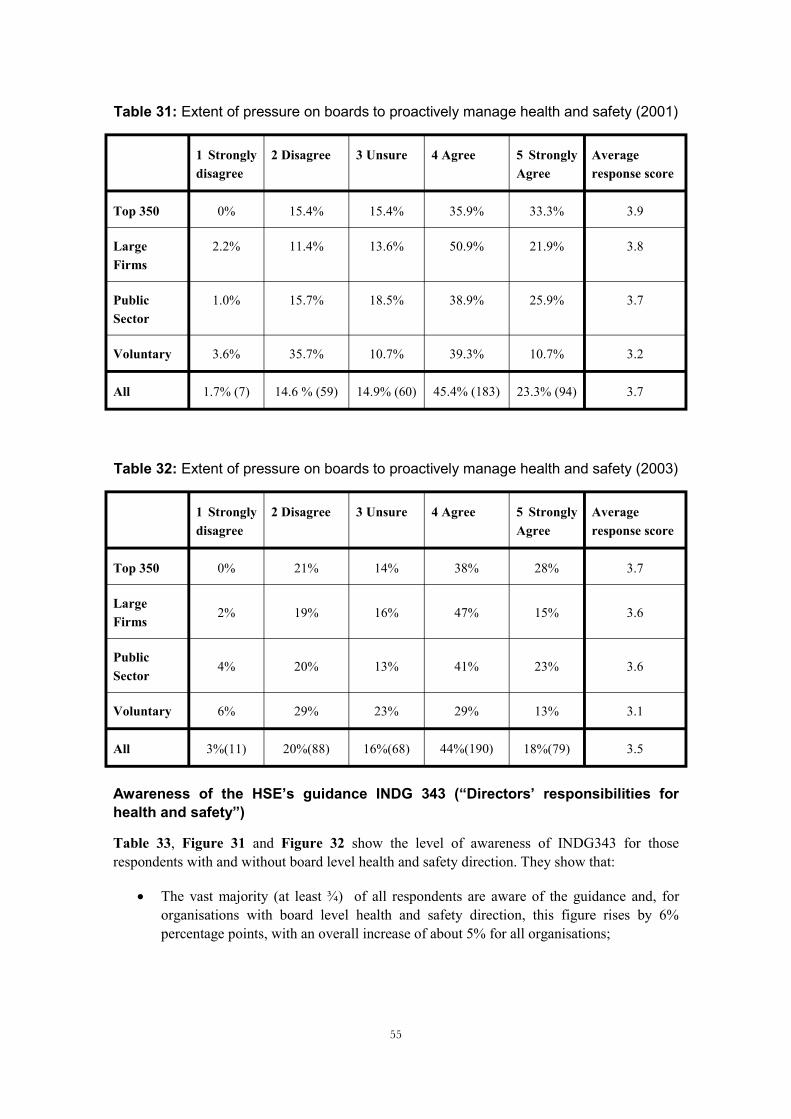
Table 31: Extent of pressure on boards to proactively manage health and safety (2001)
1 Strongly disagree
2 Disagree 3 Unsure 4 Agree 5 Strongly Agree
Average response score
Top 350 0% 15.4% 15.4% 35.9% 33.3% 3.9
Large Firms
2.2% 11.4% 13.6% 50.9% 21.9% 3.8
Public Sector
1.0% 15.7% 18.5% 38.9% 25.9% 3.7
Voluntary 3.6% 35.7% 10.7% 39.3% 10.7% 3.2
All 1.7% (7) 14.6 % (59) 14.9% (60) 45.4% (183) 23.3% (94) 3.7
Table 32: Extent of pressure on boards to proactively manage health and safety (2003)
1 Strongly disagree
2 Disagree 3 Unsure 4 Agree 5 Strongly Agree
Average response score
Top 350 0% 21% 14% 38% 28% 3.7
Large Firms
2% 19% 16% 47% 15% 3.6
Public Sector
4% 20% 13% 41% 23% 3.6
Voluntary 6% 29% 23% 29% 13% 3.1
All 3%(11) 20%(88) 16%(68) 44%(190) 18%(79) 3.5
Awareness of the HSE’s guidance INDG 343 (“Directors’ responsibilities for health and safety”)
Table 33, Figure 31 and Figure 32 show the level of awareness of INDG343 for those respondents with and without board level health and safety direction. They show that:
· The vast majority (at least ¾) of all respondents are aware of the guidance and, for organisations with board level health and safety direction, this figure rises by 6% percentage points, with an overall increase of about 5% for all organisations;
55

· In both surveys, respondents with board level health and safety direction are slightly more likely to have heard of the guidance, this being more marked (over 10% in the 2003 survey).
0% l
i ( ) l ( )
All
No
10%
20%
30%
40%
50%
60%
70%
80%
90%
100%
Board leve H&S respons bility n=303
No board leve H&S responsibility n=95
Yes
Figure 31: Are you aware of INDG 343? (2001)
0%
10%
20%
30%
40%
50%
60%
70%
80%
90%
100%
l l ibili ( )
l libili
All
No
Board eve H&S respons ty n=358
No board eve H&S respons ty (n=80)
Yes
Figure 32: Are you aware of INDG 343? (2003)
56

Table 33: Awareness of INDG 343
2001 baseline 2003 Survey
Board level No board Board level No board H&S level H&S H&S level H&S
responsibility responsibility responsibility responsibility
Yes, have heard of HSC guidance for Directors
76% 73% 82% 70%
No, have not heard of HSC guidance for Directors
21% 24% 16% 27%
Unsure 4% 3% 2% 3%
Total 100% 100% 100% 100%
Benefits of appointing board level health and safety directors
Figure 33, Figure 34, Table 34 and Table 35 show in rank order the reported benefits of assigning responsibility for health and safety to a board level director in both surveys. The question allowed respondents to cite more than one benefit. There is a high level of agreement, in both surveys, that board level direction offers:
· Strong leadership;
· Shows commitment, and;
· Improved health, safety and risk management.
Notable also is that in 2003 a higher proportion of organisations felt that board level direction “ensures directors carry out their health and safety roles” (16% compared to 8% in 2001) and this rose up the rankings slightly. There was possibly a slight reduction in those saying that it gave strong leadership, but this is still ranked first.
In both surveys public sector organisations cite fewer benefits (per organisation) than do Top 350 companies or Large Firms.
Top 350 firms also note benefits of consistency and focus.
57

0%
5%
10%
15%
20%
25%
30%
35%
40%
45%
50%
l ip i i /
w i busi i /
i
i
l
All
Strong eadersh
Show s commitment
Better r sk mngt Improves H&S performance
Cons stency Focus Ensures directors act on
H&S
Pow er support for H&S issues
Getting resources
Other Better liaison th regulators
Reduces ness r sk
No answ erunsure
Top 350
Large F rms
Publ c Sector
Vo untary
Figure 33: Benefits of board level health and safety direction (by percentage of respondents, 2001)
58

0%
5%
l ip I isk ify
i
li
i
l
Vol
All
10%
15%
20%
25%
30%
35%
40%
Strong eadersh
Shows commitment
mproves H&S perf.
Ensures directors act
on H&S
Better rmngt
Other…spec Focus Consistency Power/support for H&S
ssues
Getting resources
Reduces business risk
Better ason with regulators
No answer / unsure
None
Top 350
Large F rms
Pub ic Sector
Figure 34: Benefits of board level health and safety direction (by percentage of respondents, 2003)
59

Table 34: Benefits of having a person responsible for health and safety direction at board level – (percentages of total number of respondents in sector) (2001)
Top 350 Large Firms Public Sector Voluntary All
N=39 N=229 N=108 N=28 N=404
Number % Number % Number % Number % Number %
Strong leadership 16 41% 68 30% 24 22% 13 46% 121 30%
Shows commitment 11 28% 41 18% 15 14% 6 21% 73 18%
Better risk management 5 13% 36 16% 13 12% 7 25% 61 15%
Helps improve H&S performance 8 21% 22 10% 20 19% 4 14% 54 13%
Consistency 9 23% 25 11% 16 15% 0 0% 50 12%
Focus 9 23% 19 8% 11 10% 3 11% 42 10%
Ensures directors carry out their H&S roles 6 15% 21 9% 5 5% 1 4% 33 8%
Power and support for H&S issues 7 18% 18 8% 4 4% 3 11% 32 8%
Getting resources 3 8% 15 7% 2 2% 3 11% 23 6%
Other 1 3% 5 2% 5 5% 0 0% 11 3%
Better management of liaison with regulators 3 8% 6 3% 1 1% 0 0% 10 2%
Reduces risk to the business (of loss, prosecution) 5 13% 2 1% 0 0% 1 4% 8 2%
No answer / unsure 2 5% 3 1% 1 1% 2 7% 8 2%
Clearer Responsibility 1 3% 7 3% 0 0% 0 0% 8 2%
None 2 5% 3 1% 0 0% 0 0% 5 1%
Higher H&S Profile 0 0% 2 1% 2 2% 0 0% 4 1%
Better H&S Communications 0 0% 1 0% 0 0% 0 0% 1 0%
Total 88 294 119 43 544
60

Table 35: Benefits of having a person responsible for health and safety direction at board level – (percentages of total number of respondents in sector) (2003)
Top 350 Large Firms Public Sector Voluntary All
N=29 N=243 N=133 N=31 N=436
Number % Number % Number % Number % Number %
Strong leadership 10 34% 63 26% 28 21% 5 16% 106 24%
Shows commitment 11 38% 41 17% 21 16% 7 23% 80 18%
Helps improve H&S performance 7 24% 34 14% 25 19% 3 10% 69 16%
Ensures Directors carry out their H & S Roles 5 17% 43 18% 17 13% 4 13% 69 16%
Better risk management 3 10% 44 18% 16 12% 3 10% 66 15%
Other 4 14% 27 11% 28 21% 1 3% 60 14%
Focus 6 21% 20 8% 10 8% 1 3% 37 8%
Consistency 5 17% 20 8% 10 8% 0 0% 35 8%
Power and Support for H & S issues 3 10% 18 7% 8 6% 3 10% 32 7%
Getting Resources 1 3% 18 7% 7 5% 1 3% 27 6%
Reduces risk to the business (of loss, prosecution) 1 3% 6 2% 8 6% 0 0% 15 3%
Better management of liaison with regulators 1 3% 7 3% 2 2% 1 3% 11 3%
No answer / unsure 0 0% 10 4% 1 1% 0 0% 11 3%
None 0 0% 4 2% 1 1% 1 3% 6 1%
Total 57 355 182 30 624
61

3.7 BOARD LEVEL HEALTH AND SAFETY ACTIVITIES
3.7.1 Introduction
A series of questions have been asked regarding what health and safety activities boards and the director responsible for health and safety undertake. The results are presented below.
3.7.2 Policy review & publicity
Last time the board reviewed the health and safety policy
It is apparent from Table 36, Table 37 and Figure 35 that:
· There is a slight drop in the proportion of boards in responding organisations who have reviewed their health and safety policy in the past year (83% to 76%) but still over ¾ have done so;
· Almost 90% of Top 350 companies in both surveys have reviewed their policy in the past year, but there has been a drop from 84 to 76% in this figure for Large Firms; and
· About 5% either lack a health and safety policy or have never had a board review.
Table 36: Last time board reviewed the company health and safety policy (2001)
Top 350 Large Firms Public Sector
Voluntary All
n=39 n=228 n=108 n=28 n=403
The last year 36% 29% 31% 10.7% 29%
The last month 18% 31% 21% 39.3% 28%
The last three months 15% 13% 14% 21.4% 14%
The last six months 18% 11% 13% 7.1% 12%
The last three years 8% 6% 8% 7.1% 7%
No answer/unsure 3% 5% 6% 3.6% 5%
Never 3% 4% 5% 3.6% 4%
Over three years ago 0% 1% 2% 3.6% 1%
No policy 0% 1% 1% 3.6% 1%
100% 100% 100% 100% 100%
62
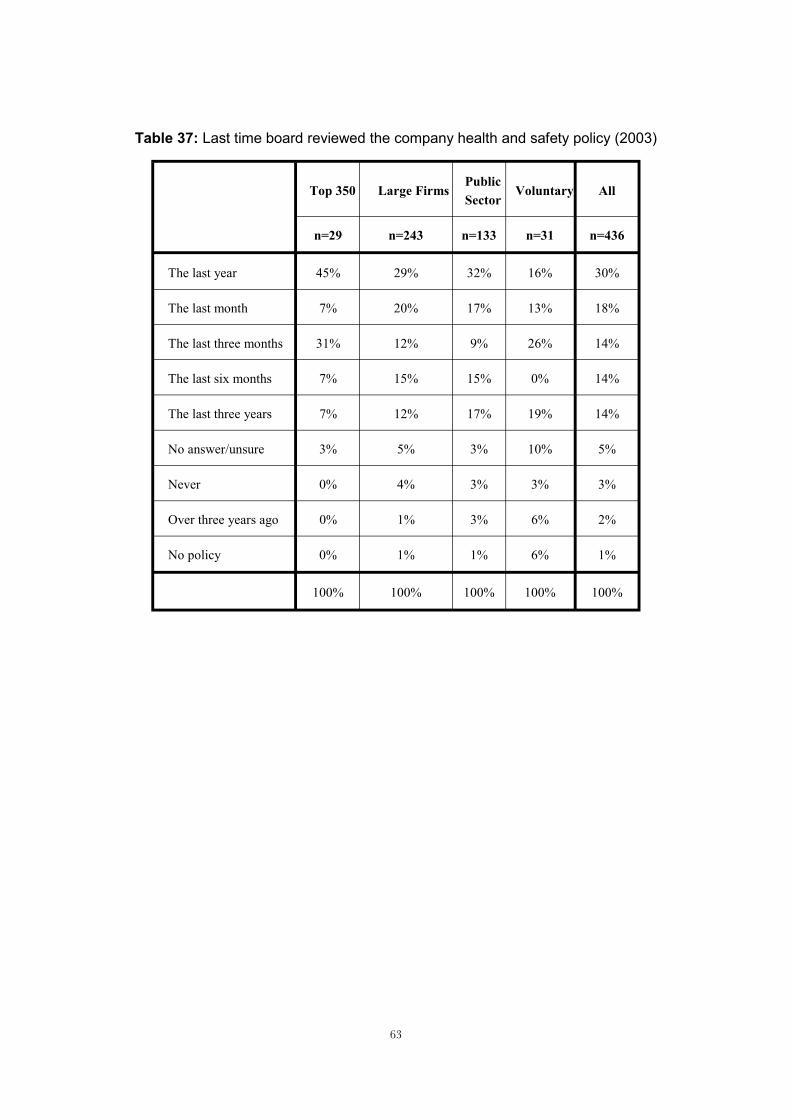
Table 37: Last time board reviewed the company health and safety policy (2003)
Top 350 Large Firms Public Sector
Voluntary All
n=29 n=243 n=133 n=31 n=436
The last year 45% 29% 32% 16% 30%
The last month 7% 20% 17% 13% 18%
The last three months 31% 12% 9% 26% 14%
The last six months 7% 15% 15% 0% 14%
The last three years 7% 12% 17% 19% 14%
No answer/unsure 3% 5% 3% 10% 5%
Never 0% 4% 3% 3% 3%
Over three years ago 0% 1% 3% 6% 2%
No policy 0% 1% 1% 6% 1%
100% 100% 100% 100% 100%
63

0%
10%
20%
30%
l l l /
2003
last year ast month ast 3 months
last 6 months
ast 3 years no answerunsure
never over 3 years ago
no policy
2001 Baseline
Figure 35: Last time board reviewed health and safety policy
0%
5%
10%
15%
20%
25%
30%
35%
i
agenda
ly ly Bi No /
iPubli
All
Every t me, a standing
Month Quarter Annually - Annually When an issue arises answer unsure
Never
Top 350 Large F rms
c sector Voluntary
Figure 36: Frequency health and safety is discussed at board level (2001)
64

0%
10%
20%
30%
ly ly ly iari
/
Vol
All
Every time Monthly Quarter Annual Bi-annual When an ssue ses
No answer unsure never
Top 350
Large Firms
Public Sector
Figure 37: Frequency health and safety is discussed at board level (2003)
Frequency with which health and safety is discussed at board meetings
Figure 36 and Figure 37 shows the frequency that the board discuss health and safety in both surveys. It appears that:
· Both surveys show that health and safety is formally discussed at least annually by just over 70% of boards;
· About half of respondents’ boards discussed health and safety either monthly or had itas a standing agenda item in 2001. This figure dropped to 40% in 2003;
· Around 15% (18% in 2001, 14% in 2003) of boards only discuss health and safety when an issue arises.
Board health and safety objectives
Figure 38 and Figure 39 report what type of health and safety objectives boards set themselves. It appears that:
· In both surveys the most common objective is to “improve health and safety”, followed by “comply with the law” and “reduce injury rates”; and
· There is a general increase in the numbers of objectives set e.g. 60% compared to 46% in 2001 having an objective to improve health and safety, 47% compared to 27% having an objective to reduce injury rates and 16% up from 8% with objectives to reduce illhealth.
65

Figure 40 and Figure 41 show the percentage of organisations that have published their objectives. It is apparent, from both surveys, that:
· About two thirds of all respondents have published their objectives;
· The Top 350 are the most likely to publish their objectives.
0% inj ill l ifi
i i
l i il
iifi
i
l
All
10%
20%
30%
40%
50%
60%
70%
Reduce ury rates
Fewerhealth cases
Comp y with the law
Improve health and safety
Spec c H & S programmes or in tiat ves
Less ost t me Be ndustry eader
Ach eve spec c audit
scores
Other
Top 350
Large f rms
Govt
Vo untary
Figure 38: Board health and safety objectives (2001)
0%
All
10%
20%
30%
40%
50%
60%
70%
Reduce injury rates
Fewer ill health cases
Comply with the law
Improve health and safety
Specific H & S programmes or initiatives
Less lost time Be industry leader
Achieve specific audit
scores
Other
Top 350
Large Firms
Public Sector
Vol
Figure 39: Board health and safety objectives (2003)
66

0% fi li l All
No
10%
20%
30%
40%
50%
60%
70%
80%
90%
Top 350 Large rms Pub c sector Vo untary
Yes
Unsure
Figure 40: Board public (external/internal) statement of objectives (2001)
0%
10%
20%
30%
40%
50%
60%
70%
80%
90%
i Vol
No
Top 350 Large F rms Public Sector All
Yes
Unsure
Figure 41: Board public (external/internal) statement of objectives (2003)
67

3.7.3 Audit and performance reports
Discussion of serious accidents and ill health
Figure 42 and Figure 43 show that, in both surveys, around 50% of respondents discuss all serious cases with little difference between the four types of organisations.
0%
10%
20%
30%
40%
50%
60%
70%
All No / any
i
All
Most Some None answer unsure
Have not had
Top 350
Large F rms
Public sector
Voluntary
Figure 42: Proportion of serious accident, injuries and ill-health discussed at board meetings (2001)
0%
10%
20%
30%
40%
50%
60%
70%
All
i
Vol
All
Most Some None No answer/unsure Have not had any
Top 350
Large Firms
Publ c Sector
Figure 43: Proportion of serious accident, injuries and ill-health discussed at board meetings (2003)
68
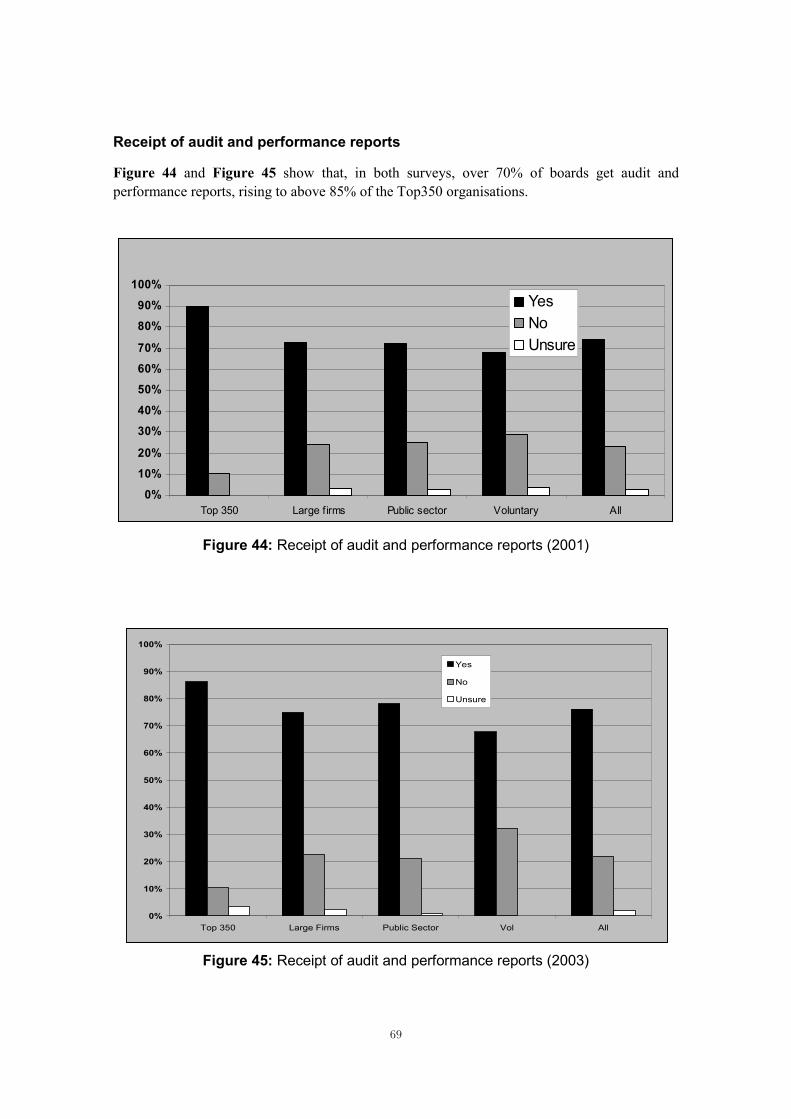
Receipt of audit and performance reports
Figure 44 and Figure 45 show that, in both surveys, over 70% of boards get audit and performance reports, rising to above 85% of the Top350 organisations.
0% i li l All
No
10% 20%
30% 40% 50% 60% 70%
80% 90%
100%
Top 350 Large f rms Pub c sector Vo untary
Yes
Unsure
Figure 44: Receipt of audit and performance reports (2001)
0%
10%
20%
30%
40%
50%
60%
70%
80%
90%
i l
No
Unsure
100%
Top 350 Large F rms Public Sector Vo All
Yes
Figure 45: Receipt of audit and performance reports (2003)
69

Health and safety performance measures
Figure 46 and Figure 47 show that organisations all receive a wide range of performance measures, the most common being injury rates. In 2003 100% of Top 350 respondents say that their boards receive injury rate reports.
There is little variation in the years, but it is interesting to note that:
· There is a reduction (66% to 60% and 67 to 57% respectively) of boards receiving reports on audit scores and lost time statistics; but
· There is an increase (from 70 to 80% and 65 to 80%) of boards receiving more qualitative information of audit / review conclusions and accident investigation reports.
Actions taken in response to performance reports
Figure 48 and Figure 49 show the range of responses when asked what action is taken as a result of receiving performance reports in both surveys.
· Overall almost 1 in 5 do nothing in response, with public sector and voluntary organisations even less likely to take action.
· The most common responses are to compare measures to targets, set new objectives and review health and safety management.
· Measures to increase worker participation were more common in 2003 (11% compared to 4% in the baseline survey).
70

0%
10%
20%
30%
40%
50%
60%
70%
80%
90%
/ inj / inj/
l-i / f i
f/
i i f i if
I( )
i il i
ii i
l
All
100%
Emp'ee acc ury rates/nos.
Cont ract or acc ury rates nos.
No. of cases of ilhealt h
No. of prosecut ons nes
No.o near miss dangerous
occurences
Aud t scores Lost t me En orcement not ces Trends n H&S per ormance
ndust ry benchmarks eg: ISO
Aud t/ rev ew conc us ons
Acc dent nvest igat on reports
Top 350
Large firms Public sector Vo untary
Figure 46: Health and safety performance measures (as a percentage of those organisations receiving performance reports) (2001)
71

0%
10%
20%
30%
40%
50%
60%
70%
80%
90%
/inj/nos /inj
/nos i /finesmi
i i iew l ions
ii
iVol
All
100%
Emp'ee acc ury rates
Contractor acc ury rates
No. of cases of illhealth
No of prosecut ons
No.of near ss/dangerous occurences
Audit scores Lost t me Enforcement notices
Trends n H & S performance
measures
Industry benchmarks e.g. ISO standards
Audit / revconc us
Acc dent invest gation
reports
Top 350 Large F rms Public Sector
Figure 47: Health and safety performance measures (as a percentage of those organisations receiving performance reports) (2003)
72

0%
5%
i li i
i
isi fi
ific
/ i
ialii
i(i
)
i iew
i
Vol
All
10%
15%
20%
25%
30%
35%
40%
No th ng Co mpare to co . targets
Set new o bjectives
Who e co mpany H&S mgt rev ew.
Departmental H&S mgt rev ew
Rev ew bo ard's appro ach to
H&S dec o ns
Increased budget o r
nances allo cated to
H&S o r specdepartments
Recruit appo nt mo re H&S spec sts
M easures to ncrease wo rker
partic patio n
Set up H&S award scheme
P ublish perfo rmance
measures nternally and externally
Other Tra ning Rev
Top 350
Large f rms
Public sector
untary
Figure 48: Actions taken in response to performance reports (as a percentage of those organisations receiving performance reports) (2001)
73

0%
10%
20%
30%
40%
50%
60%
70%
iives
l
i i
Review
fiall
ic
i
i
Publish
(ily)
Vol All
Noth ng Compare to Co. targets
Set new object
Who e Co. H&S mgt
rev ew
Departmental H&S mgt
rev ew board's
approach to H&S decisions
Increased budget or
nances ocated to H&S or specif
departments
Recruit/appoint more H&S specialists
measures to ncrease worker
participat on
Set up an H&S award scheme performance
measures nternally and external
Other – specify
Top 350 Large Firms Public Sector
Figure 49: Actions taken in response to performance reports (as a percentage of those organisations receiving performance reports) (2003)74

3.7.4 Workforce consultation
Figure 50 and Figure 51 shows that the public sector and the voluntary sector have the highest levels of consultation. Between the surveys there is a small increase in the percentage saying they do “a lot” to engage the workforce (46% to 51%) but the same reduction in those saying they do “some” and no difference in those that do nothing or very little. The most significant increase is associated with the Top 350 companies.
Figure 52 and Figure 52 show that where a board makes a specific appointment of a health and safety director, they report that they make slightly greater efforts to acquire the opinions of the workforce than do those boards where no responsibility for health and safety is specifically allocated.
Other than the Top 350, the usual method of consulting is health and safety committees as shown in Figure 54 and Figure 55. The Top 350 prefer to ensure that workers have time to participate. In the 2001 survey, respondents in the voluntary sector also say they encourage the appointment of Trade Union and Employee representatives, whereas in 2003 there was more emphasis on task forces and working groups in this sector. However taken overall, there is little significant difference between the two surveys in the methods of engaging the workforce.
Figure 56 and Figure 57 shows how respondents’ organisations go about acquiring workforce input. Those with a specific appointment at board level are more likely to seek out the opinions of individual workers and to encourage the appointment of Trade Union Safety Representatives. There is a marked increase amongst those with no board level responsibility in promoting the health and safety committee, but with no corresponding increase (if anything there is a small decrease) in efforts to encourage TU safety or employee representatives.
75

0% i All
le
10%
20%
30%
40%
50%
60%
Top 350 Large f rms Public sector Voluntary
Not at all
A litt
Some
A lot
Figure 50: Extent of workforce consultation (as percentage of respondents) (2001)
0% l
l le
10%
20%
30%
40%
50%
60%
70%
Top 350 Large Firms Public Sector Vo All
Not at alA littSome A lot
Figure 51: Extent of workforce consultation (as percentage of respondents) (2003)
76

0%
10%
20%
30%
40%
50%
60%
70%
80%
90%
i ifi i
le
l
100%
No board level respons bility Spec c appointment as h&s d rector
Not at all
A litt
Some/A ot
Figure 52: To what extent has your board sought the opinions of the workforce in developing and implementing you health and safety policy? (2001)
0%
10%
20%
30%
40%
50%
60%
70%
80%
90%
100%
i l
A li
Specific appointment as H&S D rector No board leve responsibility
Not at all
ttle
Some/A lot
Figure 53: To what extent has your board sought the opinions of the workforce in developing and implementing you health and safety policy? (2003)
77

0%
5%
l
All ing i i i
ing
ivi
li
/ i
il ipt i i
il
/
i
l
All
10%
15%
20%
25%
30%
Encourage appt of TU safety reps
Encourage appt of
emp oyee reps
ow t ime for worker
part icipation
M ngr t rainn consultat on
Partnership in prevent on with TUs
Consult workers
ind dually
Employee ed h&s init iat ves
Promot e h&s commit t ee
Task f orcework ng gp
B ehav oural safety
programmes
Contract of emp oyment
changes
H&S in job descr ons
Regular safety meet ngs
Through l ne mangement
Give more regu ar
informat ion
Other No answer unsure
Top 350
Large f rms
Public sector
Vo untary
Figure 54: Method of acquiring workforce opinion (2001)
78

0%
5%
ii ion i
ing
i i
/ ing gp i i
/ i
10%
15%
20%
25%
30%
Encourage the appt of TU safety reps
Encourage the appt of
employee reps
Allow time for workers to partic pate
mngr training n consultat
Partnership in prevent on with TU's
Consultworkers
ndiv dually
Employee led H&S initiatives
Promote H&S committee
Task force work
Behavioural safety
programmes
Contract of employment
changes
H&S in job descr pt ons
No answerunsure
Other…spec fy
Top 350
Large Firms
Public Sector
Vol
All
Figure 55: Method of acquiring workforce opinion (2003)79

0%
5%
ini in ion
ip wi
ing
ii
il li
10%
15%
20%
25%
30%
35%
Encourage appt of TU safety reps
Encourage appt of
employee reps
Manager tra ng
consultat
Foster partnersh
th TUs
Consultworkers
indiv dually
Promote h&s comm ttee
Specif c appointment as h&s director No board leve responsibi ty
Figure 56 Does board level direction affect how workforce opinion is acquired? (2001)
0% f
l i lip
i idually
ifi ii
10%
20%
30%
40%
50%
60%
Encourage app of TU Safety Reps
Encourage appt oemp oyee Reps
Manager Training n Consu tation
Foster partnershwith TU's
Consulting workers
ndiv
Promote H&S committee
Spec c appointment as H&S D rector No board level respons bility
Figure 57 Does board level direction affect how workforce opinion is acquired? (2003)
80

3.7.5 Health and safety tasks
Respondents were asked to rate on a scale of 1 to 3 (where “1” is not at all and “3” is a lot) the extent to which the board and then the board level person responsible for health and safety carry out various tasks noted in INDG 343. The results are presented as a percentage of respondents who gave each response and then as an average score.
Extent to which boards perform health and safety tasks
Figure 58 and Figure 59 show the range of responses for the various tasks for all respondents. Figure 62 and Figure 63 provide a breakdown by sector. In both surveys the most common include resource allocation, policy, problem resolution and engaging the board in health and safety. The least rated is liaison with the regulator.
Extent to which the director responsible for health and safety performs health and safety tasks
Figure 60 and Figure 61 show the extent to which the director responsible for health and safety performs tasks. Figure 64 and Figure 65 present the results for directors as an average score on a scale of 1 to 3. The most common task is to ensure the board considers health and safety matters; there is relatively little difference in the rating given to different tasks and little variation between sectors.
If Figure 58 and Figure 59 are compared with Figure 60 and Figure 61 it is clear that there is a higher level of activity amongst directors with responsibility for health and safety than for the board itself. The extent to which the board (collectively) does SHE tasks is less than the extent to which a SHE director does them.
81

0%
10%
20%
30%
40%
50%
60%
ldecisi
i i
l ii
l
il
isi all
Help board formu ate H&S
policy
Help set H&S targets
Check that board
ons reflect H&S ntent ons
Report H&S performance to the board
He p board understand how H&S is
manged in an org.
Ensur ng board cons ders H&S
prob ems & takes actions
Liaise wth regu ators
Engage the board in key
H&S dec ons
Advise the board on H&S
matters
Ensure the board ocates
sufficient resources to
H&S
Not at all
Somewhat
A lot
d/k
Figure 58: Extent to which board performs health and safety tasks – all responses (2001)
82
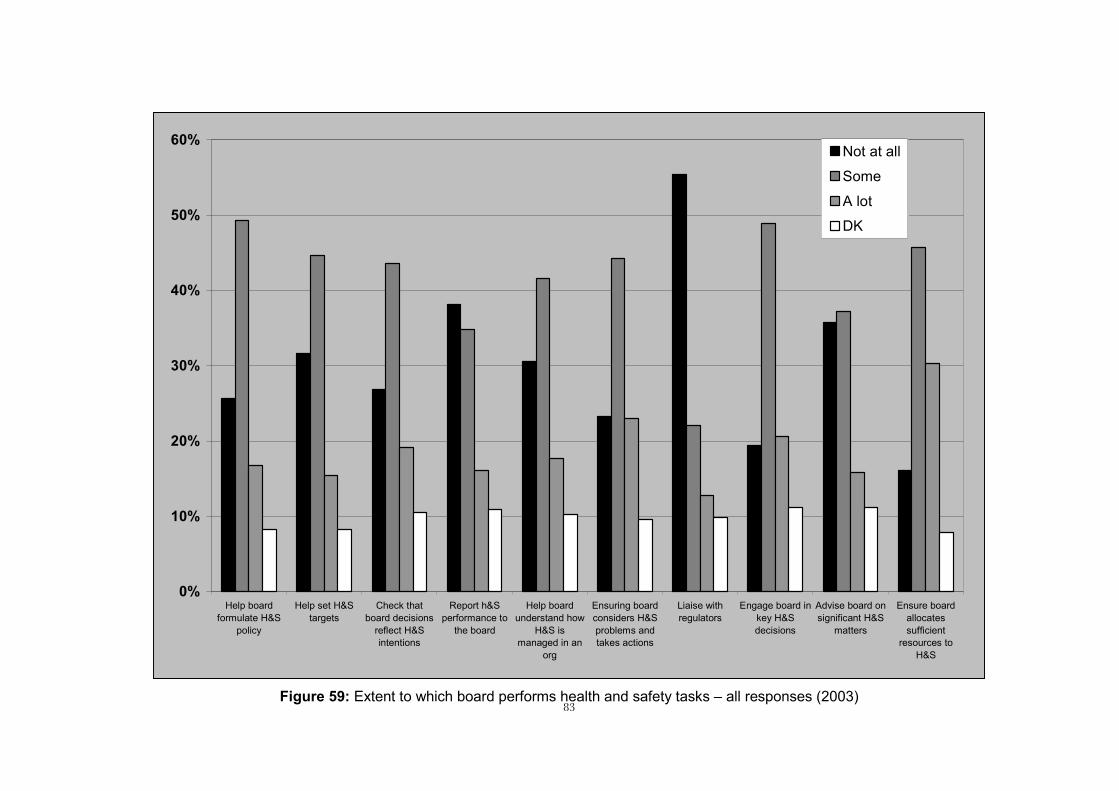
0% Hel
poliisi
i ions
Hel ii
ions
Li ith Advisi all
l
DK
10%
20%
30%
40%
50%
60%
p board formulate H&S
cy
Help set H&S targets
Check that board dec ons
reflect H&S ntent
Report h&S performance to
the board
p board understand how
H&S is managed in an
org
Ensur ng board cons ders H&S problems and takes act
aise wregulators
Engage board in key H&S decisions
se board on gnificant H&S
matters
Ensure board ocates
sufficient resources to
H&S
Not at al
Some
A lot
Figure 59: Extent to which board performs health and safety tasks – all responses (2003)83
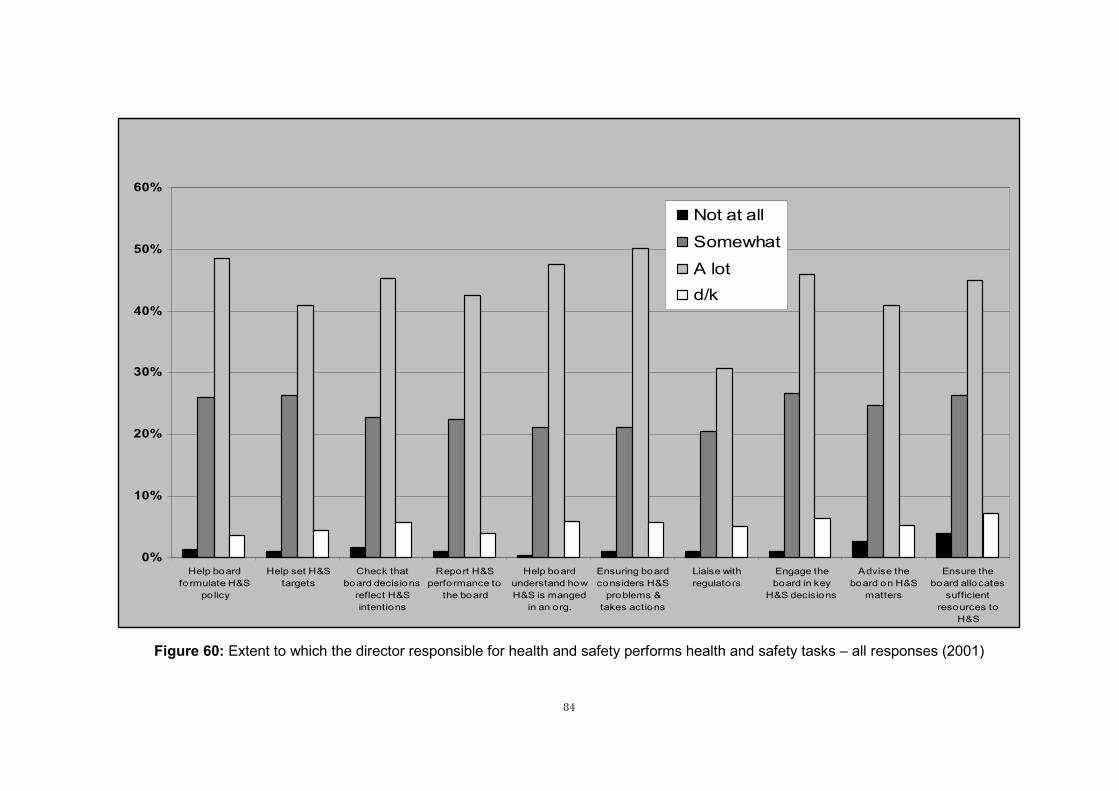
0%
10%
20%
30%
40%
50%
60%
po liisi
i
i i
l
Help bo ard fo rmulate H&S
cy
Help set H&S targets
Check that bo ard dec o ns
reflect H&S intent o ns
Repo rt H&S perfo rmance to
the bo ard
Help bo ard understand ho w H&S is manged
in an org.
Ensuring bo ard co nsiders H&S
pro blems & takes actio ns
Lia se w th regulators
Engage the bo ard in key
H&S decisio ns
Advise the bo ard o n H&S
matters
Ensure the bo ard allo cates
sufficient reso urces to
H&S
Not at alSomewhat A lot d/k
Figure 60: Extent to which the director responsible for health and safety performs health and safety tasks – all responses (2001)
84

0% l
l board decisions
i
l ith
decisions
on signifiicient
ll
A lot DK
10%
20%
30%
40%
50%
60%
70%
He p board formu ate
H&S policy
Help set H&S targets
Check that
reflect H&S ntentions
Report h&S performance to the board
He p board understand how H&S is managed in
an org
Ensuring board
considers H&S
problems and takes
actions
Liaise wregulators
Engage board in key
H&S
Advise board cant
H&S matters
Ensure board allocates suff
resources to H&S
Not at aSome
Figure 61: Extent to which the director responsible for health and safety performs health and safety tasks – all responses (2003)85

0
1
2
3
Hel Helisi
Hel
ii
ii
i
Liai i
i
i
i
All
0.2
0.4
0.6
0.8
1.2
1.4
1.6
1.8
2.2
2.4
2.6
2.8
p board fo rmulate H&S
po licy
p set H&S targets
Check that bo ard dec o ns
reflect H&S intentio ns
Report H&S perfo rmance to
the bo ard
p board understand ho w H&S s manged
n an o rg.
Ensur ng bo ard co ns ders H&S
pro blems & takes act ons
se w th regulato rs
Engage the bo ard in key
H&S decis o ns
Adv se the bo ard o n H&S
matters
Ensure the bo ard allo cates
sufficient reso urces to
H&S
Top 350 Large F rms Public sector Voluntary
Figure 62: Extent to which board performs health and safety tasks, by sector (average response on scale of 1 to 3) (2001)
86

l
deci
intentions
l
is
Liaise with l on signifi
i
H&S
Vol All
0.0
0.2
0.4
0.6
0.8
1.0
1.2
1.4
1.6
1.8
2.0
2.2
2.4
2.6
2.8
3.0
He p board formulate
H&S policy
Help set H&S targets
Check that board
sions reflect H&S
Report h&S performance to the board
He p board understand how H&Smanaged in
an org
Ensuring board
considers H&S
problems and takes
actions
regu ators Engage
board in key H&S
decisions
Advise board cant
H&S matters
Ensure board
allocates suffic ent
resources to
Top 350 Large Firms Public Sector
Figure 63: Extent to which board performs health and safety tasks, by sector (average response on scale of 1 to 3) (2003)
87

0
1
2
3
Hel
po li
Heldecisi l
i
l
i
ii
li
iisi all i
ili
All
0.2
0.4
0.6
0.8
1.2
1.4
1.6
1.8
2.2
2.4
2.6
2.8
p bo ard fo rmulate H&S
cy
p set H&S targets
Check that bo ard o ns ref ect
H&S intent o ns
Repo rt H&S perfo rmance to the
bo ard
He p bo ard understand ho w
H&S s manged in an o rg.
Ensur ng bo ard co ns ders H&S
pro b ems & takes act o ns
Liaise w th regulato rs
Engage the bo ard in key H&S dec o ns
Advise the bo ard on H&S matters
Ensure the bo ard o cates suff cient
reso urces to H&S
Top 350 Large F rms Pub c sector Voluntary
Figure 64: Extent to which director responsible for health and safety performs health and safety tasks, by sector (average response 2001)
88

Hell
policy i is
i
il
i
iifi all
H&S
Vol All
0.0
0.2
0.4
0.6
0.8
1.0
1.2
1.4
1.6
1.8
2.0
2.2
2.4
2.6
2.8
3.0
p board formu ate H&S
Help set H&S targets
Check that board
decis ons reflect H&S intentions
Report h&S performance to the board
Help board understand how H&S managed in
an org
Ensur ng board
cons ders H&S prob ems
and takes act ons
Liaise w th regulators
Engage board in key H&S decisions
Advise board on sign cant H&S matters
Ensure board ocates
sufficient resources to
Top 350 Large Firms Public Sector
Figure 65: Extent to which director responsible for health and safety performs health and safety tasks, by sector (average response, 2003)
89

3.7.6 Checking of board’s health and safety work
Figure 66, and Figure 67, (and Table 38 and Table 39) show what arrangements are in place to check how directors are discharging their health and safety responsibilities. Respondents could cite more than one method of checking. Indeed, there is an average of two responses per organisation. The percentages are calculated as a percentage of the number of each type of organisation.
· In both surveys around 15% had done nothing specific to check the board’s discharge of health and safety responsibilities and around 3% of all respondents failed to cite a method of checking.
· In both surveys around a third of boards review their own performance with a similar figure for internal audit of the board’s workings. However in 2003 the figure increased to a half of all Top 350 companies doing internal audit.
· About one quarter had external audits of the board’s health and safety work in 2001 with this figure showing a possible slight fall to a fifth in 2003.
0% i
perf
I li i ions
i
i i
i
Publi
l
All
10%
20%
30%
40%
50%
We rev ew our ow n
ormance
nternal audit of the
Board’s w ork
Externa audit of the
Board’s w ork
Board mon tors safety
performance
HSE nspect
Noth ng specif ic
Other No answ er
Perc
enta
ge o
f org
anis
aton
sn
sect
or
Top 350
Large f rms
c sector
Vo untary
Figure 66: Arrangements for checking how boards discharge health and safety responsibilities (2001)
90

0%
10%
20%
30%
40%
50%
60%
i iific
Board ions
irms
All
Internal Audit of Boards
work
We rev ew our own
performance
External Audit of
Boards work
Noth ng spec monitors
safety performance
Other HSE Inspect
No answer
Top 350 Large FPublic Sector Voluntary
Figure 67: Arrangements for checking how boards discharge health and safety responsibilities (2003)
91
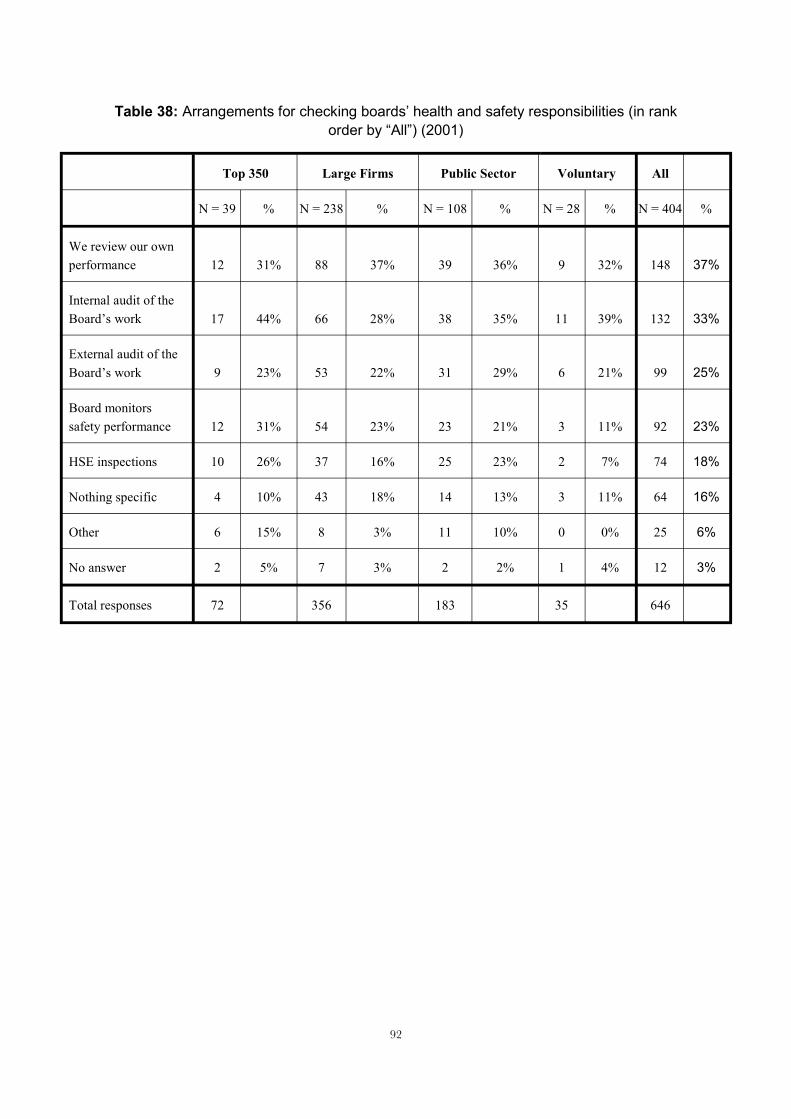
Table 38: Arrangements for checking boards’ health and safety responsibilities (in rank order by “All”) (2001)
Top 350 Large Firms Public Sector Voluntary All
N = 39 % N = 238 % N = 108 % N = 28 % N = 404 %
We review our own performance 12 31% 88 37% 39 36% 9 32% 148 37%
Internal audit of the Board’s work 17 44% 66 28% 38 35% 11 39% 132 33%
External audit of the Board’s work 9 23% 53 22% 31 29% 6 21% 99 25%
Board monitors safety performance 12 31% 54 23% 23 21% 3 11% 92 23%
HSE inspections 10 26% 37 16% 25 23% 2 7% 74 18%
Nothing specific 4 10% 43 18% 14 13% 3 11% 64 16%
Other 6 15% 8 3% 11 10% 0 0% 25 6%
No answer 2 5% 7 3% 2 2% 1 4% 12 3%
Total responses 72 356 183 35 646
92

Table 39: Arrangements for checking boards’ health and safety responsibilities (in rank order by “All”) (2003)
Top 350 Large Firms Public Sector Voluntary All
N = 29 % N = 243 % N = 133 % N = 31 % N = 436 %
Internal audit of the Board’s work 15 52% 82 34% 46 35% 10 32% 153 35%
We review our own performance 11 38% 81 33% 46 35% 12 39% 150 34%
External Audit of the board’s work 7 24% 45 19% 30 23% 6 19% 88 20%
Nothing Specific 0 0% 36 15% 21 16% 12 39% 69 16%
Board Monitors safety performance 5 17% 33 14% 22 17% 3 10% 63 14%
Other 3 10% 26 11% 28 21% 1 3% 58 13%
HSE Inspections 5 17% 27 11% 20 15% 2 6% 54 12%
No answer 0 0% 11 5% 4 3% 0 0% 15 3%
Total responses 46 341 217 46 650
93

3.8 PLANS FOR FURTHER REVIEW
The survey found that:
· About half of respondents report that their organisation plans to review the level of board direction of health and safety; and
· About 40% plan to increase the role of Directors in safety leadership.
It is also important to note that those organisations that do not have a director responsible for health and safety are less likely to plan to review arrangements.
Plans to review role of directors
Looking at Figure 68 to Figure 71 and Table 40 to Table 45, it can be noted that:
· Organisations with a director of health and safety are more likely to have plans to review board level arrangements; and
· Respondents that are aware of the HSC guide INDG343 are twice as likely to report that they plan to review board level arrangements and twice as likely to have plans to increase the role of directors in health and safety;
· The picture changes little between 2001 and 2003, though there seems to be a slight decrease in the number of organisations planning a review.
Table 40: Plans to review arrangements and awareness of IND 343 – all sectors (2001)
Top 350 Large Firms Public Sector Voluntary All
No. % No. % No. % No. % %
Plans to increase the role of directors in safety leadership
17 44% 90 39% 42 39% 15 54% 164 41%
Have heard of the HSC guide for Directors
31 79% 179 79% 67 62% 23 82% 300 74%
Have plans to further review, within 1 year board arrangements
20 51% 115 50% 52 48% 19 68% 206 51%
94

Table 41: Plans to review arrangements and awareness of IND 343 – all sectors (2003)
Top 350 Large Firms Public Sector Voluntary All
No. % No. % No. % No. % %
Plans to increase the role of directors in safety leadership
13 45% 77 32% 55 41% 10 32% 156 35%
Have heard of the HSC guide for Directors
27 93% 187 77% 114 86% 24 77% 358 80%
Have plans to further review, within 1 year board arrangements
13 45% 114 47% 68 51% 12 39% 211 47%
Table 42: Plans to review arrangements and awareness of IND 343 – public sector (2001)
Education Local authorities
Emergency services NHS
No. % No. % No. % No. %
Plans to increase the role of directors in safety leadership
18 30% 11 50% 5 31% 8 36%
Have heard of the HSC guide for Directors
26 54% 20 91% 8 50% 13 59%
Have plans to further review, within 1 year board arrangements
23 48% 9 41% 11 69% 9 41%
95

Table 43: Plans to review arrangements and awareness of IND 343 – public sector (2003)
2003 Education Local authorities
Emergency services NHS
No. % No. % No. % No. %
Plans to increase the role of directors in safety leadership
16 32% 15 47% 15 63% 9 33%
Have heard of the HSC guide for Directors
39 78% 31 97% 20 83% 24 89%
Have plans to further review, within 1 year board arrangements
28 56% 26 81% 21 88% 22 81%
Table 44: Plans to review board level health and safety arrangements in organisations with and without health and safety Directors. (2001)
Director of H&S specifically appointed
No specific appt of director of H&S
All
Yes, plans to review arrangements
62% 48% 56%
Possible review of arrangements
16% 22% 19%
No plans to review 15% 26% 20%
Unsure 7% 4% 6%
100% 100% 100%
96
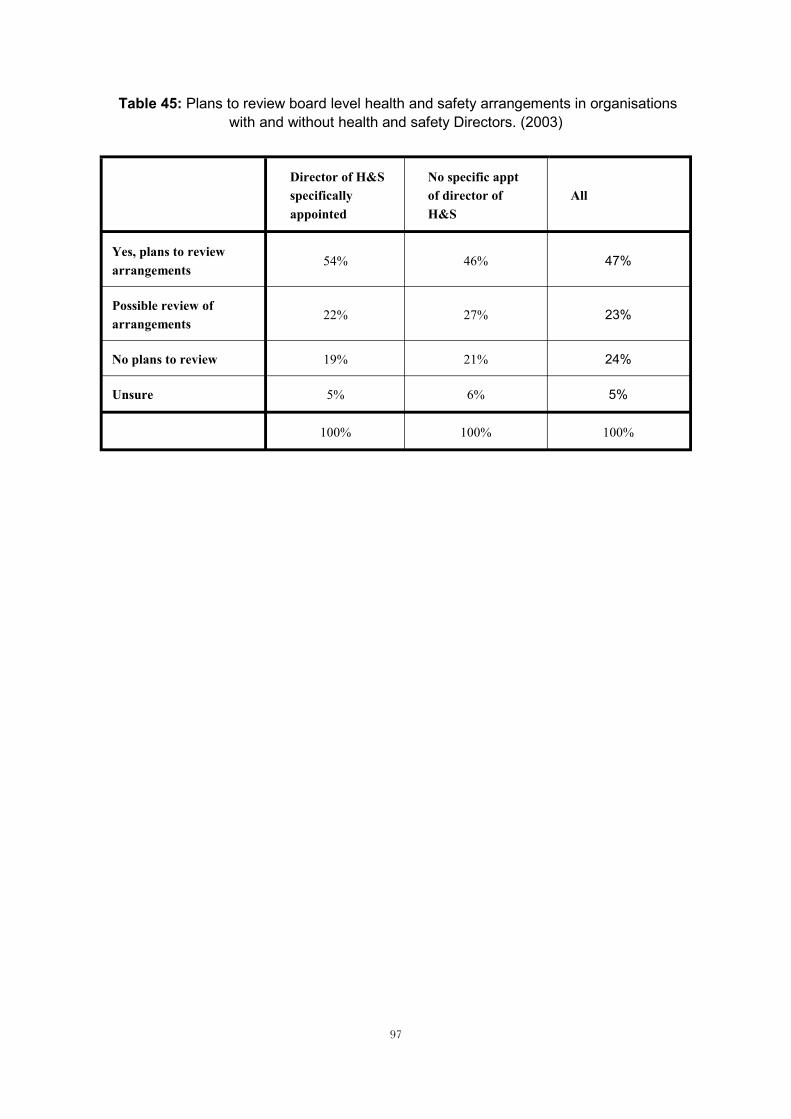
Table 45: Plans to review board level health and safety arrangements in organisations with and without health and safety Directors. (2003)
Director of H&S specifically appointed
No specific appt of director of H&S
All
Yes, plans to review arrangements
54% 46% 47%
Possible review of arrangements
22% 27% 23%
No plans to review 19% 21% 24%
Unsure 5% 6% 5%
100% 100% 100%
97

0% )
)
iibl il i
if pl i
10%
20%
30%
40%
50%
60%
70%
Aware of INDG 343 (n=300) Not aware of INDG 343 (n=87 Unsure if aware of INDG 343 (n=16
Perc
enta
ge o
f aw
are/
unaw
are
Yes, plans to rev ew arrangements Poss e rev ew of arrangements No p ans to rev ew Unsure ans to rev ew
Figure 68: Does awareness of the HSC guidance for directors affect plans for review of board level arrangement (for all)? (2001)
0%
10%
20%
30%
40%
50%
60%
70%
) ( i
/
iew
i i
l iew
iew
Aware of INDG343 (n=358 Not aware of INDG343 n=80) Unsure f aware of INDG343 (n=10)
Perc
enta
ge o
f awa
reun
awar
e
Yes plans to revarrangements Poss ble rev ew of arrangements
No p ans to rev
Unsure if plans to rev
Figure 69: Does awareness of the HSC guidance for directors affect plans for review of board level arrangement (for all)? (2003)
98

0%
i
li
10%
20%
30%
40%
50%
60%
70%
80%
90%
Aware of INDG 343 Not aware of INDG 343
Top 350
Large f rms
Pub c sector
n=31
n=4
n=179
n=42
n=67
n=37
Figure 70: Does awareness of the HSC guidance for directors (INDG 343) affect the sectors differently with respect to plans to review board arrangements (2001)2.
0%
10%
20%
30%
40%
50%
60%
70%
80%
90%
100%
i
Aware of INDG343 Not Aware of INDG343
Top 350 Large F rms Public Sector
N=18 N=137
N=86
N=1
N=29 N=7
Figure 71: Does awareness of the HSC guidance for directors (INDG 343) affect the sectors differently with respect to plans to review board arrangements (2003)3.
(Percentage with plans of those who were or were not aware of INDG 3430 Note: Figure shows combined “yes” and “possibly”
answers to the question of review plans) (2003)
99
2
Plans to increase the role of directors in health and safety
It can be noted from Table 46 to Table 49 and Figure 72 to Figure 73 that:
· About 40% of all organisations plan to increase the role of directors/ boards in health and safety – regardless of whether or not they have already given responsibility for health and safety to a board level director;
· About 40% of those organisations who have already given responsibility for health and safety to a board level director plan to increase the role of directors/ boards in health and safety – regardless of whether or not that person have been specifically appointed as a director of health and safety, and;
· Awareness of INDG343 does appear to influence organisations’ plans.
· The position does not seem to have changed significantly between 2001 and 2003.
(Percentage with plans of those who were or were not aware of INDG 3430 Note: Figure shows combined “yes” and “possibly”
answers to the question of review plans) (2003)
100
3

Table 46: Plans to increase the role of directors in organisations who have and have not given responsibility for health and safety to a board level director (2001)
Plans to increase role of directors / board
No plans to increase role of board/directors
Unsure Total
Board level H&S responsibility assigned to director
41.3% 53.5% 5.3% 100%
No board level H&S responsibility
39.4% 56.4% 4.3% 100%
Unsure 33.3% 33.3% 33.3% 100%
Table 47: Plans to increase the role of directors in organisations who have and have not given responsibility for health and safety to a board level director (2003)
Plans to increase role of directors / board
No plans to increase role of board/directors
Unsure Total
Board level H&S responsibility assigned to director
37% 53% 10% 100%
No board level H&S responsibility
27% 60% 13% 100%
Unsure 27% 27% 45% 100%
101

Table 48: Plans to increase role of directors / boards amongst organisations who have and have not appointed a director of health and safety (2001)
Plans to increase role of directors / board
No plans to increase the role of board/directors
Unsure Total
Board member specifically appointed as a director of H&S
45% 52% 3% 100.0%
Not specifically appointed as a director of H&S
38% 55% 7.1% 100.0%
Unsure (n = 12) 33% 58% 8% 100.0%
Table 49: Plans to increase role of directors / boards amongst organisations who have and have not appointed a director of health and safety (2003)
Plans to increase role of directors / board
No plans to increase the role of board/directors
Unsure Total
Board member specifically appointed as a director of H&S
38% 51% 11% 100.0%
Not specifically appointed as a director of H&S
36% 55% 9% 100.0%
Unsure 21% 64% 14% 100.0%
102
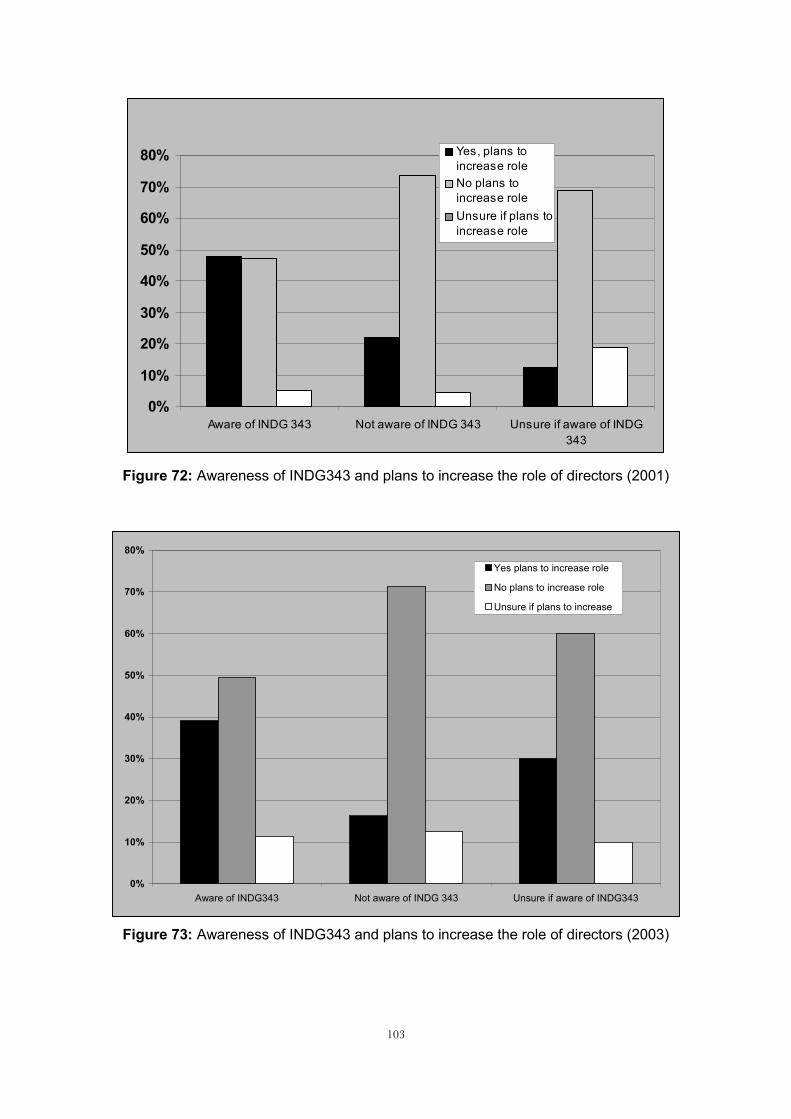
0%
10%
20%
30%
40%
50%
60%
70%
80%
343
le
le i
le
Aware of INDG 343 Not aware of INDG 343 Unsure if aware of INDG
Yes, plans to increase roNo plans to increase roUnsure f plans to increase ro
Figure 72: Awareness of INDG343 and plans to increase the role of directors (2001)
0%
10%
20%
30%
40%
50%
60%
70%
80%
i
i
l
Aware of INDG343 Not aware of INDG 343 Unsure f aware of INDG343
Yes plans to ncrease role
No plans to increase role
Unsure if plans to increase
Figure 73: Awareness of INDG343 and plans to increase the role of directors (2003)
103

4 DISCUSSION
The implications of the survey findings are discussed below against a series of key questions, indicating any changes between 2001 and 2003.
To what extent do organisations already operate in accordance with the HSC guidance?
A large proportion of respondents from both surveys report that many of the arrangements cited in the HSC guidance are already in place. In particular, the majority of organisations have assigned responsibility for health and safety to a board level director and most boards undertake a wide variety of health and safety tasks. However, only a minority of organisations have specifically appointed a director of health and safety (that is, a director whose primary responsibility interest is in health and safety). There is also variation in the extent to which organisations achieve each part of the HSC guidance. Some areas that appear to offer scope for improvement include:
· Regularity of board discussions of health and safety;
· The scope of performance measures and reports received;
· Boards’ response to the reports and performance measures, and;
· The level of consultation with the workforce.
The follow up survey found an increase in 8% in the direction of health and safety at board level. Most of this increase is accounted for by an increase from 60 to 68% for Large Firms. In 2001 about half of these were appointed as “Director” of health and safety rising to almost 60% in 2003. The HSC guide INDG 343 remains an important factor in influencing board arrangements. 75% and 80% of respondents had heard of INDG 343 in the baseline and follow up surveys respectively. Respondents continue to report that board level direction offers many benefits, including strong leadership, demonstrable commitment and better health and safety management.
Does the level of voluntary uptake of corporate responsibility negate the need for further HSC action?
The answer to this question depends in part on the criteria used for evaluating the level of voluntary uptake and the form of board arrangements. On the one hand, the majority of responding organisations have assigned responsibility for health and safety to a board level director. Also, the level of board level direction of health and safety has increased since the baseline survey. However, only half of these are appointed as directors of health and safety. Also, whilst the majority of organisations that lack board level health and safety representation may have plans to review arrangements, less than half have plans to increase the role of directors / boards in health and safety.
104

Thus in 2001 about 6% of organisations did not currently have board level health and safety representation and had no plans to review the role of directors / boards in health and safety in the next year. Similarly, about 12% of organisations did not have board level health and safety representation and had no plans to increase the role of directors / boards in health and safety.
Remembering that the vast majority of respondents are aware of INDG343, this suggests that there is a minority of organisations that may not introduce board level direction of health and safety despite awareness of the HSC guidance. The picture changes little between 2001 and 2003, though there seems to be an increase in the number of organisations planning a review. If the objective is for all large organisations to have board level health and safety direction, this could be interpreted as implying the need for further HSC action.
On the other hand, boards are much more likely to plan change if they are aware of the HSC guidance. Therefore, they may change arrangements in response to further promotion of the guide. However, if the goal is for organisations to appoint a member of the board to be a director of health and safety, then there is much more room for improvement, given that under 40% of responding organisations have appointed an individual to be a health and safety director.
To what extent:
· Has the HSC directors’ guidance prompted organisations to change practices?
· Are there already sufficient factors motivating organisations to increase the level of corporate health and safety responsibility?
The perceived pressure on organisations to proactively manage health and safety seems to have fallen slightly – in 2001 almost 70% agreed or strongly agreed that there were very strong pressures compared with 62% in 2003.
There is a wide range of factors that are prompting boards to direct health and safety, including the HSC guide. Indeed, the HSC guide ranks high within a broad range of factors prompting organisations to have board level health and safety direction. In 2003, it is behind only the general increase in the importance of health and safety, and perceptions of high risk operations. There are also many other highly ranked factors, such as general concern about occupational health performance, concern about corporate responsibility and increased health and safety regulation, that are “somewhat” influencing organisations. Factors such as the Turnbull report and shareholder pressure have a lesser influence. However, organisations agree that there are very strong pressures in their business sectors on Boards and Directors to proactively manage health and safety.
This would suggest organisations, on the whole, believe there are already many factors prompting them to direct health and safety at board level. The most important factors relate to HSC/HSE actions and the general increase in the importance of health and safety, rather than the actions of shareholder or the media.
105

What benefits do organisations perceive that having a health and safety director offers?
There was a high level of agreement in both surveys that board level direction offers:
· Strong leadership;
· Shows commitment, and;
· Helps to improve health, safety and risk management.
The reasons given by organisations with board level direction for their arrangements are generally similar in both surveys, but ‘new legislation/health & safety law increased in prominence in 2003.
However, it is important to note that public sector organisations are less likely to rate benefits of board level direction. Top 350 firms also note benefits of consistency and focus. It does therefore appear that responding organisations, do on the whole agree that board level health and safety direction offers significant benefits and is required for the sake of corporate direction.
How do practices vary between types of organisations, such as between the top 350 and public sector organisations?
On the whole, practices in the Top 350 organisations match the HSC guidance more than other sectors, with the exception of workforce involvement. Public sector respondents continue to report the lowest level of board level direction of health and safety, although they have improved since the baseline survey along with large firms.
Advice on further promotion of HSC INDG343.
Significant progress has been made. No culture change can be achieved using a single tool, and a range of measures and influences must be combined to achieve more widespread allocation of health and safety responsibilities to board level but INDG343 still continues to be influential and will remain an important part of the overall strategy. In general, the conclusions of the 2001 report survey still appear valid i.e. that:
· Any further promotion of INDG 343 should focus on the CEO/MD and other board members in those organisations without board level health and safety representation;
· In the case of the public sector, particularly attention should be awarded to the NHS, and;
· As boards do appear to be influenced by awareness of INDG343, further promotion of the guide would appear to be worthwhile.
106

107

APPENDIX A
TELEPHONE QUESTIONNAIRE, FINAL
VERSION
A1
Health and safety responsibilities of company directors and management board members
Introduction Hello, my name is ________ I work for Greenstreet Berman Ltd. We are an independent research organisation consulting with industry on behalf of the Health and Safety Executive in order to profile how and why directors or their equivalent (in the public & voluntary sectors) are managing health and safety at a corporate level. We would be most grateful if you could help by answering some questions. The results of this consultation will be used to profile different director arrangements for health and safety and the reasoning behind these arrangements. We can assure you of complete anonymity. All responses will be aggregated together. It is anticipated that it will take about 15 minutes. If this is not a convenient moment, when would be a good time to call back?
Time and date to call back:
Contact name Contact job title
Phone number Fax number
Company name Sector(s)
Address
Refusal
Time & date to 1 call back
2
3
A2
1a. Are you a member of the Board? Ring one
Ring one only
Yes 1
No 2
1b. How many boards are there within your company or group?
Write answer & code / do not prompt
Ring one only
One 1
Two or more 2
If respondent answers ‘One’ go to question 2 otherwise continue.
1c. Does your board act as the highest level or does it report to a higher level (corporate) board? Write answer & code / do not prompt
Ring one only
Acts as the highest level 1
Reports to a higher level 2
2. Is health and safety directed at your board’s level or is it entirely delegated, such as to the boards of subsidiary companies or to company divisions / departments?
Write answer & code. Unprompted, only prompt if respondent is struggling.
Ring one only
Directed at this respondent’s board 1
Delegated to individual company boards 2
A3

Delegated to company divisions/ department 3
Do not know / unsure 4
Directed at a higher level board 5
Other… specify 6
3. Why has this arrangement been put in place?
Write in answer & code:
Ring all that apply
Corporate direction is needed 1
Best practice policies 2
Power and financial control at board level 3
New legislation / H&S laws 4
Operations are too diverse to direct at a corporate level 5
Company has a general policy of delegation 6
Corporate body is just a holding company 7
Health & safety is an operational matter 8
H&S is not an issue for directors 9
H&S is a particular business risk 10
Other…specify 11
A4
4. When was the last time your board reviewed the company’s health and safety policy?
Ring one only
Within last month
Within last 3 months
Within last 6 months
Within last year
Within last 3 years
Over 3 years ago
Never No Policy
No answer / unsure
1 2 3 4 5 6 7 8 9
Continue Go to Q6
5. Which board level director(s), by job title, led the last review of the company’s health and safety policy?
Write in and code later / Ring all that apply. Do not prompt unless the respondent is struggling
Entire board 1
Chairman 2
Chief Executive Officer 3
Executive Director 4
Deputy /Vice Chairman 5
Managing director 6
Operations director / officer 7
Human Resource / personnel director 8
Production director 9
Health and safety (and environment) director 10
Risk Management director 11
Corporate & public affairs / communications 12
Security director 13
Finance director / officer 14
Treasury Director 15
Company secretary 16
A5

Legal director 17
Marketing / business development director 18
Investment / major projects 19
Other 20
None 21
No answer / unsure 22
Do not have a policy (at corporate level) 23
6. How frequently is health and safety formally discussed at your board meetings? Ring one only
Every time / a standing agenda
item
Monthly Quarterly Annually Biannual
When an issue
arises / as required
No answer / unsure
Never
1 2 3 4 5 6 7 8
7. What proportion of serious accidents, injuries and occupational ill health are discussed formally at board meetings?
Unprompted unless respondent is struggling then say….. ‘for example stress, back injury, asthma, disabling injury’ Ring one only
All Most Some None No answer / unsure Have not had any
1 2 3 4 5 6
8a. Does the board receive health and safety performance and audit reports? Ring one only
Yes No Unsure
1 2 3
Go to Q8b Go to q9a Go to Q8b
A6

8b. Which of the following specific health & safety performance measures do these include?
Read out and code one response per item
Yes No
Employee accident / injury rates / numbers 1 2
Contractor accident / injury rates / numbers 1 2
Number of cases of serious ill-health 1 2
Number of prosecutions / fines 1 2
Number of near miss / dangerous occurrences 1 2
Audit scores 1 2
Lost time 1 2
Enforcement notices 1 2
Trends in H & S performance measures 1 2
Industry benchmarks e.g. ISO standards 1 2
Audit / review conclusions 1 2
Accident investigation reports 1 2
If no to all options go to question 9a, otherwise continue
A7

8c. What actions or decisions has your board taken in response to receiving these performance measures?
Write in and code afterwards. Do not prompt
Nothing 1
Compare to company targets 2
Set new objectives / targets 3
Order review of H&S management arrangements throughout 4
the whole company.
Order review of H&S management arrangements within 5
specific departments
Review the way the respondent’s board approaches H&S 6
aspects of its major decision making
Increased budget or finances allocated to H&S or specific 7
departments
Recruit or appoint more H&S specialists 8
Take measures to increase worker participation (e.g. 9
encourage safety reps / set up partnership in prevention with trade unions)
Set up an H&S award scheme 10
Publish performance measures (internally and externally) 11
Other – specify 12
A8

9a. Has your board publicly stated in writing (within the company or externally) health and safety objectives such as reducing injury rate, ill health rates and improving health and safety management?
Yes No Unsure
1 2 3
Continue Go to question 10a
9b. What are these targets and objectives?
Write in and code / do not prompt
Reduce injury rates 2
Fewer ill health cases 3
Comply with the law 4
Improve health and safety 5
Specific H & S programmes or initiatives 6
Less lost time 7
Be industry leader 8
Achieve specific audit scores 9
Other 10
10a. To what extent has your board sought the opinions of the workforce in developing and implementing your H & S policy?
Not at all A little Some A lot
1 2 3 4
Go to q 11 Go to q10b
A9

10b. What has your board done to make this happen?
Write in and Tick all that apply / unprompted
Encourage the appointment of trade union safety reps 1
Encourage the appointment of employee safety reps 2
Allow time for workers to participate in health and safety decision making
3
Ensuring managers are trained in consultation on health and safety
4
Fostering partnership in prevention with the trade unions 5
Consulting workers individually 6
Employee led health and safety initiatives 7
Health & safety committee (set or promote) 8
Task force / working group 9
Behavioural safety programmes 10
Contract of employment changes 11
Include H&S in job descriptions
No answer / unsure 12
Other…specify 13
11. Has your board, formally and publicly, either internally or externally, described its own role with regards to health and safety? Ring one
Yes No Unsure
1 2 3
A10

12a. Has a board level director been given responsibility for health and safety? Ring one
Yes No Unsure
1 2 3
continue go to Q14
12 b What is their exact job title? Write in
Job title Code from q5
12 c Has that board member been specifically appointed as a director (or equivalent) of Health and Safety? Ring one.
No
1 2 3
Yes Unsure
12 d Is this person a full member of the board? Ring one.
No
1 2 3
Yes Unsure
12 e Does this person have a health and safety manager reporting to him / her? Ring one.
No
1 2 3
Yes Unsure
A11

14
13. Were there any specific reasons for making a director responsible for H&S? If so, what were these specific reasons? Tick box and write in space below if answer is YES.
No specific reasons Yes there are specific No answer / unsure reasons
1 2 3
Reasons
Go to q 15
ASK THOSE ANSWERING ‘NO’ or ‘UNSURE’ TO Q12a:
Who is the most senior person in the organisation with responsibility for health and safety? Write in
Note job title:
Yes No Unsure
14. b Does this person report have a formal reporting line to the board?
1 2 3 Go to q17
ASK THOSE ANSWERING ‘YES’ AT Q12a:
15. Has your board formally or publicly, either internally or externally, described the role of the person responsible for health & safety at board level? Ring one only
Yes No Unsure
1 2 3
A12
16. Who determined the responsibilities of the health and safety director / person responsible for safety? Ring all that apply.
Tick all that apply
The board 1
The Chief Executive / Managing Director 2
A health & safety manager 3
External consultant 4
HR/personnel director 5
Operations director 6
Don’t Know 7
Other…specify 8
A13
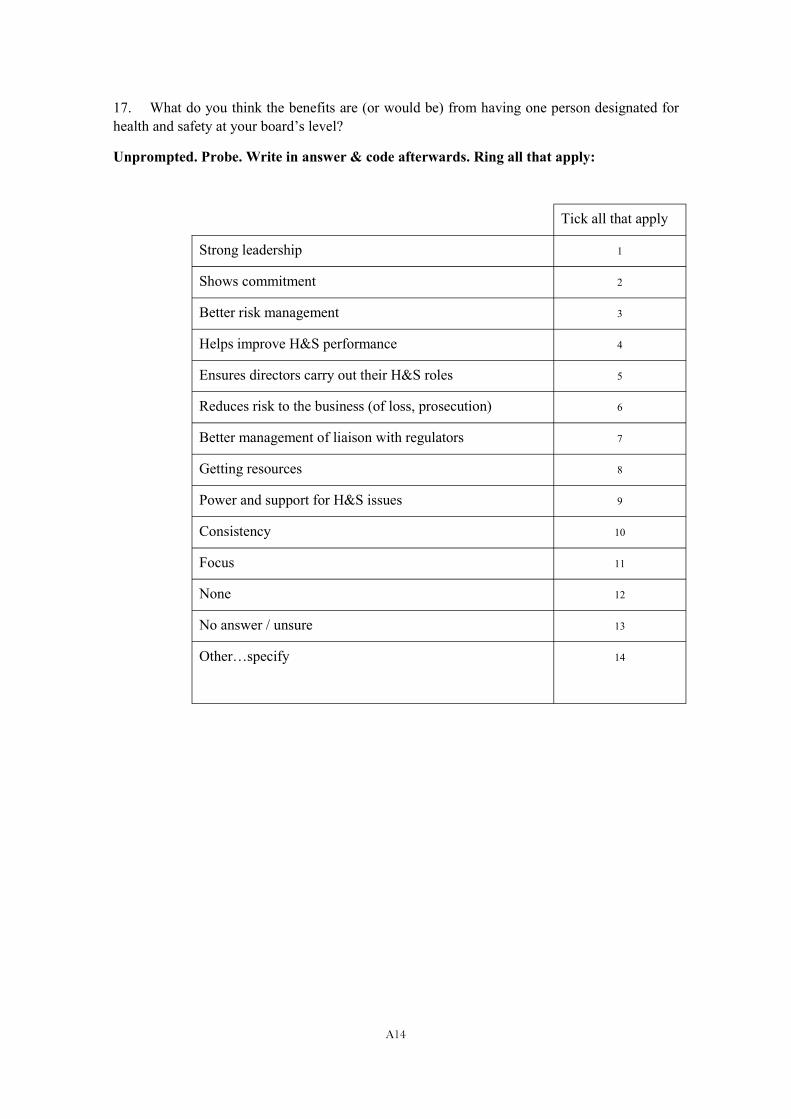
17. What do you think the benefits are (or would be) from having one person designated for health and safety at your board’s level?
Unprompted. Probe. Write in answer & code afterwards. Ring all that apply:
Strong leadership
Shows commitment
Better risk management
Helps improve H&S performance
Ensures directors carry out their H&S roles
Reduces risk to the business (of loss, prosecution)
Better management of liaison with regulators
Getting resources
Power and support for H&S issues
Consistency
Focus
None
No answer / unsure
Other…specify
Tick all that apply
1
2
3
4
5
6
7
8
9
10
11
12
13
14
A14

18. I am going to list a number of tasks and duties. On a scale of 1 to 3, where 1 is ‘not at all’, 2 is ‘some’ and 3 is ‘a lot’, to what extent does firstly, your board, and secondly, the person responsible for health & safety on behalf of the Board, perform each task/ duty? Read out each task, asking first for their response for the Board as a whole, and then for the individual. If the board as a whole does not undertake a particular task, do not ask that task for the person. Ring one number under column ‘Board’ for each duty and one number under column ‘Person’ for each duty:
(a) BOARD (b) PERSON
Not at Some A DK Not at Some A lot DK
all lot all
A Help the board formulate health & safety policy 1 2 3 4 1 2 3 4
B Help set health & safety targets, such as reduction 1 2 3 4 1 2 3 4
in accident rates or introducing new safety arrangements
C Check that board decisions reflect H&S intentions 1 2 3 4 1 2 3 4
D Review & report health & safety performance to 1 2 3 4 1 2 3 4
the board
E Help the board understand how health & safety is 1 2 3 4 1 2 3 4
managed in the organisation
F Ensuring the board considers H&S problems and 1 2 3 4 1 2 3 4
takes remedial actions where necessary
G Liaise with regulators 1 2 3 4 1 2 3 4
H Engage the board in key health & safety decisions 1 2 3 4 1 2 3 4
I Advise the board on significant H&S matters, such 1 2 3 4 1 2 3 4
as acquisition of new businesses, impact of new regulations, response to serious accidents
J Ensure that the board allocates sufficient resources 1 2 3 4 1 2 3 4
to Health and Safety
A15
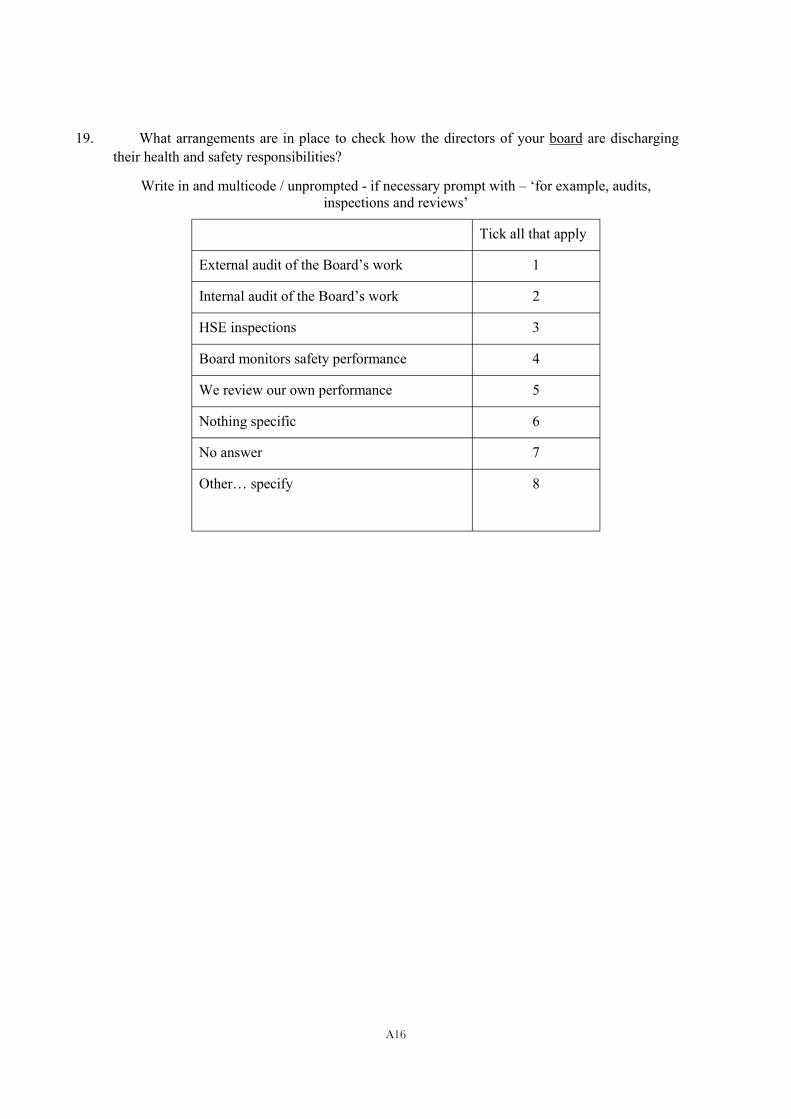
19. What arrangements are in place to check how the directors of your board are discharging their health and safety responsibilities?
Write in and multicode / unprompted - if necessary prompt with – ‘for example, audits, inspections and reviews’
Tick all that apply
External audit of the Board’s work 1
Internal audit of the Board’s work 2
HSE inspections 3
Board monitors safety performance 4
We review our own performance 5
Nothing specific 6
No answer 7
Other… specify 8
A16

20. On a scale of 1 to 3, where 1 is not at all, 2 is somewhat and 3 is a lot, to what extent have each of the following influenced the design of board level health and safety arrangements? Read out and tick one for each issue
Not at Somewhat A lot all
20a The Turnbull report 1 2 3
20b The prospect of a Corporate Killing law 1 2 3
20c Corporate governance requirements &/or perception 1 2 3
that H&S is a significant business risk
20d Fear of the company being prosecuted 1 2 3
20e Directors feared they’d be prosecuted 1 2 3
20e Risk of being sued 1 2 3
20f The ROSPA initiative “Director Action on Safety 1 2 3
and Health”
20f General concern about occupational health 1 2 3
performance
20h We have high risk operations 1 2 3
20g General concern about Safety performance 1 2 3
20i Concern about corporate responsibility / ethical 1 2 3
image
20j An accident / or near miss 1 2 3
20k Regulator pressure 1 2 3
20l Increased H&S regulations 1 2 3
20m Media pressure 1 2 3
20n Shareholder pressure 1 2 3
20o Best practice benchmarking 1 2 3
20p HSE / HSC guidance 1 2 3
20q General increase in importance of H&S 1 2 3
20r Is there anything else? (please write in below) 1 2 3
A17

21. To what extent do you agree with the statement on the following scale where 1 = strongly disagree; 2 = disagree; 3 = unsure; 4 = Agree and 5 = strongly agree.
“There are very strong pressures in this company’s business sector on Directors and boards to proactively direct the management of health and safety.” Ring one
Strongly disagree
Disagree Unsure Agree Strongly agree
1 2 3 4 5
22. Do you have any plans to increase the role of directors’ and board members in safety leadership? Ring one
Yes No Unsure
1 2 3
23. Have you heard of the HSC’s guide “Directors’ responsibilities for health and safety” (INDG 343)? Ring one
Yes No Unsure
1 2 3
24. Do you have plans to further review, within the next year, your board / director level health and safety arrangements against the HSC guide? Ring one
Yes Possibly No Unsure
1 2 3 4
25. May we contact you again next year, so that we can evaluate the effects of the HSE’s promotional activity about these issues? Ring one
Yes Possibly No Unsure
1 2 3 4
Thank and close
A18

Printed and published by the Health and Safety ExecutiveC30 1/98
Printed and published by the Health and Safety Executive C1.25 07/03

ISBN 0-7176-2713-6
RR 135
9 78071 7 6271 34£20.00

Health
and
safe
ty resp
onsib
ilities o
f com
pany d
irecto
rs and
managem
ent b
oard
mem
bers
HS
E B
OO
KS