Embed Size (px)
Citation preview

HSE Health & Safety
Executive
Management of work related road safety
Prepared by Entec UK Limited for the Health and Safety Executive
and Scottish Executive 2002
RESEARCH REPORT 018
HSE Health & Safety
Executive
Management of work related road safety
Rebecca Lancaster and Rachel Ward Entec UK Limited
Doherty Innovation Centre Pentlands Science Park
Bush Loan Penicuik
Midlothian EH26 0PZ
The following report summarises the findings of a three part study conducted for the Health and Safety Executive (HSE) and Scottish Executive. The study aimed to: identify and document good practice examples of occupational road safety policies and procedures; establish the contribution of individual differences to driver behaviour, and in doing so inform the recruitment of safer drivers and management of risk; and, establish the extent to which Scottish workplaces consider road safety as a health and safety issue. A model of good occupational road safety risk management is presented. The findings will assist the HSE and the Scottish Executive, should they wish to provide advice for employers on development of occupational road safety policies and procedures, and in doing so contribute to the aim of reducing the number of at-work road accidents and associated costs to employers.
This report and the work it describes were funded by the HSE and the Scottish Executive. Its contents, including any opinions and / or conclusions expressed, are those of the authors alone and do not necessarily reflect HSE or Scottish Executive policy.
HSE BOOKS

© Crown copyright 2002Applications for reproduction should be made in writing to:Copyright Unit, Her Majesty’s Stationery Office,St Clements House, 2-16 Colegate, Norwich NR3 1BQ
First published 2002
ISBN 0 7176 2549 4
All rights reserved. No part of this publication may be reproduced, stored in a retrieval system, or transmitted in any form or by any means (electronic, mechanical, photocopying, recording or otherwise) without the prior written permission of the copyright owner.
ii

CONTENTS EXECUTIVE SUMMARY V
Background v
Aims and methods v
Main findings vi
Conclusions viii
1. INTRODUCTION 1
1.1 Background 1
1.2 Aims and objectives 2
2. METHODS 3
2.1 Summary of the approach 3
2.2 Task ONE – Identification of individual factors contributing to driver safetyperformance 3
2.3 Task Two - Telephone Survey of Scottish Organisations 3
2.4 Task three - Case studies of good practice 5
3. FINDINGS - LITERATURE REVIEW 7
3.1 Overview 7
3.2 Scope of the review 7
3.3 Main findings 8
4. FINDINGS - TELEPHONE SURVEY OF SCOTTISH ORGANISATIONS 17
4.1 Sample summary 17
4.2 Driving Activities 17
4.3 Experience of road accidents 20
4.4 Accident Prevention 23
4.5 Perception of accident prevention policies 26
4.6 Effectiveness of accident prevention policies 26
4.7 Willingness to participate in further research 27
4.8 Summary 28
4.9 Important implications for road safety policy and procedure and for motivating employers to take action 29
5. FINDINGS - CASE STUDIES 31
5.1 Overview 31
iii

5.2 Reasons for adopting a safe driving policy 31
5.3 Approaches taken to reduce work-related road traffic accidents 31
5.4 How these systems are developed and managed 33
5.5 Impact on work-related road traffic incidents 33
5.6 Other benefits of the policy and practice 33
5.7 Lessons learned in developing these procedures 34
6. GENERAL DISCUSSION AND CONCLUSIONS 35
6.1 Model of good practice 35
7. REFERENCES 39
APPENDICES Appendix A Telephone survey questionnaire
Appendix B Case studies
iv

EXECUTIVE SUMMARY
BACKGROUND
There is evidence to suggest that company drivers are at increased risk of accidents relative to the general population. In addition there is also support for the notion that some individuals are safer drivers than others. The latter can be explained by individual characteristics such as age, gender, personality and so on. Whilst the costs of road accidents to organisations are enormous, many fail to take the required steps to assess and reduce the risks. It is thought that a better understanding of the individual factors that contribute to driver behaviour and demonstrated ways of managing the occupational road risks will aid and encourage employers to take action.
In response to the number of road accidents involving at-work vehicles, an inter-agency Workrelated Road Safety Task Group was established in May 2000, serviced by the Department for Transport, Local Government and the Regions (DTLR, formerly the Department of the Environment, Transport and the Regions, i.e. DETR) and the Health and Safety Executive. This group was established to consider the issue of work-related road traffic incidents. At the same time, the Scottish Executive wished to establish the extent of work-related road safety practices and policies in organisations in Scotland, to inform the Scottish Road Safety Campaign and highlight examples of good practice. The HSE and the Scottish Executive therefore jointly commissioned this research to achieve these objectives.
Two of its terms of reference were to ‘establish (or signal what further work is required to establish) the main causes and related methods of preventing incidents’; and to ‘propose minimum health and safety management standards’.
This report presents the findings of a study commissioned by the HSE and Scottish Executive, contributing to the aims of the Task Group and the road safety objectives of the Scottish Road Safety Campaign, Scotland’s national road safety body funded by the Scottish Executive.
AIMS AND METHODS
The study has three main aims:
• Establish the contribution of individual factors to driving behaviour and the implications for managing work-related road safety.
• Establish the extent to which road safety is considered a health and safety issue in Scottish workplaces.
• Identify and document good practice case studies of occupational road safety policy and procedures.
These were achieved by:
• Conducting a review of the literature on individual differences and driver behaviour
• Conducting a telephone survey of a sample of Scottish workplaces
• Identifying and visiting a number of organisations with effective occupational road safety policies and procedures.
v

MAIN FINDINGS
Literature review
A summary of the main findings is presented in this report. The full review has been published by HSE as a separate Research Report. Generally, the literature review highlighted that:
· Men were more likely to have an accident than women were.
· The nature of the accidents experienced by men and women were different.
· Younger drivers were at greater risk than were older drivers.
· There was generally a greater risk associated with increased levels of education.
· Certain personality characteristics were associated with increased risk; the most reported characteristics being ‘Sensation Seeking’ and risk taking.
· There was a relationship between social deviance and violations and accidents.
· There was a decreased risk of accident involvement with experience, although this tended to even out after eight years of experience.
· Stress was associated with increased accidents as were major life events.
· There was increased risk associated with certain medical conditions.
· There were differences across different ethnic groups.
The findings of this review have implications for occupational road safety policies and procedures, in particular recruitment, training, safety culture, medical screening, and stress management. Full copies of the literature review, ‘The contribution of individual factors to driving behaviour: implications for managing work-related road safety’, are available from HSE Books.
Telephone survey
This telephone survey covered a sample of Scottish workplaces taken from a range of sectors and different sizes of organisations. A summary of the findings from each of the topics covered in the survey are described below:
Driving Activities • The majority of organisations indicated that less than 10% of their workforce were expected
to drive as part of their job. A third indicated between 10% and 50% had driving responsibilities. A smaller proportion of the organisations stated that at least half of their workforce did drive as part of their job, whilst one in ten organisations reported that none of their employees were involved in driving as part of their job.
Nature of driving activities • Travel by peripatetic / professional / sales staff was the most typical driving activity. The
second most popular was the delivery and collection of goods.
• Cars were the most common type of vehicle used by organisations, followed by light goods vehicles and then large goods vehicles.
vi

Experience of road accidents • Of the work-related road accidents that had occurred during the past 3 years: the majority of
organisations had experienced a maximum of 10 accidents. However, 3% claimed to have had 50 or more accidents.
• The majority of accidents occurred during travel by peripatetic staff and delivery / collection of goods.
• The most common vehicle involved in accidents was cars, followed by light goods vehicles.
Accident prevention • Two-thirds of organisations claimed to have actively considered ways to reduce traffic
accidents / incidents.
Use of a safe driving policy • Approximately two-thirds (64%) of organisations claimed to have a policy relating to safe
driving procedures. Only 2% of the sample had considered it, but not actually implemented one.
Details of procedures • The most common procedure was driver training, followed by a written policy statement
and then driver assessments.
Motives for implementing the policy • The most common reason was out of concern for their staff, followed by adhering to H&S
regulations, and then reducing costs.
Perception of accident prevention policies • The most common benefit was meeting moral duty to employees and public, followed by
reducing insurance premiums and improved overall performance.
• The majority did not associate any particular disadvantages. The main disadvantage was that it was time-consuming.
Effectiveness of accident prevention policies • A third of organisations indicated that accident prevention policies produced effective
results (largely measured via the number of reports, claims, and accidents occurring).
• Only 5% of those implementing such a policy reported that the procedures had not worked well.
Case studies
• Employers were motivated to introduce road safety policies in order to reduce accidents and associated injuries and costs or in order to meet their legal duties regarding the welfare of their employees and the public.
• There was a range of procedures that were employed to tackle work-related road safety. These included risk assessment, driver training, incident reporting, incentive programmes, driver handbook / general guidance, guidance on mobile phone use / hands free sets etc., awareness campaigns, vehicle maintenance procedures / ergonomic checks, breakdown guidance / assistance, and alternative means of transport.
vii

• Most policies were co-ordinated by the health and safety specialist, often in conjunction with the fleet manager.
• Employers adopting such policies and procedures had seen a reduction in accidents and consequently a reduction in insurance premiums, reduced costs of vehicle damage and a reduction in sickness absence due to driving related injuries.
• Senior management commitment, involvement of employees in procedure development and risk assessment, and accurate data on which to measure improvement, were important characteristics of effective systems.
• More advanced systems aimed to change managers’ and drivers’ attitudes to the risks.
CONCLUSIONS
The findings of this study have significant implications for how organisations implement an occupational road safety policy and associated procedures. A model of good practice road safety risk management is presented in order to assist in motivating employers and providing guidance on action required. The case studies demonstrate how organisations, both large and small, and with different types of driving activities and vehicles can implement effective procedures. The model and the case studies should be equally useful for SMEs and large organisations, both of whom report that the main barrier to taking action is the time taken to develop and implement procedures.
viii

1. INTRODUCTION
1.1 BACKGROUND
There is evidence to suggest that company car drivers are at increased risk of accidents relative to the general population, even when demographic and exposure variables are considered. Lynn and Lockwood (1998) found them to be 49% more likely to be involved in an accident. There have been varying explanations for this increased risk. Adams-Guppy and Guppy (1995) suggested that it was due to strong time demands, affecting decision making regarding speed and overtaking. However Lynn and Lockwood (1998) found that increased accident liability of company car drivers extended to non-work driving, concluding that this increased risk was not due to increased pressure but to ‘driving style’.
However, Chapman et al (2001) warned that this elevated risk varies dependant on the nature of the vehicle and the purpose for which the vehicle is being driven. ‘Perk car’ and ‘Sales staff’ appear to be particularly at risk of accidents, whilst the ‘own car’ and ‘liveried vehicle drivers’ appear to be at a level that more closely mirrors the general population, when exposure is taken into account.
Some organisations have adopted systems to try and reduce this risk. For example Gregerson et al (1996) evaluated 4 different organisational measures to reduce road incidents - individual driver training, group discussions, campaigns, and bonus schemes. Campaigns and bonus schemes produced only small benefits, whilst driver training and discussion groups produced significant reductions in accident rates. However, Lynn and Lockwood (1998) found no significant evidence that attending a training programme reduced drivers’ accident liability.
As is outlined by Stradling et al (2001), when persons are employed to operate other large and dangerous pieces of equipment they usually ensure:
• A rigorous selection procedure
• Extensive training
• Frequent supervision
• Provision of feedback on performance
• Regular audits
• Skills updates on operating conditions and equipment change
• Retraining and remediation
• Warnings and / or action if their behaviour threatens the safety of themselves and others.
However, many organisations fail to treat company vehicles in the same manner, even though it is acknowledged as good health and safety practice to assess and control these risks in the same way as other physical hazards at work.
As well as the increased risk associated with company drivers, there is also an increased risk associated with various driver characteristics. These are differences in the driving behaviour of certain individuals associated with, for example, age, gender, personality, risk perception, and social deviance.
1

An inter-agency Work-related Road Safety Task Group was established in May 2000 serviced by the Department of Transport, Local Government and the Regions (DTLR) and the Health and Safety Executive. Two of its terms of reference were to ‘establish (or signal what further work is required to establish) the main causes and related methods of preventing incidents within the specified scope’; and to ‘propose minimum health and safety management standards’. At the same time, the Scottish Executive wished to establish the extent of work-related road safety practices and policies in organisations in Scotland, to inform the Scottish Road Safety Campaign and highlight examples of good practice. The HSE and the Scottish Executive therefore jointly commissioned this research to achieve these objectives.
It is considered that an increased understanding of the individual differences that affect driver behaviour may aid employers in recruiting safer drivers as well as tailoring their road safety interventions appropriately. In addition, whilst it is recognised that many organisations fail to address road safety as a health and safety issue, documentation of the procedures adopted by those who have taken action may be a useful form of guidance - particularly if these procedures can be seen to have an impact in reducing incidents and the associated costs to industry. Therefore in contributing to the aims of the Task Group and the objectives of the Scottish Executive, this project involved investigation of:
Part One: The contribution of individual factors to driving behaviour: implications for managing work-related road safety.
Part Two: The extent to which road safety is considered a health and safety issue in Scottish workplaces.
Part Three: Good practice case studies of occupational road safety policy and procedures.
1.2 AIMS AND OBJECTIVES
This project has three objectives: · Investigate, by reviewing existing literature, the contribution of individual factors as causes
of road traffic incidents
· Highlight the nature and range of safe driving initiatives / policies in place in Scottish based organisations and develop a database of organisations that have such procedures in place.
· Identify and document driving polices taking an organisational approach;
In meeting these aims, particular attention was paid to investigating the impact of safe driving policies on the number of road traffic incidents, developing case studies that demonstrate tangible benefits of adopting such policies and lessons learnt by those who have put such policies in place. Secondly, based on the outcome of the literature review, the feasibility of developing criteria for selection of safe drivers was considered.
2
2. METHODS
2.1 SUMMARY OF THE APPROACH
The project involved four tasks:
• A review of the literature to investigate the contribution of individual factors in safe driving performance
• A telephone survey of current employment of safe driving policies in Scotland
• Review of the effectiveness of safe driving policies, through case studies of good practice examples across England, Wales and Scotland
• Reporting for each of the above phases
2.2 TASK ONE – IDENTIFICATION OF INDIVIDUAL FACTORS CONTRIBUTING TO DRIVER SAFETY PERFORMANCE
A review of published literature was conducted to identify individual factors that have been suggested as predictors of safe driving performance.
An initial trawl of the literature was conducted to establish the nature of individual factors that had been reported. At this stage key words such as driver, driving, individual differences, road accidents, and road safety were used. Subsequently, a more comprehensive search was conducted using specific key words relating to the individual differences identified in the initial trawl (personality, age, gender, risk perception, alcohol etc.).
The scope of the review was to draw together existing literature rather than conduct a critical review. Due to the extent of the literature, the review concentrates on those studies conducted in the last two decades. However, personality tended to be investigated earlier than other issues such as fatigue, drugs, and alcohol and therefore earlier studies are reported.
The review was limited to those individual differences that could be applied in occupational road safety policies / procedures. Therefore papers on gender after retiring age were excluded, as were papers on income, residency, and peer pressure. Those studies including an investigation of occupation were also omitted, as these studies investigated ranging levels of accident involvement across different types of organisation, rather than individual differences in terms of different roles within an organisation.
As the literature review was international there are findings associated with cultural / ethnic differences, these findings should be treated with caution as they cannot necessarily be translated to aid our understanding of cultural differences within Great Britain and any implications these may have for occupational road safety.
2.3 TASK TWO - TELEPHONE SURVEY OF SCOTTISH ORGANISATIONS
A scoping survey of occupational road safety policies was recently conducted by LA / HSE inspectors who completed a checklist at various workplaces, across Great Britain, to establish:
• Background information
• Activities
• Management of health and safety and road safety
3

• Risk control measures
• Measurement of performance
• Review and audit
As there were relatively few Scottish workplaces covered, SE commissioned a further review, in the form of a telephone survey, as part of this research project.
2.3.1 Sample structure and size
Table 3.1 True representation of Scottish Organisations
INDUSTRY SECTORS 0 TO 49 EMPS 50 TO 249 EMPS
250+ EMPS
AGRICULTURE, FORESTRY & FISHING 7424 34 9 MINING & CONSTRUCTION 8132 323 78
MANUFACTURING 4841 672 196 TRANSPORTATION, COMMUNICATIONS
& UTILITIES 3264 144 47
WHOLESALE 4036 236 33 RETAIL 20928 282 56
FINANCE, INSURANCE & REAL ESTATE 2497 297 204 SERVICES 27266 845 269
The majority of organisations in Scotland are small. However, the use of such initiatives and policies is thought to be more likely in larger organisations. Therefore a disproportionate split of Large and SMEs was conducted (roughly one third large and two-thirds SMEs), with equal numbers of organisations sampled in each of the sectors. This allows comparisons regarding those organisations that were more likely to be taking action, based on their sector or size. 1006 organisations were surveyed as detailed below:
Size of company Total number of % of sample interviews required
MEDIUM 680 68% (50 – 249 employees)
LARGE 326 32% (250 + employees)
2.3.2 Nature of questioning
The questionnaire was designed by Entec and is provided in Appendix A. Contact details were obtained from Dun and Bradstreet and the interviews were conducted on behalf of Entec by Woodholmes Marketing Limited.
4

2.4 TASK THREE - CASE STUDIES OF GOOD PRACTICE
2.4.1 Sample structure of participating organisations.
A number of organisations adopting safe driving policies were identified by the following routes: • Contact with AA and RAC.
• ROSPA
• Recommendation by other organisations already identified.
• From outputs of the telephone survey of this project and the previous survey by LA / HSE inspectors.
• Organisations known to Entec and the Client (HSE / SE).
17 case studies were conducted (13 large and 4 SMEs, across England, Scotland and Wales). Particular problems were encountered in identifying SMEs with documented procedures. The organisations selected for review covered a range of driving activities (e.g. large goods haulage, goods delivery, sales, maintenance and professional staff travelling between meetings) and vehicles (light goods vehicles, vans and cars).
Organisations were selected on the basis of having tangible evidence of policies and procedures and, if possible, tangible evidence of a reduction in the number of incidents as a result of the procedures. A proforma was developed to assist in the selection of the most appropriate organisations for participation and sought the following information:
• Nature and size of organisation.
• Nature of activities and vehicles.
• Written policies and nature of procedures.
• Evidence of tangible improvements in safe driving performance (reduced incidents).
• Records of incidents over a number of years.
• Evidence of involvement of employees in development of the policy.
• Where organisations have tried various approaches, comparisons of approaches and lessons learned were explored.
Consultants visited each organisation to review the policies and procedures. Interviews were conducted with the person responsible for the co-ordination of the policy / procedures, usually the health and safety and / or fleet manager and a group of employees involved in driving. A proforma was developed for this purpose and covered the following:
• Company overview (Co-ordinator(s) only)
• Driving activities and vehicles
• Overview of road safety policies and procedures
- Setting up the system (Co-ordinator(s) only)
- Scope of policy and procedures
5

- Auditing and review
- Costs and benefits of the procedures
• The extent to which these procedures work in practice (employees only)
• Involvement in developing the procedures (employees only)
• Specific examples of risk reduction measures
• Lessons learned
• Future developments (Co-ordinator(s) only)
This information was then used to develop case studies of good practice examples of managing work-related road risks.
6

3. FINDINGS - LITERATURE REVIEW
3.1 OVERVIEW
A summary of the main findings and implications of the literature review are detailed here. The full literature review report, ‘The contribution of individual factors to driving behaviour: implications for managing work-related road safety’, has been published separately by HSE as a Research Report (available from HSE Books).
3.2 SCOPE OF THE REVIEW
102 references were cited, covering the following individual differences:
• Age
• Gender
• Education
• Personality
• Aggression
• Thoroughness in decision-making
• Driving confidence
• Attitudes
• Risk perception
• Social deviance
• Experience and previous motor vehicle accidents
• Stress
• Life events / factors
• Fatigue
• Physiology
• Ethnicity
The scope of the review was to draw together existing literature rather than conduct a critical review. Due to the extent of the literature, the review concentrates on those studies conducted in the last two decades. However, personality tended to be investigated earlier than other issues such as fatigue, drugs, and alcohol and therefore earlier studies are reported.
The review was limited to those individual differences that could be applied in occupational road safety policies / procedures. Therefore papers on gender after retiring age were excluded, as were papers on income, residency, and peer pressure. Those studies including an investigation of occupation were also omitted, as these studies investigated ranging levels of accident involvement across different types of organisation, rather than individual differences in terms of different roles within an organisation.
7
As the literature review was international there are findings associated with cultural / ethnic differences, these findings should be treated with caution as they cannot necessarily be translated to aid our understanding of cultural differences within Great Britain and any implications these may have for occupational road safety.
3.3 MAIN FINDINGS
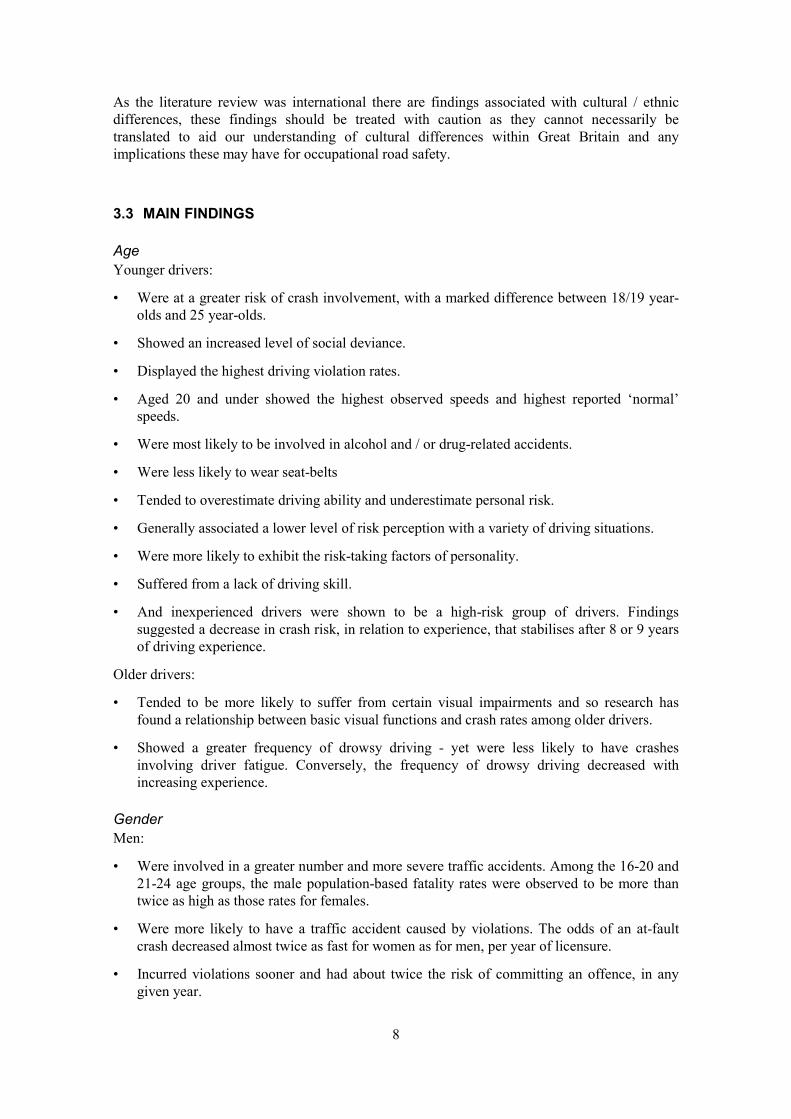
Age Younger drivers:
• Were at a greater risk of crash involvement, with a marked difference between 18/19 yearolds and 25 year-olds.
• Showed an increased level of social deviance.
• Displayed the highest driving violation rates.
• Aged 20 and under showed the highest observed speeds and highest reported ‘normal’ speeds.
• Were most likely to be involved in alcohol and / or drug-related accidents.
• Were less likely to wear seat-belts
• Tended to overestimate driving ability and underestimate personal risk.
• Generally associated a lower level of risk perception with a variety of driving situations.
• Were more likely to exhibit the risk-taking factors of personality.
• Suffered from a lack of driving skill.
• And inexperienced drivers were shown to be a high-risk group of drivers. Findings suggested a decrease in crash risk, in relation to experience, that stabilises after 8 or 9 years of driving experience.
Older drivers:
• Tended to be more likely to suffer from certain visual impairments and so research has found a relationship between basic visual functions and crash rates among older drivers.
• Showed a greater frequency of drowsy driving - yet were less likely to have crashes involving driver fatigue. Conversely, the frequency of drowsy driving decreased with increasing experience.
Gender Men:
• Were involved in a greater number and more severe traffic accidents. Among the 16-20 and 21-24 age groups, the male population-based fatality rates were observed to be more than twice as high as those rates for females.
• Were more likely to have a traffic accident caused by violations. The odds of an at-fault crash decreased almost twice as fast for women as for men, per year of licensure.
• Incurred violations sooner and had about twice the risk of committing an offence, in any given year.
8
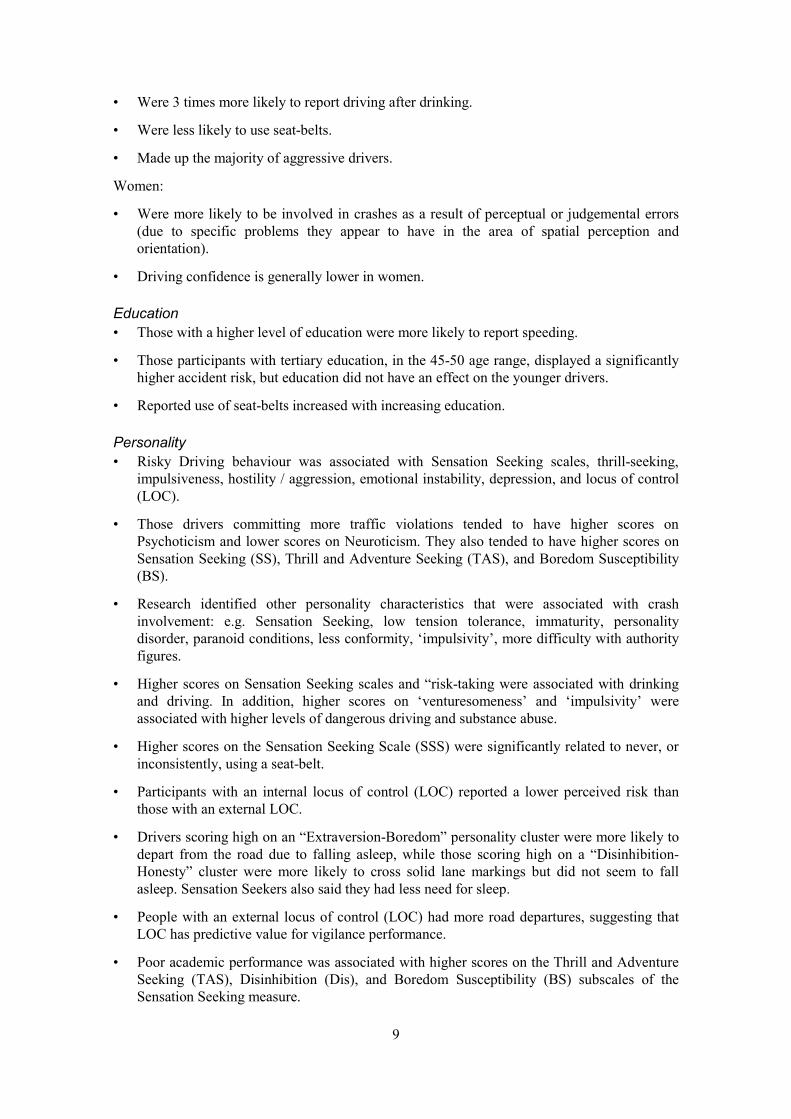
• Were 3 times more likely to report driving after drinking.
• Were less likely to use seat-belts.
• Made up the majority of aggressive drivers.
Women:
• Were more likely to be involved in crashes as a result of perceptual or judgemental errors (due to specific problems they appear to have in the area of spatial perception and orientation).
• Driving confidence is generally lower in women.
Education • Those with a higher level of education were more likely to report speeding.
• Those participants with tertiary education, in the 45-50 age range, displayed a significantly higher accident risk, but education did not have an effect on the younger drivers.
• Reported use of seat-belts increased with increasing education.
Personality • Risky Driving behaviour was associated with Sensation Seeking scales, thrill-seeking,
impulsiveness, hostility / aggression, emotional instability, depression, and locus of control (LOC).
• Those drivers committing more traffic violations tended to have higher scores on Psychoticism and lower scores on Neuroticism. They also tended to have higher scores on Sensation Seeking (SS), Thrill and Adventure Seeking (TAS), and Boredom Susceptibility (BS).
• Research identified other personality characteristics that were associated with crash involvement: e.g. Sensation Seeking, low tension tolerance, immaturity, personality disorder, paranoid conditions, less conformity, ‘impulsivity’, more difficulty with authority figures.
• Higher scores on Sensation Seeking scales and “risk-taking were associated with drinking and driving. In addition, higher scores on ‘venturesomeness’ and ‘impulsivity’ were associated with higher levels of dangerous driving and substance abuse.
• Higher scores on the Sensation Seeking Scale (SSS) were significantly related to never, or inconsistently, using a seat-belt.
• Participants with an internal locus of control (LOC) reported a lower perceived risk than those with an external LOC.
• Drivers scoring high on an “Extraversion-Boredom” personality cluster were more likely to depart from the road due to falling asleep, while those scoring high on a “Disinhibition-Honesty” cluster were more likely to cross solid lane markings but did not seem to fall asleep. Sensation Seekers also said they had less need for sleep.
• People with an external locus of control (LOC) had more road departures, suggesting that LOC has predictive value for vigilance performance.
• Poor academic performance was associated with higher scores on the Thrill and Adventure Seeking (TAS), Disinhibition (Dis), and Boredom Susceptibility (BS) subscales of the Sensation Seeking measure.
9
• Drivers with compromised vision displayed reduced risk-taking scores.
Aggression • Aggressive drivers, or those with a reduced capacity to manage or control hostility, tended
to be involved in more traffic accidents.
• Those drivers with the greatest number of crashes and violations had elevated scores on all 5 of the Buss-Durkee scales, as well as on a scale of driving-related aggression.
• Minor accident involvement was associated with more aggression and tension.
• Higher anger / hostility scores were associated with drink driving.
• The majority of aggressive drivers were poorly educated.
Thoroughness in decision-making • Hasty decision-making tended to be associated with an increased risk of crash involvement,
faster driving, a tendency to commit traffic violations, and social deviance.
Driving confidence • A higher level of driving confidence was associated with a tendency to commit driving
violations.
• A lower degree of self-confidence, when driving, was associated with an increased crash risk.
• Driving confidence was associated with a low score on Neuroticism and a high score on Extraversion.
Attitudes • Those drivers who regularly commit traffic violations tended to endorse the associated
driving behaviour.
• Above a certain minimum level of competence at vehicle handling and road reading, it was drivers with inappropriate attitude, rather than poor skill, who were more likely to crash.
• There were differences in attitudes and knowledge between drink driving offenders and non-offenders.
• Drivers who had a stable and optimistic attitude did not feel very sleepy, yet drivers’ selfreported attitude, regarding their susceptibility to sleepiness when driving, was not related to their actual driving performance.
Risk perception • Driving after drinking was associated with a lower level of risk perception.
• An increased level of driving experience was associated with an increased level of risk perception.
• Those drivers with personal experience of accidents, with different risky activities, reported a lower risk perception than those with no or little experience of accidents.
• There were cross-national differences in risk perceptions.
10

Social deviance • There was a strong relationship between social deviance and traffic violations, accident
involvement, accident repeaters, drink driving and aggression. Violations are suggested to be one manifestation of social deviance.
Experience and previous motor vehicle accidents • Duration of licence, rather than prior motor vehicle accidents (MVAs), was related to the
likelihood of a crash being at-fault.
• Increased experience was related to a decrease in the likelihood of an accident being atfault.
Stress • High job stress predicted future motor vehicle accidents (MVAs).
• Financial stress increased the likelihood of more serious accidents.
• Drivers experiencing minor accident involvement reported the highest levels of general stress, whereas participants who had major or no accident involvement scored relatively low levels of stress.
• Levels of general stress were lower in those reporting a speeding conviction than in those reporting minor accident involvement.
• Increased stress was associated with risky driving behaviour, higher lapse scores and speed scores.
Life events / factors • Lower life satisfaction scores were associated with poorer driving behaviour scores.
• Higher life event scores were associated with higher scores for violations.
• More negative life events were associated with drink driving.
• Increased life satisfaction was related to a lower risk of accidents in a mid-age range (aged 45-50 years).
Fatigue • Increased experience was related to a reduction in frequency of drowsy driving.
• Alcohol consumption was suggested to be the single greatest cause of driver fatigue.
• Lower self-perceived health was associated with an increase in sleepiness-related difficulties when driving.
• The frequency of reported ‘difficulties in remaining alert’ increased by 4.44 times, if the driver’s self-perceived health was no more than satisfactory health, when compared to excellent health.
• A sleep deficit in combination with lower self-perceived health increased driver sleepinessrelated problems further.
• Specific illnesses have also been related to fatigue.
• The use of medication can also increase the likelihood of drowsy driving.
• Driver fatigue has an effect on psychomotor skills and induces perceptual decrements.
11

Physiology • Certain visual impairments predicted accident involvement.
• Specific medical conditions increased accident risk.
• Habitual alcohol consumption increased accident risk.
• Lack of driving experience, at detecting objects in the traffic environment, may be related to poorer perceptual processing.
Ethnicity • Young white American drivers (<45 years old) experienced higher rates of accident
involvement, whilst non-white Americans experienced higher accident rates for ages 45 and above.
• Black Americans were no more likely than White Americans to have accidents but, when they occurred, they tended to be more severe. Native Americans had a high crash fatality rate.
• Non-Caucasians tended to run red-lights more frequently than Caucasians in a U.S. study.
• American Hispanics (as one group) and Whites both showed high rates of ‘driving while intoxicated’ (DWI). Alcohol-related deaths were more prevalent among Mexican Americans than they were among Caucasians, but this was not the case for the Cuban and Puerto Rican Americans.
• Mexican Americans reported heavier and more frequent drinking than Caucasians.
• Black Americans were found to have the least percentage of ‘driving while intoxicated’ (DWI) accidents.
3.3.1 Implications for occupational road safety policy and procedures
The findings of this review may have significant implications for those organisations with existing road safety policies and procedures and may encourage those without procedures to develop more appropriate systems. These implications are discussed below. Ethnicity, whilst showing variations in driver behaviour across different countries and their cultures, is not considered relevant as these variations cannot be generalised to Great Britain.
Policy development and Safety Culture It is apparent from the findings of this study that attitudes and risk perception have a significant impact on the causes of road traffic accidents and on driving behaviour generally. Safety culture has been defined as ‘The characteristic shared attitudes, values, beliefs and practices concerning the importance of health and safety and the necessity for effective controls (IOSH, 1994)’. To establish a positive safety culture requires senior management commitment to health and safety and involvement of employees, at all levels, in decision-making.
In many organisations road safety may not be identified as a health and safety issue, and as a consequence managers and peers may be reluctant to question, comment, or point out the dangers and risks of unsafe driving behaviour. In order to establish a positive culture, in respect of occupational road safety, there is a need to raise awareness of the risks and then encourage all employees to question unsafe behaviour. There are significant variations in peoples’ attitudes and their perception of the risk, and the challenge for organisations is to shape the behaviour of those with extreme attitudes by increased awareness and encouraging feedback from colleagues
12

and managers. Involvement of employees in the development of procedures will increase confidence in the efficacy of control measures.
Recruitment The following section highlights how the individual differences identified may be taken into consideration when recruiting new employees. These apply mostly when employees are recruited for jobs where driving is the most significant task. Whilst profiles of safer drivers can be established, it is also necessary to consider the other responsibilities of employees. The characteristics that are associated with safer driving may not be compatible with the characteristics that are typical of effective performance on other tasks. For example, the characteristics required to be an effective sales representative may be very different from those associated with safe driving.
Personality profiles It is evident from the review that certain personality characteristics are associated with unsafe driving behaviour and / or accident involvement. Some of these characteristics include: risktaking, thrill seeking (including Thrill and Adventure Seeking, Boredom Susceptibility, Disinhibition), impulsiveness, hostility / aggression, hasty decision-making, emotional instability, depression, external locus of control, low tension tolerance, immaturity, personality disorder, paranoid conditions, less conformity and more difficulty with authority figures. In addition, high scores on Neuroticism are a strong predictor of stress, which in turn is associated with risky driving behaviour and accident involvement. Various standard personality scales incorporate some of the factors. For example Cattell’s 16PF (16 Personality Factor Scale) includes Emotionality, Venturesome, Tension and Conservatism. The D.I.S.C. personality profile covers Compliance and Dominance that are relevant to the associated factors. Some individual organisations have profiled their own drivers to identify the characteristics of safer drivers, using this information to develop profiles of safer drivers for recruitment purposes.
Age restrictions Clearly younger drivers are of significant greater risk of accident involvement, particularly males. The age group at particular high risk are those aged between 18 and 19, with a marked reduction in crash involvement compared with 25 to 54 year-olds. Whilst experience has some affect it only partially explains this relationship. It may be argued that a minimum age limit for driving may improve fleet safety performance.
Experience There is a reduced risk of at-fault accidents with increased experience. This effect evens out after approximately 8 years. Therefore there may be advantages to recruiting drivers with some years experience.
Social deviance There is a strong relationship between social deviance and traffic violations and this is associated with crash involvement. Investigating violation records (licence checks) as well as general criminal records may assist in recruiting safer drivers.
Risk perception Lower risk perception is associated with increased accident involvement and, therefore, exploring peoples’ perception of risks and their attitudes towards driving may assist in identifying and recruiting safer drivers.
13
3.3.2 Training
There are two aspects to training to improve driving performance, i.e. awareness of the risks and development of skills.
Awareness of risk There is evidence to suggest that perception of risk has a significant impact on accidents. Therefore, improving peoples’ perception of the risk, through training and awareness, could potentially improve driving performance. As well as formal driving courses this training and awareness may take the form of:
• Guidance on safer driving.
• Campaigns on particular risks (winter driving tips, reverse parking policy, safer reversing etc.).
• Incident reports.
• Near miss reports.
• Involvement of drivers in risk assessment.
• Fatigue-awareness programmes: e.g. adjusting car environments to keep drivers awake and alert; emphasising taking breaks, and that different people may become drowsy at different times; measuring for driver sleep deficits.
Skill development There are significant variations in the types of violations and nature of accidents based on individual differences (e.g. gender, personality). Therefore it is reasonable to assume that the skills of individuals will vary significantly. For example, women are more likely to have a crash as a result of perceptual or judgemental errors, whereas men are more likely to have a crash as a consequence of a violation. People from different cultures may need specific skills training, for example, training for differences in risk perceptions which may be apparent, crossnationally. In addition, certain ethnic groups may benefit from being targeted by different types of training. Training that involves assessment of individual skills and one-on-one skill development is likely to be much more effective than training presented to a broad audience with mixed and varied skills.
3.3.3 Pre and post employment medical screening
A number of medical conditions were found to be associated with increased crash involvement including visual impairment, habitual alcohol consumption, as well as musculoskeletal abnormalities, memory conditions, and chronic illness. A formal medical screening programme would allow assessment of a driver’s fitness for work. Additionally certain medications can increase drowsiness and therefore it is important to ensure drivers are aware, when purchasing medication, or that they report taking prescribed medication. Specific illnesses have also been related to fatigue, which increases the risk of accidents.
3.3.4 Managing stress
Stress has been shown to increase risky driving behaviour and is associated with increased involvement in minor accidents. Increased stress has also been associated with fatigue states when driving, which in turn has been associated with increased accident involvement. There are two implications of these findings. Firstly the organisation can and should monitor any stress caused by work. There are a number of means of achieving this, including: questionnaires and audits, discussions with staff, as part of the annual review / performance management
14

procedure, and through supportive management. Sickness absence figures may reflect the levels of stress in an organisation and analysis of the reasons for sickness absence can assist in identifying whether or not stress is a cause of sickness. Secondly, stress may be caused by factors outside work, but supportive management style and culture within an organisation can assist in reducing the impact on performance at work.
In addition, major life events have been associated with violations and driving while intoxicated. Therefore, support may be required to reduce the impact of life events, including flexible work arrangements and a well planned and managed return to work.
15

16

4. FINDINGS - TELEPHONE SURVEY OF SCOTTISH
ORGANISATIONS
The Scottish Executive commissioned a telephone survey to inform the Scottish Road Safety Campaign on the extent of road safety policies in workplaces in Scotland. 1006 organisations were surveyed (i.e. 680 SME’s and 326 large organisations).
4.1 SAMPLE SUMMARY
Respondents were asked to state which sector their organisation belongs to. The results are illustrated in Figure 4.1
Figure 4.1
3% 8%
6% 2%
4% 4%
0% 10% 20%
i lMi i
ing
il Fi
Sectors
19%
21% 33%
30% 40% 50%
Agr cu ture ning & construct on
ManufacturTransportation
Wholesale Retanance
Services Other
A third of organisations stated that they worked in ‘other’ sectors. Of the pre-coded sectors given, service was the most popular. One fifth (21%) of the organisations surveyed work in the service sector. The second most popular sector was manufacturing, as stated by 19% of the sample.
The distribution of sector by organisation size is illustrated in Figure 4.2.
4.2 DRIVING ACTIVITIES
4.2.1 Proportion of workforce required to drive
Respondents were asked to state what proportion of their workforce were involved in driving as part of their job.
17

The majority (44%) of organisations surveyed indicated that less than 10% of their workforce were ‘expected to drive as part of their job’. A third of organisations (33%) stated that between 10% and 50% of their employees were ‘involved in driving as part of their job’. 13% of organisations surveyed claimed that at least half of their workforce did drive as part of their job. One in ten organisations (9%) stated that none of their employees were involved in driving as part of their job.
Figure 4.2
19 8 27
49 36 85
136 58 194
36 23 59
15 7 22
25 12 37
20 18 38
156 51 207
224 113 337
680 326 1006
Count Col %
i
Count Col %
Mi ion
Count Col % Count Col %
i ions
Count Col % Count Col % Count Col % Count Col % Count Col %
i
ion
Count Col %
l
50 and 249 250
ion?
l
Sector by size of organisation
2.8% 2.5% 2.7%
7.2% 11.0% 8.4%
20.0% 17.8% 19.3%
5.3% 7.1% 5.9%
2.2% 2.1% 2.2%
3.7% 3.7% 3.7%
2.9% 5.5% 3.8%
22.9% 15.6% 20.6%
32.9% 34.7% 33.5%
100.0% 100.0% 100.0%
Agriculture, forestry & f shing
ning & construct
Manufacturing
Transportat on, communicat& utilities Wholesale
Retail
Finance, Insurance & estates
Services
Other
Wh ch sector does your organisatbelong to?
Tota
Between
employees
More than
employees
What size is your organisat
Tota
Comparatively, 16% of large organisations stated that at least half of their workforce drove as part of their job, compared to 12% of medium organisations.
As stated above, organisations indicating that none of their workforce was involved in driving included 12% of medium sized organisations and 4% of large organisations. In terms of sectors, those sectors that were least likely to have any employees driving were as follows:
• 13% Services (N = 26)
• 12% Other (N = 39)
• 8% Manufacturing (N = 16)
• 8% Retail (N= 3)
• 8% Finance insurance & Estates (N = 3)
18

Those with less than 50% of the workforce involved with driving as part of their job included 76% of medium organisations and 79% of large organisations.
Organisations with more than 50% of their workforce involved with driving, included 12% of medium sized organisations and 16% of large organisations. The sectors in which the majority of employees were expected to drive as part of their typical duties included:
• 37% Transport, communications and utilities (N = 59)
• 30% Agriculture, forestry and fishing (N = 8)
• 22% Mining & construction (N = 19)
4.2.2 Nature of driving activities
Respondents were asked to state what kind of driving activities workers were involved in. The chart below plots the responses. Over half of the organisations surveyed (55%) indicated that ‘travel by peripatetic / professional / sales staff’ was included in their typical driving activities, this was the most popular activity undertaken by the sample. The second most popular activity being the delivery and collection of goods, as undertaken by exactly half (50%) of the organisations surveyed.
Figure 4.3
15% 50%
6% 20%
16% 3% 3%
55% 10%
0% 20% 40% 60% 80% 100%
Driving activities
Large goods / haulage
Delivery / collection of goods
Courier services
Passenger transport
Construction / maintenance
Cleansing / refuse collection
Emergency services
Travel by peripatetic staff
Other
As illustrated above 10% mentioned ‘other’ activities. These other activities included:
• 49% Warehouse activities (N = 43)
• 21% Transporting workers / patients / visitors (N = 18)
• 12% Agricultural purposes (N = 10)
• 10% Road / Testing / Service vehicles (N = 9)
19
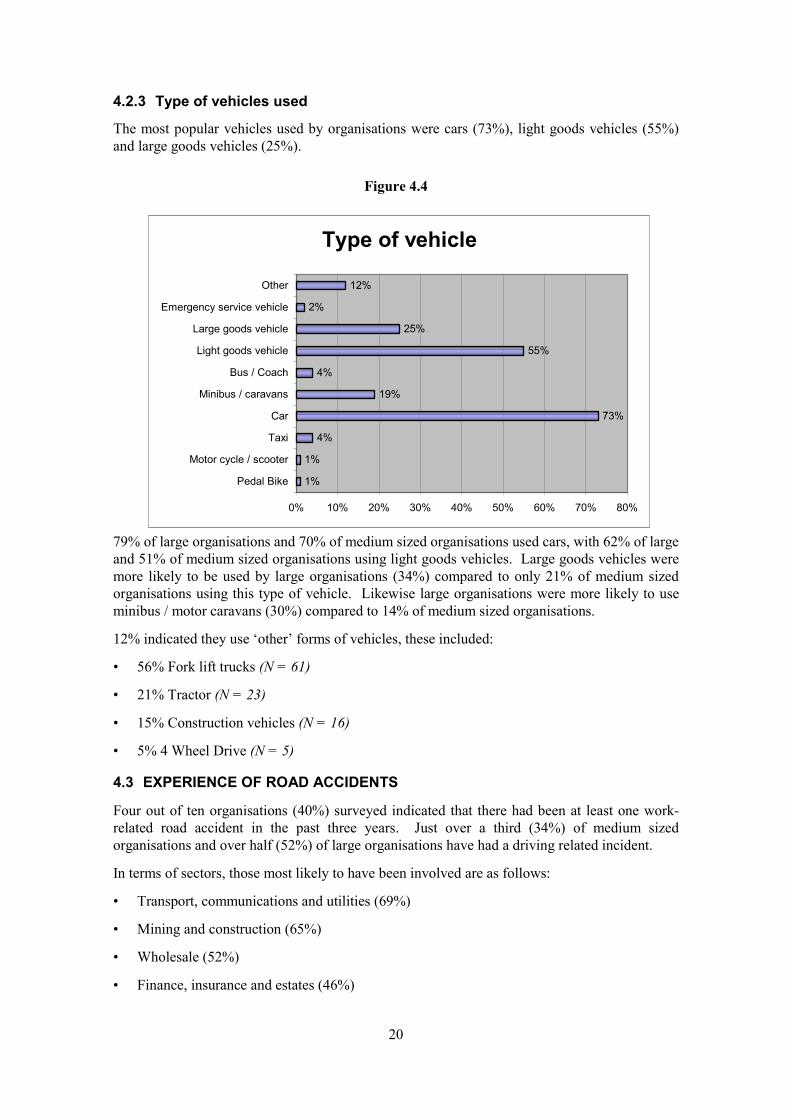
4.2.3 Type of vehicles used
The most popular vehicles used by organisations were cars (73%), light goods vehicles (55%) and large goods vehicles (25%).
Figure 4.4
1%
1%
4%
73%
19%
4%
55%
25%
2%
12%
0% 10% 20% 30% 40% 50% 60% 70% 80%
i
l
Taxi
Car
Mi /
/
le
le
le
Type of vehicle
Pedal B ke
Motor cyc e / scooter
nibus caravans
Bus Coach
Light goods vehic
Large goods vehic
Emergency service vehic
Other
79% of large organisations and 70% of medium sized organisations used cars, with 62% of large and 51% of medium sized organisations using light goods vehicles. Large goods vehicles were more likely to be used by large organisations (34%) compared to only 21% of medium sized organisations using this type of vehicle. Likewise large organisations were more likely to use minibus / motor caravans (30%) compared to 14% of medium sized organisations.
12% indicated they use ‘other’ forms of vehicles, these included:
• 56% Fork lift trucks (N = 61)
• 21% Tractor (N = 23)
• 15% Construction vehicles (N = 16)
• 5% 4 Wheel Drive (N = 5)
4.3 EXPERIENCE OF ROAD ACCIDENTS
Four out of ten organisations (40%) surveyed indicated that there had been at least one workrelated road accident in the past three years. Just over a third (34%) of medium sized organisations and over half (52%) of large organisations have had a driving related incident.
In terms of sectors, those most likely to have been involved are as follows:
• Transport, communications and utilities (69%)
• Mining and construction (65%)
• Wholesale (52%)
• Finance, insurance and estates (46%)
20

• Agriculture, forestry and fishing (46%)
Less than four out of ten organisations had experienced accidents in the following sectors:
• Manufacturing (32%)
• Other (33%)
• Retail (35%)
• Services (39%)
Unsurprisingly the greater proportion of the workforce involved in driving activities, the more likely organisations were to have experienced accidents / incidents during the past three years:
• 26% of organisations with less than 10% of the workforce involved in driving.
• Over half (52%) of those with between 10% and 50% of their workforce involved in driving.
• Six out of ten (62%) of those with more than 50% of their staff involved in driving.
4.3.1 Number of work related accidents
Of the 40.5% (N = 370) of the sample that had experienced road traffic accidents in the past three years, the majority had 10 accidents or less. This is illustrated Figure 4.5
In total 65% of those organisations that had experienced accidents during the past three years had 10 accidents or less. 6% had between 11 and 20 accidents, 4% had between 21 and 49 accidents and 3% claimed to have had 50 or more accidents. In total a fifth of respondents (21%) could not recall the specific number of accidents encountered in the past 3 years.
Figure 4.5
i
20% 60%
i i
i
Number of acc dents
0% 40% 80% 100%
TOTAL
Medium s zed compan es
Large compan es
0 to 10 11 to 20 21 to 49 50 to 99 Over 100 Don't know
Large organisations were least likely to know how many accidents had occurred (31%) compared to 13% of medium sized organisations. In total large organisations, unsurprisingly given the increased number of employees, experienced more incidents. 6% of large organisations experienced 50 or more accidents in the past 3 years, compared to only 3% of medium sized organisations. However, proportionally, SMEs experienced more accidents per employee than did large organisations. In terms of sector, those experiencing more than 11 accidents in the preceding three year period were as follows:
21
• 25% of Agriculture, Forestry and Fishing
• 25% of Mining & Construction
• 25% of Retail
• 17% of Transportation, Communication & Utilities
• 15% of Services
• 10% of ‘other’ types of organisations
• 9% of Manufacturing
• 6% of Finance Insurance and Estates
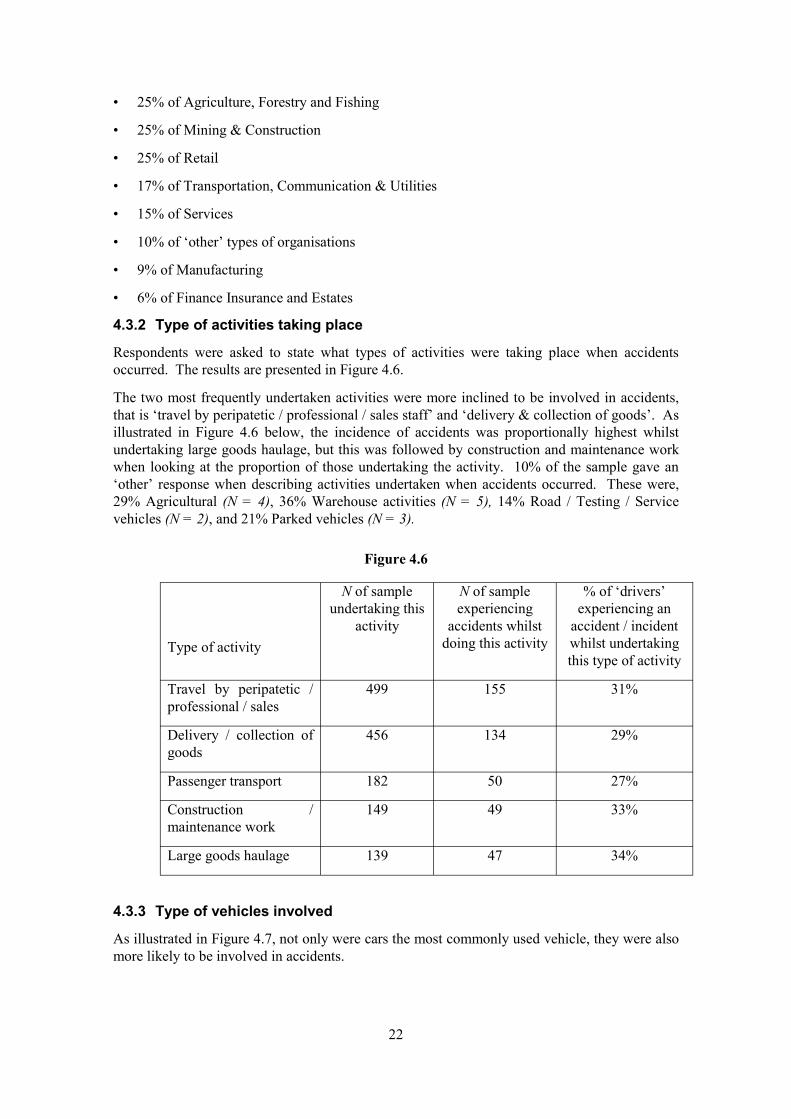
4.3.2 Type of activities taking place
Respondents were asked to state what types of activities were taking place when accidents occurred. The results are presented in Figure 4.6.
The two most frequently undertaken activities were more inclined to be involved in accidents, that is ‘travel by peripatetic / professional / sales staff’ and ‘delivery & collection of goods’. As illustrated in Figure 4.6 below, the incidence of accidents was proportionally highest whilst undertaking large goods haulage, but this was followed by construction and maintenance work when looking at the proportion of those undertaking the activity. 10% of the sample gave an ‘other’ response when describing activities undertaken when accidents occurred. These were, 29% Agricultural (N = 4), 36% Warehouse activities (N = 5), 14% Road / Testing / Service vehicles (N = 2), and 21% Parked vehicles (N = 3).
Figure 4.6
Type of activity
N of sample undertaking this
activity
N of sample experiencing
accidents whilst doing this activity
% of ‘drivers’ experiencing an
accident / incident whilst undertaking this type of activity
Travel by peripatetic / professional / sales
499 155 31%
Delivery / collection of goods
456 134 29%
Passenger transport 182 50 27%
Construction / maintenance work
149 49 33%
Large goods haulage 139 47 34%
4.3.3 Type of vehicles involved
As illustrated in Figure 4.7, not only were cars the most commonly used vehicle, they were also more likely to be involved in accidents.
22

Over half of all accidents experienced by organisations involved a car (54%), the second most common type of vehicle to be involved in an accident was a light goods vehicle (38%). As stated earlier in the report these are the two most commonly used vehicles. As highlighted in the table below, the incidence of accidents with large goods vehicles was disproportionately high compared to the usage figures for this type of vehicle.
Figure 4.7
Type of vehicle N of sample using this form
of transport
N of sample experiencing
accidents with this type of vehicle in the
past 3 years
% of users experiencing an
accident / incident with this type of
vehicle
Car 662 198 30%
Light Goods Vehicle
498 141 28%
Large goods Vehicle
230 87 38%
Minibus / Motor Caravans
175 29 17%
Accidents were likely to occur with 38% of large goods vehicle users, compared to 30% of car users, and 28% of users of light goods vehicles.
4.4 ACCIDENT PREVENTION
Two thirds of organisations (66%) claimed to have actively considered ways to reduce traffic related accidents / incidents. This accounts for 76% of large organisations (i.e. those with 250+ employees) and 61% of medium sized organisations (i.e. those with between 50 and 249 employees).
In terms of sector, the following had considered ways to reduce accidents:
• 67% Agriculture, Forestry and Fishing (N = 18)
• 72% Mining and Construction (N = 61)
• 64% Manufacturing (N = 124)
• 81% Transport, Communication & Utilities (N = 48)
• 59% Wholesale (N = 13)
• 51% Retail (N = 19)
• 50% Finance, Insurance & Estates (N = 19)
• 67% Services (N = 138)
• 67% Other (N = 224)
In terms of experience of accidents, organisations that had experienced fewer accidents were least likely to have considered ways in which to reduce accidents. About a quarter of
23
organisations that had experienced a maximum of twenty accidents / incidents in the past 3 years claimed not to have considered ways of reducing accidents, compared with 6% of those experiencing 21 – 49 accidents / incidents and none of those experiencing 50 or more accidents.
Those with a higher proportion of their workers involved in driving were more inclined to have considered ways to reduce accidents / incidents. Just over half (52%) of organisations with less than 10% of their employees involved in driving had actively considered ways to minimise the likelihood of accidents, as had 71% of those with between 10% and 50% of their workforce involved in driving, and 76% of those with over half of all employees taking part in this activity.
4.4.1 Use of a safe driving policy
Just under two thirds of organisations (64%) claimed to have a policy relating to safe driving procedures, this was true for 70% of large organisations and 60% of medium sized organisations. In terms of sectors, transport, communication, and utilities were more inclined to have a safe driving policy (88%), and those involved in manufacturing were those least inclined to have such a policy (52%).
Those with a safe driving policy included:
• 88% of those involved in large goods haulage
• 74% of organisations using cars
• 70% of organisations using light goods vehicles
• 70% of those organisations that had experienced a maximum of ten accidents in the past 3 years
• 65% of organisations who had experienced between 11 and 20 accidents
• 87% of organisations who had experienced between 21 and 49 accidents
• 78% of organisations who had experienced over 50 accidents.
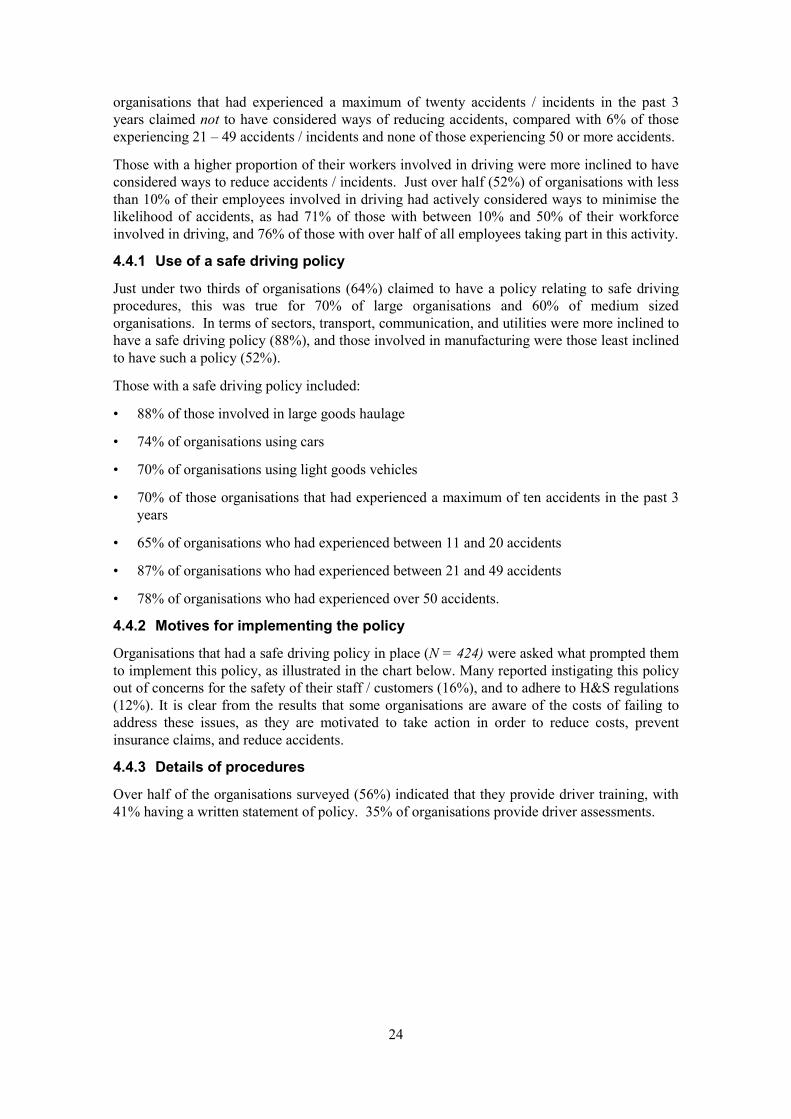
4.4.2 Motives for implementing the policy
Organisations that had a safe driving policy in place (N = 424) were asked what prompted them to implement this policy, as illustrated in the chart below. Many reported instigating this policy out of concerns for the safety of their staff / customers (16%), and to adhere to H&S regulations (12%). It is clear from the results that some organisations are aware of the costs of failing to address these issues, as they are motivated to take action in order to reduce costs, prevent insurance claims, and reduce accidents.
4.4.3 Details of procedures
Over half of the organisations surveyed (56%) indicated that they provide driver training, with 41% having a written statement of policy. 35% of organisations provide driver assessments.
24
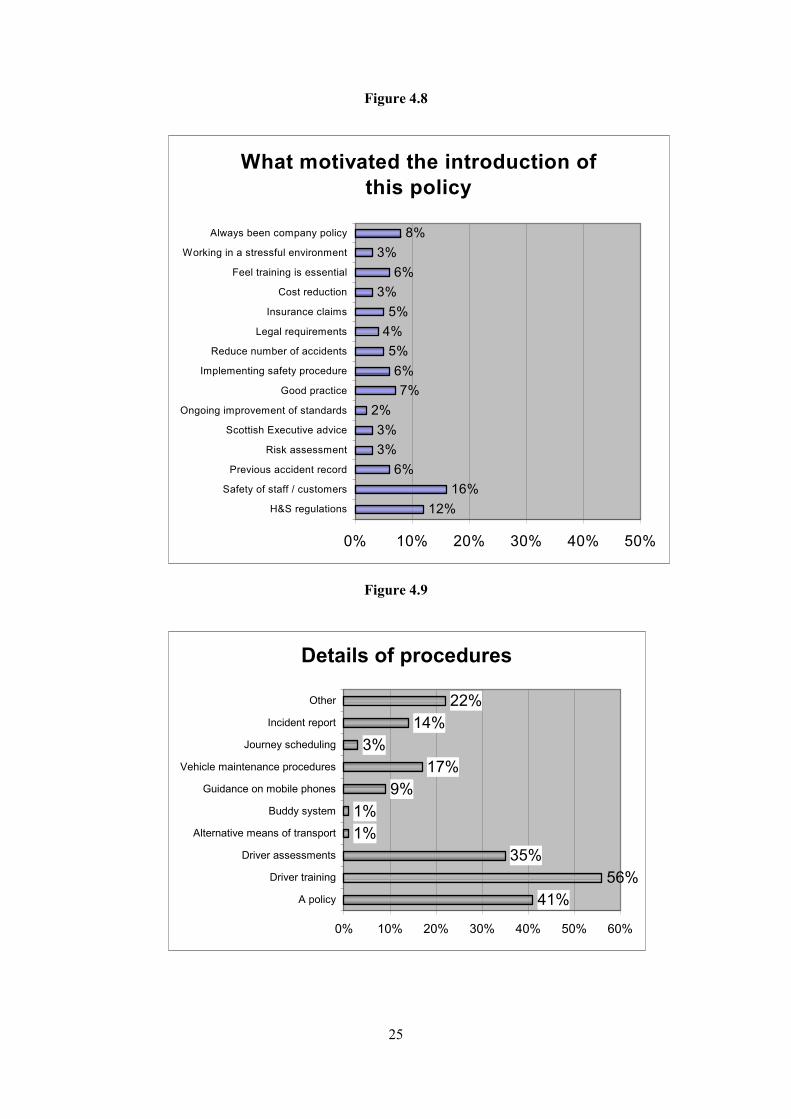
Figure 4.8
12% 16%
6% 3% 3%
2% 7%
6% 5%
4% 5%
3% 6%
3% 8%
0% 10% 20% 30% 40% 50%
i i
i
idents
l
l
i i
Al i
What motivated the introduction of this policy
H&S regulations
Safety of staff / customers
Prev ous acc dent record
Risk assessment
Scottish Executive adv ce
Ongoing improvement of standards
Good practice
Implementing safety procedure
Reduce number of acc
Legal requirements
Insurance c aims
Cost reduction
Feel training is essentia
Work ng in a stressful env ronment
ways been company pol cy
Figure 4.9
Details of procedures
41% 56%
35% 1% 1%
9% 17%
3% 14%
22%
0% 10% 20% 30% 40% 50% 60%
i
Al i
l
l i
i
i
A policy
Driver training
Dr ver assessments
ternat ve means of transport
Buddy system
Guidance on mobi e phones
Vehic e ma ntenance procedures
Journey schedul ng
Inc dent report
Other
25

22% of respondents mentioned that their organisation had ‘other’ procedures in place. These included:
• 23% Risk Management Team (N = 15)
• 14% First aid / Health & Safety (N = 9)
• 12% Questionnaire / Check list (N = 8)
• 12% Check driving licences / spot checks (N =8)
• 9% Code of conduct (N = 6)
• 8% Drivers insurance (N = 5)
4.5 PERCEPTION OF ACCIDENT PREVENTION POLICIES
4.5.1 Advantages
38% of those that had a safe driving policy saw a key benefit as meeting a moral duty to employees and the public. A fifth of organisations (22%) saw an advantage of such policy in relation to their insurance premiums, and 17% believed that overall performance improved as a result of such policies being in place.
Nearly half of respondents stated ‘other’ advantages, these included:
• Safer environment / reduce accidents (N = 93).
• Improved awareness (N = 37).
• More confidence in workers (N = 23).
12 respondents indicated that there were no particular advantages associated with a safe driving policy.
4.5.2 Disadvantages
Three quarters of those that had a safe driving procedure in place (74%) did not associate any particular disadvantages with it.
22% mentioned ‘other’ disadvantages, these included:
• Time consuming / costly
• Additional administration / workload
• Achieving consistency / sticking to the procedure
• Lost time
• Staff view it negatively
4.6 EFFECTIVENESS OF ACCIDENT PREVENTION POLICIES
4.6.1 Successful policies
The organisations that currently operate accident prevention policies were asked if they had demonstrated results of the effectiveness of these procedures. Just over a third (34%) indicated that they did have demonstrated results. This included 38% of medium organisations and 30% of large organisations. Those organisations in the service sector were more inclined to respond positively to this issue (42%) and those in agriculture, forestry and fishing were less inclined to respond positively (8%).
26
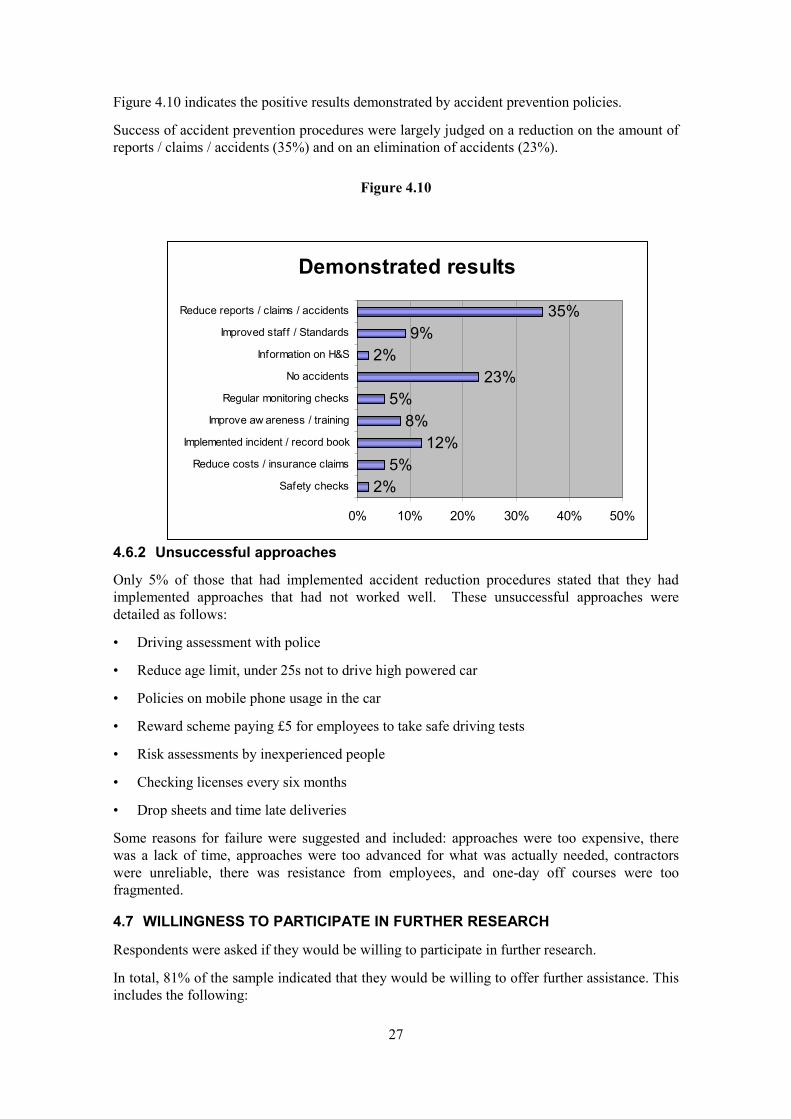
Figure 4.10 indicates the positive results demonstrated by accident prevention policies.
Success of accident prevention procedures were largely judged on a reduction on the amount of reports / claims / accidents (35%) and on an elimination of accidents (23%).
Figure 4.10
2% 5%
8% 5%
23% 2%
9% 35%
20% 50%
i lai
I i /
I
l i i
i
Inf i
I f /
/ cl / i
Demonstrated results
12%
0% 10% 30% 40%
Safety checks
Reduce costs / nsurance c ms
mplemented inc dent record book
mprove aw areness / training
Regu ar mon tor ng checks
No acc dents
ormat on on H&S
mproved staf Standards
Reduce reports aims acc dents
4.6.2 Unsuccessful approaches
Only 5% of those that had implemented accident reduction procedures stated that they had implemented approaches that had not worked well. These unsuccessful approaches were detailed as follows:
• Driving assessment with police
• Reduce age limit, under 25s not to drive high powered car
• Policies on mobile phone usage in the car
• Reward scheme paying £5 for employees to take safe driving tests
• Risk assessments by inexperienced people
• Checking licenses every six months
• Drop sheets and time late deliveries
Some reasons for failure were suggested and included: approaches were too expensive, there was a lack of time, approaches were too advanced for what was actually needed, contractors were unreliable, there was resistance from employees, and one-day off courses were too fragmented.
4.7 WILLINGNESS TO PARTICIPATE IN FURTHER RESEARCH
Respondents were asked if they would be willing to participate in further research.
In total, 81% of the sample indicated that they would be willing to offer further assistance. This includes the following:
27
• 76% Medium sized organisations (N = 191)
• 87% Large organisations (N = 152)
4.8 SUMMARY
To summarise, the following main conclusions could be drawn:
• The majority of organisations indicated less than 10% of their workforce were ‘expected to drive as part of their job’. A third indicated between 10% and 50% of employees were ‘involved in driving as part of their job’. A smaller proportion of the organisations stated that at least half of their workforce drove as part of their job, whilst one in ten organisations reported that none of their employees are involved in driving as part of their job.
• Travel by peripatetic / professional / sales staff was the most typical driving activity. The second most popular was the delivery and collection of goods.
• Cars were the most common type of vehicle used by organisations, followed by light goods vehicles and then large goods vehicles.
• Of the work-related road accidents that had occurred during the past 3 years: the majority of organisations had experienced a maximum of 10 accidents. However, 3% claimed to have had 50 or more accidents.
• The majority of accidents occurred during travel by peripatetic staff and delivery / collection of goods.
• The most common vehicle involved in accidents was cars, followed by light goods vehicles.
• Two-thirds of organisations claimed to have actively considered ways to reduce traffic accidents / incidents.
• Approximately two-thirds of organisations claimed to have a policy relating to safe driving procedures. Only 2% of the sample had considered it, but not actually implemented one.
• The most common reason was out of concern for their staff, followed by adhering to H&S regulations.
• The most common procedure was driver training, followed by a written policy statement and then driver assessments.
• Perceived key benefit: meeting moral duty to employees and public. The next most common advantages were in relation to insurance premiums and improved overall performance.
• The majority did not associate any particular disadvantages. The main disadvantage was that it was time-consuming.
• A third of organisations indicated that accident prevention policies produced effective results (largely measured via the number of reports, claims, and accidents occurring).
• Only 5% of those implementing such a policy reported that the procedures had not worked well.
28

4.9 IMPORTANT IMPLICATIONS FOR ROAD SAFETY POLICY AND PROCEDURE AND FOR MOTIVATING EMPLOYERS TO TAKE ACTION
Just under two thirds of organisations (64%) claimed to have a policy relating to safe driving procedures. However, when these were followed up in order to identify case studies, it appeared that organisations reported having a policy if they had a general health and safety policy, even where this did not specifically state road safety risks. Where organisations had taken some action, more commonly training, this often could not be backed up with tangible evidence of improvement, partly due to the lack of data on which to compare before and after training intervention.
In addition, a fifth of respondents (21%) could not recall the specific number of accidents encountered in the past three years. To some extent this highlights the lack of understanding of the extent of occupational road risks and the likelihood that many organisations do not have an accurate indication of the costs associated with road accidents.
The results should therefore be treated with caution. Reported procedures may not necessarily be very comprehensive, and reported benefits may be based on perception rather than objective measures of performance improvement.
The fact that procedures are time consuming was the main disadvantage identified. Clearly better awareness and guidance is required, particularly for SMEs, who were less likely to have taken action, yet almost equally as likely to have people driving as part of their job.
29

30
5. FINDINGS - CASE STUDIES
5.1 OVERVIEW
17 case studies have been developed and are presented in Appendix B. These case studies provide an account of the policy and associated procedures developed by various organisations covering a range of driving activities and vehicles. A summary of the main points from the 17 case studies is provided below.
5.2 REASONS FOR ADOPTING A SAFE DRIVING POLICY
The majority of organisations implemented a safe driving policy either as a result of wanting to reduce accident statistics / injuries / costs, vehicle damage costs and / or a desire to proactively prevent employees being exposed to the risks associated with driving. Organisations tended to recognise both a need to protect their employees, as driving is one of the most hazardous activities that they engage in, as well as an overall legal responsibility for employee and public welfare.
5.3 APPROACHES TAKEN TO REDUCE WORK-RELATED ROAD TRAFFIC ACCIDENTS
A range of activities were identified, and some of the more common ones are detailed below. Historically, organisations have tended to implement training, accident reporting, and vehicle maintenance approaches. More recently, organisations have been adopting Risk Assessments in line with good Health and Safety practice, as well as campaigns in order to raise awareness and encourage a strong safety culture.
5.3.1 Risk Assessment
There are a number of examples of risk assessment. These vary widely in nature but can be categorised as:
- Risk assessments of familiar routes.
- Risk assessments of regular driving activities.
- Driver daily risk assessments (vehicle checks and daily journey assessments).
- Annual risk assessments of journeys, vehicles and their suitability, and drivers (licences, competence, health and accident history).
5.3.2 Driver Training
Training also varies in nature from standard ‘off the shelf’ courses to tailored training matching individual skill needs. Training that is tailored to an individual’s needs is most highly regarded by drivers. Many organisations now provide defensive driver training acknowledging the fact that although many of their accidents are not caused by their own employees, something can still be done to reduce the risk by making people more aware and thus enabling drivers to be more proactive on the roads. Even when accidents are not caused by an organisation’s own drivers there is still a cost implication in terms of lost days.
5.3.3 Incident reporting and investigation
Most organisations have some form of accident reporting system in place. However, these vary in terms of the extent to which they allow measurement of performance, and it is important to
31

assess any changes in the number of vehicles and miles driven in order to accurately compare accident levels over time. John Lewis, in particular, has a very extensive accident reporting and investigation system. The organisation has trained accident investigators who visit the scene of the accident and take digital photographs of the vehicles involved. This enables claims to be settled much more quickly. All accidents are reported and managers make an assessment of the accident, which highlights the importance placed on road safety.
5.3.4 Incentive Programmes
There are a number of examples of incentive schemes, aimed at encouraging safe driving, these included:
• Driver of the year awards (Hoyer UK Limited, Permabond, Coca-Cola Enterprises, Wiseman dairies).
• Driving awards for periods of accident free driving (Wiseman dairies, John Lewis).
• RoSPA star scheme (Sainsbury’s, John Lewis).
• Health and safety hazard spotting (Transco).
5.3.5 Driver Handbook / general guidance
Most of the organisations provide a handbook or safe driving guidance, the content of which varies depending on the nature of the driving activities. Most organisations that have larger vehicles (LGV, specialist vehicles) have a separate guide for company car drivers.
5.3.6 Guidance on mobile phone use / hands free sets etc.
Whilst some include guidance on mobile phone use in their driver handbooks / guidance, some organisations have produced separate leaflets (e.g. John Lewis). Others have conducted studies of the impact of mobile phone use on driving to demonstrate the risks (Permabond).
5.3.7 Awareness campaigns
Many of the organisations host campaigns on particular hazards which help by raising awareness, introducing new procedures, or reminding drivers of the existing policy and procedures - for example winter driving tips and reversing campaigns. Scottish and Southern Energy have used two different tactics, those campaigns that ‘inform’ and those that ‘shock’ the audience. The former highlights the benefits of the procedure, whilst the latter display examples of the outcomes of unsafe driving (pictures of accidents).
5.3.8 Vehicle maintenance procedures / ergonomic checks
All organisations have vehicle maintenance procedures of some kind, many coupling regular maintenance (based on mileage or time) with driver checks of vehicles. The latter encourages the driver to be aware of the condition of the vehicle and report any problems early before they become unsafe.
When selecting company cars, some organisations set specifications. Huntsman has set minimum car requirements, with specified safety features. Sainsbury’s take this one step further and conduct ergonomic checks in order to assess the suitability of cars for each individual driver.
5.3.9 Breakdown guidance / assistance
Most of the organisations have some form of breakdown assistance. In addition organisations often provide mobile phones to allow easy access to the maintenance provider.
32

5.3.10 Alternative means of transport
Some organisations, often as part of a risk assessment or guidance for drivers, try to encourage employees to take other forms of transport or share transport where possible.
5.3.11 Journey scheduling
There are varying methods of journey scheduling among the organisations investigated. These include:
• Provision of support to allow better planning of journeys e.g. access to route planning software or support staff who provide such a service.
• Risk assessments of routing journeys, and subsequent changes to routes to reduce the risks. Scottish and Southern Energy plan their routes to avoid turning right across dual carriageways as, although not the fault of their own drivers, accidents have been caused by other drivers overtaking whilst they are turning right across a road. Similarly, Highlands Council avoid reversing whenever possible by centrally planning their regular routes.
• Guidance on route planning to avoid towns during rush hour and at school starting and finishing times.
5.4 HOW THESE SYSTEMS ARE DEVELOPED AND MANAGED
Driving Safety policies and procedures / initiatives were mostly managed and developed by those people working in the Health and Safety Departments of the organisations, often in liaison with either the Fleet Manager or the Risk and Insurance Manager. Alternatively, some organisations’ safe driving initiatives were managed and developed by their Driver Training Manager, yet still liasing with Health and Safety on some level.
5.5 IMPACT ON WORK-RELATED ROAD TRAFFIC INCIDENTS
A substantial proportion of the organisations reported a reduction in accident statistics and the vehicle damage costs associated since implementing the safe driving procedures. More specifically, one organisation observed a 30% reduction in costs associated with vehicle damage, over a 5 year period, whilst other organisations have had no accidents in the past twelve months and reductions in accidents are still improving. Furthermore, these reductions have been observed in spite of an increase in the number of vehicles run, and the number of miles driven by the organisations. Organisations have also observed a reduction in sickness absence / time lost as a result of work-related driving injuries.
A proportion of organisations studied have implemented their policies proactively, rather than as a result of a high number of accidents, and so there are few tangible benefits to observe. Others have reported that it is still too early to observe any measurable improvements which, in some ways, may be difficult to quantify, especially when the initiative has been implemented proactively.
5.6 OTHER BENEFITS OF THE POLICY AND PRACTICE
Further, perhaps less tangible, benefits have repeatedly been observed in the areas of increased awareness of the risks associated with driving, improved morale, and value and respect felt by the employees. The initiatives have also improved employee attitudes, employee and public protection, and improved organisational image.
Where organisations have involved the whole organisation, albeit non-drivers to a lesser extent than company drivers, and, where employees have been involved in developing and auditing procedures, the safe driving policies have added to a positive safety culture. These organisations
33
have tended to experience a “knock on” effect to personal driving, whereby employees’ safer driving practices become part of their personal driving too.
5.7 LESSONS LEARNED IN DEVELOPING THESE PROCEDURES
The lessons learned by organisations have generally been concerned with:
5.7.1 Senior management commitment and employee involvement
• A need for Senior Management support and commitment to the process.
• Gaining commitment from the employees by raising awareness rather than imposing the initiatives as ‘rules’.
• Actively consulting and involving employees in the development of the procedures, to improve acceptance and awareness of the procedures.
• Management training may also be important, in order to encourage staff compliance with the safe driving practices.
5.7.2 The importance of establishing performance indicators and benchmarking
• Safety is an intangible area, meaning that cost can become a barrier – one needs to therefore raise awareness, understand the legal responsibility, and gain management support and participation.
• A quantification of performance measures, such as recording the number of miles driven and accidents per year, would be helpful in encouraging further support for safe driving initiatives – so that people can immediately recognise the more tangible benefits.
• Consulting current guidance and publications in the area and looking at what other organisations have implemented, sharing and discussing ideas, and then tailoring the procedure to each particular organisation.
• Improvements always need to be made, so there is a need to strive for continual improvement to maintain the positive safety culture.
5.7.3 Scope of health and safety hazards
• The implementation of driver training, for example, can be very emotive as everyone thinks that they are a good driver. It is therefore essential that people perceive driving as work, like any other task, improving the culture in relation to this, through increased awareness and communication.
34

6. GENERAL DISCUSSION AND CONCLUSIONS
The findings of this study have significant implications for how organisations implement an Occupational Road Safety Policy and associated procedures. A model of good practice road safety risk management is presented in order to assist in the motivation of employers and to provide guidance on action required. The case studies demonstrate how organisations, both large and small, and with different types of driving activities and vehicles can implement effective procedures. The model and the case studies should be equally useful for SMEs and large organisations, both of whom report that the main barrier to taking action is the time taken to develop and implement procedures.
6.1 MODEL OF GOOD PRACTICE
Figure 6.1 on page 43 details a model of occupational road safety risk management drawing on the positive aspects of the case studies and findings from the literature review and telephone survey. The model is described below.
6.1.1 Success factors
Safety culture is the set of assumptions, and their associated practices, which permit beliefs about danger and safety to be constructed. Pidgeon (1999) argued that good safety culture might be promoted by four facets, as follows:
• Senior management commitment to safety
• Shared care and concern for hazards and a solicitude over their impact upon people.
• Realistic and feasible norms and rules about hazards.
• Continual reflection upon practices through monitoring, analysis and feedback systems.
The results of this study highlight very clearly the importance of all four facets in establishing effective practices. Senior management commitment, in line with previous health and safety research, is highlighted as being of particular importance.
In terms of the shared concern for hazards, those organisations that have attempted to address employees’ and managers’ attitudes to risk have been the most successful in reducing incidents and shaping behaviour. The literature review highlighted that attitudes to risk vary widely between individuals, and the challenge for organisations is to shape the behaviour of those, with extreme attitudes, through increased awareness and involvement in the risk management process. This not only contributes to the changing of attitudes but also to the likelihood of realistic and feasible norms being developed. Those organisations that have targeted all employees, regardless of whether they drive for company business, have seen a greater impact in overall attitudes to road safety, even where the extent of involvement of non-company drivers has been small compared with company drivers.
One in five organisations in the telephone survey were unaware of the number of accidents experienced in the last 3 years. It was apparent from the case studies that the more advanced and effective systems are those with accurate data collection and analysis followed up by appropriate action to ensure continuous improvement.
6.1.2 Barriers
The most commonly reported barrier to taking action was the time requirement (telephone survey) for implementing procedures. A number of organisations involved in the case studies
35

reported employee attitudes to road safety as a barrier. It was reported that, due to the fact that employees drive outside work and that it is usually a skill brought to a job, employees are reluctant to recognise the risks and often perceive that they act more safely than they do. In addition, managers are reluctant to feed back and take action when employees drive inappropriately.
Improved guidance for employers may assist in demonstrating the benefits of time spent assessing and reducing the risks and generating accurate records. In addition, whilst it is acknowledged that changing attitudes is one of the more difficult aspects of health and safety management, the case studies provided in this report highlight how this can be achieved and the benefits of doing so. The following case studies are particularly helpful in this regard: Scottish and Southern, Huntsman, BNFL, Wiseman Dairies, and John Lewis.
6.1.3 Risk assessment
In the first instance, when conducting an assessment on which to base the risk management procedures, this assessment should cover a review of:
• Types of vehicles
• Types of journeys
• Purpose of journeys
• Nature of drivers
• Review of accident history
Whilst few organisations in the telephone survey had conducted specific risk assessments, a number of the case studies demonstrate how this can be achieved. These vary widely in nature but can be categorised as:
• Risk assessments of familiar routes e.g. Hoyer UK Ltd., Scottish and Southern Energy.
• Risk assessments of regular driving activities e.g. Highlands Council, Ault Brothers.
• Driver daily risk assessments (vehicle checks and daily journey assessments) e.g. Highlands Council, Wiseman Dairies, John Lewis).
• Annual risk assessments of journeys, vehicles and their suitability, and drivers (licences, competence, health and accident history) e.g. Sainsbury’s, Transco.
In line with best practice, those risk assessments that involved employees in the assessment of risk were thought to be most appropriate and lead to more effective controls.
6.1.4 Policy development
The nature of policies varied from a statement of the organisation’s philosophy to detailed descriptions of the procedures and how these should be implemented. Generally a working document, concisely detailing the procedures and responsibilities, is more often referred to by employees. Many of the case study organisations went to great lengths to ensure that this document was user friendly and could be easily transported and remain in good condition when carried by the driver. John Lewis and Wiseman Dairies have particularly good examples. Other organisations placed the policy on the Intranet for easy access by all employees. The case studies highlight examples of issues covered in road safety policies, varying widely depending on the vehicles and driving activities undertaken.
36
6.1.5 Nature of control measures
All interventions should be based on a risk assessment. There is a range of examples of risk assessments in the case studies and summarised in Sections 5.3 and 6.1.3 above. Generally it was reported in the telephone survey that training is the most widely used intervention and suggests that organisations are providing blanket training to all drivers. This decision should, however, be based on a risk assessment identifying training needs. The literature review pointed out that individual differences may dictate a need for targeted interventions such as training in line with individual profiles, skill or demographics. This is supported by some organisations in the case studies, where individual training needs are identified through individual driver assessments.
The literature review highlighted the scope for recruitment of safer drivers based on personality profiles, risk perception, experience, age, and medical screening. Only one of the case studies showed comprehensive evidence of this (Hoyer UK Ltd.).
6.1.6 Audit
In order to audit the effectiveness of procedures it is necessary to establish performance indicators. This requires appropriate records of accidents and incidents. Some case study organisations also recorded near misses in order to take proactive action in response to potential causes of accidents. Other performance measures may include:
• A review of driver awareness
• Driver assessments
• Evaluation forms of procedure or training effectiveness
6.1.7 Review
In addition to a regular review of the accident statistics and evaluations of specific procedures, it is necessary to review the policy and risk assessment procedures.
37
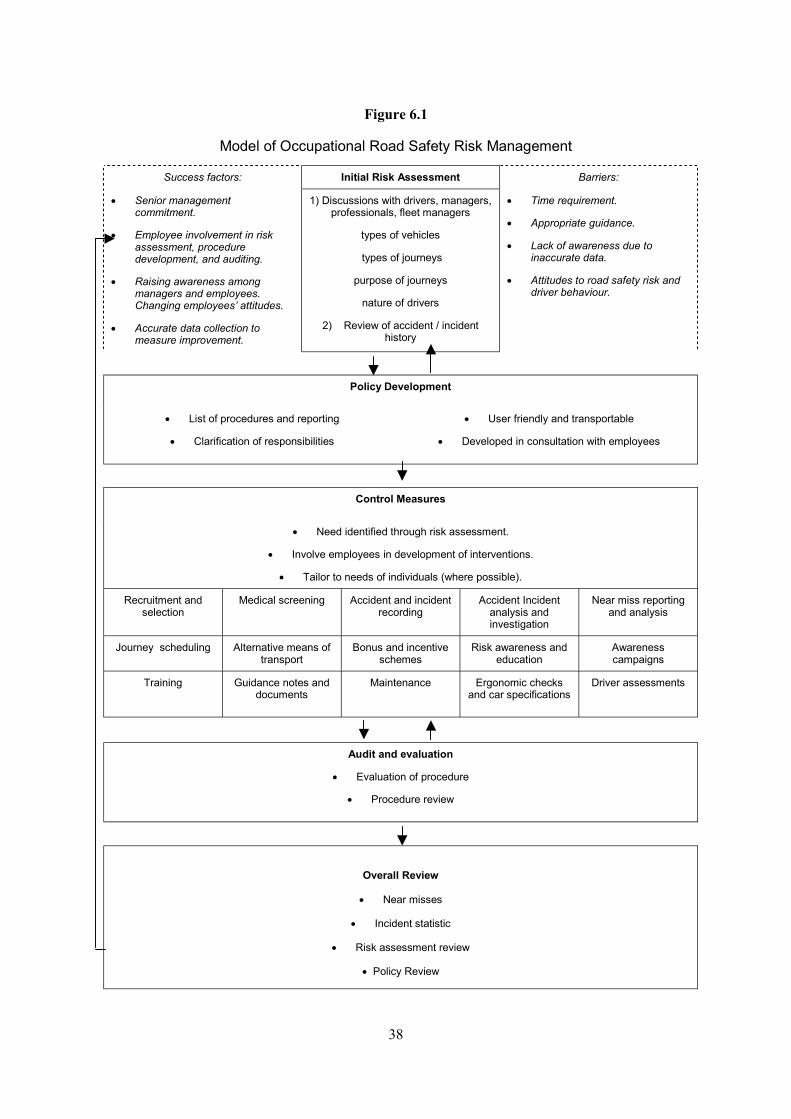
Figure 6.1
Model of Occupational Road Safety Risk Management
·
· l i
ing.
· i
i
· ll
·
· i i
· ifi
· i i ions.
· Tail i
l i ident i ident i
i igation
Near mi ing is
ing Al i i iion
i iifi i
i
Success factors:
Senior management commitment.
Employee invo vement n risk assessment, procedure development, and audit
Rais ng awareness among managers and employees. Changing employees’ att tudes.
Accurate data co ection to measure improvement.
List of procedures and report
Clarif cat on of respons
Control Measures
Need ident ed through risk assessment.
Involve employees n development of ntervent
or to needs of ndividuals (where possible).
Recruitment and selection
Medica screening Acc dent and increcording
Acc dent Incanalys s and nvest
ss reportand analys
Journey schedul ternat ve means of transport
Bonus and ncent ve schemes
Risk awareness and educat
Awareness campaigns
Training Guidance notes and documents
Ma ntenance Ergonom c checks and car spec cat ons
Dr ver assessments
Initial Risk Assessment
1) Discussions with drivers, managers, professionals, fleet managers
types of vehicles
types of journeys
purpose of journeys
nature of drivers
2) Review of accident / incident history
Barriers:
· Time requirement.
· Appropriate guidance.
· Lack of awareness due to inaccurate data.
· Attitudes to road safety risk and driver behaviour.
Policy Development
ing · User friendly and transportable
ibilities · Developed in consultation with employees
Audit and evaluation
· Evaluation of procedure
· Procedure review
Overall Review
· Near misses
· Incident statistic
· Risk assessment review
· Policy Review
38

7. REFERENCES
Adams-Guppy J.R., & Guppy A. (1995). Speeding in relation to perceptions of risk, utility and driving style by British Company Car drivers. Ergonomics 38 - 2525 – 2535.
Chapman P., Roberts K., & Underwood G. (2001). A study of the accidents and behaviours of company car drivers. Behavioural Research in Road Safety Tenth Seminar DETR.
Gregerson N.P., Brehmer B., & Moren B. (1996). Road safety improvement in large companies. An experimental comparison of different measures accident analysis and prevention. 28 297 – 306.
Lynn P. & Lockwood C.R. (1998). The accident liability of company car drivers. TRL Report 317 Transport Research laboratory, Crawthorne.
Pidgeon N. (2000). Safety Culture: Transferring theory and evidence from the major hazards and industries behavioural research in road safety: Tenth Seminar. DETR.
Stradling S.G., Meadows M.L., & Beatty S. (2001). Driving as part of your work may damage your health. DETR Behavioural researches in road safety. Tenth Seminar.
Ward, R. L., & Lancaster, R.J. (2001). The contribution of individual factors to driving behaviour: implications for managing work-related road safety. HSE Contract Research Report: HSE Books.
39

Appendices
40