Embed Size (px)
Citation preview
research papers
768 HovmoÈ ller et al. � Conformations of amino acids in proteins Acta Cryst. (2002). D58, 768±776
Acta Crystallographica Section D
BiologicalCrystallography
ISSN 0907-4449
Conformations of amino acids in proteins
Sven HovmoÈller,* Tuping Zhou
and Tomas Ohlson
Structural Chemistry, Arrhenius Laboratory,
Stockholm University, SE-106 91 Stockholm,
Sweden
Correspondence e-mail: [email protected]
# 2002 International Union of Crystallography
Printed in Denmark ± all rights reserved
The main-chain conformations of 237 384 amino acids in 1042
protein subunits from the PDB were analyzed with Rama-
chandran plots. The populated areas of the empirical
Ramachandran plot differed markedly from the classical plot
in all regions. All amino acids in �-helices are found within a
very narrow range of ', angles. As many as 40% of all amino
acids are found in this most populated region, covering only
2% of the Ramachandran plot. The �-sheet region is clearly
subdivided into two distinct regions. These do not arise from
the parallel and antiparallel �-strands, which have quite
similar conformations. One � region is mainly from amino
acids in random coil. The third and smallest populated area of
the Ramachandran plot, often denoted left-handed �-helix,
has a different position than that originally suggested by
Ramachandran. Each of the 20 amino acids has its own very
characteristic Ramachandran plot. Most of the glycines have
conformations that were considered to be less favoured. These
results may be useful for checking secondary-structure
assignments in the PDB and for predicting protein folding.
Received 10 July 2001
Accepted 10 February 2002
1. Introduction
The description of conformations of amino acids in peptides
and proteins by two torsion angles, ' and , was proposed by
Ramachandran & Sasisekharan (1968). The diagram of the
two torsion angles, now known as the Ramachandran plot
(Fig. 1), was ®rst used to predict the possible conformations of
the main chain. The Ramachandran plot was constructed just
before the ®rst protein structure had been determined to
atomic resolution by X-ray diffraction. Based entirely on
model building of short peptides, taking steric hindrance into
account especially, Ramachandran predicted with a remark-
able precision the conformations that could occur in proteins.
As protein structures became known, it was veri®ed experi-
mentally that Ramachandran had correctly predicted the
number of allowed areas and also the approximate numerical
values of the ', torsion angles. Today, the Ramachandran
plot is not only a basic diagram in textbooks on protein
structures, but also a useful tool for assessing the correctness
of a protein structure determination (Laskowski et al., 1993;
Morris et al., 1992). In the ®rst protein structures, determined
to low resolution and without re®nement, the ', values were
rather widely scattered throughout the Ramachandran plot.
However, with the advent of re®ned high-resolution struc-
tures, the conformation of amino acids clustered more and
more near the allowed areas as predicted by Ramachandran.
Today, more than 30 years after the introduction of the

Ramachandran plot, the quantity and quality of protein
structures accurately determined by X-ray crystallography is
such that it is possible to ®nally verify and slightly modify the
exact shapes and positions of the allowed regions in the
Ramachandran plot. That is the subject of this study.
2. Methods
We selected a non-redundant set of 1042 protein subunits from
the PDB of 3 January 2002. The structures were all determined
by X-ray diffraction to a resolution of 2.0 AÊ or higher, re®ned
to R � 0.20 and had less than 30% sequence homology
(Dunbrack, 2001). The ®rst and last amino acids will not
provide ' and torsion angles. For 9940 amino acids (mainly
at the beginning or end of the sequences) there were no
coordinates given in the PDB. We also removed 9669 amino
acids with temperature factor B > 40 AÊ 2. This left us with
237 384 amino acids for which we could calculate torsion
angles.
The amino acids were divided into three main groups
according to their secondary structure as speci®ed by DSSP
(Kabsch & Sander, 2001). There were 88 874 in HELIX
(�-helix and 310-helix) and 52 068 in SHEET (Table 1). The
remaining 96 442 amino acids for which atomic coordinates
were given in the PDB but were not speci®ed as HELIX or
SHEET by DSSP are called Random coil in this investigation,
although this group of course includes turns and other well
de®ned structures. Ramachandran plots for each of the 20
amino acids were made for HELIX, SHEET, Random coil and
All, where All includes all the different secondary structures.
The Ramachandran plot was split into four regions for
detailed analysis of the conformations. Amino acids with
torsion angles in the rangeÿ180 < ' < 0�,ÿ100 < < 45� were
considered to be in the �-helical region. Amino acids with
torsion angles in the range ÿ180 < ' < ÿ45�, 45 < < 225�
were considered to be in the �-sheet region. The area
0 < ' < 180�, ÿ90 < < 90� is here called the turn region. The
remaining area of the Ramachandran plot represents 36% of
the area but contained only 1.9% of the amino acids and was
not studied further. The bridging region between �-helical and
�-sheet conformation is often given as ÿ135 < ' < ÿ45�,ÿ25 < < 15�, but we found that this region should really be
considered �-helical and the bordering region should be
moved upwards to ÿ160 < ' < ÿ65�, 45 < < 90�.Amino acids in SHEET were subdivided into six groups
according to their contacts with adjacent strands (Fig. 2).
These were (i) parallel with one partner, (ii) antiparallel with
one partner, (iii) parallel with two partners, (iv) antiparallel
with two partners, (v) parallel with one and antiparallel with
another partner and (vi) amino acids without partner.
The amino acids in HELIX were subdivided in several ways.
There were 1907 three-residue-long helices and 1023 four-
residue-long helices and these were treated separately. For the
other �-helices, we looked speci®cally at the ®rst and last
amino acids. In order to ®nd the ideal �-helical conformation,
all but the ®rst two and last two amino acids in helices � 5
amino acids long were pooled.
Amino acids in Random coil were ®rst subdivided into the
four areas of the Ramachandran plot: �-helical, �-sheets, turns
and others. Within each of these areas, the stretches of random
Acta Cryst. (2002). D58, 768±776 HovmoÈ ller et al. � Conformations of amino acids in proteins 769
research papers
Figure 1The classical version of the Ramachandran plot for (a) alanine (but oftentaken as typical for all non-glycines) and (b) glycine according toRamachandran & Sasisekharan (1968). The fully allowed regions areshaded; the partially allowed regions are enclosed by a solid line. Theconnecting regions enclosed by the dashed lines are permissible withslight ¯exibility of bond angles. These plots were arrived at by computermodelling. Although some overall features of these plots are correct, thedetails differ from the experimentally observed Ramachandran plots foralanine (see Fig. 5) and (c) all 19 non-glycines and (d) glycine. The mostremarkable differences are that most regions show a 45� slope rather thanbeing parallel to any of the axes, the �-sheet region is split into twodistinct maxima and the two most populated regions for glycine seen in(d) were predicted to be only just permissible as shown in (b). There are®ve areas in the glycine plot; two with ' 0� and three with ' 180�.[(a) and (b) Reproduced from Creighton (1996) with permission.]
Figure 2The de®nitions of six types of �-strands.

research papers
770 HovmoÈ ller et al. � Conformations of amino acids in proteins Acta Cryst. (2002). D58, 768±776
coil were sorted according to their lengths. Long stretches of
amino acids in Random coil all in �-helical or all in �-sheet
conformation were checked one by one. The longest stretches
of amino acids all in our generously de®ned �-helical region
but not de®ned as �-helical by DSSP were ®ve or six. When we
made a similar search using the secondary-structure assign-
ment in the PDB, we found many �-helices longer than 20
residues. There were many single strands, i.e. long stretches of
amino acids all in the �-sheet area but not assigned as SHEET
by DSSP or PDB.
The Ramachandran plots were produced in the following
way. Firstly, all amino acids used were sorted into 90 � 90
squares, each covering an area of 4� 4�. The number of amino
acids in each such square was summed. The squares were
sorted from the highest abundances to the lowest. Each square
was colour-coded such that each colour represented 10% of all
amino acids (Fig. 3). In order to make the plots easier to
interpret, they were smoothed. The effect of smoothening can
be appreciated by comparing the plot before and after
smoothing, as shown for one of the most complex cases, Asp in
Random coil (Fig. 4).
3. Results
As expected, most of the amino acids (99%) speci®ed as
HELIX by DSSP were found in the �-helical region of the
Ramachandran plot. Similarly, 95% of all amino acids speci-
®ed as SHEET by DSSP were found in the �-sheet region.
Those amino acids that were found in unexpected areas were
often the ®rst or last amino acid in a strand or in an �-helix;
many were glycines.
The Ramachandran plots of glycine and the other 19 non-
glycine amino acids show several interesting deviations from
the classical Ramachandran plot (see Fig. 1). There are two
distinct maxima in the �-sheet region, as has already been
pointed out by Kleywegt & Jones (1996). Here, we will analyze
the features of the different regions in the Ramachandran plot
in greater detail.
Each of the 20 amino acids has its characteristic Rama-
chandran plot (Fig. 5). Perhaps the most remarkable of these
is Gly, which differs very much from the classical Rama-
chandran plot: the two dominating areas are in regions
thought to be only just possible. There are also many glycines
around ' = = �180�, an area thought to be disallowed. All
amino acids except Gly and Pro have the highest density of
points in the �-helical area. Most amino acids have two
distinct distributions in the �-sheet region. The only excep-
tions are Ile, Pro and Val. Val and Ile have nearly identical
distributions and are also similar in their unique property of
preferring �-sheets to �-helix. The three large hydrophilic
amino acids Phe, Tyr and Trp have quite similar distributions.
Phe and especially Tyr also show two distinct maxima in the
�-helical region. Asn and Asp have quite similar Ramachan-
dran plots, but differ from all other amino acids in having a
very complicated � region and the next highest frequency of
amino acids in the turn region after Gly. They are also more
frequently found in the bridging region between �-helix and
�-sheet than any of the other amino acids.
When the amino acids were split into the three groups of
secondary structure, HELIX, SHEET and Random coil, more
details appeared (Figs. 6, 7, 8 and 9). As expected, only very
few amino acids considered to be parts of �-sheets had
conformations in the �-helical region and vice versa (see
Table 1). Most of those amino acids were found at the ends of
strands or helices and may be considered either as highly
distorted or sometimes simply incorrectly assigned by DSSP.
3.1. The effects of resolution and temperature factors
When the subunits were sorted into different resolution
ranges, the results were similar. The only effect of increased
resolution was that the distributions of '/ angles sharpened,
just as observed by Walther & Cohen (1999). We also analysed
the effect of deleting all amino acids with high temperature
factors (B > 40 AÊ 2). As expected, the hydrophilic amino acids,
which are more often found at the protein surfaces, are
somewhat over-represented among those with B > 40 AÊ 2. The
Table 1The amino acids sorted into secondary structure as speci®ed by DSSP andaccording to their torsion angles.
HELIX(DSSP)
SHEET(DSSP)
Random coil(DSSP) Sum
�-Helical 88155 1556 30745 120456�-Sheets 143 49370 51813 101326Turns 283 267 10537 11087Others 293 875 3347 4515Sum 88874 52068 96442 237384
Figure 3The colour table used throughout this paper. The area in each colourcontains 10% of all the amino acids in the respective plot. The dark redcolour marks the most densely occupied regions of the Ramachandranplot. The most sparsely populated region in white typically covers 80±90% of the total area, but contains only 10% of all amino acids.
Figure 4The effect of smoothing is demonstrated here for one of the most intricateRamachandran plots: Asp in Random coil. (a) Before smoothing, (b)after smoothing.

average temperature factor for all amino acids was 18.4 AÊ 2
(17.0 AÊ 2 for those with B � 40 AÊ 2). About 4% of all amino
acids had B values > 40 AÊ 2. The average B values were
calculated as the average B of the four atoms (C, C�, O and N)
which are used for calculating the '/ torsion angles.
3.2. The a-helical region
For every one of the 20 amino acids the experimentally
observed ', torsion angles in the �-helical region are
distributed along a line parallel to ' = ÿ (Figs. 1c and 5), as
already pointed out by Garnier & Robson (1990). This does
not agree with the areas de®ned as fully and partially allowed
by Ramachandran & Sasisekharan (1968). They predicted that
there should be a large range of free rotation about the 'torsion angle (ÿ160 toÿ50�), while the rotation around was
expected to be very limited (ÿ60 to ÿ40�). It is clear from the
experimentally determined protein structures that the allowed
rotations about ' and are equally large and that these
Acta Cryst. (2002). D58, 768±776 HovmoÈ ller et al. � Conformations of amino acids in proteins 771
research papers
rotations are coupled. Thus, if ' is rotated by, for example,
+30�, then is also rotated by ÿ30�. This coupling of the two
torsion angles ' and arises from interactions between the
carbonyl O atom in amino acid n with both the carbonyl O
atom in amino acid n + 1 and the backbone N atom in amino
acid n + 2. These OÐO and OÐN distances are always kept
close to 3.5 AÊ .
When ®ve or more consecutive amino acids have torsion
angles in the �-helical region of the Ramachandran plot, the
hydrogen bonds typical of the �-helix will form and the
structure will snap into a very highly populated and ®nely
focused area near ' =ÿ63.8, =ÿ41.1� (see Fig. 6e). As many
as 39% of all 237 384 amino acids were found here, in an area
just 2% of the Ramachandran plot (ÿ89 < ' < ÿ39�,ÿ66 < < ÿ16�). The data points that form the elongated
distribution parallel to ' = ÿ come from amino acids in
Random coil (Fig. 9), from three-residue- and four-residue-
long helices and from the last amino acid in �-helices (Figs. 6a,
6b and 6d).
The conformations of each of the 20 amino acids inside
�-helices of length at least ®ve (i.e. skipping the ®rst and last
two amino acids in each �-helix) were investigated. All 20
amino acids have torsion angles within �2� of the average
value ' = ÿ63.8, = ÿ41.1�, except Pro and Gly which are
outliers by a few degrees (Pro ÿ61.0/ÿ36.5�, Gly ÿ59.1/
ÿ42.4�). The differences in average torsion angles between
Figure 5Individual Ramachandran plots for each of the 20 amino acids (All includes all 20 amino acids). Notice that most amino acids have two distinct maximain the �-sheet region (upper left quadrant). Asp and Asn have the most complicated plots after Gly. This re¯ects their role in terminating �-helices and �-sheets. The two amino acids with highest preference for �-sheets, Ile and Val, have very similar Ramachandran plots. The plots of the three largehydrophobic amino acids Phe, Tyr and Trp look alike.
research papers
772 HovmoÈ ller et al. � Conformations of amino acids in proteins Acta Cryst. (2002). D58, 768±776
amino acids in �-helices are much less than one standard
deviation of any individual amino acid (5±15�).
3.2.1. Amino acids in Random coil with a-helical confor-mations. Nearly one third of all amino acids in Random coil
have torsion angles in the �-helical region (Table 1). However,
the distribution of these torsion angles is strikingly different
from that of amino acids in �-helices. While the torsion angles
inside �-helices are highly focused near the point ' = ÿ63.8,
= ÿ41.1�, the amino acids in Random coil have torsion
angles along a line stretching from ' = ÿ50, = ÿ40� to
' = ÿ120, = +30� (Fig. 9).
3.3. The b-sheet region
The upper left corner of the Ramachandran plot contains
amino acids in the �-sheet conformation (Table 1). The
distribution of points continues above = +180�, so we
included all data in the ranges ÿ180 < ' < ÿ45�, +45 < <
+225� in our investigations of the �-sheet conformations.
When all 19 non-glycine amino acids are pooled (Fig. 1c), the
� area is split into two distinct regions. The widest and most
populated region is elongated with a centre at ' = ÿ121,
= +128�, while the other region is nearly circular around
' = ÿ66, = +137�. However, each individual amino acid has
its special variation on this common theme, as can be seen in
Figs. 5, 8 and 9.
3.3.1. Single strands. Nearly 43% of all amino acids have �conformation. More than half of these (51%) are not parts of
strands in �-sheets but occur in Random coil. In comparison
with the �-helices, the situation is more complex for �-sheets.
If ®ve or more consecutive amino acids have �-helical
conformation, they form an �-helix. In contrast, some long
stretches of ten or more consecutive amino acids with �conformation are not called SHEET in the PDB or by DSSP
because they do not have at least one parallel or antiparallel
strand as a partner to which they are connected through
hydrogen bonds. It is a commonly accepted dogma that `the �-
strand conformation is stable only when incorporated into a �-
sheet'. However, we have found hundreds of single strands
with four or more consecutive amino acids all with � confor-
mation, yet not denoted SHEET either in the PDB ®le or by
DSSP. Many of these are indeed single �-strands. The longest
single �-strand we found was in 1bfd, amino acids 334±350.
3.3.2. Parallel and antiparallel b-strands. The two types of
�-sheet, parallel and antiparallel, have quite different
hydrogen-bond connections. It has been generally believed
that the conformations of the amino acids in these two types of
�-sheet should be quite different. In order to analyze the
distributions of torsion angles for amino acids in �-sheets, we
sorted them into six categories. As is evident from Fig. 2, it is
not suf®cient to use only the two groups parallel and anti-
parallel; many �-strands have one parallel and one antiparallel
strand and those �-strands that are at the outside of a �-sheet,
i.e. have only one partner, do not necessarily have the same
conformations as those inside a �-sheet. Finally, there were
quite a number of amino acids denoted SHEET in the PDB
and/or DSSP even though they were not speci®ed as being
connected by a hydrogen bond to another strand. These were
usually (but not always) the ®rst or last amino acids in
correctly denoted �-strands and constitute the sixth and last
group in our studies of �-sheets.
The conformations of the amino acids in ®ve of the six
groups were surprisingly similar (Fig. 7) with respect to both
the average ' and values (all within ÿ130 < ' < ÿ105�,
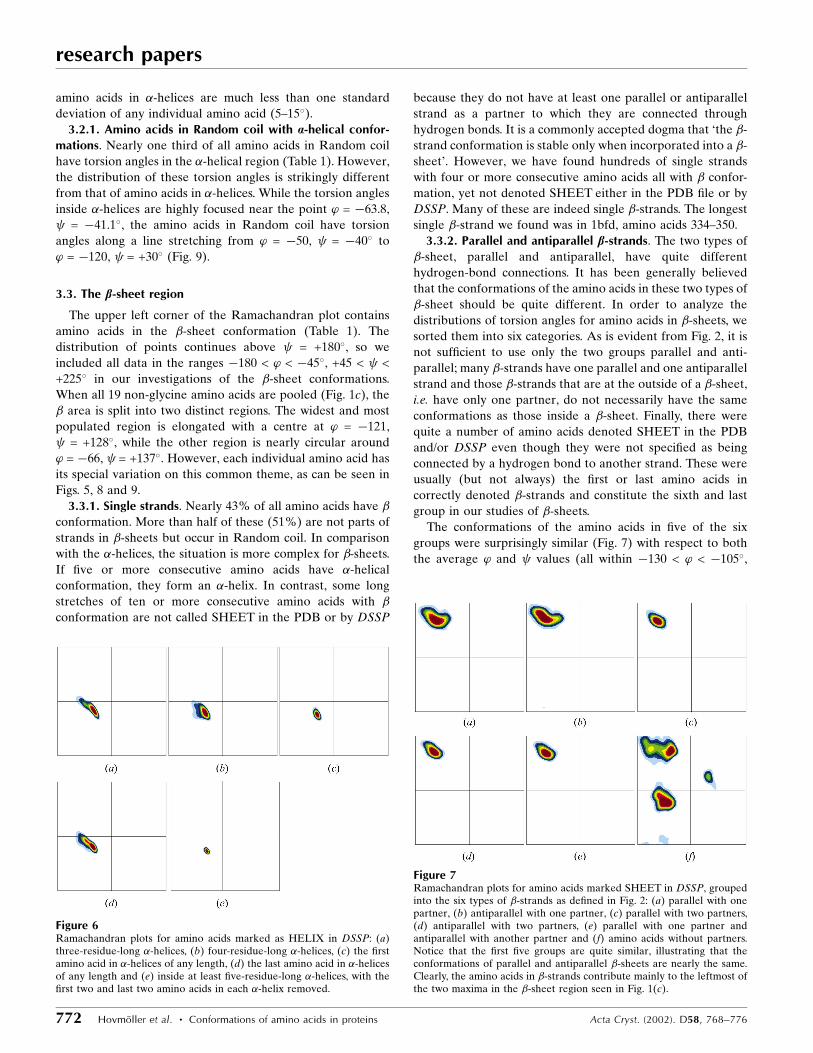
Figure 6Ramachandran plots for amino acids marked as HELIX in DSSP: (a)three-residue-long �-helices, (b) four-residue-long �-helices, (c) the ®rstamino acid in �-helices of any length, (d) the last amino acid in �-helicesof any length and (e) inside at least ®ve-residue-long �-helices, with the®rst two and last two amino acids in each �-helix removed.
Figure 7Ramachandran plots for amino acids marked SHEET in DSSP, groupedinto the six types of �-strands as de®ned in Fig. 2: (a) parallel with onepartner, (b) antiparallel with one partner, (c) parallel with two partners,(d) antiparallel with two partners, (e) parallel with one partner andantiparallel with another partner and (f) amino acids without partners.Notice that the ®rst ®ve groups are quite similar, illustrating that theconformations of parallel and antiparallel �-sheets are nearly the same.Clearly, the amino acids in �-strands contribute mainly to the leftmost ofthe two maxima in the �-sheet region seen in Fig. 1(c).

128 < < 147�) for the ®rst ®ve groups and the standard
deviations (15±26�). Most of the amino acids were found in the
upper left corner of the � region. Especially remarkable was
that the differences between the parallel and antiparallel
�-strands were much less than expected (Figs. 7c and 7d). The
average torsion angles for the 18 amino acids excluding Pro
and Gly were ' = ÿ122, = +136� for antiparallel and
' = ÿ116, = +128� for parallel �-sheets. Typical values for
torsion angles given in the literature are ' = ÿ139, = +135�
for antiparallel and ' = ÿ119, = +113� for parallel �-sheets.
Thus, the ' angles differ only by about 6� compared with the
expected 20� and the angles differ by 8� rather than the
expected 22�. Those internal strands that have one parallel
and one antiparallel partner (Fig. 7e) are very similar to the
�-strands with two similar partners (Figs. 7c and 7d). Strands
with only one partner (Figs. 7a and 7b) are similar to strands
with two similar partners (Figs. 7c and 7d) but are more spread
along ' and . The standard deviations are ' = 25, = 20� for
Acta Cryst. (2002). D58, 768±776 HovmoÈ ller et al. � Conformations of amino acids in proteins 773
research papers
strands with one partner and ' = 17, = 15� for strands with
two partners.
Finally, those strands that do not have a partner although
they are denoted SHEET by DSSP are distributed over all
three main areas of the Ramachandran plot (Fig. 7f). For all
groups, the upper right corner of the � region (' > ÿ90,
> 135�) has a very high proportion of prolines: 20% for all
six groups taken together.
The amino acids in the strands were also split into three
groups depending on where they occurred in the strands; ®rst,
last or inside. These groups did not differ very much. On
average, the ®rst amino acids in SHEET have 4� larger angles than those inside the �-strands and at the ends. In most
cases, the torsion angles differ only by a degree or two for
averages calculated using all amino acids in the strands or
excluding the ®rst and last amino acid in each strand.
Furthermore, when we looked at each of the 20 amino acids
separately, the trends mentioned above were the same. All
amino acids except Pro have on average more negative 'angles and more positive angles for antiparallel than for
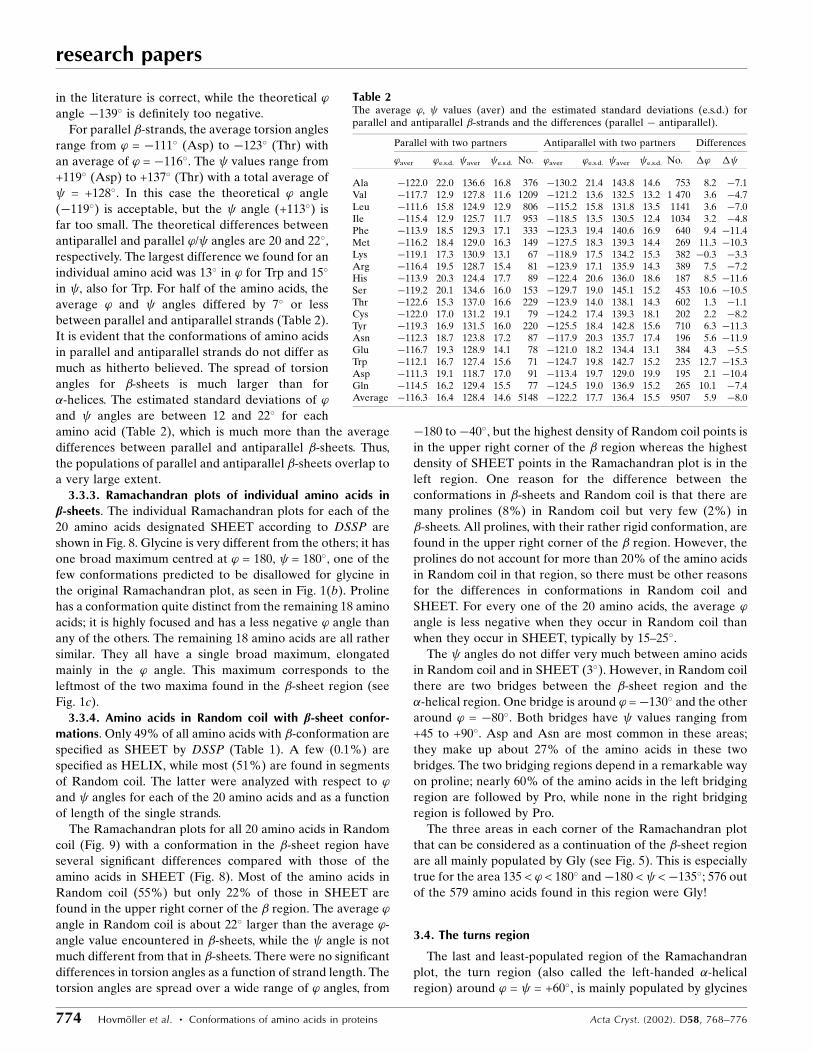
parallel �-strands (Table 2). The ' and angles of Thr are
equal to within a degree in parallel and antiparallel strands. As
expected, Pro and Gly are outliers. All the other 18 amino
acids have average angles for antiparallel ranging from
+129� (Asp) to +145� (Ser), with an average of = +136�. The
' values range from ÿ113� (Asp) to ÿ130� (Ala), with an
average of ' = ÿ122�. It is clear that the value +135� found
Figure 8Individual Ramachandran plots for each of the 20 amino acids in SHEET according to DSSP (All includes all 20 amino acids). Glycine has its maximumcentred at ' = 180, = 180�, one of the few conformations predicted to be disallowed in the original Ramachandran plot, as seen in Fig. 1(b). Proline hasa conformation quite distinct from the remaining 18 amino acids, which otherwise only display minor differences between themselves.
research papers
774 HovmoÈ ller et al. � Conformations of amino acids in proteins Acta Cryst. (2002). D58, 768±776
in the literature is correct, while the theoretical 'angle ÿ139� is de®nitely too negative.
For parallel �-strands, the average torsion angles
range from ' = ÿ111� (Asp) to ÿ123� (Thr) with
an average of ' = ÿ116�. The values range from
+119� (Asp) to +137� (Thr) with a total average of
= +128�. In this case the theoretical ' angle
(ÿ119�) is acceptable, but the angle (+113�) is
far too small. The theoretical differences between
antiparallel and parallel '/ angles are 20 and 22�,respectively. The largest difference we found for an
individual amino acid was 13� in ' for Trp and 15�
in , also for Trp. For half of the amino acids, the
average ' and angles differed by 7� or less
between parallel and antiparallel strands (Table 2).
It is evident that the conformations of amino acids
in parallel and antiparallel strands do not differ as
much as hitherto believed. The spread of torsion
angles for �-sheets is much larger than for
�-helices. The estimated standard deviations of 'and angles are between 12 and 22� for each
amino acid (Table 2), which is much more than the average
differences between parallel and antiparallel �-sheets. Thus,
the populations of parallel and antiparallel �-sheets overlap to
a very large extent.
3.3.3. Ramachandran plots of individual amino acids inb-sheets. The individual Ramachandran plots for each of the
20 amino acids designated SHEET according to DSSP are
shown in Fig. 8. Glycine is very different from the others; it has
one broad maximum centred at ' = 180, = 180�, one of the
few conformations predicted to be disallowed for glycine in
the original Ramachandran plot, as seen in Fig. 1(b). Proline
has a conformation quite distinct from the remaining 18 amino
acids; it is highly focused and has a less negative ' angle than
any of the others. The remaining 18 amino acids are all rather
similar. They all have a single broad maximum, elongated
mainly in the ' angle. This maximum corresponds to the
leftmost of the two maxima found in the �-sheet region (see
Fig. 1c).
3.3.4. Amino acids in Random coil with b-sheet confor-mations. Only 49% of all amino acids with �-conformation are
speci®ed as SHEET by DSSP (Table 1). A few (0.1%) are
speci®ed as HELIX, while most (51%) are found in segments
of Random coil. The latter were analyzed with respect to 'and angles for each of the 20 amino acids and as a function
of length of the single strands.
The Ramachandran plots for all 20 amino acids in Random
coil (Fig. 9) with a conformation in the �-sheet region have
several signi®cant differences compared with those of the
amino acids in SHEET (Fig. 8). Most of the amino acids in
Random coil (55%) but only 22% of those in SHEET are
found in the upper right corner of the � region. The average 'angle in Random coil is about 22� larger than the average '-
angle value encountered in �-sheets, while the angle is not
much different from that in �-sheets. There were no signi®cant
differences in torsion angles as a function of strand length. The
torsion angles are spread over a wide range of ' angles, from
ÿ180 toÿ40�, but the highest density of Random coil points is
in the upper right corner of the � region whereas the highest
density of SHEET points in the Ramachandran plot is in the
left region. One reason for the difference between the
conformations in �-sheets and Random coil is that there are
many prolines (8%) in Random coil but very few (2%) in
�-sheets. All prolines, with their rather rigid conformation, are
found in the upper right corner of the � region. However, the
prolines do not account for more than 20% of the amino acids
in Random coil in that region, so there must be other reasons
for the differences in conformations in Random coil and
SHEET. For every one of the 20 amino acids, the average 'angle is less negative when they occur in Random coil than
when they occur in SHEET, typically by 15±25�.The angles do not differ very much between amino acids
in Random coil and in SHEET (3�). However, in Random coil
there are two bridges between the �-sheet region and the
�-helical region. One bridge is around ' =ÿ130� and the other
around ' = ÿ80�. Both bridges have values ranging from
+45 to +90�. Asp and Asn are most common in these areas;
they make up about 27% of the amino acids in these two
bridges. The two bridging regions depend in a remarkable way
on proline; nearly 60% of the amino acids in the left bridging
region are followed by Pro, while none in the right bridging
region is followed by Pro.
The three areas in each corner of the Ramachandran plot
that can be considered as a continuation of the �-sheet region
are all mainly populated by Gly (see Fig. 5). This is especially
true for the area 135 < ' < 180� andÿ180 < <ÿ135�; 576 out
of the 579 amino acids found in this region were Gly!
3.4. The turns region
The last and least-populated region of the Ramachandran
plot, the turn region (also called the left-handed �-helical
region) around ' = = +60�, is mainly populated by glycines
Table 2The average ', values (aver) and the estimated standard deviations (e.s.d.) forparallel and antiparallel �-strands and the differences (parallel ÿ antiparallel).
Parallel with two partners Antiparallel with two partners Differences
'aver 'e.s.d. aver e.s.d. No. 'aver 'e.s.d. aver e.s.d. No. �' �
Ala ÿ122.0 22.0 136.6 16.8 376 ÿ130.2 21.4 143.8 14.6 753 8.2 ÿ7.1Val ÿ117.7 12.9 127.8 11.6 1209 ÿ121.2 13.6 132.5 13.2 1 470 3.6 ÿ4.7Leu ÿ111.6 15.8 124.9 12.9 806 ÿ115.2 15.8 131.8 13.5 1141 3.6 ÿ7.0Ile ÿ115.4 12.9 125.7 11.7 953 ÿ118.5 13.5 130.5 12.4 1034 3.2 ÿ4.8Phe ÿ113.9 18.5 129.3 17.1 333 ÿ123.3 19.4 140.6 16.9 640 9.4 ÿ11.4Met ÿ116.2 18.4 129.0 16.3 149 ÿ127.5 18.3 139.3 14.4 269 11.3 ÿ10.3Lys ÿ119.1 17.3 130.9 13.1 67 ÿ118.9 17.5 134.2 15.3 382 ÿ0.3 ÿ3.3Arg ÿ116.4 19.5 128.7 15.4 81 ÿ123.9 17.1 135.9 14.3 389 7.5 ÿ7.2His ÿ113.9 20.3 124.4 17.7 89 ÿ122.4 20.6 136.0 18.6 187 8.5 ÿ11.6Ser ÿ119.2 20.1 134.6 16.0 153 ÿ129.7 19.0 145.1 15.2 453 10.6 ÿ10.5Thr ÿ122.6 15.3 137.0 16.6 229 ÿ123.9 14.0 138.1 14.3 602 1.3 ÿ1.1Cys ÿ122.0 17.0 131.2 19.1 79 ÿ124.2 17.4 139.3 18.1 202 2.2 ÿ8.2Tyr ÿ119.3 16.9 131.5 16.0 220 ÿ125.5 18.4 142.8 15.6 710 6.3 ÿ11.3Asn ÿ112.3 18.7 123.8 17.2 87 ÿ117.9 20.3 135.7 17.4 196 5.6 ÿ11.9Glu ÿ116.7 19.3 128.9 14.1 78 ÿ121.0 18.2 134.4 13.1 384 4.3 ÿ5.5Trp ÿ112.1 16.7 127.4 15.6 71 ÿ124.7 19.8 142.7 15.2 235 12.7 ÿ15.3Asp ÿ111.3 19.1 118.7 17.0 91 ÿ113.4 19.7 129.0 19.9 195 2.1 ÿ10.4Gln ÿ114.5 16.2 129.4 15.5 77 ÿ124.5 19.0 136.9 15.2 265 10.1 ÿ7.4Average ÿ116.3 16.4 128.4 14.6 5148 ÿ122.2 17.7 136.4 15.5 9507 5.9 ÿ8.0

in turns. Only 4% of all amino acids have torsion angles in the
range 0 < ' < 180�, ÿ90 < < 90�. Of these 58% are Gly, 11%
Asn and 6% Asp. There are almost no Pro and only very few
Val and Ile in this region.
The distribution of points in the Ramachandran plot in the
turn region is elongated parallel to the line ' =ÿ , i.e. parallel
to the distribution of points in �-helical conformation. This
distribution again differs from that suggested in the original
Ramachandran plot, where the ' angle was con®ned to a
narrow range around 50� while the angle could vary from
+20 to +100�. However, it is clear from the present investi-
gation that the two torsion angles ' and are coupled here,
just as they are for amino acids in the �-helical region.
Furthermore, the turn region is situated below the predicted
left-handed �-helical region.
A very interesting picture emerges when the glycines are
plotted separately (Fig. 10a) and compared with all the other
Acta Cryst. (2002). D58, 768±776 HovmoÈ ller et al. � Conformations of amino acids in proteins 775
research papers
amino acids in this region (Fig. 10b). These two distributions
are almost non-overlapping, with the glycines mainly having
< 25� and the other amino acids having > 25�. The non-
glycines are quite well focused near ' = 60, = 35�, a point
mirroring the �-helical conformation ' = ÿ64, = ÿ41�.Apart from glycine, all the other 19 amino acids have quite
similar distributions of torsion angles in this region.
It has been proposed that there could exist a left-handed �-
helix with torsion angles near ' = 60, = 60�. We only found
71 stretches of three, three of four and one stretch of ®ve
consecutive amino acids in this region. About half of these are
just indicated as HELIX in the PDB ®les, while in a few cases
the authors have explicitly marked the helix as left-handed. In
some cases, the left-handed helix is directly connected to a
normal right-handed �-helix, for example 1afw (residues
97±99), but in the PDB ®le the whole sequence 96±106 is
marked only as HELIX. Our results are in total agreement
with those of Kleywegt (1999), who also found only one
protein with a ®ve-residue-long left-handed �-helix (in 1sft
which is also included in our sample). Only 1% of the 11 087
amino acids found in this region of the Ramachandran plot
can be considered as being parts of left-handed �-helices with
three or more amino acids. For this reason, we discourage the
use of this name for this region of the Ramachandran plot. We
propose to call it the turn region, since most of the amino acids
Figure 9Individual Ramachandran plots for each of the 20 amino acids in Random coil, i.e. neither denoted HELIX nor SHEET in DSSP (All includes all 20amino acids). All amino acids except Pro, Ile, Val and Thr have a signi®cant proportion of amino acids in the turn region. The amino acids in Random coilcontribute mainly to the rightmost of the two maxima in the �-sheet region seen in Fig. 1(c). The amino acids in Random coil in the �-helical part of theRamachandran plot are mainly located above and to the left of the conformation inside �-helices as seen in Fig. 6(e). Many amino acids haveconformations in two bridging regions between �-sheets and �-helices, as is especially clear in the case of Asn.

research papers
776 HovmoÈ ller et al. � Conformations of amino acids in proteins Acta Cryst. (2002). D58, 768±776
found here are parts of turns. In retrospect, we think it would
have been much better to call the three most populated areas
of the Ramachandran plot the �-helix, �-strand and -turn
regions.
4. Discussion
We have found several interesting and perhaps surprising
features in protein structures as the result of this extensive
analysis of Ramachandran plots. The �-sheet region is espe-
cially interesting, with its complicated ®ne structure differing
from one amino acid to another. Most amino acids have two
distinct narrow regions of ', angles. Some, especially Asn
and Asp, have even more complex Ramachandran plots.
Although many of these features can be discerned already in
the plots by Kleywegt & Jones (1996), they are more evident
here owing to our much larger high-resolution sample and the
smoothing procedure.
One surprise was the frequent observation of isolated single
�-strands, sometimes over ten amino acids long. When the
�-sheet was proposed as a possible secondary structure for
proteins, it was observed that two or more parallel or anti-
parallel �-strands could be joined by a set of hydrogen bonds,
which of course would stabilize the structure. However, this
does not rule out the possibility that single �-strands can also
be stabilized by hydrogen bonds in other less regular ways
than as parts of �-sheets.
There is only a very small difference in conformations of
amino acids that are parts of parallel or antiparallel �-sheets.
The differences between these two groups are only 6 and 8� in
each of the ' and angles, respectively, compared with the 20
and 22� in each angle expected from model building.
Considering the rather high standard deviations of the torsion
angles, 13±22�, the difference in torsion angles between
parallel and antiparallel strands are almost insigni®cant.
However, it should also be mentioned that for nearly all amino
acids the average ' values are more negative and the values
larger for the antiparallel than for the parallel strands. Thus,
the trend is the same as that expected, but the differences
between parallel and antiparallel are much smaller than
expected.
The Ramachandran plot is a very useful tool for checking
protein structure determinations. Much more detailed checks
than is the practice today may reveal many more errors. Any
stretch of four or more consecutive amino acids in �-helical
conformations but not marked HELIX should be checked
carefully and will most probably be found to be an �-helix.
Similarly, stretches of four or more consecutive amino acids
with � conformation but not assigned as SHEET should be
checked. Any single amino acid in HELIX outside the
�-helical region or SHEET outside the �-sheet region must
also be checked.
Our ®ndings may also prove important for protein-folding
prediction. For that purpose, it is imperative to consider the
relevant clusters of conformations. The different populations
in the �-sheet region must be treated and analyzed separately.
A list of the 1042 protein subunits used in this study can be
obtained from the authors.
We thank Salam Al-Karadaghi and Michel N. Fodje for
valuable discussion.
References
Creighton, T. E. (1996). Proteins: Structures and Molecular Properties,2nd ed., pp. 172±176, 183. New York: W. H. Freeman & Company.
Dunbrack, R. (2001). Culling the PDB by Resolution andSequence Identity. http://www.fccc.edu/research/labs/dunbrack/culledpdb.html/
Garnier, J. & Robson, B. (1990). Prediction of Protein Structure andthe Principles of Protein Conformation, edited by G. D. Fasman, pp.417±465. New York & London: Plenum Press.
Kabsch, W. & Sander, C. (2001). The DSSP Database. ftp://www.cmbi.kun.nl/pub/molbio/data/dssp/.
Kleywegt, G. J. (1999). J. Mol. Biol. 285, 1887±1897.Kleywegt, G. J. & Jones, T. A. (1996). Structure, 4, 1395±1400.Laskowski, R. A., MacArthur, M. W., Moss, D. S. & Thornton, J. M.
(1993). J. Appl. Cryst. 26, 283±291.Morris, A. L., MacArthur, M. W., Hutchinson, E. G. & Thornton, J. M.
(1992). Proteins, 12, 345±364.Ramachandran, G. N. & Sasisekharan, V. (1968). Adv. Protein Chem.
23, 283±437.Walther, D. & Cohen, F. E. (1999). Acta Cryst. D55, 506±517.
Figure 10Ramachandran plots for amino acids in the turn region. More than halfthe amino acids in the turn region are Gly. Their distribution is shown in(a). The conformations of all the other amino acids are quite similar andare merged in (b). The distribution of Gly is below and almost non-overlapping with that of the other amino acids.