Embed Size (px)
Citation preview

northernpolicy.caBy James Cuddy & Dr. Bakhtiar Moazzami
Research Paper No. 17 | April 2017 | 8/11
Northern ProjectionsHuman Capital Series - ALGOMA DISTRICT

Workforce Planning Ontario is a network of 26 Workforce Planning Boards covering four regions across the province. Workforce Planning Boards gather intelligence about the supply and demand side of the local labour market and work in partnership with employers, employment services, educators, researchers, economic development, government and other stakeholders to identify, understand and address labour market issues. This includes supporting and coordinating local responses to meet current and emerging workforce needs.
Given the unique geography and labour market issues that impact Northern Ontario, all 6 planning boards in the north have collaborated to form Northern Ontario Workforce Planning. They include: Algoma Workforce Investment Corporation (AWIC); Far Northeast Training Board (FNETB); The Labour Market Group (LMG); Northwest Training and Adjustment Board (NTAB); North Superior Workforce Planning Board (NSWPB); and Workforce Planning for Sudbury & Manitoulin (WPSM). FNETB and NSWPB are currently pilot sites for Local Employment Planning Councils (LEPC).
Jonathan Coulman - Executive Director Julie Joncas - Executive Director www.awic.ca www.fnetb.com Algoma District Cochrane & Timiskaming Districts Stacie Fiddler - Executive Director Madge Richardson - Executive Director www.thelabourmarketgroup.ca www.nswpb.ca Nipissing & Parry Sound Districts Thunder Bay District
Sonja Wainio - Executive Director Reggie Caverson - Executive Director www.ntab.on.ca www.planningourworkforce.ca Kenora & Rainy River Districts Sudbury & Manitoulin Districts
This project is funded in part by the Government of Canada and the Government of Ontario.
Who We Are - Northern Ontario Workforce Planning

Who We Are - Northern Ontario Workforce Planning

This report was made possible through the support of our partners Lakehead University,
Laurentian University and Northern Ontario Heritage Fund Corporation and the
financial support of Northern Ontario Workforce Planning Boards. Northern Policy
Institute expresses great appreciation for their generous support but emphasizes
the following: The views expressed in this report are those of the authors and do not
necessarily reflect the opinions of the Institute, its Board of Directors and its supporters,
Northern Ontario Workforce Planning Boards or the Government of Ontario. Quotation
with appropriate credit is permissible.
Author’s calcuations are based on data available at the time of publication and are
therefore subject to change.
Some of the key players in this model, and their roles, are as follows:
Board: The Board of Directors sets strategic direction for Northern Policy Institute. Directors serve on operational committees dealing with finance, fundraising and governance, and collectively the Board holds the CEO accountable for achieving our Strategic Plan goals. The Board’s principal responsibility is to protect and promote the interests, reputation, and stature of Northern Policy Institute.
President & CEO: Recommends strategic direction, develops plans and processes, and secures and allocates resources to achieve it.
Advisory Council: A group of committed individuals interested in supporting, but not directing, the work of Northern Policy Institute. Leaders in their fields, they provide advice on potential researchers or points of contact in the wider community.
Research Advisory Board: A group of academic researchers who provide guidance and input on potential research directions, potential authors, and draft studies and commentaries. They are Northern Policy Institute’s formal link to the academic community.
Peer Reviewers: Ensure specific papers are factual, relevant and publishable.
Authors and Research Fellows: Provide independent expertise on specific policy areas as and when needed.
Standing engagement tools (general public, government stakeholders, community stakeholders): Ensure Northern Policy Institute remains responsive to the community and reflects THEIR priorities and concerns in project selection.
Who We Are
Research Advisory BoardDr. John AllisonDr. Hugo AsselinDr. Randy Battochio (Chair)Dr. Stephen BlankDr. Gayle BroadGeorge BurtonDr. Robert Campbell
Board of DirectorsMartin Bayer (Chair)Michael AtkinsPierre BélangerThérèse Bergeron-Hopson (Vice Chair)Lucy BonannoTerry BurseyDr. Harley d’Entremont
Dr. Iain Davidson-HuntDr. Livio Di MatteoDr. Morley GundersonDr. Anne-Marie MawhineyLeata RiggBrenda SmallJ.D. SnyderDr. Lindsay Tedds
Seppo PaivalainenAllyson PeleDuke PeltierKathryn PolingPeter PolitisTina SartorettoKeith SaulnierDavid Thompson
President & CEOCharles Cirtwill
Advisory CouncilKim Jo BlissDon DrummondJohn FiorRonald GarbuttJean Paul GladuAudrey GlibeauPeter GoringFrank Kallonen
Alex FreedmanDr. George Macey(Vice Chair & Secretary)Dawn Madahbee LeachHal J. McGonigalGerry MuntEmilio Rigato (Treasurer)Dr. Brian Tucker
© 2017 Northern Policy Institute
Published by Northern Policy Institute
874 Tungsten St.
Thunder Bay, Ontario P7B 6T6

About the Authors James Cuddy
Dr. Moazzami has taught Economics and Econometrics at Lakehead University since 1988. He is well known for his research activities particularly related to Northern Ontario. He has written many reports on Northern Ontario’s economic development challenges and opportunities. He was commissioned by the Ministry of Northern Development and Mines to undertake a comprehensive study of Northern Ontario’s economy as a part of the research conducted for the Growth Plan for Northern Ontario. Included in the study were the identification of growing, declining and emerging industrial clusters in the region. Professor Moazzami has also written extensively on Northern Ontario’s Aboriginal people and Northern Aboriginal economy. Dr. Moazzami’s expertise and influence reaches beyond Lakehead University and Northern Ontario. He has been a regular guest speaker at the University of Waterloo’s Economic Development Program.
Dr. Bakhtiar Moazzami
James Cuddy is a market analyst at the Canada Mortgage and Housing Corporation (CMHC). He has over 5 years of experience conducting research on various economic issues, with a particular focus on labour market and socioeconomic analysis and regional and urban economics.
Prior to his role at CMHC, Cuddy served as Northern Policy Institute’s in-house Economist, where he played the role of principal in-house researcher who helped to expand and implement research priorities and assist in quality control.
James is a graduate of Carleton University with a B.A. in Economics (2013) and the University of Ottawa with a M.A. in Economics (2015).
ContentsPartners 2
Who We Are 4
About the Authors 5
Summary of Findings 6
Introduction 7
Demographic Change: The Past Three Decades 8
Demographic Change: The Next Three Decades 12
Algoma District’s Labour Force: Past, Present and Future Trends 16 Productivity and the Human Capital Composition of the Workforce 22
The Consequences of Shifting the Composition of the Employed Labour Force in Algoma District 29
Recommendations 34
Related Research 37

6 Northern Policy Institute / Institut des politiques du NordAlgoma District | April 2017
Summary of FindingsIf the current level of educational achievement continues, the human capital composition of the workforce will decline in the coming years in both the Algoma district and across Northeastern Ontario. The Algoma district (like several others in the Northeast) will, however, decline at a slower rate than the region as a whole.
The human capital composition of the working-age population in the Algoma district is above that in Northeastern Ontario, but below provincial and national levels. Notably, the human capital indexes for immigrants are higher than the total population in Northeastern Ontario, Ontario and Canada. Additionally, the indexes for the Indigenous labour force in the Algoma district, while below the rest of the population, are higher than national levels.
Since the Indigenous labour force will account for a significant and growing share of the Algoma district’s future workforce, it is vital for the social and economic viability of the region to adopt education policies that enable this segment of the labour force to meet the requirements of the future labour market.In general, the Indigenous population tends to participate less in the labour force than that of the total population. Indigenous labour force participation in the district of Algoma was below the regional average in 2011. Their unemployment rate was also significantly higher than the regional average. In fact, their lower labour force participation rate is partly attributable to the high unemployment rate among the Indigenous workforce and partly related to the fact that their level of educational attainment is below that of the regional average.
Labour force participation and education levels for men are a problem and are getting worse, particularly for the male Indigenous population on-reserve. The labour force participation rate of Indigenous men in Northeastern Ontario declined from 70.3 percent in 2001 to 66.6 percent in 2011. This is a challenge that needs to be met head on and resolved. One factor that likely contributes to this growing challenge is that education levels of the prime-working-age population in the Algoma district are lower than education levels in Ontario and Canada for the total population. On the other hand, the Indigenous population has education levels at provincial levels and above national benchmarks.
The participation rate among Indigenous women in Northeastern Ontario increased from 49.2 percent in 2001 to 55.1 percent in 2011. The Ontario Ministry of Finance reports that, “[t]he most significant trend driving the aggregate labour force participation rate in Ontario has been the increase in the number of women in the workforce. Labour force participation
rates for adult women have risen dramatically, from 57.0 percent in 1976 to 82.0 percent in 2013.”1 This is a positve trend and one that could be accelerated going forward.
Finally, similar to other regions in Northern Ontario, a declining and aging population is one on the most fundamental challenges facing the district of Algoma. Indeed, the district’s population declined by 13.5 percent from 1986 to 2016 and the share of seniors in the district rose from 11 percent in 1991 to 21 percent in 2011. These trends are a due in part to out-migration among younger cohorts, and low and declining levels of immigration. In fact, total net domestic out-migration from 2014 to 2015 equaled nearly 480 individuals in the district, while in 2015, Algoma district attracted only 76 immigrants. This is equivalent to roughly 10 times less immigrants per capita in the district compared to Ontario as a whole. In order to mitigate the effects of these population and demographic trends, the district should consider strategies to attract newcomers from other parts of Ontario, Canada and abroad.
1 Ontario Ministry of Finance, “Ontario’s Long-Term Report on the Economy”, 2014.

7Northern Policy Institute / Institut des politiques du NordAlgoma District | April 2017
IntroductionThe objective of this report is to examine past and present trends and characteristics in the district of Algoma’s economy and to forecast its future challenges and opportunities. The report focuses primarily on the supply side of the economy. The authors examine the district’s labour market including its human capital composition, employment trends, the shifting occupational composition of the employed workforce, the shifting of the region’s industrial composition from goods-producing to services-producing sectors, the declining share of the private sector, the rising dependency on the public sector, and declining labour income and gross domestic product (GDP).
The report begins by examining demographic change in the Algoma district over the past three decades and by defining and estimating various dependency indicators.
The study looks into the future and provides projections for the total and Indigenous populations over the next three decades. From these population projections, the study estimates past, present and future trends in the size and composition of the regional labour force.
In the following section, the study defines and quantitatively measures the human capital composition of the Algoma district’s workforce in the coming years. This section also discusses the implications of the growing application of technology in the production process and, accordingly, the future skill requirements of the workforce.
The report then moves on to discuss the consequences of shifting the composition of the employed labour force in Northeastern Ontario from goods-producing, dominated by private businesses, to services-producing, predominantly financed by the public sector. The study also examines the shifting occupational composition of the employed workforce, and the implication thereof for total regional income and GDP in the Algoma district.
The study concludes with a summary and discussion of some policy implications.
Most of the data used in this report are based on detailed information regarding individual census subdivisions (CSDs) in the district of Algoma and Northeastern Ontario obtained through special tabulations from Statistics Canada. Except for the population data, the 2011 data are based on the 2011 National Household Survey (NHS). Total population forecasts are based on data made available by the Ontario Ministry of Finance.
Data Sources
Census 2016 data are being released in stages between February, 2017 and November 2017. At the time of publication, only population and dwelling count data had been released. Population figures have been added to this publication, where applicable, however, the vast majority of the data presented in this publication rely on Census 2016 data that will be released later in 2017. Thus, the majority of the data presented in this report are based of the 2011 National Household Survey.
The report provides information on the following four population groups: •The total population; •The Francophone population, defined as individuals who report their mother tongue to be French; •The Indigenous population, defined by Statistics Canada as persons who reported identifying with at least one Indigenous group – that is, North American Indian, Metis or Inuit – and/or those who reported being a Treaty Indian or a registered Indian, as defined by the Indian Act, and/or those who reported they were members of an Indian band or First Nation; and •The Immigrant population, defined as persons who are, or have ever been, landed immigrants in Canada.
Northern Ontario is subdivided into Northwestern and Northeastern Ontario. The three most western Census districts – namely Rainy River, Kenora and Thunder Bay – constitute Northwestern Ontario. The region that lies north and east of Lakes Superior and Huron constitutes Northeastern Ontario. It is defined to include the following census divisions: Cochrane, Timiskaming, Algoma, Sudbury, Nipissing, Manitoulin, Parry Sound and Greater Sudbury. The federal government and FedNor also include Muskoka district in their definition of Northeastern Ontario. The provincial government removed the district of Muskoka from the jurisdictional area of the Ministry of Northern Development and Mines and the Northern Ontario Heritage Fund in 2004, but has continued to include Parry Sound as a Northern Ontario division.2
2 The analysis in this study is based on these jurisdictional and geographic parameters.
Population Groups Studied
The Geographical Specification of Northeastern Ontario

8 Northern Policy Institute / Institut des politiques du NordAlgoma District | April 2017
Demographic Change: The Past Three Decades The Algoma district covers 48,811 square kilometers and recorded a population of 114,094 in 2016. It has a population density of 2.3 persons per square kilometer which is well below that of Ontario (14.8). According to Statistics Canada’s census of population, the district declined by about 13.5 percent from 1986 to 2016 (Figure 1).
In terms of net migration flows, the Algoma district has experienced negative net intraprovincial migration for the last decade, as more individuals from Ontario have moved out of the district than into it. In addition, interprovincial migration, known as the movement of individuals from one province to another, has also been consistently negative during this period. The total domestic out-migration in 2014-15 was 480 (Figure 2). Also contributing to population levels is low and declining immigration in the district of Algoma (Figure 2). As of 2015, the district attracted 6.5 immigrants per 10,000 people compared to 64.8 in Ontario, which translates into roughly 10 times less immigrants per capita compared to the province as a whole (Figure 3).
Figure 1: Population, Algoma District, 1986–2016
Source: Statistics Canada, Census of Canada; and idem, National Household Survey.
131,841
127,269125,455
118,565117,460
115,870114,094
105,000
110,000
115,000
120,000
125,000
130,000
135,000
1986 1991 1996 2001 2006 2011 2016

9Northern Policy Institute / Institut des politiques du NordAlgoma District | April 2017
Figure 2: Net Domestic Migration and Immigration, Algoma District, 2001/2002-2014/2015
Source: Author’s calculations based on Statistics Canada, CANSIM database, table 051-0063.
Figure 3: Number of Immigrants per 10,000 people, Northern Ontario Districts, 2014/2015
Source: Author’s calculations based on Statistics Canada, CANSIM database, table 051-0062 and 051-0063.
-1000
-800
-600
-400
-200
0
200
400
Immigrants Net interprovincial migration Net intraprovincial migration
1.52.4
3.5 3.9 4.0 4.14.9 5.1
6.4 6.4 6.5 6.5
8.89.7
0
2
4
6
8
10
12

10 Northern Policy Institute / Institut des politiques du NordAlgoma District | April 2017
In addition to migration patterns and low levels of immigration in the district, rising life expectancy and lower fertility rates have resulted in the aging of the population. At the same time, the large baby-boom generation, born in the two decades following the Second World War, is now beginning to retire. The generations that followed were much smaller, primarily due to a declining fertility rate. As a result, the share of individuals in the district below the age of 20 has declined from 30 percent in 1991 to 20 percent in 2011, while the share of seniors rose from 11 percent in 1991 to 21 percent in 2011 (Figure 4). During the same period, the share of individuals between the ages of 20 to 34 declined from 23 to 16 percent, while individuals aged 35 to 64 increased from 37 to 43 percent.
Figure 4: Age Distribution of Population, Algoma District, 1991-2011
Source: Author’s calculations based on Statistics Canada, Census of Canada, and National Household Survey, custom tabulation.
These demographic changes have had a significant impact on social and economic conditions in the district. The population will continue to age in the foreseeable future, with implications for the supply of labour, production capacity, and the ability of the Algoma district to stay economically viable. One important aspect of the aging population relates to the relationship between economically active and economically dependent age groups – that is, between the working population on the one hand and the young and elderly on the other.
This study examines three dependency ratios: old age dependency, defined as the number of persons aged 65 years and older relative to the working-age population (ages 20 to 64); youth dependency, defined as the ratio of the number of persons aged 20 years and younger to the working-age population; and total dependency ratio, defined as the ratio of the total dependent population, which is essentially the number of mouths to feed, to the working-age population. This last ratio is a crude measure of the burden or cost associated with demographic change in terms of raising and educating children as well as taking care of the elderly at any given time. Assuming jobs are available for the working-age population, a rising dependency ratio suggests that there are more dependent persons per each member of the working-age population. A declining dependency rate implies that there are more working persons per dependent, enabling a region to reap the benefits of increased production capacity, therefore lowering the costs associated with the declining proportion of dependents.
30
23
37
11
20
16
43
21
0
5
10
15
20
25
30
35
40
45
50
0 to 19 20 to 34 35 to 64 65+
1991 2011

11Northern Policy Institute / Institut des politiques du NordAlgoma District | April 2017
Figure 5 shows that, in the district, the youth dependency ratio declined from 50 persons per every 100 working-age persons in 1991 to 34 in 2011 due to the fact that the number of youth declined much faster than the number of working age persons. During the same period, the youth dependency index declined from 44 to 38 youth to every 100 working age persons in Ontario.
At the same time, the old age dependency rose from 19 to every 100 working age individuals in 1991 to 35 in 2011 due to an increasing number of seniors relative to the working age population. In other words, there were 5.3 working persons in 1991 per each senior, but only 2.9 working persons per senior in 2011. The ratio of seniors to working age population in the Algoma District (35) is notably above the provincial value of 24 to every 100 working age persons in 2011. Having higher old age dependency ratios can have budgetary implications related to health care and other expenditures required to care for seniors in the coming years. This ratio is expected to continue to rise as working age persons retire and change their status from working to retired in the future.
Overall, the total dependency rate – the number of youths and seniors relative to those of working age – increased from 68 in 1991 to 69 in 2011, suggesting that the district decreased its capacity to support its non-working population over the period. This rate was also well-above the provincial average of 62 in 2011. This ratio is expected to rise as the baby boomers start to retire in the coming years. Decreasing the gap between the dependency ratios in the district and those of the province as a whole could be a goal the region might strive to achieve in the long term.
Figure 5: Ratio of the Working-Age Population to Other Age Groups, Algoma District, 1991 and 2011
Source: Author’s calculations based on Statistics Canada, Census of Canada, and National Household Survey, custom tabulation.
50
19
68
50
19
69
34 35
69
36
30
65
0
10
20
30
40
50
60
70
80
Youth Old age Total
1991 Algoma 1991 Northeast 2011 Algoma 2011 Northeast
12 Northern Policy Institute / Institut des politiques du NordAlgoma District | April 2017
Demographic Change: The Next Three Decades
Population Projections
This part of the study provides population projections for the district, both for the total population and for the Indigenous population. Estimates for the former are based on projections by the Ontario Ministry of Finance; estimates for the latter are based on Northern Ontario’s Demographic Model, developed by Bakhtiar Moazzami.
A few words regarding the Ministry of Finance projections are in order. First, the Ministry’s 2011 population estimates are about 3,430 greater than those reported by the 2011 census, having been adjusted for net undercoverage by the census, especially of the region’s Indigenous population in the Algoma district.
Second, the Ministry’s estimated parameters for fertility at the census division level were modelled to maintain regional differences. The census division-to-province ratio for mean age at fertility in the most recent period was assumed to remain constant.
Thirdly, the Ministry’s mortality estimates at the census division level were developed using a ratio methodology. The government applied the Ontario-level mortality structure to each census division’s age structure over the most recent three years of comparable data and calculated the expected number of deaths. It then compared these estimates to the actual annual number of deaths in each census division over this period to create ratios of actual-to-expected numbers of deaths. These ratios were then multiplied by provincial age-specific death rates to create death rates for each census division. These were then applied to the corresponding census division population to derive the number of deaths for each census division.3
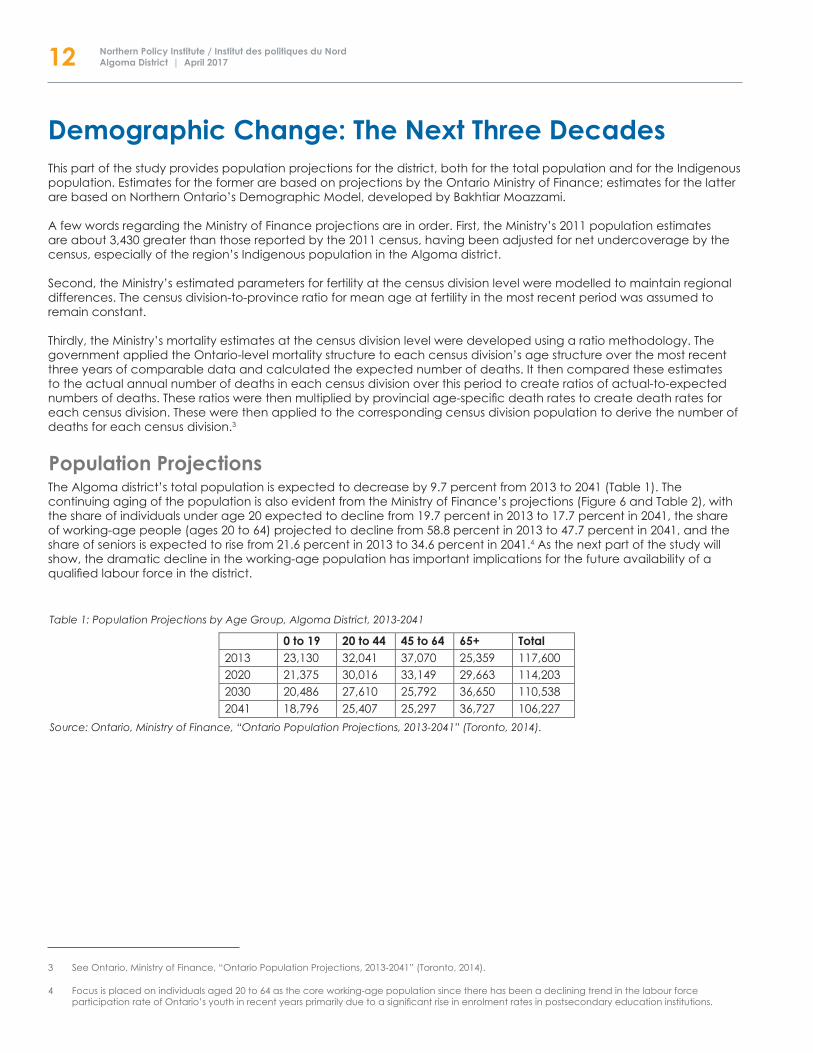
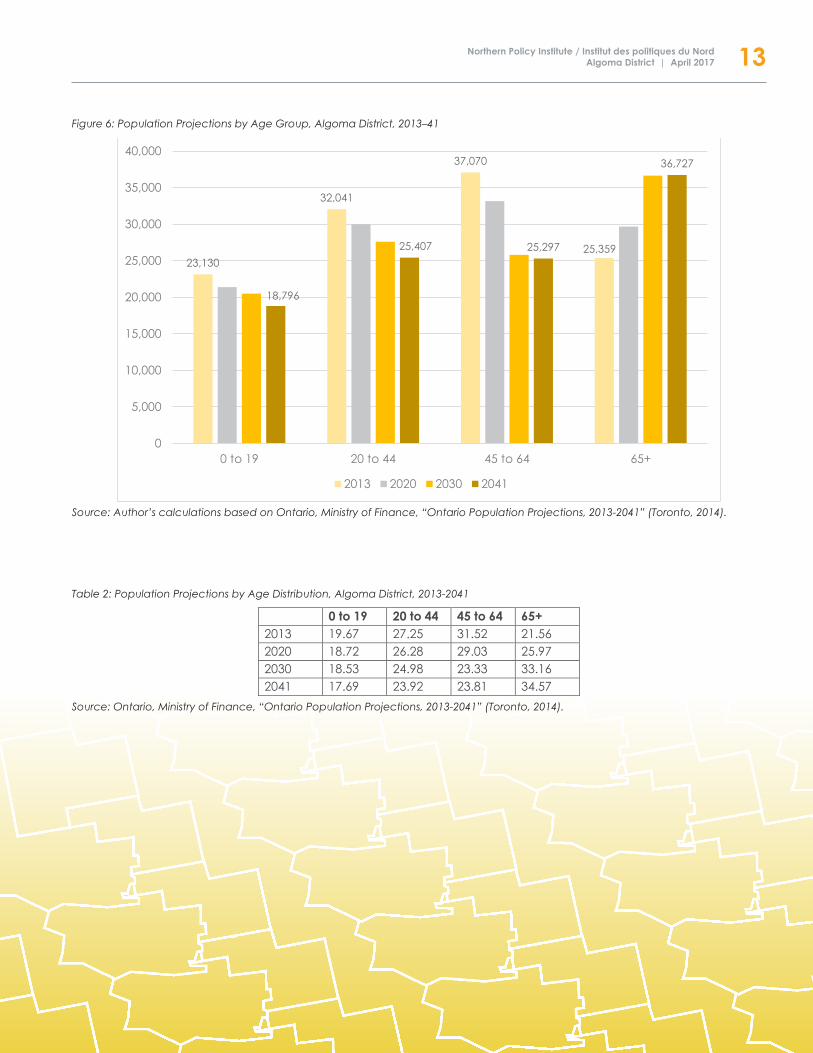
The Algoma district’s total population is expected to decrease by 9.7 percent from 2013 to 2041 (Table 1). The continuing aging of the population is also evident from the Ministry of Finance’s projections (Figure 6 and Table 2), with the share of individuals under age 20 expected to decline from 19.7 percent in 2013 to 17.7 percent in 2041, the share of working-age people (ages 20 to 64) projected to decline from 58.8 percent in 2013 to 47.7 percent in 2041, and the share of seniors is expected to rise from 21.6 percent in 2013 to 34.6 percent in 2041.4 As the next part of the study will show, the dramatic decline in the working-age population has important implications for the future availability of a qualified labour force in the district.
3 See Ontario, Ministry of Finance, “Ontario Population Projections, 2013-2041” (Toronto, 2014).
4 Focus is placed on individuals aged 20 to 64 as the core working-age population since there has been a declining trend in the labour force participation rate of Ontario’s youth in recent years primarily due to a significant rise in enrolment rates in postsecondary education institutions.
0 to 19 20 to 44 45 to 64 65+ Total 2013 23,130 32,041 37,070 25,359 117,600 2020 21,375 30,016 33,149 29,663 114,203 2030 20,486 27,610 25,792 36,650 110,538 2041 18,796 25,407 25,297 36,727 106,227
Table 1: Population Projections by Age Group, Algoma District, 2013-2041
Source: Ontario, Ministry of Finance, “Ontario Population Projections, 2013-2041” (Toronto, 2014).
13Northern Policy Institute / Institut des politiques du NordAlgoma District | April 2017
0 to 19 20 to 44 45 to 64 65+ 2013 19.67 27.25 31.52 21.56 2020 18.72 26.28 29.03 25.97 2030 18.53 24.98 23.33 33.16 2041 17.69 23.92 23.81 34.57
Table 2: Population Projections by Age Distribution, Algoma District, 2013-2041
Source: Ontario, Ministry of Finance, “Ontario Population Projections, 2013-2041” (Toronto, 2014).
Figure 6: Population Projections by Age Group, Algoma District, 2013–41
Source: Author’s calculations based on Ontario, Ministry of Finance, “Ontario Population Projections, 2013-2041” (Toronto, 2014).
23,130
32,041
37,070
25,359
18,796
25,407 25,297
36,727
0
5,000
10,000
15,000
20,000
25,000
30,000
35,000
40,000
0 to 19 20 to 44 45 to 64 65+
2013 2020 2030 2041

14 Northern Policy Institute / Institut des politiques du NordAlgoma District | April 2017
In making projections for the Indigenous population in the Algoma District out to 2041, this study employs Northern Ontario’s Demographic Forecasting Model, which is based on the Cohort Component method.5 The base year data for the projection are from Statistics Canada’s National Household Survey for 2011. In projecting the future Indigenous population, this study does not adjust for the undercoverage of Indigenous people in the region — as mentioned above, there were 3,430 omitted persons in the Algoma district alone — so the projections should be considered conservative. This study also assumes zero net migration of Indigenous people over the forecast period, since the existing evidence suggests there is relatively low mobility among the region’s Indigenous population. The fertility rate for the Indigenous population is assumed equal to that in rural Northeastern Ontario, and the mortality rate to equal the rate for the general population of Canada based on the 2011 census.
5 For a complete discussion of this model, see B. Moazzami, “It’s What You Know (and Where You Can Go): Human Capital and Agglomeration Effects on Demographic Trends in Northern Ontario” (Thunder Bay, ON: Northern Policy Institute, 2015).
Based on these assumptions, Figure 7 shows that the Indigenous population in the district is expected to increase from 13,471 in 2013 to 16,597 in 2041, a growth rate of about 23.2 percent. The number of individuals under age 20 expected to remain roughly constant during this period, while working-age individuals will increase by about 8 percent and the number of individuals aged 65 and over are expected to rise from 1,152 in 2013 to 3,549 in 2041, an increase of 208 percent.
The Indigenous population’s share of total district’s population is expected to increase from 16.4 percent in 2013 to 22.7 percent in 2041 (Figure 8). The share of prime-working-age people (those ages 20 to 44) is expected to increase from 16.6 percent in 2013 to 27.2 percent in 2041. Similarly, the share of working-age Indigenous people (those ages 20 to 64) is expected to increase from 15.8 percent in 2013 to 23.9 percent in 2041. The share of Indigenous seniors is expected to rise from 8.9 percent in 2013 to 16.4 percent in 2041.
Figure 7: Indigenous Population Projections by Age Group, Algoma District, 2013–2041
Source: Author’s calculations based on Ontario, Ministry of Finance, “Ontario Population Projections, 2013-2041” (Toronto, 2014).
Indigenous Population Projections
4,339
7,980
1,152
4,143
8,409
1,927
4,147
8,301
3,255
4,432
8,616
3,549
0
1,000
2,000
3,000
4,000
5,000
6,000
7,000
8,000
9,000
10,000
0--19 20--64 65+
2013 2020 2030 2041

15Northern Policy Institute / Institut des politiques du NordAlgoma District | April 2017
Figure 8: Projections of the Share of the Indigenous Population, Algoma District, 2013–2041
Source: Author’s calculations based on Ontario, Ministry of Finance, “Ontario Population Projections, 2013-2041” (Toronto, 2014).
16.6 15.8
8.9
16.4
20.1 18.3
11.9
18.2
24.2
21.4
14.9
20.5
27.2
23.9
16.4
22.7
0
5
10
15
20
25
30
20-44 20-64 65+ Total
2013 2020 2030 2041
16 Northern Policy Institute / Institut des politiques du NordAlgoma District | April 2017
Labour Market Trends in Algoma District
Algoma District’s Labour Force: Past, Present and Future TrendsDemographic changes have a direct impact on the supply side of the economy through their influence on the labour force. An aging population and a declining share of working-age people can seriously restrain future economic development unless productivity growth accelerates or steps are taken to increase participation of older workers, youth and other underrepresented groups in the labour force. This study has shown that the Indigenous population represents a growing segment of the Algoma district’s total population and its working-age population. A significant gap exists, however, between the level of educational achievement of Indigenous individuals and that of the general population, resulting in a severe labour market outcome disparity that affects the current and future productive capacity of the district of Algoma’s labour force.
Table 3 shows various labour market indicators for Northeastern Ontario in 2001 and 2011. The total core working-age population (ages 15 to 64) in the region declined from 365,020 in 2001 to 364,100 in 2011. The Francophone and Immigrant population both declined during this period while the Indigenous population grew. During the same period, the labour force participation rate among women rose by 3.8 percent resulting in an increased number of people in the labour force. The Ontario Ministry of Finance reports that, “[t]he most significant trend driving the aggregate labour force participation rate in Ontario has been the increase in the number of women in the workforce. Labour force participation rates for adult women have risen dramatically, from 57.0 percent in 1976 to 82.0 percent in 2013.”6 Total employment among men declined while that among women increased from 2001 to 2011. The unemployment rate among men and women both declined slightly during this period.
6 Ontario Ministry of Finance, “Ontario’s Long-Term Report on the Economy”, 2014.
The labour force participation rate of Indigenous men declined from 70.3 percent in 2001 to 66.6 percent in 2011. On the other hand, the participation rate among Indigenous women increased from 49.2 percent in 2001 to 55.1 percent in 2011. The unemployment rate among Indigenous men declined from 21.3 percent in 2001 to 16.4 percent in 2011, which can be attributed partly to some previously unemployed persons having stopped participating in the labour force. The unemployment rate among Indigenous women also declined from 16.5 percent in 2001 to 11.0 percent in 2011. The labour market outcome for Indigenous people who live on reserve is different from those who live off-reserve, whereas those living on-reserve have lower participation rates and much higher unemployment rates.

17Northern Policy Institute / Institut des politiques du NordAlgoma District | April 2017
Labour Market Outcome Men Women Total Regional Population 2001 2011 2001 2011 Total population 15 to 64 years of age 179,755 180,120 185,265 183,980 In the labour force 137,045 135,580 123,265 129,300 Employed 122,290 121,260 112,320 118,615 Unemployed 14,760 14,320 10,945 10,680 Not in the labour Force 42,705 44,540 61,995 54,680 Participation Rate 76.2 75.3 66.5 70.3 Employment Rate 68.0 67.3 60.6 64.5 Unemployment Rate 10.8 10.6 8.9 8.3
Francophones Total population 15 to 64 years of age 44,465 37,800 46,575 40,405 In the labour force 33,855 28,640 30,285 27,975 Employed 30,060 26,125 28,230 26,390 Unemployed 3,795 2,510 2,060 1,585 Not in the labour Force 10,605 9,155 16,285 12,430 Participation Rate 76.1 75.8 65.0 69.2 Employment Rate 67.6 69.1 60.6 65.3 Unemployment Rate 11.2 8.8 6.8 5.7
Immigrants Total population 15 to 64 years of age 9,555 7,345 10,650 8,660 In the labour force 7,165 5,415 6,440 5,480 Employed 6,670 5,055 6,070 5,080 Unemployed 495 355 370 400 Not in the labour Force 2,390 1,930 4,205 3,175 Participation Rate 75.0 73.7 60.5 63.3 Employment Rate 69.8 68.8 57.0 58.7 Unemployment Rate 7.0 6.6 5.8 7.3
Indigenous Total population 15 to 64 years of age 13,015 19,135 13,855 20,635 In the labour force 9,145 12,740 8,155 12,765 Employed 7,195 10,655 6,810 11,360 Unemployed 1,950 2,085 1,345 1,410 Not in the labour Force 3,870 6,400 5,700 7,870 Participation Rate 70.3 66.6 58.9 61.9 Employment Rate 55.2 55.7 49.2 55.1 Unemployment Rate 21.3 16.4 16.5 11.0
Table 3: Labour Market Trends, Working-age Population (ages 15 to 64), Northeastern Ontario, 2001 and 2011
Source: Statistics Canada, 2001 Census and 2011 NHS, custom tabulation.

18 Northern Policy Institute / Institut des politiques du NordAlgoma District | April 2017
Figure 9: Labour Force Participation Rates (%), Total and Indigenous Population, by Age Group, Northeastern Ontario, 2011
Sources: Statistics Canada, Census of Canada 2011, and National Household Survey 2011, custom tabulation.
According to the available data, Indigenous peoples tend to participate less in the formal labour force as compared to the non-Indigenous population. It is important to note that these findings do not necessarily take into account alternative and traditional economies that Indigenous populations historically and presently participate in. As Figure 9 shows, their labour force participation rate was below the regional average in 2011. Their unemployment rate was also significantly higher than the regional average. In fact, their lower labour force participation rate is partly attributable to the high unemployment rate among the Indigenous workforce and partly related to the fact that their level of educational attainment is below that of the regional average.
Figure 10 compares labour force characteristics among various demographics of the population in the Algoma district and Northeastern Ontario.7 The labour force participation rate among men is 73.1 percent in the district compared to 75.3 percent in Northeastern Ontario and 76.0 percent in Ontario in 2011. The Indigenous population living on-reserve in the Algoma district have the lowest levels of participation, followed by the immigrant population and then the off-reserve Indigenous population. The participation rate among women was 69 percent in the district compared to 70.3 in Northeastern Ontario and 72.6 in Ontario. The participation rate among on-reserve Indigenous women in the district was the lowest compared to all other comparators.
The unemployment rate among men in the district was 12.7 percent compared to 10.6 and 8.4 in Northeastern Ontario and Ontario, respectively. The unemployment rate among women in Algoma was 8.8 percent compared to 9.3 percent in the Algoma district and 8.3 in Northeastern Ontario and the province as a whole. The unemployment rate among on-reserve Indigenous men was the highest in Algoma at 22.5 percent.
The employment rate which represents the share of the working-age population who were employed was 63.8 percent for men in the Algoma district compared to 67.3 percent in Northeastern Ontario in 2011. Again, employment rates were generally lower for the Indigenous population. The employment rate among working-age women is 62.6 percent in the district compared to 64.5 percent in the Northeast.
7 Note that the indicators for population groups with fewer than 500 individuals are not very reliable.
30.00
40.00
50.00
60.00
70.00
80.00
90.00
15 to 24years
25 to 29years
30 to 34years
35 to 39years
40 to 44years
45 to 49years
50 to 54years
55 to 59years
60 to 64years
Total Population Aboriginal Population

19Northern Policy Institute / Institut des politiques du NordAlgoma District | April 2017
Figure 10: Labour Force Participation, Employment and Unemployment Rates (%), Ages 15 to 64 years, Algoma District and Northeast Ontario, 2011
Note: Missing bars indicate that data was not available.Sources: Statistics Canada, Census of Canada 2011, and National Household Survey 2011, custom tabulation.
73.1 71.965.6
56.965.769.0
62.757.1 54.0 57.7
75.3 75.8 73.7
61.16870.3 69.2
63.357.3
62.9
01020304050607080
Total Francophone Immigrant On-ReserveAboriginal
Off-ReserveAboriginal
Participation Rate (%)
Algoma - Men Algoma - Women Northeast - Men Northeast - Women
63.8 64.1 60.7
44.151.5
62.6 58.5 54.446.5 50.3
67.3 69.1 68.864.5 65.358.7
01020304050607080
Total Francophone Immigrant On-ReserveAboriginal
Off-ReserveAboriginal
Employment Rate (%)
Algoma - Men Algoma - Women Northeast - Men Northeast - Women
12.710.9
7.6
22.5 21.7
9.36.8
4.4
14 12.810.6
8.86.6
21.8
15.2
8.35.7
7.3
14.4
10.3
0
5
10
15
20
25
Total Francophone Immigrant On-ReserveAboriginal
Off-ReserveAboriginal
Unemployment Rate (%)
Algoma - Men Algoma - Women Northeast - Men Northeast - Women

20 Northern Policy Institute / Institut des politiques du NordAlgoma District | April 2017
Table 4: Projected Labour Supply, Total and Indigenous, Algoma District and Northeastern Ontario, 2013–2041
Source: Author’s estimates based on Ontario, Ministry of Finance, “Ontario Population Projections, 2013-2041” (Toronto, 2014).
Size and Composition of the Future Labour ForceTo forecast the future labour force in the Algoma district and Northeastern Ontario, this study uses detailed population projections along with information regarding labour force participation rates for men and women in different age groups. It is assumed that participation rates during the projection period (out to 2041) stay constant at their 2011 level. Different assumptions regarding participation rates would alter the labour force estimates, but only to a limited extent. The main determinants of the future labour force are the size and age distribution of the population in each jurisdiction.
Table 4 and Figure 11 provide labour supply projections for the district of Algoma and Northeastern Ontario for the period from 2013 to 2041. The district’s labour force is expected to decline by about 25.9 percent over the period, while the Indigenous labour force is expected to increase by 7.2 percent. As a result, the share of the Indigenous labour force is expected to increase from 11.6 percent in 2013 to 16.8 percent in 2041.
Year
Algoma District Northeast Ontario
Total Labour Force Indigenous
Labour Force
Indigenous Share (%) Total Labour Force
Indigenous Labour Force
Indigenous Share (%)
2013 53,239 6,192 11.63 264,860 27,372 10.33 2014 52,345 6,228 11.9 261,674 27,632 10.56 2015 51,502 6,234 12.1 258,626 27,751 10.73 2016 50,670 6,239 12.31 255,558 27,874 10.91 2017 49,845 6,257 12.55 252,470 28,059 11.11 2018 49,047 6,263 12.77 249,289 28,142 11.29 2019 48,267 6,283 13.02 246,155 28,200 11.46 2020 47,452 6,295 13.27 242,891 28,327 11.66 2021 46,674 6,315 13.53 239,896 28,554 11.9 2022 45,931 6,325 13.77 236,948 28,590 12.07 2023 45,234 6,330 13.99 234,070 28,611 12.22 2024 44,560 6,335 14.22 231,333 28,627 12.37 2025 43,900 6,364 14.5 228,687 28,737 12.57 2026 43,310 6,328 14.61 226,057 28,594 12.65 2027 42,791 6,343 14.82 223,711 28,695 12.83 2028 42,327 6,340 14.98 221,550 28,741 12.97 2029 41,905 6,343 15.14 219,616 28,813 13.12 2030 41,468 6,340 15.29 217,788 28,885 13.26 2031 41,139 6,353 15.44 216,402 29,033 13.42 2032 40,879 6,364 15.57 215,433 29,087 13.5 2033 40,669 6,407 15.76 214,669 29,304 13.65 2034 40,493 6,418 15.85 213,998 29,374 13.73 2035 40,301 6,460 16.03 213,288 29,586 13.87 2036 40,107 6,474 16.14 212,569 29,671 13.96 2037 39,943 6,510 16.3 211,992 29,880 14.09 2038 39,810 6,536 16.42 211,538 30,067 14.21 2039 39,706 6,552 16.5 211,198 30,240 14.32 2040 39,582 6,596 16.66 210,792 30,497 14.47 2041 39,450 6,639 16.83 210,397 30,706 14.59

21Northern Policy Institute / Institut des politiques du NordAlgoma District | April 2017
Figure 11: Future Supply of Labour, Total and Indigenous Share, Northeastern Ontario Districts, 2013–2041
Source: Author’s estimates based on Ontario, Ministry of Finance, “Ontario Population Projections, 2013-2041” (Toronto, 2014).
62.25
74.10
87.11
60.00
65.00
70.00
75.00
80.00
85.00
90.00
95.00
100.00
2013
2014
2015
2016
2017
2018
2019
2020
2021
2022
2023
2024
2025
2026
2027
2028
2029
2030
2031
2032
2033
2034
2035
2036
2037
2038
2039
2040
2041
Labour Supply Trends (2013=100)
Sudbury Cochrane Algoma Timiskaming
Parry Sound Manitoulin Greater Sudbury Nipissing
123.59
144.70
174.61
100.00
110.00
120.00
130.00
140.00
150.00
160.00
170.00
180.00
2013
2014
2015
2016
2017
2018
2019
2020
2021
2022
2023
2024
2025
2026
2027
2028
2029
2030
2031
2032
2033
2034
2035
2036
2037
2038
2039
2040
2041
Indigenous Share of the Labour Force (2013=100)
Timiskaming Parry Sound Greater Sudbury Nipissing
Algoma Cochrane Sudbury Manitoulin

22 Northern Policy Institute / Institut des politiques du NordAlgoma District | April 2017
Note: Persons with an education who do not have a job are not included.Source: Author’s estimates based on Statistics Canada’s 2006 Census Microdata file.
Productivity and the Human Capital Composition of the Workforce in Algoma District and Northeastern OntarioProductivity growth is directly linked to the human capital composition of the workforce. Human capital is defined as the stock of knowledge, skills and abilities embodied in individuals that directly affects their level of productivity. Since knowledge and skills are acquired through education and experience, investing in human capital represents an avenue through which this district can enhance productivity and minimize the impact of its declining labour force.
To estimate the human capital composition of the regional workforce, one needs to specify and measure a proxy for human capital that also reflects and incorporates a measure of productivity of the workforce in the Algoma district and Northeastern Ontario. To obtain such an index, this study first estimated a standard earnings model using the 2006 census micro-data file.8 This study used data pertaining to all working Canadians between the ages of 15 and 64 who were not attending school and whose employment earnings were greater than $1,000 and less than $1 million. The benchmark or reference group is those with less than a high school diploma.
The estimated return-to-schooling coefficients (Figure 12) show the increased earnings, compared to the reference group, of obtaining different levels of education. Therefore, they represent the average rate of return to schooling at the national level. For example, obtaining a high school diploma increases a person’s earnings by 24.4 percent above the earnings of those without a high school diploma. Similarly, obtaining a trade or college diploma increases earnings by 27.0 and 44.1 percent respectively. A university degree increases earnings by 72.6 percent. The return to schooling estimates reflect higher productivity resulting from an increased level of education. In short, the return to education increases as the level of schooling rises, reflecting higher earnings commensurate with higher productivity as the level of education increases.
8 The earnings model is of the form: lnWage = α + ΣβiSi + Xiδi + εi, where Sis are the highest level of schooling, Xis are other control variables which include age categories, marital status, etc. and εi is an error term.
Figure 12. The Return to Education (%), by Level of Educational Attainment, Canada, 2006
24.3626.99
44.1548.25
72.65
0
10
20
30
40
50
60
70
80
High School Trade College University belowBachelor
University Degree

23Northern Policy Institute / Institut des politiques du NordAlgoma District | April 2017
This study then used the estimated return-to-schooling coefficients as weights to calculate a weighted average index of the share of individuals aged 15 to 64 with different levels of schooling for each of the districts in Northeastern Ontario.9 Figure 13 shows estimated human capital indices for working-age Indigenous people, immigrants, Francophones and the total population in Canada, Ontario, Northeastern Ontario and the district of Algoma.10 The estimated indexes range from 100 if none of the area’s residents have completed high school to about 200 if all residents have obtained a university degree.
As Figure 13 shows, the human capital composition of the working-age population in this district is above that in Northeastern Ontario, but below provincial and national levels. Notably, the human capital indexes for immigrants in this area are higher than total population in Northeastern Ontario, Ontario and Canada. In addition, the indexes for the Indigenous labour force, while below the rest of the population, are higher than national levels.
9 HCI = exp{Σβi . Si shares}, where HCI stands for Human Capital Index, exp stands for exponential, and Si shares are the share of the population ages 15 to 64 with Si level of education in a given census subdivision. The formulation of the human capital measure is based on R.E. Hall and C.I. Jones (1999), “Why Do Some Countries Produce So Much More Output per Worker than Others?” Quarterly Journal of Economics 114 (1, 1999): 83–116. See also Francesco Caselli, “Accounting for Cross-Country Income Differences”, First Draft, November 2003.
10 Note that the human capital indexes reported here are numerically different from the ones reported in my previous report since I have used return to education or productivity measure in Canada as a benchmark in calculating the above indexes where Ontario was the benchmark in my previous report. Using Canada as a benchmark has an advantage of making the indexes comparable to other provinces as well.
Figure 13. Human Capital Index for the Working-Age Population, Canada, Ontario, Northeastern Ontario and Algoma District, 2011
Source: Author’s estimates based on Statistics Canada’s 2006 Census Microdata file.
143.4152.3
140.3
126.4
146.3152.1
145.0131.1138.5
150.5
135.9130.0
139.5146.5
133.3 130.1
0
20
40
60
80
100
120
140
160
Total Immigrants Francophones Aboriginals
Canada Ontario Northeast Ontario Algoma District

24 Northern Policy Institute / Institut des politiques du NordAlgoma District | April 2017
Earlier, this study identified two important demographic trends in the Algoma district. First, the working-age population is declining; as a result, the supply of labour is expected to decline over the coming years. Second, a growing Indigenous labour force potentially could offset that trend, but the human capital composition of the Indigenous workforce is lower than the rest of the population, so if the current situation continues, future labour productivity will decline.
To estimate the human capital composition of the future regional workforce, this study combined the labour force projections with the human capital indexes for various segments of the workforce. As Figure 14 shows, if the current level of educational achievement continues, the human capital composition of the workforce will decline in the coming years in both the Algoma district and across Northeastern Ontario, however, the district is expected to decline at a slower rate than the region. This index is positively correlated with labour productivity, labour income and output in the region.
Source: Author’s estimates based on Ontario, Ministry of Finance, “Ontario Population Projections, 2013-2041” (Toronto, 2014).
A Perfect Storm: Declining Labour Supply and Labour Productivity in Algoma District
Figure 14. Human Capital Composition of the Workforce in Northeastern Ontario Districts, 2013–2041
100 100 100 100 100 100 100 100 100
99.65
99.29
99.88
99.05
99.88 99.89
99.67
99.85
99.74
98.90
99.10
99.30
99.50
99.70
99.90
100.10
Algoma Cochrane GreaterSudbury
Manitoulin Nipissing Parry Sound Sudbury Timiskaming N.E.O.
Productivity Trend In Northeastern Ontario (2013=100)
2013 2020 2041

25Northern Policy Institute / Institut des politiques du NordAlgoma District | April 2017
The declining supply of labour and declining labour productivity is only half of the story. Technological changes and the emergence of the knowledge economy have altered the requirements of the labour market. Various studies suggest that, by 2031, about 80 percent of the workforce need to have post-secondary credentials such as an apprenticeship, college or university degree. Currently, 70 percent of the new jobs and an average of 63.4 percent of all jobs require some post-secondary credential.11 Based on various studies by the Ontario Ministry of Education, Human Resources and Skills Development Canada, the British Columbia Ministry of Skills, Training and Education, the
11 Miner Management Consultants, ‘Ontario’s Labour Market Future- People without Jobs, Jobs without People’, February 2010.
Source: Rick Miner, “People without Jobs, Jobs without People: Canada’s Future Labour Market” (Toronto: Miner Management Consultants, 2010).
Figure 15. Percentage of Jobs Requiring Post-Secondary Education, Canada, 2006–2031
British Columbia Ministry of Advanced Education and Labour Market Development and other government agencies, Miner Management Consultants provides estimates of the percentage of new jobs that will require post-secondary education in the coming years (Figure 15). Yet, as Figure 16 shows, the skill levels of the prime-working-age population in the district are lower than the skill levels in Ontario and Canada for the total population, while, on the other hand, the Indigenous population has education levels at provincial levels and above national levels. Importantly, however, the present skill level in the district overall are below the current estimated skill requirements of about 63.4 percent.
65.0 70.0
72.5 75.0
77.5 80.0
60.0
66.9 70.2
74.5 76.6 77.1
0
10
20
30
40
50
60
70
80
90
2006 2011 2016 2021 2026 2031
New Jobs Overall Skill Requirements

26 Northern Policy Institute / Institut des politiques du NordAlgoma District | April 2017
Source: Author’s estimates based on Statistics Canada, Census of Canada 2011, and National Household Survey 2011, custom tabulation.
Figure 16: Percentage of the Labour Force Ages 25–64 with Postsecondary Credentials, Algoma District, Ontario and Canada, 2011
Since the Indigenous labour force will account for a significant and growing share of the district’s future workforce, it is vital for the social and economic viability of the region to adopt education policies that enable this segment of the labour force to meet the requirements of the future labour market.
Does the level of skills affect labour market performance – that is, the likelihood of employment, labour force participation and unemployment rates? Figure 17 shows that a higher skill level increases the likelihood of participation in the workforce. In the Algoma district in 2011, the participation rate of the prime working age population (25-64) without a high school diploma was 49.3 percent compared to 69.2 percent for those with a high school diploma and 79.3 percent for those with postsecondary credentials. Figure 17 also shows that total labour force participation rates in this district lag behind the provincial and national averages.
Similarly, as shown in Figure 18, the average unemployment rate among those without a high school diploma was 17.0 percent compared to 8.2 percent for those with a high school diploma and 6.5 percent for those with a postsecondary credentials. Overall, the total unemployment rate in 2011 in this district of 7.8 percent was higher than in Ontario and Canada.
The employment rate – defined as the percentage of the prime working age population who are employed – was 40.9 percent for those without a high school diploma, which increases to 63.5 percent for those with a high school diploma and 74.1 percent for those with a postsecondary credential (Figure 19). Again, the employment rates lag behind the provincial and national averages.
64
48
65
53
60
53
0
10
20
30
40
50
60
70
Total Population
Canada Ontario
Indigenous Population
Algoma

27Northern Policy Institute / Institut des politiques du NordAlgoma District | April 2017
Source: Author’s calculations based on Statistics Canada, Census of Canada 2011, and National Household Survey 2011, custom tabulation.
Figure 17: Labour Force Participation Rate by Level of Educational Attainment (%), Canada, Ontario and Algoma District, 2011
Source: Author’s calculations based on Statistics Canada, Census of Canada 2011, and National Household Survey 2011, custom tabulation.
Figure 18: Likelihood of Unemployment by Highest Level of Schooling (%), Canada, Ontario and Algoma District, 2011
72.7
49.3
69.2
79.380.2
61
76.1
8580.3
62.9
76.7
85
0
10
20
30
40
50
60
70
80
90
Total No Certificate High School PostsecondaryCredentials
Algoma Ontario Canada
7.8
17.0
8.2
6.56.3
10.4
7.1
5.56.2
11.3
6.9
5.3
0
2
4
6
8
10
12
14
16
18
Total No Certificate High School PostsecondaryCredentials
Algoma Ontario Canada

28 Northern Policy Institute / Institut des politiques du NordAlgoma District | April 2017
Recently, 50 companies in advanced manufacturing, manufacturing, mining and professional and scientific services were surveyed in Northern Ontario.12 Of these, 22 had operations in Northern Ontario and other jurisdictions (multi-locational) and 28 were multinationals operating in Northern Ontario. Fifteen had their headquarters in Northern Ontario, 11 were located in Northwestern Ontario and 39 were located in Northeastern Ontario.
In short, individuals who do not have post-secondary credentials have a higher likelihood of non-participation in labour force and face a greater probability of unemployment, and these probabilities will only increase in the coming years. To the extent that the skill level of the workforce is below the estimated requirement needed for emerging occupations, the district will face a situation of workers with qualifications that do not match the existing jobs and of jobs that cannot find qualified workers — Miner’s “People without Jobs, Jobs without People.” Even if markets adjust to bring labour demand and supply into balance, the social impact of having many unemployable people in the area will be enormous.
12 B. Moazzami, HDR Decision Economics Inc. and Oraclepoll Research Limited, “Multinational and Multi-locational Enterprise Initiative, Survey of Northern Ontario Companies”, 2012.
The above evidence suggests that one potential solution to the district’s declining workforce size and productivity is to promote higher education through increased access to services, especially for the Indigenous population who experience lower levels of educational achievement. One of the benefits of investing in education is a lower likelihood of unemployment and dependency on government transfer payments. Additionally, regardless of what occurs with agreements such as the Trans-Pacific Partnership, labour will continue to be more mobile among various countries, increasing the importance of achieving higher levels of education. In this case, workers in Northern Ontario will not only be competing with other workers in Ontario and Canada, but will be facing competition from other countries as well. To the extent that the skill level of the workforce in the district is below the estimated skill requirement needed for the emerging occupations, the district will face workers whose qualifications do not match the existing jobs and jobs that cannot find qualified workers.
Source: Author’s calculations based on Statistics Canada, Census of Canada 2011, and National Household Survey 2011, custom tabulation.
Figure 19: Labour Force Employment Rate by Level of Educational Attainment (%), Canada, Ontario and Algoma District, 2011
67.0
40.9
63.5
74.175.2
54.7
70.7
80.375.3
55.8
71.4
80.5
0
10
20
30
40
50
60
70
80
90
Total No Certificate High School PostsecondaryCredentials
Algoma Ontario Canada

29Northern Policy Institute / Institut des politiques du NordAlgoma District | April 2017
The Consequences of Shifting the Composition of the Employed Labour Force in Algoma DistrictThe structure of this district’s workforce has been changing due to a population that is simultaneously declining and aging. At the same time, the industrial and occupational composition of the employed workforce is shifting due to changing market conditions. As a result, the size and industrial makeup of the employed workforce has changed over the past three decades. There has been a continuous shift away from the goods-producing sector dominated by private businesses to the service-producing sector, a large portion of which is publicly funded. Using data from various Censuses of Canada as well as the 2011 NHS, Figure 20 and Table 5 show the changing industrial composition of the employed workforce in the Algoma district.
Source: Author’s calculations based on Statistics Canada, Census of Canada (various years), and National Household Survey 2011, custom tabulation.
Figure 20: Employment in the Goods- and Services-Producing Industries, Algoma District, 1986–2011
26,480
11,845
36,980
42,095
64,285
55,520
0
10000
20000
30000
40000
50000
60000
70000
1981 1986 1991 1996 2001 2006 2011
Goods-producing Services-producing Total Employed

30 Northern Policy Institute / Institut des politiques du NordAlgoma District | April 2017
The shift away from the goods-producing sector has resulted in a net employment loss of over 14,600 jobs in the sector since the early-1980s. From 2001 to 2011, total employment in manufacturing declined by 26 percent, while agriculture, forestry, fishing and hunting declined by 52 percent. On the other hand, mining, quarrying, and oil and gas extraction increased by 69 percent during this period, and employment in the utilities and construction increased by 39 and 35 percent, respectively. It is imperative to acknowledge that the goods-producing sector is a major component of Northeastern Ontario’s economic base and its change in employment can have serious impacts on the region’s long-term economic growth potential. The multiplying effect between employment in goods-producing industries and total regional employment equals 1.8713,
13 Author’s calculations based on data from Statistics Canada.
meaning that one job in the goods-producing sector supports 1.87 jobs in the regional economy.
Employment in the services-producing sector has grown by roughly 19 percent since the early-1980s. Since 2001, service-producing industries that experienced notable growth included public administration (33 percent), health care and social assistance (22 percent), and administrative and support services (28 percent). On the other hand, industries that experienced a decline during this period included management of companies and enterprises (63 percent), information and cultural industries (23 percent), and accommodation and food services (22 percent). The growth of health care and public administration, which are referred to as quasi-base sectors since they are financed from outside the region, has to a large extent mitigated the decline in the traditional base sectors of the economy.
Table 5: Industrial Composition of the Employed Workforce Ages 15 and Older, Algoma District, 2001–2011
2001 2006 2011 Employment change from 2001 to 2011
(number) (number) (percent) Total 55,365 56,380 55,520 155 0.28 Industry - not applicable 1,450 1,170 1,570 120 8.28 All industries 53,915 55,210 53,955 40 0.07
Goods-producing sector 13,210 11,940 11,845 -1,365 -10.33Agriculture, forestry, fishing and hunting 1,575 1,345 755 -820 -52.06Mining, quarrying, and oil and gas extraction 485 445 820 335 69.07 Utilities 385 360 535 150 38.96 Construction 2,925 3,045 3,935 1,010 34.53 Manufacturing 7,840 6,745 5,800 -2,040 -26.02
Services-producing sector 40,710 43,250 42,095 1,385 3.40 Wholesale trade 980 915 1,015 35 3.57 Retail trade 6,890 6,850 6,705 -185 -2.69Transportation and warehousing 2,570 2,695 2,115 -455 -17.70Information and cultural industries 755 790 585 -170 -22.52Finance and insurance 1,280 1,085 1,285 5 0.39 Real estate and rental and leasing 770 825 745 -25 -3.25Professional, scientific and technical services 1,795 1,765 1,875 80 4.46 Management of companies and enterprises 40 35 15 -25 -62.50Administrative and support, waste management and remediation services 2,175 3,675 2,790 615 28.28
Educational services 4,005 4,275 4,335 330 8.24 Health care and social assistance 6,260 6,900 7,620 1,360 21.73 Arts, entertainment and recreation 1,480 1,705 1,625 145 9.80 Accommodation and food services 5,075 4,550 3,950 -1,125 -22.17Other services (except public administration) 3,005 3,205 2,605 -400 -13.31Public administration 3,630 3,980 4,830 1,200 33.06
Source: Author’s calculations based on Statistics Canada, Census of Canada (various years), and National Household Survey 2011, custom tabulation.

31Northern Policy Institute / Institut des politiques du NordAlgoma District | April 2017
The changing industrial composition of the workforce has also been accompanied by a shift in the occupational structure of the employed workforce (Table 6). Since 2001, some occupations experienced notable growth, including occupations in education, law and social, community and government services (55 percent), health occupations (22 percent), and natural and applied sciences (13 percent). On the other hand, occupations that experienced declines included natural resources, agriculture and related production occupations (33 percent), occupations in manufacturing and utilities (28 percent), and sales and service occupations (11 percent).
Table 6: Employed Workforce by Occupation, Algoma District, 1996–2011
Source: Statistics Canada, Census of Canada (various years), and National Household Survey 2011, custom tabulation.
1996 2001 2006 2011 Employment
change from 2001 to 2011
(number) (number) (percent)
Total 58,440 55,360 56,380 55,520 160 0.29 Occupation - not applicable 2,395 1,450 1,170 1,570 120 8.28 All occupations 56,045 53,915 55,210 53,950 35 0.06
Management occupations 3,930 4,385 4,435 4,540 155 3.53 Business, finance and administration occupations 8,430 7,680 8,225 7,785 105 1.37 Natural and applied sciences and related occupations 2,460 2,620 3,340 2,965 345 13.17
Health occupations 2,900 3,370 3,755 4,055 685 20.33 Occupations in education, law and social, community and government services 4,275 4,545 4,885 7,060 2,515 55.34
Occupations in art, culture, recreation and sport 1,180 900 1,110 955 55 6.11 Sales and service occupations 16,555 15,555 15,635 13,790 -1,765 -11.35Trades, transport and equipment operators and related occupations 9,955 9,515 9,515 9,070 -445 -4.68
Natural resources, agriculture and related production occupations 2,105 1,900 1,770 1,265 -635 -33.42
Occupations in manufacturing and utilities 4,250 3,440 2,545 2,465 -975 -28.34

32 Northern Policy Institute / Institut des politiques du NordAlgoma District | April 2017
Labour Income and Gross Domestic Product in Algoma DistrictThe changing size and composition of the district’s employed workforce has also impacted total labour income and output. Using detailed employment by occupation and industry data along with average employment earnings by industry and occupation, this study estimated trends in total labour income in 2010 dollars in the district, shown in Figure 21. Labour income is influenced by size, productivity and the occupational composition of the employed workforce. From 2001 to 2011, labour income in the Algoma district increased only marginally from $2.040 billion to $2.041 billion, compared with a 6.7 percent increase in Northeastern Ontario during the same period. Assuming that the share of labour in regional gross domestic product (GDP) stayed relatively constant from 2001 to2011, it is evident that the Algoma district also experienced negligible growth in GDP during this period, as show in Figure 22.
Author’s calculations based on Statistics Canada, Census of Canada (various years), and National Household Survey 2011, custom tabulation.
Figure 21: Total Labour Income (millions of 2010 dollars), Northeastern Districts, 2001–2011
2,040.37
1,621.97
3,020.97
206.58
1,489.63
693.32
389.49 609.08
2,041.91
1,642.21
3,431.09
213.06
1,601.99
715.11
386.00 589.88
0
500
1,000
1,500
2,000
2,500
3,000
3,500
4,000
Algoma Cochrane GreaterSudbury
Manitoulin Nipissing Parry Sound Sudbury Timiskaming
2001 2011

33Northern Policy Institute / Institut des politiques du NordAlgoma District | April 2017
Author’s calculations based on Statistics Canada, Census of Canada (various years), and National Household Survey 2011, custom tabulation.
Figure 22: Regional Gross Domestic Product (millions of 2010 dollars), Northeastern District, 2001–2011
3,767.94
2,995.29
5,578.83
381.50
2,750.89
1,280.34
719.26 1,124.79
3,770.79
3,032.66
6,336.19
393.46
2,958.38
1,320.60
712.83 1,089.33
0
1,000
2,000
3,000
4,000
5,000
6,000
7,000
Algoma Cochrane GreaterSudbury
Manitoulin Nipissing Parry Sound Sudbury Timiskaming
2001 2011

34 Northern Policy Institute / Institut des politiques du NordAlgoma District | April 2017
Recommendations
Algoma District should confront its demographic challenges by implementing a well-rounded migration strategy. Similar to other regions in Northern Ontario, a declining and aging population is one on the most fundamental challenges moving forward. These trends are a due in part to out-migration among younger cohorts, and low and declining levels of immigration. In fact, total net domestic out-migration from 2014 to 2015 equaled nearly 480 individuals who moved out of the region, while in 2015, the district attracted only 76 immigrants, which is equivalent to roughly 10 times less immigrants per capita across Ontario. It is imperative that the region seeks to enhance its population levels by implementing strong immigration strategies, in combination with strategies to attract domestic in-migrants.
The human capital indexes for the Indigenous labour force in this district, while below the rest of the population, are higher than in Canada. Given that the Indigenous share of the population is increasing, and given that their human capital composition is lower than total working-age population in the Algoma District as a whole, future labour productivity will decrease if education levels do not rise among this segment of the population. There is strong evidence showing that higher skill levels increase the likelihood of participation in the workforce and reduce unemployment rates in the district and addressing these issues for the Indigenous population will have positive benefits for the entire region.
The shift in the economy from manufacturing and resource related jobs to service and knowledge based jobs has had a positive impact for the female population in the Algoma district. With a declining population and the need for greater participation and higher levels of education, this trend should be sustained and expanded upon where possible. Ongoing efforts to knock down traditional barriers to education for this group should continue. These interventions have usually included: family supports, child care, transportation and housing investments, as well as high quality primary and secondary education.
1. Implement a well-rounded migration strategy
3. Continue to build on the regional growth in workforce participation of women
2. Respond to the needs of the Indigenous population

35Northern Policy Institute / Institut des politiques du NordAlgoma District | April 2017
ReferencesOntario. 2014. Ministry of Finance. “Ontario Population Projections, 2013–2041.” Toronto.
Moazzami, B. 2015. “It’s What You Know (and Where You Can Go): Human Capital and Agglomeration Effects on Demographic Trends in Northern Ontario.” Thunder Bay: Northern Policy Institute.
Ontario. 2014. Ministry of Finance. “Ontario’s Long-Term Report on the Economy.” Toronto.
Hall, R.E., and C.I. Jones. 1999. “Why Do Some Countries Produce So Much More Output per Worker than Others?” Quarterly Journal of Economics 114 (1): 83–116.
Caselli, F. 2003. “Accounting for Cross-Country Income Differences.” Unpublished first draft, November.
Miner, R. 2010. “People without Jobs, Jobs without People: Canada’s Future Labour Market.” Toronto: Miner Management Consultants.
Moazzami, B. 2012. “Multi-national and Multi-locational Enterprise Initiative, Survey of Northern Ontario Companies and Analysis of the Results.” Prepared for the Federal Economic Development Initiative for Northern Ontario.
Canadian Council of Chief Executives. “Taking Action for Canada: Jobs and Skills for the 21st Century.” Ottawa.

36 Northern Policy Institute / Institut des politiques du NordAlgoma District | April 2017

37Northern Policy Institute / Institut des politiques du NordAlgoma District | April 2017
To stay connected or get involved, please contact us at: 1 (807) 343-8956 [email protected] www.northernpolicy.ca
About Northern Policy Institute
Northern Policy Institute is Northern Ontario’s independent think tank. We perform research, collect and disseminate evidence, and identify policy opportunities to support the growth of sustainable Northern Communities. Our operations are located in Thunder Bay, Sudbury, and Sault Ste. Marie. We seek to enhance Northern Ontario’s capacity to take the lead position on socio-economic policy that impacts Northern Ontario, Ontario, and Canada as a whole.
Related Research
It’s What You Know (And Where You Can Go): Human Capital and Agglomeration Effects on
Demographic Trends in Northern Ontario
Dr. Bakhtiar Moazzami
Settling Down in the Northwest James Cuddy
Show me The Money: Some Positive Income Trends in Northern Ontario
Kyle Leary
Northern Projections: Human Capital Series - Greater Sudbury
James Cuddy and Dr. Bakhtiar Moazzami

northernpolicy.ca