Embed Size (px)
Citation preview
RESEARCH PAPER 4/2015
The employment dynamics of Australian entrepreneurship
Luke Hendricksona, Stan Bucifala, Antonio Balaguera and David Hansellb
Department of Industry and Sciencea and Australian Bureau of Statistics
b
September 2015
Abstract
This research paper is the first in a series to explore the dynamics of employment and productivity
growth in Australian firms using the newly created Expanded Analytical Business Longitudinal
Database. This paper examines the contribution of young firms, particularly start-ups, to net job
creation in the Australian economy between 2001–2011. The results show that young SMEs
contribute disproportionately to job creation. Young SMEs (firms aged 0–5 years) made the highest
contribution to net job creation in Australia (40 per cent) and start-up activity (firms aged 0–2 years) is
responsible for most of this growth. Australia’s start-up activity is high but they tend to reach smaller
sizes relative to other OECD countries examined to date. A very small fraction (3 per cent) of start-ups
drive the majority (77 per cent) of their post-entry job creation. These high growth start-ups also show
superior sales and profit performance but lower labour productivity performance compared to other
surviving start-ups.
JEL Codes: J21, L26, M13, O31, O57
Keywords: Australia, creative destruction, DynEmp, entrepreneurship, employment, innovation,
OECD, productivity, start-up

For further information on this research paper please contact:
Manager
Innovation Research
Department of Industry and Science
GPO Box 9839
Canberra ACT 2601
Phone : +61 2 6213 6000
Email: [email protected]
Have you read the Australian Innovation System report? www.industry.gov.au/innovationreport
Disclaimer
The views expressed in this report are those of the author(s) and do not necessarily reflect those
of the Australian Government or the Department of Industry and Science.
Commonwealth of Australia 2015.
This work is copyright. Apart from use under Copyright Act 1968, no part may be reproduced or
altered by any process without prior written permission from the Australian Government.
Requests and inquiries concerning reproduction and rights should be addressed to
[email protected]. For more information on Office of the Chief Economist
research papers please access the Department’s website at: www.industry.gov.au/OCE
Creative Commons Licence
With the exception of the Coat of Arms, this publication is licensed under a Creative Commons
Attribution 3.0 Australia Licence.
Creative Commons Attribution 3.0 Australia Licence is a standard form license agreement that
allows you to copy, distribute, transmit and adapt this publication provided that you attribute the
work. A summary of the licence terms is available from
http://creativecommons.org/licenses/by/3.0/au/deed.en. The full licence terms are available from
http://creativecommons.org/licenses/by/3.0/au/legalcode.
The Commonwealth’s preference is that you attribute this publication (and any material sourced
from it) using the following wording:
Source: Licensed from the Commonwealth of Australia under a Creative Commons Attribution
3.0 Australia Licence. The Commonwealth of Australia does not necessarily endorse the content
of this publication.
Acknowledgements
We thank the following colleagues for their comments on the paper: Chiara Criscuolo, Andrew
Lalor, Mark Cully, Per Davidsson, Diane Braskic, Nick Yazidjoglou, Tony Wiskich, Jennifer Poehl
and Abrie Swanepoel.
Key points This research paper investigates the employment dynamics of
Australian entrepreneurship using the new Australian Bureau of
Statistics’ Expanded Analytical Business Longitudinal Database
2001–02 to 2012–13, funded by the Department of Industry and
Science.
As firms age they contribute less to job creation and more to job
destruction. Young firms in Australia contribute
disproportionately to net job creation. Although employing a
small fraction of the Australian workforce (15 per cent), young
SMEs generated the largest share of total job creation (40 per
cent) in the economy.
For every 100 existing jobs in Australia in any given year, start-
ups will, on average, add 5 jobs within the following three years.
Over the period 2006–2011 we estimate that 1.04 million full time
equivalent (FTE) jobs were added to the economy. Start-ups
(firms aged 0–2 years) added 1.44 million FTE jobs to the
economy whereas older firms (3+ years) shed around 400,000
FTE jobs over the same period.
Most micro-start-ups (new firms with 0–9 employees) either exit
or grow very little (96.8 per cent). A very small fraction (3.2 per
cent) of these micro-start-ups grow dramatically over five years
post-entry and these firms account for the majority (77 per cent)
of total post-entry job creation of all micro-start-ups in their
cohort. These high growth start-ups are found in all sectors of the
economy.
As expected the sales and profit performance of these high
growth firms is superior to those that remain stable or only grow
marginally after five years. However their labour productivity is
lower during that period of dramatic employment growth and
investment.
Australia has relatively high start-up activity but this activity has
been declining. The employment generated per start-up is low
compared with other OECD countries.

The employment dynamics of Australian entrepreneurship 1
1. Introduction There are large, persistent productivity differences between firms within
industries and productivity affects firm survival and growth.1 Considerable
international evidence suggests that entry, exit, expansion, and contraction of
firms are closely related to measures of productivity and profitability (for
surveys and summaries, see Syverson 2011, Foster et al. 2001, Bartelsman
& Doms 2000). Creative-destruction is a restructuring process within an
economy where new more innovative, more productive firms replace less
innovative, less productive ones.2 The efficient reallocation of resources
between these growing and shrinking firms is critical to aggregate
employment and productivity growth. Lentz & Mortensen (2008), working with
a Danish firm panel from 1992–1997 found that 74 per cent of aggregate
productivity growth came from reallocation of employment to innovating firms
through both entry/exit dynamics (21 per cent) and growth through capture of
market share (53 per cent). The growth orientation of a firm is ultimately
related to the decisions of firm owners and managers to invest in competitive
or productive advantages such as acquisition, innovation and skilled
employees.3 Understanding the motivations, entrepreneurial activities and
framework conditions that drive these dynamics would therefore be expected
to lead to better policy outcomes.4
Until now our capacity to understand these firm dynamics and its impact has
been limited by a lack of data that would enable researchers to link firm level
change in employment and production to national trends. Aggregate data,
such as the national accounts, provide a glimpse into which industries drive
these trends, but by default measure net change only hiding within-sector
differences.
The Organisation for Economic Cooperation and Development (OECD) has
recently created two new cross-country projects using firm-level data to
understand these dynamics: DynEmp (see Box 1.1), which focusses on
employment dynamics, and MultiProd,5 which sheds light on the micro-drivers
of aggregate productivity performance. The first iteration of DynEmp included
results from 18 countries over the period, 2001–2011. The data showed that
young, small firms create a disproportionate amount of jobs and that there
are significant differences between countries in the capacity of these firms to
survive and grow.6
The Department of Industry and Science partnered with the Australian
Bureau of Statistics (ABS) to create the Expanded Analytical Business
Longitudinal Database (see Box 1.2) so that Australia could contribute to the
two OECD projects. Our ultimate objective, however, was to create a robust
longitudinal census of firm activity that we can all use to understand firm
dynamics and develop better, more evidence-based industry policy in
Australia.
1 Syverson (2011)
2 Schumpeter (1942)
3 Davidsson & Wiklund (2013)
4 We are interested in employment growth as a means to achieve economic and social inclusion policy objectives rather than considering growth as an end in itself.
5 Micro-drivers of aggregate productivity http://www.oecd.org/sti/Flyer_Multiprod.pdf
6 Criscuolo et al. (2014)
The employment dynamics of Australian entrepreneurship 2
The EABLD is a census of firms over the period 2001 to 2012. Any firm with
an ABN or ACN is included in the database. In 2001 there were 1.70 million
firms in the database accounting for 7.12 million full time equivalent jobs,
$570 billion value added, $2.39 trillion total sales output of which $173 billion
came from exports. In 2012 there were 2.83 million firms in the database
accounting for 8.96 million FTE jobs, $1.3 trillion value added, $4.48 trillion
total sales output of which $352 billion came from exports.7
This paper compares Australian results for DynEmp with those already
published by the OECD and then burrows deeper into the data in order to
provide a more comprehensive understanding of the drivers of employment
creation and destruction in Australia. Growth is defined here as employment
growth. We find that Australian results support the main conclusions of the
OECD DynEmp report. We also describe the growth of young, small
Australian firms, particularly start-ups.
Box 1.1: DynEmp: The OECD dynamics of employment project
The OECD Directorate for Science, Technology and Innovation has initiated
a cross-country project focusing on employment dynamics. The OECD
provides guidance and STATA® routines for distributed micro-data analysis
of business dynamics. By aggregating confidential firm-level data from
national business registers, DynEmp provides new comparative, empirical
evidence on the role of creative destruction, start-ups and young firms to
participating country performance. A range of OECD countries including
Australia, as well as other non-OECD countries such as Brazil and Puerto
Rico are currently participating. More detail on the DynEmp project can be
found here. Throughout this paper ‘participating’ countries is defined as
OECD and other countries currently in the DynEmp database.
7 Note that these numbers will be slightly higher than the ABS Counts of Australian Businesses
(cat. no. 8165.0) due to further scope differences applied to that ABS product.

The employment dynamics of Australian entrepreneurship 3
Box 1.2: The Expanded Analytical Business Longitudinal Database 2001–02 to
2012–13
The Expanded Analytical Business Longitudinal Database (EABLD) is a
statistical data integration project with the ABS as the Integrating Authority.
The development of the EABLD was funded by the Department of Industry
and Science.
The EABLD is the term used to describe a series of integrated, linked
longitudinal datasets that cover the period 2001–02 to 2012–13; it contains a
range of firm level information.
The EABLD is based on the Business Register and includes the population
of firms for each year. It uses the ABS statistical unit as the firm level unit
and large/complex firms are included. It includes business-level data from
administrative sources (predominantly ATO) and a range of ABS surveys
(including the Business Characteristics Survey, the Business R&D survey
and the Economic Activity Survey). The use of Business Activity Statement
data (sourced from the ATO) provides a basic set of financial information for
all businesses.
As it has been created retrospectively and not all information about firm
entries, exits and restructures is available, various methods have been
developed to ensure that there is a longitudinal perspective. Solutions have
also been developed in respect of the complexities of mapping the various
tax reporting structures to the ABS units model. This is essential to facilitate
the linking of directly collected ABS data into the EABLD.
Using the ABS statistical unit structure enables the EABLD to reflect the
industry composition which forms part of ABS economic statistics. The
EABLD allows for policy evaluation, research and analysis, and the
production of statistical outputs for a variety of firm performance
measures. As primary linking is undertaken using the ABN, other
administrative data also containing ABN can be linked to the EABLD.
More information on the EABLD and how to access it can be found here.8
8 http://www.abs.gov.au/ausstats/[email protected]/mf/8171.0?OpenDocument

The employment dynamics of Australian entrepreneurship 4
2. Results The following results from the EABLD refer to the period 2001–02 to 2011–12
unless otherwise stated. Due to data restrictions, all OECD comparisons are
limited to manufacturing, construction, and non-financial business services
and use OECD firm size definitions. All other analyses reflect the full
complement of industry sectors where possible, excluding government. For
detailed information on methodology see Box 1.2 and Appendix A.
Supplementary data is provided at Attachment B.
Box 2.1: Defining firms by age and size
We adopt the firm age definitions set out by the OECD. Young firms are
defined as firms aged between 0 and 5 years of age. Start-ups are a specific
subset of young firms within the first three years of operation (0–2 years
old).
Mature firms are defined as those firms aged 6 years and older. Old firms
are a specific subset of mature firms that are ten or more years old.
Firm size classes are defined in Table 2.1 below depending on the analysis.
Table 2.1: Defining firms by age
Standard Australian firm employment sizes (ABS definition)
Australian firm employment sizes used for OECD comparisons
Micro (0–4 employees) Micro (0–9 employees)
Small (5–19 employees) Small (10–49 employees)
Medium (20–199 employees) Medium (50–249 employees)
Large (200+ employees) Large (250+ employees)
Source: ABS (2001) Small Business in Australian, Cat. No. 1321.0 Criscuolo C, Gal PN &
Menon C (2014) The dynamics of employment growth: New evidence from 18 countries, OECD
Science, Technology and Industry Policy Papers no. 14, OECD Publishing,
http://dx.doi.org/10.1787/5jz417hj6hg6-en
2.1 Australia has a high and declining share of young firms,
particularly start-ups
The structure of Australian industry is characterised by a high proportion of
small firms. In terms of business counts, nearly all Australian firms could be

The employment dynamics of Australian entrepreneurship 5
considered small to medium enterprises (SMEs; 99.7 per cent). Micro and
small firms (with less than 50 employees) made up some 98 per cent of
Australian firms and accounted for 41 per cent of total employment over the
ten years 2001–02 to 2011–12. Australia also has a relatively high share of
micro businesses in the total firm population compared to other OECD
countries.9 Micro firms accounted for 87 per cent of all firms in the business
population but only around 16 per cent of total employment. The OECD
median share of micro-firms was 80.6 per cent.10
Sole-proprietor firms (with
no employees) account for a high share of firms in manufacturing (25 per
cent) and services (42 per cent) but account for a very small percentage of
total employment (0.4 per cent and 0.9 per cent of manufacturing and
services, respectively).
The lion’s share of Australian employment can be attributed to a relatively
small number of large firms. Large firms represent only 0.3 per cent of all
Australian firms but they account for some 40 per cent of employment, which
is broadly comparable to countries like France, UK, USA and Canada. This
general pattern is similar across many other OECD countries, in that most
firms are small but most employees work for medium and large firms.
Looking at firm age structure, the differences are more pronounced. Table B1
provides firm age and size data for the Australian Business population
between 2006 and 2011. Earlier years in the database cannot be included in
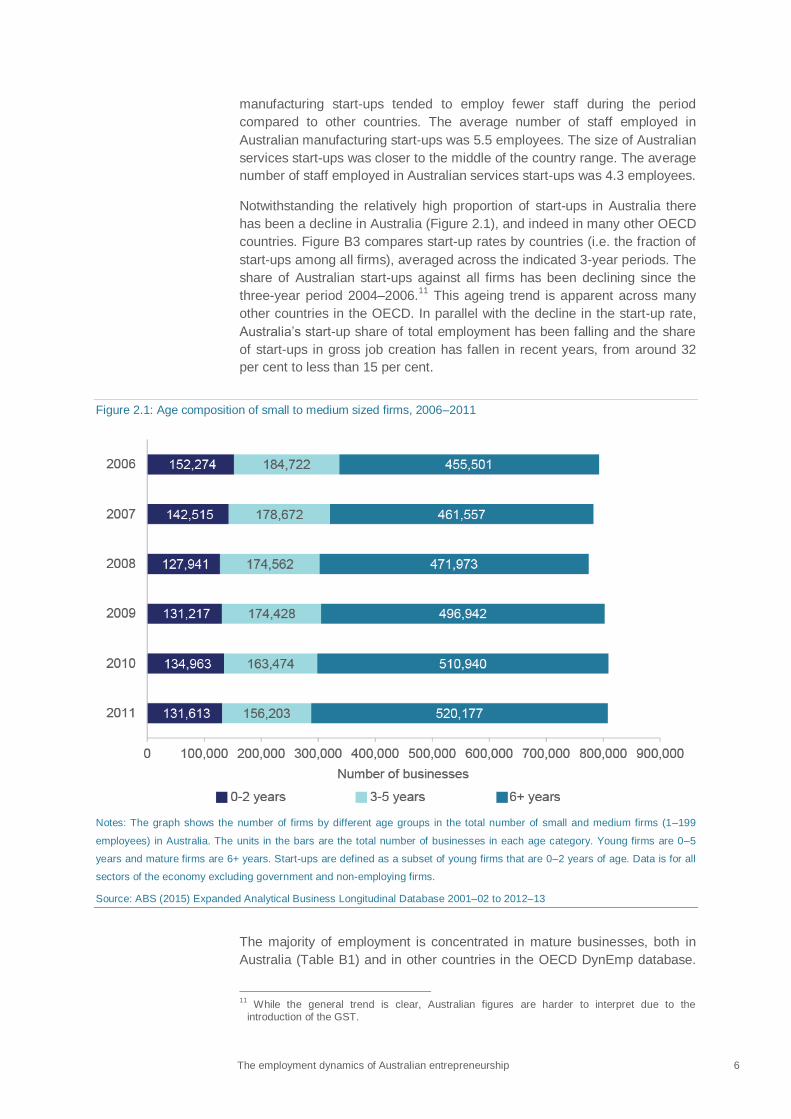
this table because mature firms (6+ years) cannot be identified. Figure 2.1
summarises the age profile of Australian employing SMEs (firms with 1–199
employees) over the same period. The proportion of firms that are young
(0–5 years of age) declined from 42.5 per cent (~337,000 firms) to 35.6 per
cent (~288,000 firms) over the period examined. Start-ups, according to the
OECD definition are firms 0–2 years of age. The proportion of SMEs that
were start-ups declined from 19.2 per cent (~152,000 firms) to 16.3 per cent
(~132,000 firms) between 2006 to 2011 (Figure 2.1). Most large firms are
mature (6+ years old) and stable at around 90 per cent of all large firms
(Table B1).
Unlike the Australian data presented in this report, OECD comparisons are
limited to manufacturing, construction and non-financial service sectors. By
international standards, Australia has a relatively high proportion of small
firms that are start-ups. Some 33 per cent of firms with less than 50
employees were aged less than 3 years in Australia. Within the sample, this
is second only to Brazil, where the fraction of start-ups in SMEs was 40 per
cent (Figure B1). The relatively high share of start-ups among Australian
firms can also be seen in the manufacturing and services sectors (Figure B2).
The share of manufacturing firms aged less than 3 years was around 24 per
cent, which is relatively high compared to most other countries over the 10–
year period. Similarly, the services sector also exhibits a relatively high share
of young firms, where some 33 per cent of firms could be classified as start-
ups (Figure B1).
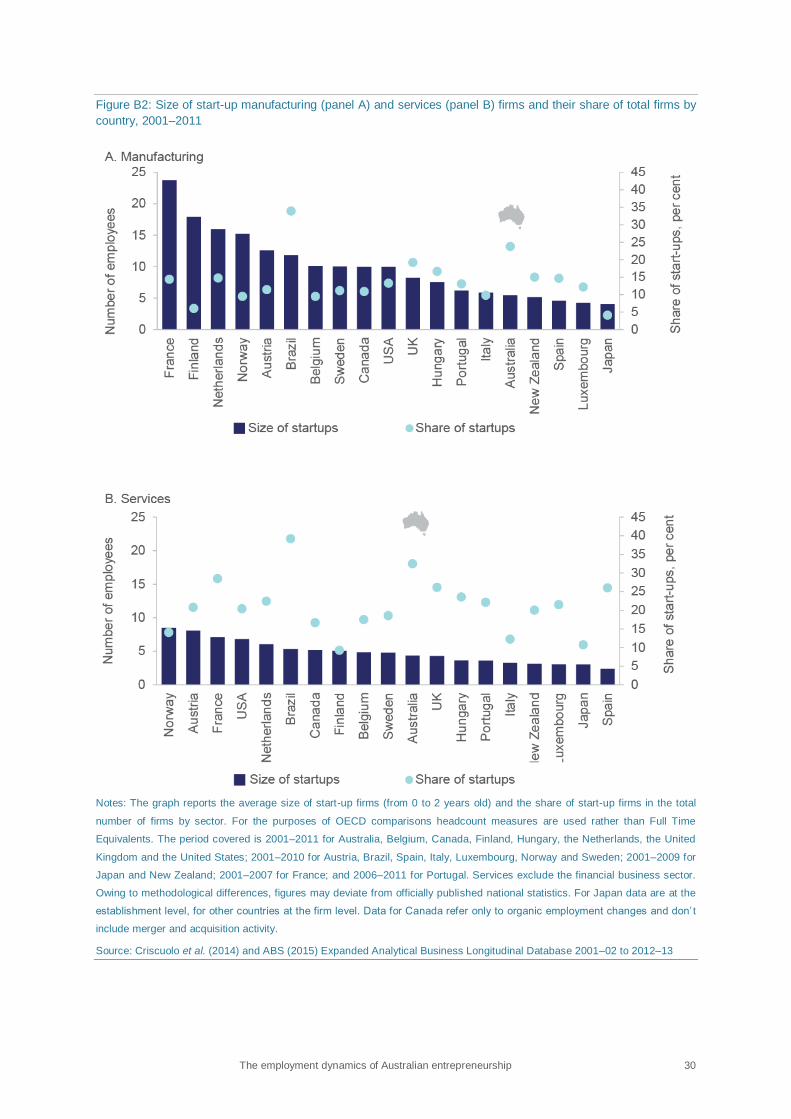
There is considerable diversity among countries in the average number of
people employed by manufacturing start-ups (Figure B2). Australian
9 Those firms with 0–9 employees according to the OECD.
10 Criscuolo et al. (2014)
The employment dynamics of Australian entrepreneurship 6
manufacturing start-ups tended to employ fewer staff during the period
compared to other countries. The average number of staff employed in
Australian manufacturing start-ups was 5.5 employees. The size of Australian
services start-ups was closer to the middle of the country range. The average
number of staff employed in Australian services start-ups was 4.3 employees.
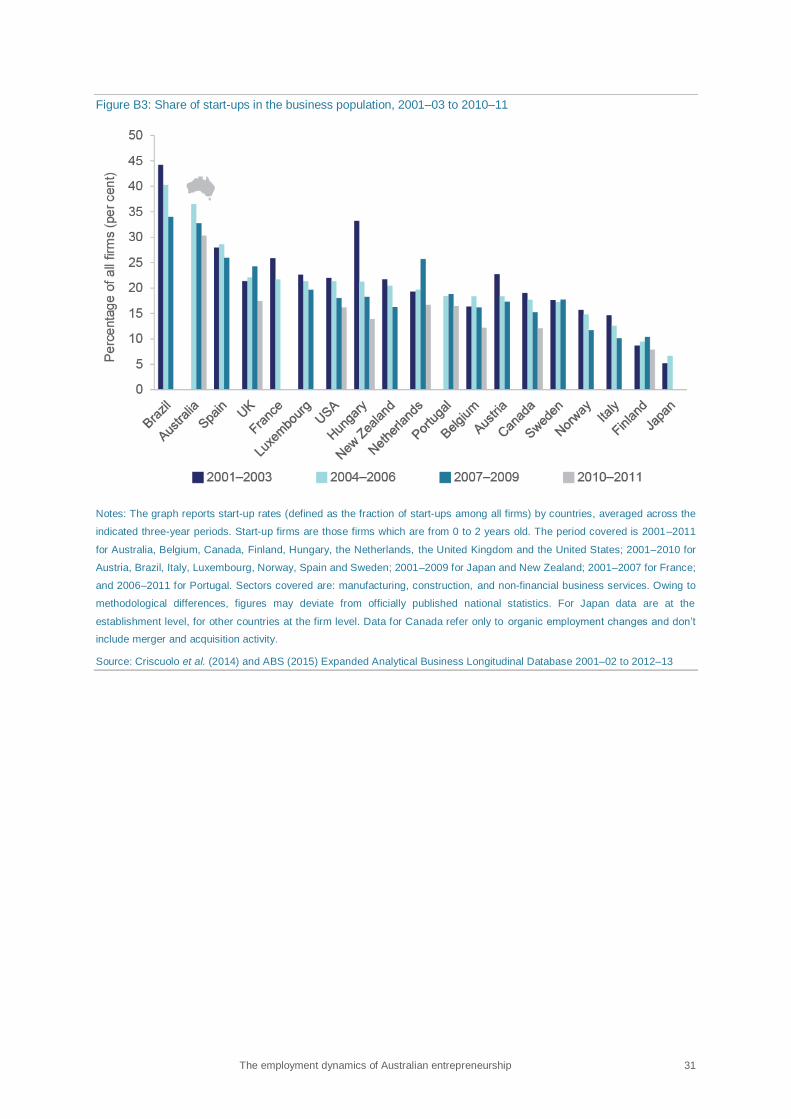
Notwithstanding the relatively high proportion of start-ups in Australia there
has been a decline in Australia (Figure 2.1), and indeed in many other OECD
countries. Figure B3 compares start-up rates by countries (i.e. the fraction of
start-ups among all firms), averaged across the indicated 3-year periods. The
share of Australian start-ups against all firms has been declining since the
three-year period 2004–2006.11
This ageing trend is apparent across many
other countries in the OECD. In parallel with the decline in the start-up rate,
Australia’s start-up share of total employment has been falling and the share
of start-ups in gross job creation has fallen in recent years, from around 32
per cent to less than 15 per cent.
Figure 2.1: Age composition of small to medium sized firms, 2006–2011
Notes: The graph shows the number of firms by different age groups in the total number of small and medium firms (1–199
employees) in Australia. The units in the bars are the total number of businesses in each age category. Young firms are 0–5
years and mature firms are 6+ years. Start-ups are defined as a subset of young firms that are 0–2 years of age. Data is for all
sectors of the economy excluding government and non-employing firms.
Source: ABS (2015) Expanded Analytical Business Longitudinal Database 2001–02 to 2012–13
The majority of employment is concentrated in mature businesses, both in
Australia (Table B1) and in other countries in the OECD DynEmp database.
11
While the general trend is clear, Australian figures are harder to interpret due to the
introduction of the GST.
The employment dynamics of Australian entrepreneurship 7
In Australia, in 2011, mature employing businesses accounted for almost
6 million Full Time Equivalent (FTE) jobs or 84.2 per cent of all employment.
This is for all sectors of the economy.
Across all countries examined to date, around 63 per cent of manufacturing,
construction and non-financial sector firms were mature (aged 6 years or
more), and these accounted for nearly 80 per cent of total employment for
those sectors (Figure B4). Australian mature firms (aged 6+ years) showed
relatively smaller shares of overall firms (48 per cent) and employment
(71 per cent) than other countries, respectively, but the pattern is broadly
consistent with other participating countries (Figure B4).
The share of young firms (0–5 years old) in the total number of all firms was
lower, compared to mature firms, as was their share of employment. This
pattern is similar both in Australia and across other countries examined by
the OECD (Figure B4). However, differences between countries do exist in
the relative magnitudes. Australian start-ups (firms aged 0–2 years)
accounted for 34 per cent of all firms in the subpopulation over the period,
which is relatively higher than the average of other countries in the OECD
DynEmp database (20 per cent).
2.2 Young SMEs contribute disproportionately to job creation
Over the period 2006 to 2011 we estimate that 1.04 million full time
equivalent jobs were added to the economy. Young SMEs are responsible for
the majority of this net growth having added 1.12 million jobs in that period
(Figure 2.2).
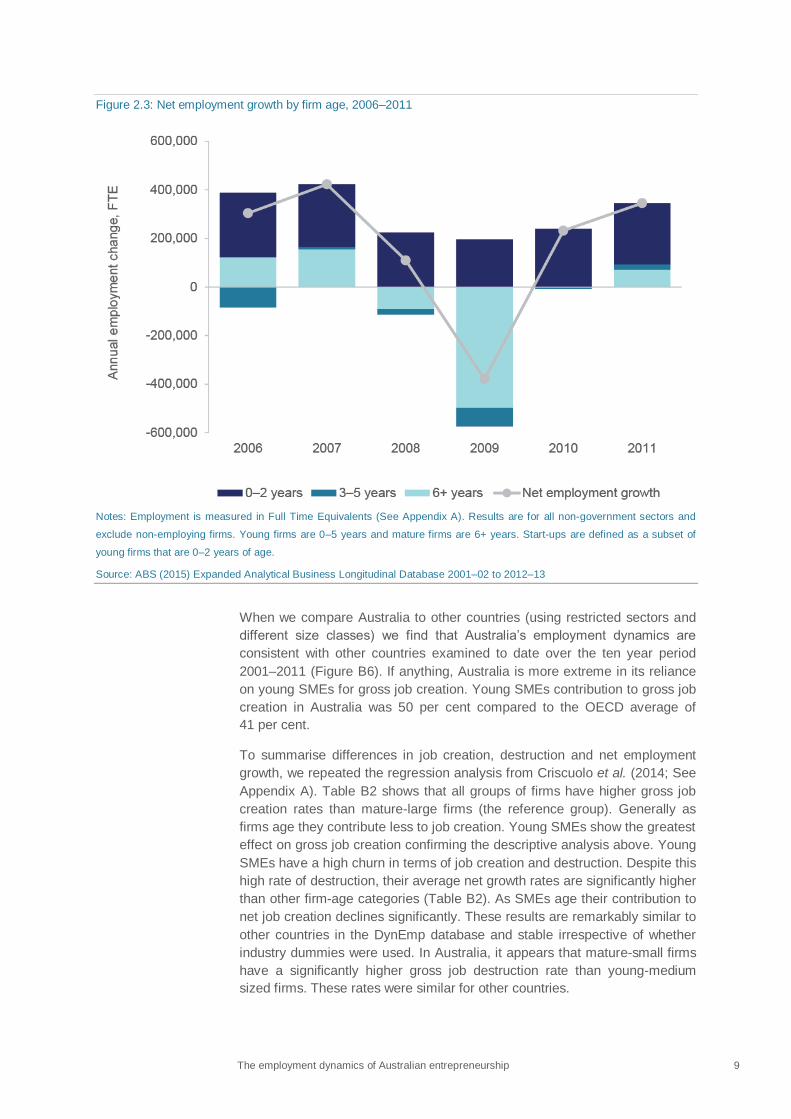
Figure 2.3 shows net job creation by age over the same period 2006–2011.
Most of the job creation was undertaken by start-ups of any size. Start-ups
(firms aged 0–2 years) added approximately 1.44 million jobs to the economy
whereas older firms (3+ years) shed just over 400,000 jobs over the same
period (Figure 2.3; Table B1). Figure B5 shows that firm entry and immediate
post-entry growth dominate gross job creation. For example, in 2011, young
firms added ~275,000 jobs to the economy. Firm entry added ~154,000 jobs
in 2011, just over half of all young SME firm employment creation. Mature
firms by contrast added ~53,000 jobs to the economy.

The employment dynamics of Australian entrepreneurship 8
Figure 2.2: Net employment creation, gross employment creation and gross employment destruction by firm age
and size, 2006–2011
Notes: Employment is measured in Full Time Equivalents (See Appendix A). Results are for all non-government sectors and
exclude non-employing firms. Young firms are 0–5 years and mature firms are 6+ years.
Source: ABS (2015) Expanded Analytical Business Longitudinal Database 2001–02 to 2012–13
The 2006–2011 period examined is unusual in that it covers a significant
economic downturn when a lot of jobs were lost (Figure 2.3). The data shows
that through the global financial crisis start-ups maintained net positive
employment growth whereas older firms became net job destroyers
(Figure 2.3). Net employment loss during this period was driven by
downsizing rather than exit of firms (Figure B5).
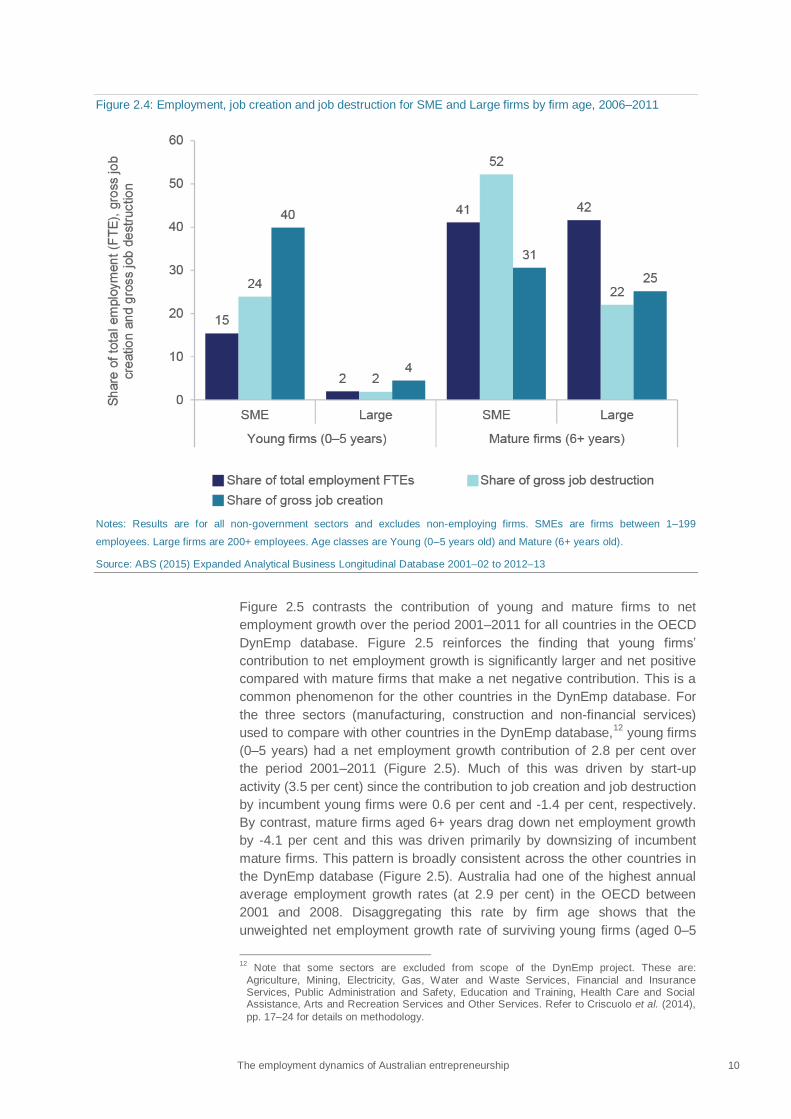
Despite having a relatively lower share in total employment, younger firms —
and especially smaller ones — contribute disproportionately to job creation
(Figure 2.4). Over the period 2006–2011, the largest contribution to job
creation in Australia (40 per cent) came from young SMEs: firms aged 0–5
years that had 1–199 employees and accounted for only 15 per cent of total
employment. By contrast, mature Australian SMEs showed the highest rate
of job destruction (52 per cent) but their share of employment (41 per cent)
was also higher than young SMEs. Large Australian firms (with 200+
employees) tended to have lower rates of both job creation and job
destruction, compared to smaller firms. Large, mature firms aged 6+ years
accounted for 42 per cent of total employment but only 25 per cent of gross
job creation (Figure 2.4).
The employment dynamics of Australian entrepreneurship 9
Figure 2.3: Net employment growth by firm age, 2006–2011
Notes: Employment is measured in Full Time Equivalents (See Appendix A). Results are for all non-government sectors and
exclude non-employing firms. Young firms are 0–5 years and mature firms are 6+ years. Start-ups are defined as a subset of
young firms that are 0–2 years of age.
Source: ABS (2015) Expanded Analytical Business Longitudinal Database 2001–02 to 2012–13
When we compare Australia to other countries (using restricted sectors and
different size classes) we find that Australia’s employment dynamics are
consistent with other countries examined to date over the ten year period
2001–2011 (Figure B6). If anything, Australia is more extreme in its reliance
on young SMEs for gross job creation. Young SMEs contribution to gross job
creation in Australia was 50 per cent compared to the OECD average of
41 per cent.
To summarise differences in job creation, destruction and net employment
growth, we repeated the regression analysis from Criscuolo et al. (2014; See
Appendix A). Table B2 shows that all groups of firms have higher gross job
creation rates than mature-large firms (the reference group). Generally as
firms age they contribute less to job creation. Young SMEs show the greatest
effect on gross job creation confirming the descriptive analysis above. Young
SMEs have a high churn in terms of job creation and destruction. Despite this
high rate of destruction, their average net growth rates are significantly higher
than other firm-age categories (Table B2). As SMEs age their contribution to
net job creation declines significantly. These results are remarkably similar to
other countries in the DynEmp database and stable irrespective of whether
industry dummies were used. In Australia, it appears that mature-small firms
have a significantly higher gross job destruction rate than young-medium
sized firms. These rates were similar for other countries.
The employment dynamics of Australian entrepreneurship 10
Figure 2.4: Employment, job creation and job destruction for SME and Large firms by firm age, 2006–2011
Notes: Results are for all non-government sectors and excludes non-employing firms. SMEs are firms between 1–199
employees. Large firms are 200+ employees. Age classes are Young (0–5 years old) and Mature (6+ years old).
Source: ABS (2015) Expanded Analytical Business Longitudinal Database 2001–02 to 2012–13
Figure 2.5 contrasts the contribution of young and mature firms to net
employment growth over the period 2001–2011 for all countries in the OECD
DynEmp database. Figure 2.5 reinforces the finding that young firms’
contribution to net employment growth is significantly larger and net positive
compared with mature firms that make a net negative contribution. This is a
common phenomenon for the other countries in the DynEmp database. For
the three sectors (manufacturing, construction and non-financial services)
used to compare with other countries in the DynEmp database,12
young firms
(0–5 years) had a net employment growth contribution of 2.8 per cent over
the period 2001–2011 (Figure 2.5). Much of this was driven by start-up
activity (3.5 per cent) since the contribution to job creation and job destruction
by incumbent young firms were 0.6 per cent and -1.4 per cent, respectively.
By contrast, mature firms aged 6+ years drag down net employment growth
by -4.1 per cent and this was driven primarily by downsizing of incumbent
mature firms. This pattern is broadly consistent across the other countries in
the DynEmp database (Figure 2.5). Australia had one of the highest annual
average employment growth rates (at 2.9 per cent) in the OECD between
2001 and 2008. Disaggregating this rate by firm age shows that the
unweighted net employment growth rate of surviving young firms (aged 0–5
12
Note that some sectors are excluded from scope of the DynEmp project. These are:
Agriculture, Mining, Electricity, Gas, Water and Waste Services, Financial and Insurance Services, Public Administration and Safety, Education and Training, Health Care and Social Assistance, Arts and Recreation Services and Other Services. Refer to Criscuolo et al. (2014),
pp. 17–24 for details on methodology.

The employment dynamics of Australian entrepreneurship 11
years) was 12.2 per cent between 2001 and 2011. By contrast the
unweighted net employment growth rate of mature firms (6+ years) was
significantly lower at 1.4 per cent over the same period. The net growth gap
between these young, surviving and mature firms is one of the highest
among the countries in the DynEmp database (data not shown).
Figure 2.5: Net employment growth contributions by incumbent and entry/exit activity and by firm age, as a
percentage of aggregate non-financial sector employment, 2001–2011
Notes: Contributions are calculated as the net job creation by the group over total employment in manufacturing, non-financial
business services and construction averaged across all available years. Young firms are aged 0–5 years old, mature firms are
6+ years old. For the purposes of OECD comparisons headcount measures are used rather than Full Time Equivalents. The
period covered is 2001–2011 for Australia, Belgium, Canada, Finland, Hungary, the Netherlands, the United Kingdom and the
United States; 2001–2010 for Austria, Brazil, Spain, Italy, Luxembourg, Norway and Sweden; 2001–2009 for Japan and New
Zealand; 2001–2007 for France; and 2006–2011 for Portugal. Owing to methodological differences, figures may deviate from
officially published national statistics. For Japan data are at the establishment level, for other countries at the firm level. Data for
Canada refer only to organic employment changes and exclude merger and acquisition activity.
Source: Criscuolo et al. (2014) and ABS (2015) Expanded Analytical Business Longitudinal Database 2001–02 to 2012–13
2.3 Start-up activity and performance in Australia
At this point the definition of start-up moves away from the static definition
(firms aged 0–2 years) to firm entry: any firm that is newly created in any
given year. In this section we track the performance of start-ups over time
from birth to three years of age. In this section we are looking at start-ups of
all sizes.
Normalised net job creation by surviving entrants shows the average number
of jobs created by surviving start-ups over a three year period. This is
normalised by dividing this number by the total employment in Australia at the
The employment dynamics of Australian entrepreneurship 12
beginning of the three year period. The analytical approach used by the
OECD13
to identify cross-country differences in the dynamics of firm survival
and growth consists of decomposing normalised net job creation from
surviving start-ups into four main components (See Appendix A).
1. Start-up ratio, the number of entrants relative to the country’s total employment. This can be considered a measure of entrepreneurship in the economy.
2. Survival share, the number of businesses that survive until or beyond the third year of life over the total number of starting businesses. This measure captures the extent to which the selection process is affecting the survival probability of entrants.
3. Average size at entry, the average number of employees for entrants that survive until or beyond the third year of life. This measure might reflect, inter alia, low entry barriers.
4. Average post-entry growth, measured as the final over initial employment ratio of surviving entrants. This measure reflects the growth performance of surviving start-ups.
In order to make international comparisons, Table 2.1 only provides start-up
data for the three macro-sectors Manufacturing, Construction and Non-
financial business services as defined by the OECD. We have expanded this
analysis to include much more detailed sectoral comparisons for all Australia
industries (See Table B3).
In Australia, net job creation by entrants that survive at least three years
represent 4.9 per cent of overall employment. In other words for every 100
jobs in Australia in any given year start-ups will, on average, add 5 jobs within
the following three years. This value varies by sector from as low as 0.5 per
cent to as high as 8.2 per cent (Table B3). This value also changes over time
and had a notable dip during the global financial crisis (Table 2.1). Australia
has relatively high normalised net job creation compared to other OECD
countries, which range between 1 per cent and 5 per cent.
Net job creation by surviving micro (0–9 employee) start-ups (at 144 per cent)
is large enough to more than compensate for the job destruction of those
start-ups that exit within five years, despite only representing 45 per cent of
the total start-up cohort that entered the economy (Table B3).
Table 2.1 shows that the start-up rate was close to 20 start-ups per 1,000
employees in the working population in 2003. Around the global financial
crisis the start-up rate fell to 12 and bounced back in 2010 to 15 (Table 2.1).
The latest year 2012 showed a fall in the start-up rate to 11.5 start-ups per
1,000 employees consistent with Figure 1. Australia has a relatively high
average start-up ratio compared with other OECD countries which range
between 3 and 23 start-ups per 1,000 employees.14
Of the sectors covered in
the analysis the data shows that start-up rates are low in manufacturing and
high in selected service sectors of the economy. Sectors with very high start-
up rates (>35 start-ups per 1,000 employees) were Fishing, Hunting and
13
See the Technical Appendix of OECD (2015) DYNEMP V.2 Progress report: Cross-country
evidence on start-up dynamics, DSTI/IND(2015)5 14
At the time of this publication only 12 other OECD countries were included in the cross-country analysis by the OECD. See OECD (2015) DYNEMP V.2 Progress report: Cross-country
evidence on start-up dynamics, DSTI/IND(2015)5
The employment dynamics of Australian entrepreneurship 13
Trapping, Building construction and Construction services, Non-store retailing
and Retail commission-based buying and/or selling, Internet publishing and
broadcasting, Insurance and Superannuation funds, Property operators and
real estate services and Creative and performing arts (Table B3). Metal ore
mining, Pulp & paper manufacturing and some health and education sectors
show low start-up rates (Table B3).
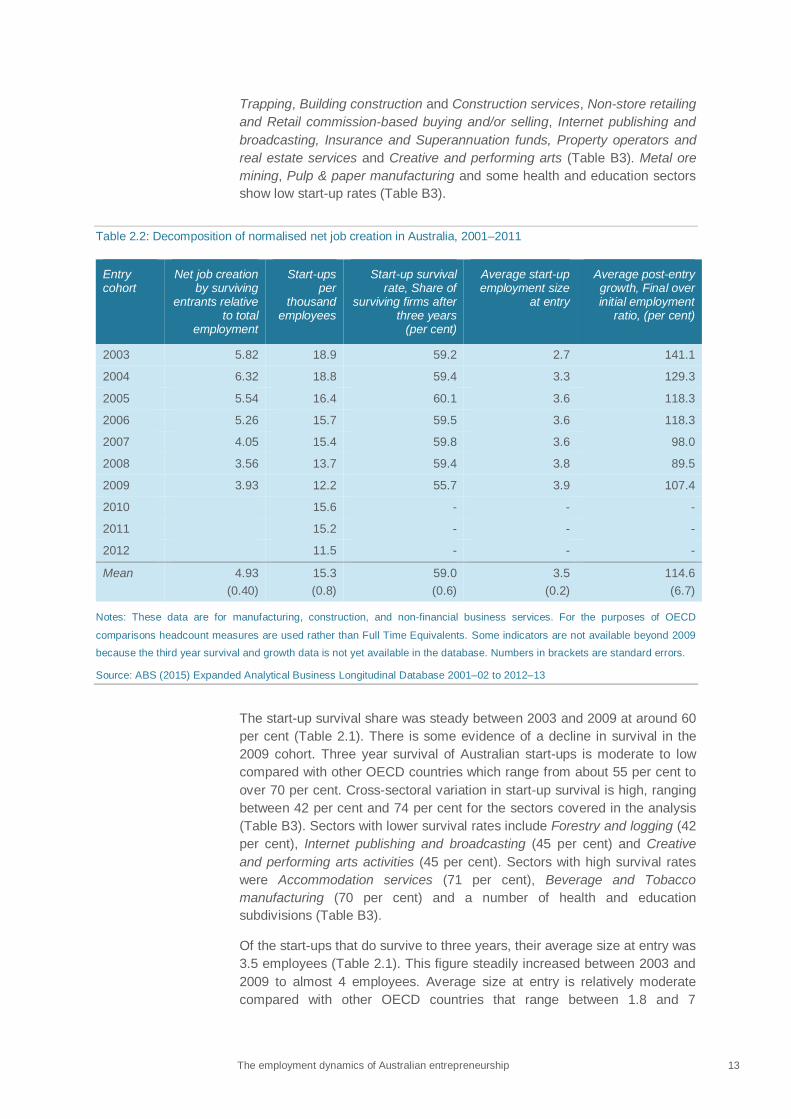
Table 2.2: Decomposition of normalised net job creation in Australia, 2001–2011
Entry cohort
Net job creation by surviving
entrants relative to total
employment
Start-ups per
thousand employees
Start-up survival rate, Share of
surviving firms after three years
(per cent)
Average start-up employment size
at entry
Average post-entry growth, Final over initial employment
ratio, (per cent)
2003 5.82 18.9 59.2 2.7 141.1
2004 6.32 18.8 59.4 3.3 129.3
2005 5.54 16.4 60.1 3.6 118.3
2006 5.26 15.7 59.5 3.6 118.3
2007 4.05 15.4 59.8 3.6 98.0
2008 3.56 13.7 59.4 3.8 89.5
2009 3.93 12.2 55.7 3.9 107.4
2010 15.6 - - -
2011 15.2 - - -
2012 11.5 - - -
Mean 4.93
(0.40)
15.3
(0.8)
59.0
(0.6)
3.5
(0.2)
114.6
(6.7)
Notes: These data are for manufacturing, construction, and non-financial business services. For the purposes of OECD
comparisons headcount measures are used rather than Full Time Equivalents. Some indicators are not available beyond 2009
because the third year survival and growth data is not yet available in the database. Numbers in brackets are standard errors.
Source: ABS (2015) Expanded Analytical Business Longitudinal Database 2001–02 to 2012–13
The start-up survival share was steady between 2003 and 2009 at around 60
per cent (Table 2.1). There is some evidence of a decline in survival in the
2009 cohort. Three year survival of Australian start-ups is moderate to low
compared with other OECD countries which range from about 55 per cent to
over 70 per cent. Cross-sectoral variation in start-up survival is high, ranging
between 42 per cent and 74 per cent for the sectors covered in the analysis
(Table B3). Sectors with lower survival rates include Forestry and logging (42
per cent), Internet publishing and broadcasting (45 per cent) and Creative
and performing arts activities (45 per cent). Sectors with high survival rates
were Accommodation services (71 per cent), Beverage and Tobacco
manufacturing (70 per cent) and a number of health and education
subdivisions (Table B3).
Of the start-ups that do survive to three years, their average size at entry was
3.5 employees (Table 2.1). This figure steadily increased between 2003 and
2009 to almost 4 employees. Average size at entry is relatively moderate
compared with other OECD countries that range between 1.8 and 7
The employment dynamics of Australian entrepreneurship 14
employees. The Australian average size data hides significant sectoral
variation over time (Table B3). Sectors where start-up rates are high typically
have low average entry sizes and vice versa.
Average post-entry growth of start-ups was 114.6 per cent (Table 2.1). This
figure represents a final over initial employment ratio for firms that survive to
three years. A score higher than 100 per cent shows post-entry growth.
Australia’s average post-entry growth rate is low compared to most other
OECD countries examined to date (ranging from 110 per cent to 240 per
cent). Australia’s average post-entry growth has been declining over the
period measured, with a notable fall during the global financial crisis, and a
return to moderate net employment growth for firms entering the economy in
2009.
Most firms that survive three years either grow marginally or retain their staff
numbers at entry levels (~100 per cent). In some sectors, if they manage to
survive, the reduction in employment is significant. For example, Motion
picture and sound recording activities (34 per cent), Creative and performing
arts activities (75 per cent) and Insurance and Superannuation Funds (73 per
cent) shed employees (Table B3). Contingent on survival, mining sector firms
show high relative employment growth as do Air and Space Transport and
Warehousing and Storage Services. This indicator is more variable than
other sub-components. The growth prospects of start-ups varied significantly
by cohort birth date. For example, Metal ore mining start-ups showed a high
average post-entry growth (432 per cent) but varied dramatically between
1,682 per cent and 127 per cent for the seven cohorts studied.
2.4 Micro-start-up performance
This section takes a closer look at micro-sized start-ups (new firms created
with 0–9 employees). We followed a number of cohorts of micro-sized start-
ups over five years post-entry. After five years we compare the performance
of those surviving firms in the start-up cohort that stayed in the same size
range (0–9 employees) with those in the cohort that grew in employment into
10–19 and 20+ employee categories. We call these latter firms high growth
micro-start-ups for the purposes of this paper (See Appendix A for more
detail).
Most micro-start-ups do not survive and even fewer grow. So where does the
employment growth come from? We analysed micro-start-ups as a more
accurate representation of organic or de novo entrepreneurship and avoid the
influence of mergers/acquisitions by large firms influencing the result. As
shown earlier in the paper, micro-sized start-ups, like other start-ups are net
job creators at the intensive margin. This is a consistent result across almost
all two-digit industries observed in Australia (Table B3). Across almost all
industries in Australia, net job creation by surviving start-ups is large enough
to more than compensate for the job destruction that comes from exiting
start-ups. This result is consistent with other OECD countries studied to date
where job creation rates range between 95 per cent and 190 per cent.15
However, hidden under the aggregate data is high sectoral variation in the
extent to which they contribute to job creation. In Mining sectors for example,
15
Menon et al. (2015)
The employment dynamics of Australian entrepreneurship 15
the jobs created by surviving micro-start-ups (intensive margin) can be up to
six times that of initial micro-start-up employment (extensive margin; Table
B3).16
Figure 2.6A shows that a very small fraction of the surviving micro-sized
start-ups are responsible for most of the job creation by all micro-start-ups
over a five year period. Although representing only 3.2 per cent of all micro-
start-ups they accounted for 77 per cent of gross job creation by surviving
micro-start-ups over five years. This result is very similar to results for other
OECD countries (generally less than 5 per cent). For most sectors of the
economy, these firms grow dramatically after five years to more than
compensate for the job destruction of exiting micro-start-ups.
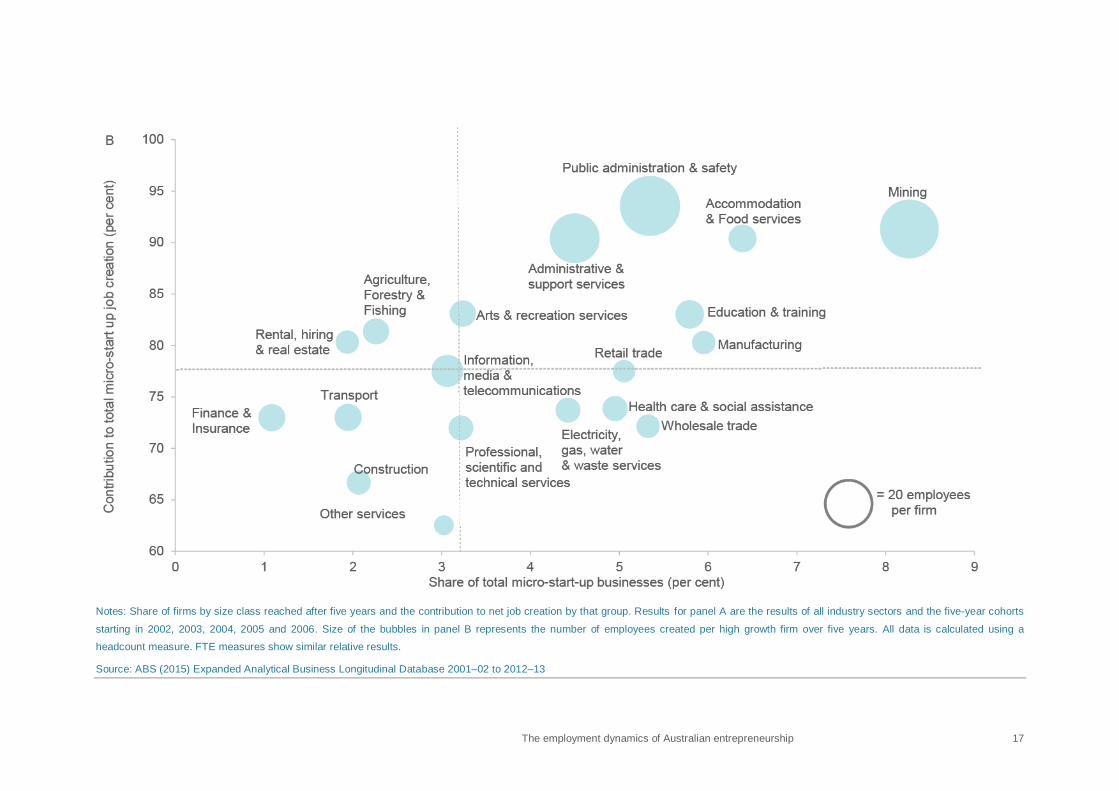
Figure 2.6B shows that the disproportionate contribution of high growth
micro-start-ups varies by industry (62.5 to 93.6 per cent; Figure 2.6B; See
also Table B3). For example, micro-sized mining firms that both survived and
grew into a higher size class totalled 8.3 per cent of all micro-entrants in that
sector and also accounted for 93.6 per cent of micro-firms’ contribution to
total employment growth for that sector. The construction sector is at the
other end of the spectrum with a lower percentage of high growth micro-start-
ups and, perhaps not surprisingly, a lower contribution to employment growth
for the sector. Figure 2.6B also shows that the average employment
contribution per high-growth micro-start-up varies by sector. Mining and
Public administration & safety have double the employment growth per firm
that Retail trade and Wholesale trade have.17
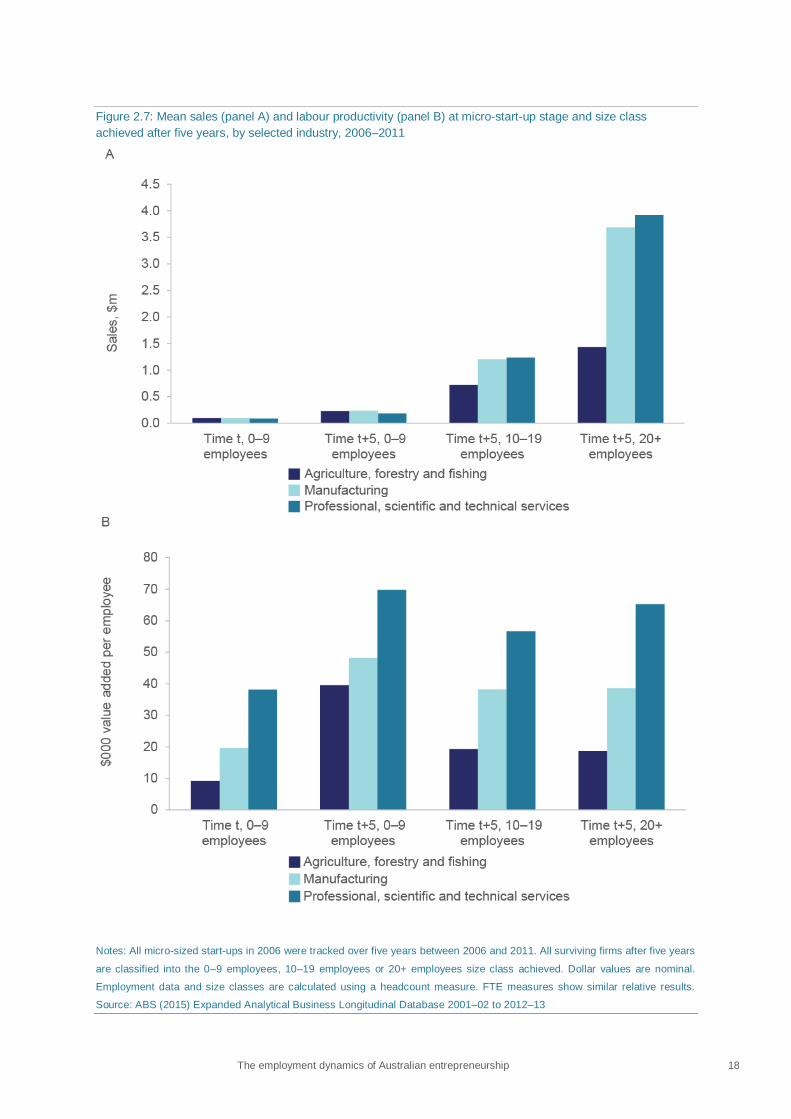
When we further analysed the performance of these high growth micro-start-
ups created in 2006 we found that, not surprisingly, these firms exhibited
superior sales, gross operating profit, employment, value added and capital
expenditure performance compared with surviving micro-start-ups firms that
were stable or grew marginally over the same period (Figure 2.7A; Tables B4
to B6).18
While the lower ranges on these performance measures were often
similar the upper ranges were significantly different. These results were
common to all industry divisions in Australia and across earlier cohorts
studied (data not shown).
Labour productivity of surviving micro-start-ups was higher after five years
consistent with the trends noted by Nyugen & Hansell (2014). Despite high
performance in every other measure, high growth micro-start-ups typically
had lower or at best equal labour productivity performance compared to the
surviving start-ups that did not grow much (Figure 2.7B; Table B5).
Additionally the productivity dispersion was higher in the low growth start-up
cohort compared to the high growth cohort after five years. While the
absolute labour productivity values varied by industry, the relative differences
were similar across all industries and micro-start-up cohorts observed.
16
See comment on the Mining boom in the Discussion. 17
Administrative and Support Services also has double the employment growth per firm but this
result is in part due to labour recruitment services filing PAYG data for employees they place in different firms.
18 The relative differences are the same regardless of CPI or GDP adjustment as we don’t have
industry specific deflators.

The employment dynamics of Australian entrepreneurship 16
Figure 2.6: Five year post-entry dynamics of micro-sized start-ups by share of firms (all sector, panel A) and by industry (panel B), 2002–2011
The employment dynamics of Australian entrepreneurship 17
Notes: Share of firms by size class reached after five years and the contribution to net job creation by that group. Results for panel A are the results of all industry sectors and the five-year cohorts
starting in 2002, 2003, 2004, 2005 and 2006. Size of the bubbles in panel B represents the number of employees created per high growth firm over five years. All data is calculated using a
headcount measure. FTE measures show similar relative results.
Source: ABS (2015) Expanded Analytical Business Longitudinal Database 2001–02 to 2012–13
The employment dynamics of Australian entrepreneurship 18
Figure 2.7: Mean sales (panel A) and labour productivity (panel B) at micro-start-up stage and size class
achieved after five years, by selected industry, 2006–2011
Notes: All micro-sized start-ups in 2006 were tracked over five years between 2006 and 2011. All surviving firms after five years
are classified into the 0–9 employees, 10–19 employees or 20+ employees size class achieved. Dollar values are nominal.
Employment data and size classes are calculated using a headcount measure. FTE measures show similar relative results.
Source: ABS (2015) Expanded Analytical Business Longitudinal Database 2001–02 to 2012–13

The employment dynamics of Australian entrepreneurship 19
3. Discussion This paper shows that young SMEs contribute disproportionately to net
employment creation in Australia. Jobs growth in Australia is generated by
firms of all ages and sizes but it is young firms, particularly high growth start-
ups that are the engine of employment growth.
Over the ten year reference period, young SMEs made the highest
contribution to net job creation in Australia (50 per cent) and start-up activity
is responsible for approximately half of this growth. It is a very small fraction
(3 per cent) of surviving start-ups that go on to generate most (77 per cent) of
the employment growth in young firms. Job creation by these high growth
micro-start-ups is more than enough to compensate for gross job destruction
by exiting start-ups and downsizing mature firms. Start-up activity is therefore
critical for employment growth in Australia. The data shows that an ‘up or out’
dynamic generally holds true for job growth in Australian firms, consistent
with the findings of all other countries studied to date.19,20
However, the start-
up data (See section 2.3) for Australia suggests that we are more likely to go
‘out’ than we are to go ‘up’ compared to the OECD median. More countries in
the OECD DynEmp database will confirm this result. Observing all sectors
shows that key information on the performance of a resource-driven country
like Australia can be missed by a narrow focus on manufacturing and
services. The data on employment dynamics shows the high impact that the
mining boom had on firm creation, survival and growth in that sector.
Australia has relatively healthy entrepreneurship and creative-destruction
compared with other OECD countries. Start-ups occupy a relatively high
share of total firms, implying that Australia’s firm environment is more
dynamic compared to a number of other OECD countries. These results are
consistent with other reports that show Australia has relatively high
entrepreneurial intentions, a high rate of firm creation and low regulatory
barriers to entrepreneurship.21
This paper highlights the significance of start-up firms to net job creation in
Australia. However the importance of start-ups to the Australian economy has
been declining over the decade examined: The share of start-ups in the
economy, their share of employment and their contribution to gross job
creation, while still high compared to other OECD countries fell significantly.
One explanation worth further research is whether industry composition is
changing over the ten year period such that some sectors of the economy
explain the slowing start-up activity.
The declining rate of entrepreneurship is also observed across all OECD
countries examined to date, suggesting a global phenomenon rather than a
specifically Australian issue. It has been argued that firm
ageing/consolidation represents a slowing in the rate of creative-destruction
and re-allocation dynamics.22
The global financial crisis will have influenced
the downward trend to some extent across all OECD countries examined to
19
Countries examined include Austria, Belgium, Brazil, Denmark, Finland, France, Hungary, Italy, Japan, Luxembourg, the Netherlands, New Zealand, Norway, Portugal, Spain, Sweden,
the United Kingdom and the United States. 20
Criscuolo et al. (2014), Menon et al. (2015) 21
Department of Industry (2014), Steffens & Hechavarria (2015) 22
Decker et al .(2014)
The employment dynamics of Australian entrepreneurship 20
date. However, Hathaway & Litan (2014) show declining start-up activity in
the USA since the late 1970s with little evidence that business consolidation
is responsible for the decline. The unemployment rate in Australia generally
fell during the period we examined. Swanepoel & Harrison (2015) show that
the unemployment rate has a positive and statistically significant impact on
self-employment in Australia. The start-up rate data shown in this paper does
mimic aggregate unemployment trends over the same period as it does in
other OECD countries. Start-up activity is buffering against unemployment
during economic downturns.
High growth firms are found in all sectors of the economy. If net job creation
is a policy aim then being able to identify these high growth start-ups early is
critical. Understanding the internal capabilities of these high-growth firms and
how they grow is therefore a fruitful area of future research.
Australia’s national average post-survival growth prospects are relatively low
compared with other OECD countries. The efficiency of resource reallocation
may be relatively low in Australia or competition may be particularly high.
This needs further testing and validation. Criscuolo et al. (2014) highlight the
importance of exogenous (outside-firm) factors such as bankruptcy laws and
the availability of finance that may be a constraint to this growth. In Australia,
most venture capital is poured into technology-driven ICT and life science
firms (ABS 2015) rather than the full range of sectors that exhibit high-growth
start-up dynamics. Venture capital and other formal sources of finance for
start-ups might be more supportive of other sectors if funds and deal flow
was higher and high information asymmetries were addressed in those
sectors.
Other North American and European countries studied by the OECD may
have certain market scale or access advantages. The OECD (2007) has
estimated that lower market access relative to the OECD average could
contribute negatively to GDP per capita by as much as 10 per cent in
Australia. A critical aspect of our future research will be to determine how
early, and the extent to which, these high-growth micro-start-ups access
international markets for either capital injections or export sales. Australia is a
relatively open economy. However, given our relatively younger and smaller
firms resource constraints factors may be locking up the growth potential of
Australian start-ups. The Export Council of Australia23
note that the highest
barriers to exporting firms are access to information relating to local culture,
firm practices and language; information about local regulations and
customer payment issues. Helping Australian born global start-ups overcome
these barriers may ease Australia’s growth constraint relative to other
countries.
There is a wealth of research that shows that persistent and large variation in
firm productivity exists within all industries and that firm productivity affects
firm profitability, survival and growth.24
The data we have presented here is
not entirely consistent with the OECD’s conceptual model of resource
reallocation and creative destruction: more innovative, more productive firms
capture resources from less innovative, less productive firms.
23
Export Council of Australia (2014) Australian International Firm Survey 2014,
http://www.export.org.au/eca/trade-insights/background 24
Syverson (2011)
The employment dynamics of Australian entrepreneurship 21
We demonstrate that after five years the high growth start-ups often have
lower labour productivity than the surviving start-ups that don’t grow. The use
of headcount measure rather than full time equivalents or hours worked does
not change this result.25
Revenue-based productivity measures often
understate true productivity differences, especially for newer firms where
more productive firms often have lower prices and are larger).26
Unfortunately
we are not able to observe plant-specific output prices across all industries
over such a long timeframe at this stage. Capital expenditures and
intermediate costs suggest that total factor productivity may exhibit the same
response as labour productivity. Future research will investigate whether
these observations hold for total factor productivity and whether there is a
trade-off between productivity and employment growth amongst firms of
different age and size classes within Australia.
We suggest the observed productivity differences may also be explained by
strategic decisions of start-up management and leadership. An important
management-related dimension is the role of learning, innovation investment
and risk-taking in differentiating start-up growth performance before
economies of scale diverge. Consistent with innovation and growth literature
we argue that high growth start-ups are able to develop a sustained and
unique market advantage early, which by definition, would come from the
introduction of new or significantly improved goods, services and methods for
organising production.27
If Syverson’s (2011) argument is correct then these
innovative firms are able to leverage productivity advantages faster and
displace less productive competitors quicker. Empirical evidence suggests
this is the case for Australian firms: innovation drives firm growth in
profitability, employment, economies of scope and productivity (see
Balasubramanian & Sivadasan 2011, Department of Industry 2014, Andrews
et al. 2014). Innovators are significantly more likely to invest in physical
capital, indicating in part the building of new productive capabilities through
technology adoption such as ICT (Department of Industry 2014). The data
presented in this paper shows high growth start-ups dramatically increase
their capital expenditure, indicating in part the building of new productive
capabilities through technology adoption such as ICT (see OECD 2015).
Among innovative firms, young and small firms can have higher innovation
intensities than mature firms as measured by the ratio of research and
development spending to sales.28
Our own ongoing research gives
compelling evidence that innovation capability underpins the observed firm-
employment dynamics thereby influencing productivity and employment
outcomes in the Australian economy. Our preliminary analysis shows that the
likelihood of innovation, employment, productivity growth and economies of
scope falls significantly as Australian firms’ age. R&D expenditure per
employee is significantly higher for young Australian firms ($50,000 per
employee) than mature firms (less than $30,000 per employee) across all
years in the period 2006–07 to 2011–12. Innovative firms are twice as likely to
generate employment growth as non-innovative firms (see Department of
Industry and Science 2014a). Our research shows over the period 2005–06 to
25
Use of an FTE measure changed the absolute scale of the results but not the relative
differences. 26
Haltiwanger & Syverson (2008) 27
Fagerberg 2013, Davidsson et al. (2013) 28
Acemoglu et al. (2013)
The employment dynamics of Australian entrepreneurship 22
2010–11 that R&D performing micro-firms (0–9 employees) were 26 per cent
more likely than non-R&D performing micro-firms to increase annual sales by
20 per cent or more. If innovation is so important for firm survival and growth
it may be logical to think that the high growth micro-start-ups invest more in
innovation or innovate more frequently. However, this assumption needs to
be tested empirically. We have observed that innovation is a useful proxy
indicator for the overall quality of a firm but innovative firms differ in just how
innovative they are. Looking at the productivity dispersion for both low and
high growth micro-start-ups we will likely find that the presence of innovation
is not exclusive to one particular cohort. Rather, more detailed investigation is
required into the extent to which new to market innovation is occurring in each
cohort and, as noted above, the extent to which each cohort competes in
international markets.
The second strategy dimension to consider is growth-orientation. Our data is
consistent with the majority of owners and managers of Australian start-ups
being self-employed or lifestyle entrepreneurs, i.e. opportunity based
entrepreneurs, opting for work-life balance versus ongoing wealth creation.29
Most surviving start-ups still double their sales in five years but do not to grow
much in employment. They keep their costs and re-investment low and focus
on being efficient and profitable. This is a viable and successful strategy for
many start-ups.
By contrast the high growth start-ups grow dramatically in all aspects of
production, implying high growth in market share. However, their output
growth does not keep pace with employment growth to the extent that any
inherent labour productivity advantage may be hidden compared with low
growth micro-startups. We suggest that these high growth firms are still in
their ascendancy even after five years (see Nyugen & Hansell 2014).
Owner/managers are hiring new staff and investing in physical and intangible
capital with the expectation of future returns thereby temporarily suppressing
revenue-based labour productivity. This may explain the inconsistency with
the prevailing economic argument and suggests that revenue-based labour
productivity may not always be the best indicator of performance when young
firms are in a rapid growth phase. Future research needs to track these firms
over their full lifecycle to assess if and when these firms achieve their
‘maximum’ productivity performance (See Coad et al. 2015). This data
suggests that labour productivity should always be considered with other
indicators of firm growth such as sales or employment when considering key
performance indicators for industry policies.
This paper explores a rich dataset from the perspective of employment
dynamics. This paper demonstrates how the Expanded Analytical Business
Longitudinal Database (EABLD) has unlocked an unprecedented level of
analytical capacity within the ABS, the Department of Industry and Science
and the research community more broadly. The EABLD is essentially a
longitudinal census of the business population with basic information such as
sales, value added, employment and has the capacity to be further
developed with additional datasets being added. These additional datasets
could be administrative enabling counterfactual evaluation of industry policies
at any level of government. The Department of Industry and Science, in
29
Steffens & Hechavarria (2015)

The employment dynamics of Australian entrepreneurship 23
collaboration with the Australian Bureau of Statistics, is now participating in
two major OECD firm dynamics projects and is undertaking a series of
research projects asking policy questions on the importance of R&D,
intellectual property, employee share schemes, innovation and
entrepreneurship to aggregate employment and productivity growth in
Australia.
The employment dynamics of Australian entrepreneurship 24
Appendix A Methodological notes The results presented here are based, in part, on tax data supplied by the
ATO to the ABS under the Taxation Administration Act 1953, which requires
that such data is only used for the purpose of administering the Census and
Statistics Act 1905. Any discussion of data limitations or weaknesses is in the
context of using the data for statistical purposes, and is not related to the
ability of the data to support the ATO's core operational requirements.
Legislative requirements to ensure privacy and secrecy of this data have
been adhered to. In accordance with the Census and Statistics Act 1905,
results have been confidentialised to ensure that they are not likely to enable
identification of a particular person or organisation.
A.1 Employment
We use an estimate of a full-time equivalent (FTE) employment measure
based on individual wages and the employer’s industry of origin. These
estimates are better aligned with the ABS Labour Force Series (cat no
6202.0) for employee hours worked and hours worked for individuals using
five waves of the Survey of Employee Earnings and Hours (cat no. 6306.0)
than the headcount measure.
For the purposes of OECD comparisons employment is a headcount
measure based on the number of unique ABN-Employee links in ATO annual
payment summaries. These data are then linked to the EABLD to align the
ABS units model and the ATO data structures. A consequence of this
definition is that employment totals will differ with official ABS measures of
employment in the Labour Force Survey as multiple job holders (either
concurrent or sequential in one year) will receive a payment summary from
each employer each year.
A.2 Scope
This paper provides data for the 2001–02 to 2011–12 years from the EABLD.
The 2012–13 data was not included in the analysis at this stage because of
the need to quality check the robustness of the data from the 2012–13 year.
For the purposes of cross-country comparisons, the data is limited to
manufacturing, construction and service sectors excluding financial and
insurance services using the International Standard Industrial Classification.30
We also use OECD size class definitions to ensure comparability.
International comparisons are made on manufacturing, construction and non-
financial business services only. All other sectors are excluded from
international comparisons.
Where internal cross-sectoral comparisons are made, all ANZSIC6 sub-
divisions are used except 6, 7, 17, 26, 27, 47, 56, 60, 75, 76, and 96 due to
the small number of observations. These sectors are included in national
average analysis but excluded from descriptive statistics in order to maintain
confidentiality of information.
30
http://unstats.un.org/unsd/cr/registry/regcst.asp?Cl=27
The employment dynamics of Australian entrepreneurship 25
For the purposes of static comparisons start-ups are defined as firms that are
0–2 years old (Results sections1 and 2). For all other longitudinal or temporal
analyses start-ups are defined as firm entry.
Where the performance of growth and micro-sized start-ups are analysed in
Results section 4, we define micro-sized start-ups as business entries that
have 0–9 employees at time t. Medium and high growth micro-sized start-ups
are defined as micro-sized start-ups that at time t+5 have grown their
employment into the 10–19 employee and 20+ employee range, respectively.
A.3 Decomposition Analysis
The analytical approach used by the OECD31
to identify cross-country
differences in the dynamics of start-up survival and growth consists of
decomposing normalised net job creation by surviving entrants into four main
components.
1. Start-up ratio, 𝑁𝑟𝑈𝑛𝑖𝑡𝑎𝑡(𝑡+𝑗)
𝐸𝑀𝑃𝑡(𝑡), measured as the number of entrants relative to
the country’s total employment. This can be considered a measure of the role of entrepreneurship in the economy.
2. Survival share, 𝑁𝑟𝑈𝑛𝑖𝑡𝑠𝑎𝑡
𝑠𝑢𝑟𝑣(𝑡)
𝑁𝑟𝑈𝑛𝑖𝑡𝑎𝑡(𝑡), measured as the number of businesses that
survive until or beyond the third year of life over the total number of starting businesses. This measure captures the extent to which the selection process is affecting the survival probability of entrants.
3. Average size at entry, 𝐸𝑀𝑃𝑎𝑡
𝑠𝑢𝑟𝑣(𝑡)
𝑁𝑟𝑈𝑛𝑖𝑡𝑠𝑎𝑡𝑠𝑢𝑟𝑣(𝑡)
, calculated as the average number of
employees for entrants. This measure might reflect, inter alia, low entry barriers.
4. Average post-entry growth, 𝐸𝑀𝑃𝑎𝑡
𝑠𝑢𝑟𝑣(𝑡+𝑗)
𝐸𝑀𝑃𝑎𝑡(𝑡), measured as the final over initial
employment ratio of surviving entrants. This measure reflects the growth performance of surviving start-ups.
The following equation decomposes normalise net job creation into the above components:
𝐸𝑀𝑃𝑎𝑡𝑠𝑢𝑟𝑣(𝑡+𝑗)
𝐸𝑀𝑃𝑡(𝑡)=
𝐸𝑀𝑃𝑎𝑡𝑠𝑢𝑟𝑣(𝑡+𝑗)
𝐸𝑀𝑃𝑎𝑡(𝑡)∗
𝐸𝑀𝑃𝑎𝑡𝑠𝑢𝑟𝑣(𝑡)
𝑁𝑟𝑈𝑛𝑖𝑡𝑠𝑎𝑡𝑠𝑢𝑟𝑣(𝑡)
∗𝑁𝑟𝑈𝑛𝑖𝑡𝑠𝑎𝑡
𝑠𝑢𝑟𝑣(𝑡)
𝑁𝑟𝑈𝑛𝑖𝑡𝑎𝑡(𝑡)∗
𝑁𝑟𝑈𝑛𝑖𝑡𝑎𝑡(𝑡+𝑗)
𝐸𝑀𝑃𝑡(𝑡) (1)
A.4 Regression Model
OLS regression analysis was used to determine the role of firm age within
size classes and vice versa using the following equation adapted from
Criscuolo et al. (2014):
𝑦𝑖𝑗𝑠𝑐𝑡 = ∝ + ∑ 𝛿𝑖𝑗𝐴𝑔𝑒𝑐𝑙𝑎𝑠𝑠𝑖 ∗𝑖𝑗 𝑆𝑖𝑧𝑒𝑐𝑙𝑎𝑠𝑠𝑗 + 𝐼𝑠 + 𝜇𝑖𝑗𝑠𝑐𝑡 (2)
where i indexes age classes, j size classes, s macro sectors and t years. Is is
a macro-sector fixed effect. The dependent variable could be either the ratio
of gross job creation over average total employment, the ratio of gross job
destruction over average total employment or the ratio of net job creation of
average total employment across the periods studied. Two age classes and
31
See the Technical Appendix of Menon et al. (2015) DYNEMP V.2 Progress report: Cross-
country evidence on start-up dynamics, OECD DSTI/IND(2015)5

The employment dynamics of Australian entrepreneurship 26
three size classes were used across the macro-sectors studied according to
the following table.
Table A1: OECD definitions of age and size classes
Age classes Size classes
Young (<6 years of age) Small (<50 employees)
Old (6+ years) Medium (50–249 employees)
Large (250+ employees)
Source: Criscuolo C, Gal P N & Menon C (2014) The dynamics of employment growth: New
evidence from 18 countries, OECD Science, Technology and Industry Policy Papers no. 14,
OECD Publishing,
The split between young and mature firms at age five years was chosen in
part to make international comparisons possible. However, Nguyen & Hansell
(2014) also observe that, contingent on survival, most firms reach their
industry’s productivity frontier or get close to it at around 5 years of age.
A.5 Entry and Exit
It is important to note that a business entry or exit may not equate to a
business start-up or closure in the Australian Business Register. There may
be a number of reasons why a business entry or exit event has occurred,
including events relating to selling a business and changes in a business'
structure due to merger or takeover activities. Further, businesses may
transition into and out of the profiled population based on the guidelines used
by the ABS, such as a medium sized enterprise growing in size and
complexity. Incumbent firms are simply defined as firms that are not entering
or exiting the economy. Their employment activity is basically recruitment and
downsizing.
While the methodology of linking the administrative and survey data in the
EABLD tries to accommodate these known issues, further analytical work is
necessary to evaluate its efficacy. In particular future work needs to analyse
worker clusters over time to identify true entry and exit as international
evidence suggests that relabelling of firms with new identifiers can introduce
bias (Hethey-Maier & Schmieder 2013).
For these reasons we focus on micro-start-ups as they are more
representative of de novo entrepreneurship. However, the evidence cited by
Criscuolo et al. (2014) suggests that this issue doesn’t affect the overall result
or trend.

The employment dynamics of Australian entrepreneurship 27
Appendix B Supplementary data
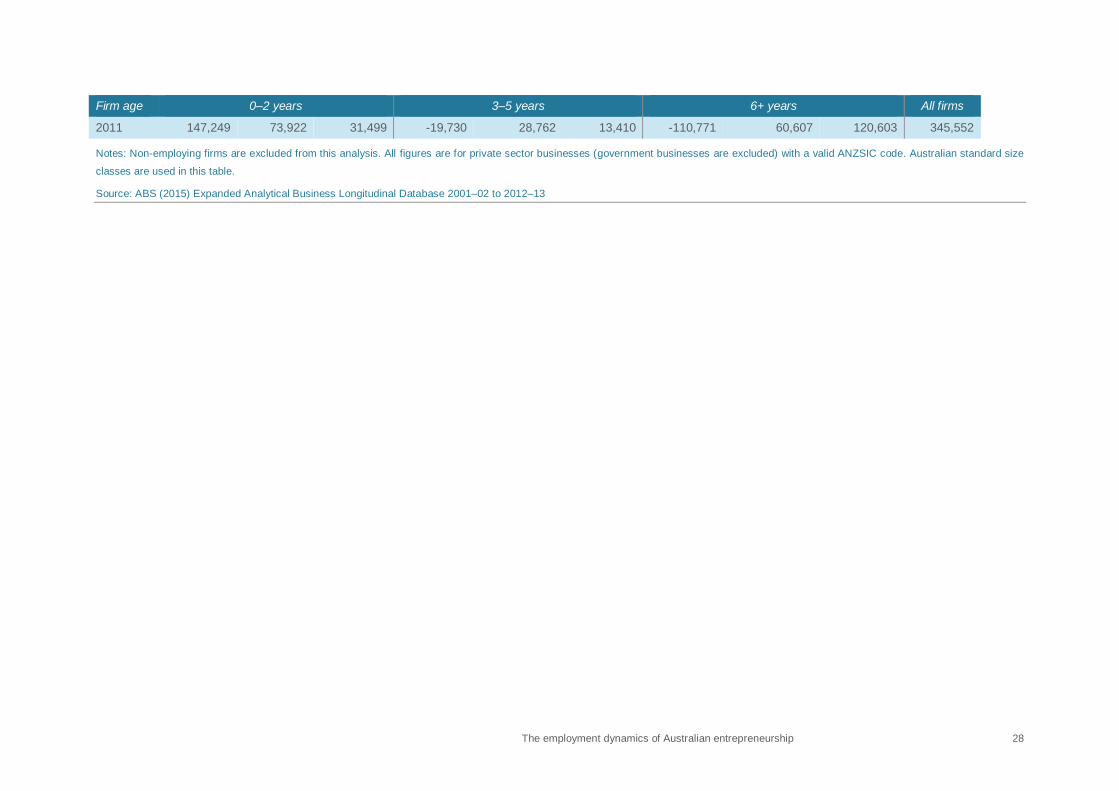
Table B1: Number of firms, total employment and net employment growth by firm age and firm size, 2006–2011
Firm age 0–2 years 3–5 years 6+ years All firms
Firm size Small (1–19 employees)
Medium (20–199
employees)
Large (200+ employees)
Small firms (1–19
employees)
Medium firms (20–199
employees)
Large firms (200+
employees)
Small firms (1–19
employees)
Medium firms (20–199
employees)
Large firms (200+
employees)
Total number of firms
2006 149,643 2,631 69 179,704 5,018 178 429,528 25,973 2,532 795,276
2007 139,731 2,784 70 173,297 5,375 187 434,037 27,520 2,689 785,690
2008 125,403 2,538 63 169,240 5,322 169 443,822 28,151 2,756 777,464
2009 129,167 2,050 61 169,851 4,577 125 470,373 26,569 2,650 805,423
2010 132,784 2,179 86 158,966 4,508 126 483,184 27,756 2,750 812,339
2011 129,069 2,544 106 151,584 4,619 160 490,684 29,493 2,892 811,151
Total employment (FTE)
2006 315,608 108,758 43,929 480,226 208,009 123,430 1,366,960 1,239,591 2,671,885 6,558,396
2007 313,641 115,861 31,717 494,420 224,420 123,541 1,427,851 1,318,897 2,865,600 6,915,950
2008 280,855 103,993 31,108 488,317 223,094 89,768 1,466,359 1,348,839 2,928,300 6,960,632
2009 246,980 85,853 32,372 456,172 191,954 64,589 1,485,599 1,265,961 2,727,128 6,556,607
2010 255,420 93,545 52,125 426,507 191,488 56,049 1,523,508 1,328,061 2,836,713 6,763,414
2011 257,034 113,564 51,895 409,854 197,862 86,253 1,568,846 1,423,130 2,975,631 7,084,067
Net employment (FTE) growth
2006 177,380 61,675 26,892 -70,340 2,063 -15,880 -77,634 70,144 129,710 304,011
2007 173,665 68,896 16,220 -21,018 27,227 3,485 -87,858 64,210 178,228 423,055
2008 147,737 56,040 19,845 -42,225 13,383 6,009 -139,789 12,114 36,789 109,903
2009 130,092 49,592 16,036 -76,173 -1,291 1,203 -242,409 -100,601 -155,245 -378,795
2010 144,810 57,843 36,791 -29,397 22,126 3,717 -125,758 33,555 88,456 232,144
The employment dynamics of Australian entrepreneurship 28
Firm age 0–2 years 3–5 years 6+ years All firms
2011 147,249 73,922 31,499 -19,730 28,762 13,410 -110,771 60,607 120,603 345,552
Notes: Non-employing firms are excluded from this analysis. All figures are for private sector businesses (government businesses are excluded) with a valid ANZSIC code. Australian standard size
classes are used in this table.
Source: ABS (2015) Expanded Analytical Business Longitudinal Database 2001–02 to 2012–13

The employment dynamics of Australian entrepreneurship 29
Figure B1: Age composition of small businesses, by country, 2001–2011
Notes: The graph shows the share of firms by different age groups in the total number of micro and small firms (below 50
employees) in each economy on average over the available years. The period covered is 2001–2011 for Australia, Belgium,
Canada, Finland, Hungary, the Netherlands, the United Kingdom and the United States; 2001–2010 for Austria, Brazil, Spain,
Italy, Luxembourg, Norway and Sweden; 2001–2009 for Japan and New Zealand; 2001–2007 for France; and 2006–2011 for
Portugal. Sectors covered are: manufacturing, construction, and non-financial business services. Owing to methodological
differences, figures may deviate from officially published national statistics. For Japan data are at the establishment level, for
other countries at the firm level. Data for Canada refer only to organic employment changes and exclude merger and
acquisition activity.
Source: Criscuolo et al. (2014) and ABS (2015) Expanded Analytical Business Longitudinal Database 2001–02 to 2012–13
The employment dynamics of Australian entrepreneurship 30
Figure B2: Size of start-up manufacturing (panel A) and services (panel B) firms and their share of total firms by
country, 2001–2011
Notes: The graph reports the average size of start-up firms (from 0 to 2 years old) and the share of start-up firms in the total
number of firms by sector. For the purposes of OECD comparisons headcount measures are used rather than Full Time
Equivalents. The period covered is 2001–2011 for Australia, Belgium, Canada, Finland, Hungary, the Netherlands, the United
Kingdom and the United States; 2001–2010 for Austria, Brazil, Spain, Italy, Luxembourg, Norway and Sweden; 2001–2009 for
Japan and New Zealand; 2001–2007 for France; and 2006–2011 for Portugal. Services exclude the financial business sector.
Owing to methodological differences, figures may deviate from officially published national statistics. For Japan data are at the
establishment level, for other countries at the firm level. Data for Canada refer only to organic employment changes and don’ t
include merger and acquisition activity.
Source: Criscuolo et al. (2014) and ABS (2015) Expanded Analytical Business Longitudinal Database 2001–02 to 2012–13
The employment dynamics of Australian entrepreneurship 31
Figure B3: Share of start-ups in the business population, 2001–03 to 2010–11
Notes: The graph reports start-up rates (defined as the fraction of start-ups among all firms) by countries, averaged across the
indicated three-year periods. Start-up firms are those firms which are from 0 to 2 years old. The period covered is 2001–2011
for Australia, Belgium, Canada, Finland, Hungary, the Netherlands, the United Kingdom and the United States; 2001–2010 for
Austria, Brazil, Italy, Luxembourg, Norway, Spain and Sweden; 2001–2009 for Japan and New Zealand; 2001–2007 for France;
and 2006–2011 for Portugal. Sectors covered are: manufacturing, construction, and non-financial business services. Owing to
methodological differences, figures may deviate from officially published national statistics. For Japan data are at the
establishment level, for other countries at the firm level. Data for Canada refer only to organic employment changes and don’t
include merger and acquisition activity.
Source: Criscuolo et al. (2014) and ABS (2015) Expanded Analytical Business Longitudinal Database 2001–02 to 2012–13

The employment dynamics of Australian entrepreneurship 32
Figure B4: Employment share by firm age, OECD vs. Australia, 2001–2011
Notes: The graph reports the share of firms and employment, respectively, by firms of different age classes in average across
all available years and countries. For the purposes of OECD comparisons headcount measures are used rather than Full Time
Equivalents. Start-ups are split into firm births and 1–2 year old firms. The period covered is 2001–2011 for Australia, Belgium,
Finland, Hungary, the Netherlands, the United Kingdom and the United States; 2001–2010 for Austria, Brazil, Spain, Italy,
Luxembourg, Norway and Sweden; 2001–2009 for Japan and New Zealand; 2001–2007 for France; and 2006–2011 for
Portugal. Sectors covered are: manufacturing, construction, and non-financial business services. Owing to methodological
differences, figures may deviate from officially published national statistics. For Japan data are at the establishment level, for
other countries at the firm level.
Source: Criscuolo et al. (2014) and ABS (2015) Expanded Analytical Business Longitudinal Database 2001–02 to 2012–13

The employment dynamics of Australian entrepreneurship 33
Figure B5: Gross employment creation and destruction by firm age, 2007–2011
Notes: Mature firms are those that are 6+ years, young firms are 0–5 years old. Start-ups that enter and exit in the same year
are excluded from the analysis. Employee numbers are by Full Time Equivalent measures. Contributions are from all sectors of
the economy.
Source: ABS (2015) Expanded Analytical Business Longitudinal Database 2001–02 to 2012–13

The employment dynamics of Australian entrepreneurship 34
Figure B6: Employment, job creation and job destruction for SME (panel A) and Large firms (panel B) by firm
age, OECD vs. Australia, 2001–2011
Notes: The graph reports the contribution to total employment, gross job creation and job destruction by firms in the reported
age-size groups on average across all available years and countries. For the purposes of OECD comparisons headcount
measures are used rather than Full Time Equivalents. Size classes are Small to Medium (1–249 employees) and Large (250+
employees). Age classes are Young (1–5 years old) and Mature (6+ years old). The period covered is 2001–2011 for Australia,
Belgium, Finland, Hungary, the Netherlands, the United Kingdom and the United States; 2001–2010 for Austria, Brazil, Spain,
Italy, Luxembourg, Norway and Sweden; 2001–2009 for Canada, Japan and New Zealand; 2001–2007 for France; and 2006–
2011 for Portugal. Sectors covered are: manufacturing, construction, and non-financial business services. Owing to
methodological differences, figures may deviate from officially published national statistics. For Japan data are at the
establishment level, for other countries at the firm level. Data for Canada refer only to organic employment changes and
exclude merger and acquisition activity.
Source: Criscuolo et al. (2014) and ABS (2015) Expanded Analytical Business Longitudinal Database 2001–02 to 2012–13
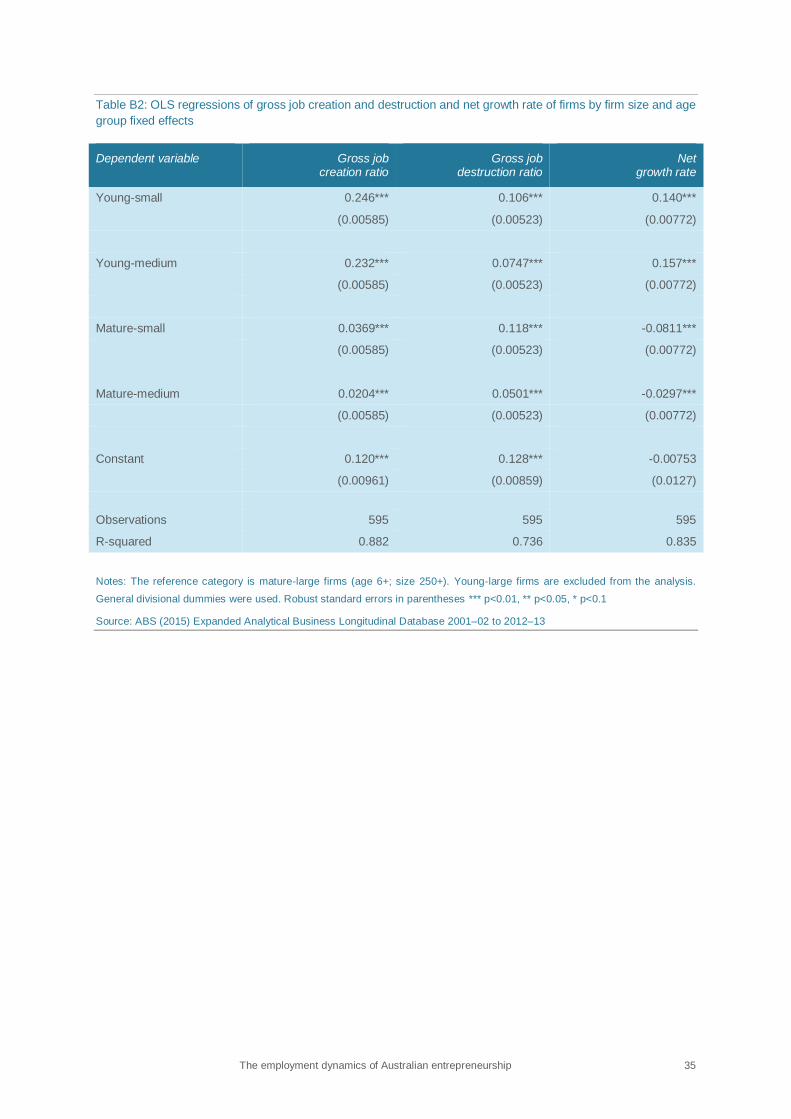
The employment dynamics of Australian entrepreneurship 35
Table B2: OLS regressions of gross job creation and destruction and net growth rate of firms by firm size and age
group fixed effects
Dependent variable Gross job creation ratio
Gross job destruction ratio
Net growth rate
Young-small 0.246*** 0.106*** 0.140***
(0.00585) (0.00523) (0.00772)
Young-medium 0.232*** 0.0747*** 0.157***
(0.00585) (0.00523) (0.00772)
Mature-small 0.0369*** 0.118*** -0.0811***
(0.00585) (0.00523) (0.00772)
Mature-medium 0.0204*** 0.0501*** -0.0297***
(0.00585) (0.00523) (0.00772)
Constant 0.120*** 0.128*** -0.00753
(0.00961) (0.00859) (0.0127)
Observations 595 595 595
R-squared 0.882 0.736 0.835
Notes: The reference category is mature-large firms (age 6+; size 250+). Young-large firms are excluded from the analysis.
General divisional dummies were used. Robust standard errors in parentheses *** p<0.01, ** p<0.05, * p<0.1
Source: ABS (2015) Expanded Analytical Business Longitudinal Database 2001–02 to 2012–13
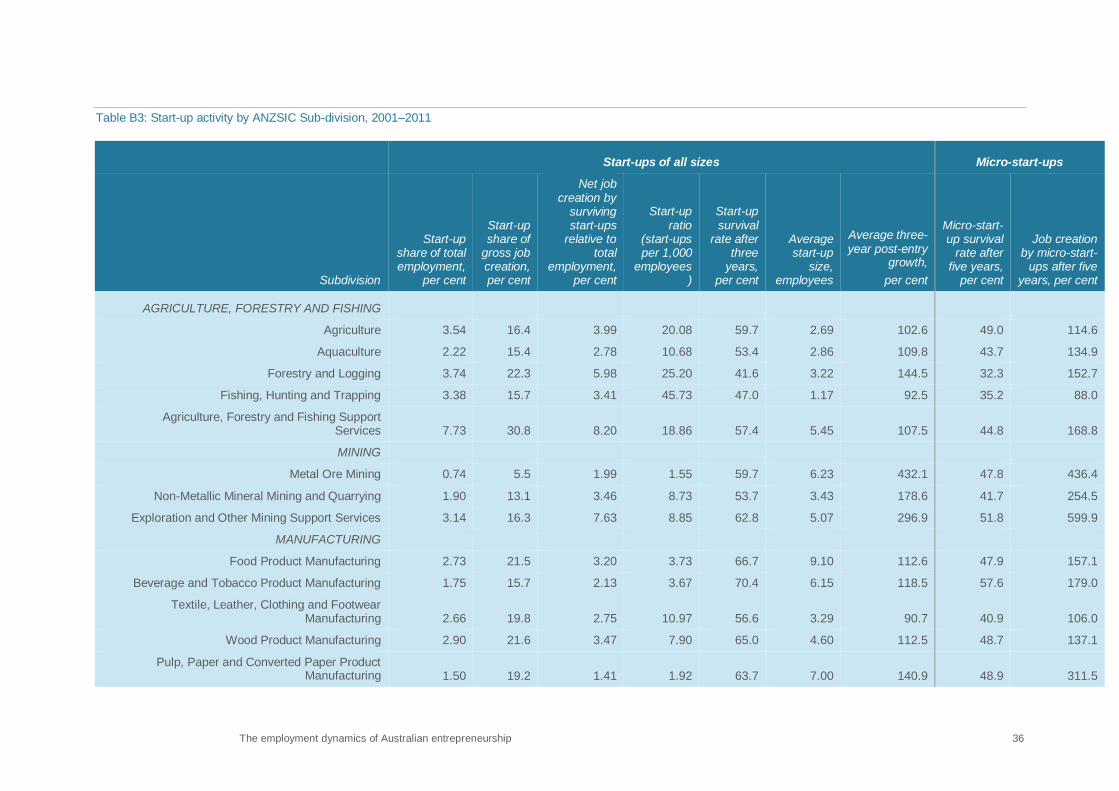
The employment dynamics of Australian entrepreneurship 36
Table B3: Start-up activity by ANZSIC Sub-division, 2001–2011
Start-ups of all sizes Micro-start-ups
Subdivision
Start-up share of total employment,
per cent
Start-up share of
gross job creation, per cent
Net job creation by
surviving start-ups
relative to total
employment, per cent
Start-up ratio
(start-ups per 1,000
employees)
Start-up survival
rate after three
years, per cent
Average start-up
size, employees
Average three-year post-entry
growth,
per cent
Micro-start-up survival
rate after five years,
per cent
Job creation by micro-start-
ups after five years, per cent
AGRICULTURE, FORESTRY AND FISHING
Agriculture 3.54 16.4 3.99 20.08 59.7 2.69 102.6 49.0 114.6
Aquaculture 2.22 15.4 2.78 10.68 53.4 2.86 109.8 43.7 134.9
Forestry and Logging 3.74 22.3 5.98 25.20 41.6 3.22 144.5 32.3 152.7
Fishing, Hunting and Trapping 3.38 15.7 3.41 45.73 47.0 1.17 92.5 35.2 88.0
Agriculture, Forestry and Fishing Support Services 7.73 30.8 8.20 18.86 57.4 5.45 107.5 44.8 168.8
MINING
Metal Ore Mining 0.74 5.5 1.99 1.55 59.7 6.23 432.1 47.8 436.4
Non-Metallic Mineral Mining and Quarrying 1.90 13.1 3.46 8.73 53.7 3.43 178.6 41.7 254.5
Exploration and Other Mining Support Services 3.14 16.3 7.63 8.85 62.8 5.07 296.9 51.8 599.9
MANUFACTURING
Food Product Manufacturing 2.73 21.5 3.20 3.73 66.7 9.10 112.6 47.9 157.1
Beverage and Tobacco Product Manufacturing 1.75 15.7 2.13 3.67 70.4 6.15 118.5 57.6 179.0
Textile, Leather, Clothing and Footwear Manufacturing 2.66 19.8 2.75 10.97 56.6 3.29 90.7 40.9 106.0
Wood Product Manufacturing 2.90 21.6 3.47 7.90 65.0 4.60 112.5 48.7 137.1
Pulp, Paper and Converted Paper Product Manufacturing 1.50 19.2 1.41 1.92 63.7 7.00 140.9 48.9 311.5

The employment dynamics of Australian entrepreneurship 37
Start-ups of all sizes Micro-start-ups
Subdivision
Start-up share of total employment,
per cent
Start-up share of
gross job creation, per cent
Net job creation by
surviving start-ups
relative to total
employment, per cent
Start-up ratio
(start-ups per 1,000
employees)
Start-up survival
rate after three
years, per cent
Average start-up
size, employees
Average three-year post-entry
growth,
per cent
Micro-start-up survival
rate after five years,
per cent
Job creation by micro-start-
ups after five years, per cent
Printing (including the Reproduction of Recorded Media) 2.72 22.4 3.18 8.36 64.6 4.05 110.0 49.0 137.7
Basic Chemical and Chemical Product Manufacturing 1.28 13.7 1.61 2.71 64.1 5.70 139.1 49.5 183.4
Polymer Product and Rubber Product Manufacturing 1.93 17.1 2.49 3.42 66.2 7.43 122.6 50.9 164.0
Non-Metallic Mineral Product Manufacturing 2.02 18.4 2.53 5.34 60.0 5.69 116.0 46.5 162.3
Primary Metal and Metal Product Manufacturing 1.05 12.2 1.66 2.23 66.0 5.78 156.4 53.0 219.0
Fabricated Metal Product Manufacturing 2.89 20.3 3.95 9.52 62.6 4.17 129.2 48.4 163.8
Transport Equipment Manufacturing 1.86 16.4 2.30 5.28 59.1 4.97 120.6 43.9 154.9
Machinery and Equipment Manufacturing 2.15 16.3 3.39 5.11 68.5 5.80 137.7 54.8 172.7
Furniture and Other Manufacturing 3.64 23.6 4.10 14.14 63.0 3.33 100.6 48.3 112.6
ELECTRICITY, GAS, WATER AND WASTE SERVICES
Water Supply, Sewerage and Drainage Services 3.21 22.2 2.97 3.16 57.7 13.52 186.6 42.3 210.5
Waste Collection, Treatment and Disposal Services 3.04 20.4 3.43 12.16 65.1 2.52 123.5 50.9 160.6
CONSTRUCTION
Building Construction 4.37 21.2 5.87 37.60 52.7 1.74 128.6 41.2 150.2
Heavy and Civil Engineering Construction 2.89 15.8 4.56 9.37 55.1 4.55 144.5 41.4 194.7
Construction Services 5.66 24.8 7.43 49.60 57.4 1.48 124.1 43.9 138.9

The employment dynamics of Australian entrepreneurship 38
Start-ups of all sizes Micro-start-ups
Subdivision
Start-up share of total employment,
per cent
Start-up share of
gross job creation, per cent
Net job creation by
surviving start-ups
relative to total
employment, per cent
Start-up ratio
(start-ups per 1,000
employees)
Start-up survival
rate after three
years, per cent
Average start-up
size, employees
Average three-year post-entry
growth,
per cent
Micro-start-up survival
rate after five years,
per cent
Job creation by micro-start-
ups after five years, per cent
WHOLESALE TRADE
Basic Material Wholesaling 2.29 17.3 3.19 9.60 62.5 3.08 133.4 49.1 168.4
Machinery and Equipment Wholesaling 2.04 15.7 3.07 7.08 66.4 3.73 141.9 53.0 184.1
Motor Vehicle and Motor Vehicle Parts Wholesaling 3.43 23.7 3.60 8.87 62.0 5.07 117.4 47.7 144.6
Grocery, Liquor and Tobacco Product Wholesaling 3.51 21.1 4.98 11.24 62.8 4.40 134.3 47.7 192.2
Other Goods Wholesaling 2.47 17.7 3.54 11.40 60.7 3.03 130.9 45.5 171.1
Commission-Based Wholesaling 3.54 22.6 3.92 22.49 59.4 2.13 131.3 44.6 134.4
RETAIL TRADE
Motor Vehicle and Motor Vehicle Parts Retailing 3.27 25.6 4.55 6.76 66.2 7.01 123.4 48.9 139.0
Fuel Retailing 5.40 28.2 6.79 7.55 65.9 9.68 126.1 47.1 99.0
Food Retailing 2.75 26.9 3.22 6.52 62.3 5.73 108.3 44.0 125.2
Other Store-Based Retailing 3.48 25.2 4.20 9.95 63.6 4.33 117.0 46.6 129.5
Non-Store Retailing and Retail Commission-Based Buying and/or Selling 8.45 29.6 7.87 65.78 49.8 1.38 118.1 34.7 166.3
ACCOMMODATION AND FOOD SERVICES
Accommodation 4.79 28.9 5.82 7.03 70.6 7.80 116.3 53.3 175.0
Food and Beverage Services 7.35 37.1 7.43 11.17 55.8 9.21 95.5 34.3 101.2
TRANSPORT POSTAL AND WAREHOUSING
Road Transport 3.80 21.4 4.82 25.39 61.9 1.85 116.9 47.6 127.1

The employment dynamics of Australian entrepreneurship 39
Start-ups of all sizes Micro-start-ups
Subdivision
Start-up share of total employment,
per cent
Start-up share of
gross job creation, per cent
Net job creation by
surviving start-ups
relative to total
employment, per cent
Start-up ratio
(start-ups per 1,000
employees)
Start-up survival
rate after three
years, per cent
Average start-up
size, employees
Average three-year post-entry
growth,
per cent
Micro-start-up survival
rate after five years,
per cent
Job creation by micro-start-
ups after five years, per cent
Water Transport 3.42 22.7 6.11 7.28 58.8 7.68 136.4 43.8 647.5
Air and Space Transport 0.58 9.1 1.13 2.00 55.5 4.17 210.7 43.9 556.2
Other Transport 3.06 17.6 3.63 16.05 57.5 2.65 122.0 43.7 197.0
Postal and Courier Pick-up and Delivery Services 3.11 31.3 3.43 30.24 56.5 1.37 101.5 41.3 93.0
Transport Support Services 3.62 23.9 3.23 20.09 51.9 3.16 117.4 40.0 159.3
Warehousing and Storage Services 2.84 17.1 5.08 4.77 67.0 9.08 170.8 54.1 372.1
INFORMATION MEDIA AND TELECOMMUNICATIONS
Publishing (except Internet and Music Publishing) 2.39 21.6 3.06 4.12 58.3 13.66 100.4 44.4 123.4
Motion Picture and Sound Recording Activities 12.40 39.3 3.61 10.84 50.3 7.37 34.0 39.1 165.0
Internet Publishing and Broadcasting 6.31 31.6 8.53 59.13 45.2 1.82 133.6 31.5 171.6
Telecommunications Services 0.62 15.8 0.75 1.75 63.1 4.12 140.5 49.0 201.0
Internet Service Providers, Web Search Portals and Data Processing Services 2.92 19.0 3.72 11.95 55.8 3.44 120.3 40.8 139.9
FINANCIAL AND INSURANCE SERVICES
Finance 2.25 20.5 2.00 11.01 54.1 2.52 96.9 42.2 114.5
Insurance and Superannuation Funds 2.90 19.9 2.10 36.28 51.1 0.73 72.9 22.0 27.2
Auxiliary Finance and Insurance Services 4.36 23.7 5.03 23.59 58.7 2.38 105.1 46.3 124.6
RENTAL, HIRING AND REAL ESTATE SERVICES
Rental and Hiring Services (except Real Estate) 5.16 25.2 6.49 21.62 62.0 2.87 121.5 48.7 176.1

The employment dynamics of Australian entrepreneurship 40
Start-ups of all sizes Micro-start-ups
Subdivision
Start-up share of total employment,
per cent
Start-up share of
gross job creation, per cent
Net job creation by
surviving start-ups
relative to total
employment, per cent
Start-up ratio
(start-ups per 1,000
employees)
Start-up survival
rate after three
years, per cent
Average start-up
size, employees
Average three-year post-entry
growth,
per cent
Micro-start-up survival
rate after five years,
per cent
Job creation by micro-start-
ups after five years, per cent
Property Operators and Real Estate Services 5.93 29.6 7.17 63.33 62.1 1.17 116.3 51.7 136.5
PROFESSIONAL, SCIENTIFIC AND TECHNICAL SERVICES
Professional, Scientific and Technical Services (Except Computer System Design and Related
Services) 4.32 23.4 5.77 22.49 58.7 2.80 121.4 45.5 146.9
Computer System Design and Related Services 5.33 26.8 6.89 26.25 54.8 3.44 125.2 41.2 153.5
ADMINISTRATIVE AND SUPPORT SERVICES
Administrative Services 3.93 21.5 4.97 3.78 59.6 13.69 123.9 45.4 267.2
Building Cleaning, Pest Control and Other Support Services 4.81 25.4 5.13 23.01 52.9 2.84 106.1 39.1 118.7
EDUCATION AND TRAINING
Preschool and School Education 0.91 11.3 0.88 0.38 71.9 19.00 143.8 56.3 251.1
Tertiary Education 6.05 29.5 8.12 9.46 58.9 9.81 133.6 45.2 225.2
Adult, Community and Other Education 4.44 24.4 5.61 18.97 58.0 3.25 121.8 43.0 157.9
HEALTH CARE AND SOCIAL ASSISTANCE
Hospitals 0.38 5.7 0.49 0.94 61.3 6.00 151.5 47.4 247.3
Medical and Other Health Care Services 4.02 23.2 5.59 22.66 74.2 2.14 135.6 63.7 155.6
Residential Care Services 1.06 9.7 1.73 0.54 73.6 24.20 148.3 54.1 471.5
Social Assistance Services 2.94 19.1 4.56 3.43 65.8 11.76 151.9 48.6 289.9
ARTS AND RECREATION SERVICES
Heritage Activities 1.41 11.7 2.08 5.84 61.5 3.38 155.3 45.0 137.2

The employment dynamics of Australian entrepreneurship 41
Start-ups of all sizes Micro-start-ups
Subdivision
Start-up share of total employment,
per cent
Start-up share of
gross job creation, per cent
Net job creation by
surviving start-ups
relative to total
employment, per cent
Start-up ratio
(start-ups per 1,000
employees)
Start-up survival
rate after three
years, per cent
Average start-up
size, employees
Average three-year post-entry
growth,
per cent
Micro-start-up survival
rate after five years,
per cent
Job creation by micro-start-
ups after five years, per cent
Creative and Performing Arts Activities 4.71 25.8 3.60 40.15 45.0 1.71 75.4 33.6 94.6
Sport and Recreation Activities 3.35 21.3 3.88 7.54 61.7 5.76 113.9 45.5 156.6
Gambling Activities 0.99 11.8 1.30 3.05 65.5 4.28 125.1 48.2 135.0
OTHER SERVICES
Repair and Maintenance 5.54 28.9 6.20 29.16 64.8 2.34 108.9 51.2 119.0
Personal and Other Services 4.49 25.9 4.59 17.74 60.0 3.50 100.1 44.8 106.0
Notes: Subdivisions 6, 7, 17, 26, 27, 47, 56, 60, 75, 76, and 96 are excluded due to the small number of observations. Data points are averages of multiple cohorts within the time period. See
methodology notes for start-ups of all sizes. For the purposes of OECD comparisons headcount measures are used rather than Full Time Equivalents. The net job creation by micro-start-ups shows
the ratio of final employment by survivors at time t+5 over total employment of entrants at time t.
Source: ABS (2015) Expanded Analytical Business Longitudinal Database 2001–02 to 2012–13
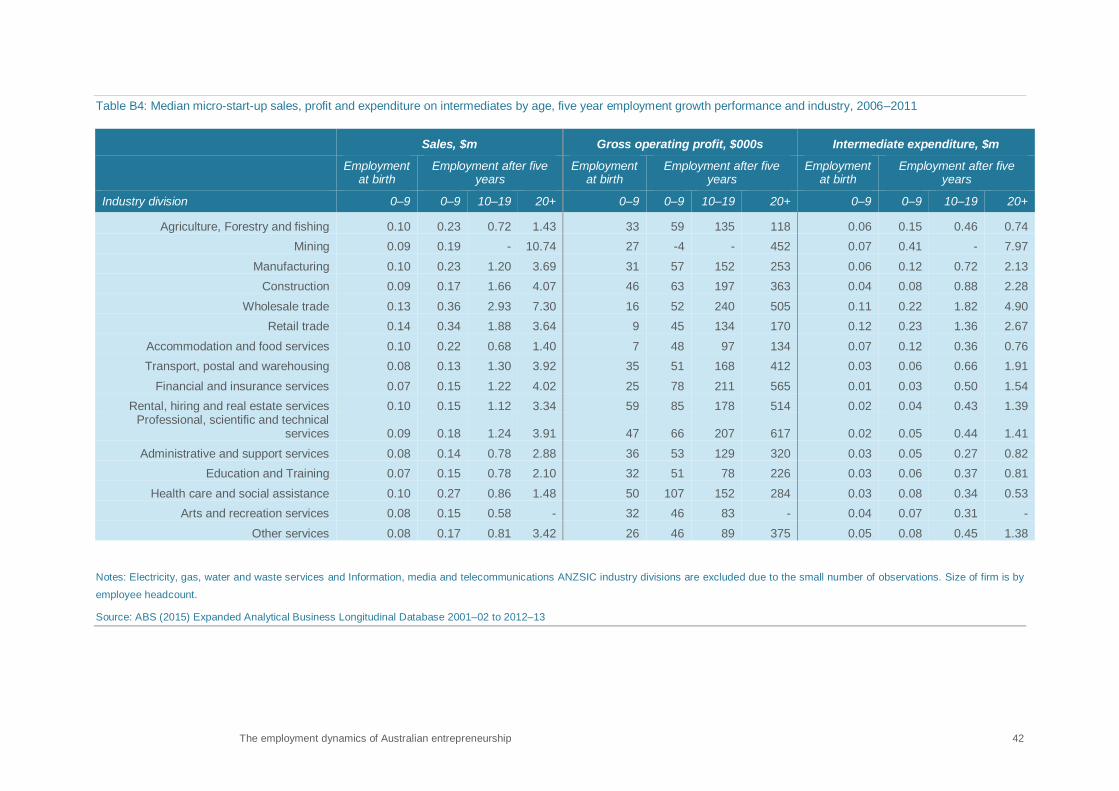
The employment dynamics of Australian entrepreneurship 42
Table B4: Median micro-start-up sales, profit and expenditure on intermediates by age, five year employment growth performance and industry, 2006–2011
Sales, $m Gross operating profit, $000s Intermediate expenditure, $m
Employment at birth
Employment after five years
Employment at birth
Employment after five years
Employment at birth
Employment after five years
Industry division 0–9 0–9 10–19 20+ 0–9 0–9 10–19 20+ 0–9 0–9 10–19 20+
Agriculture, Forestry and fishing 0.10 0.23 0.72 1.43 33 59 135 118 0.06 0.15 0.46 0.74
Mining 0.09 0.19 - 10.74 27 -4 - 452 0.07 0.41 - 7.97
Manufacturing 0.10 0.23 1.20 3.69 31 57 152 253 0.06 0.12 0.72 2.13
Construction 0.09 0.17 1.66 4.07 46 63 197 363 0.04 0.08 0.88 2.28
Wholesale trade 0.13 0.36 2.93 7.30 16 52 240 505 0.11 0.22 1.82 4.90
Retail trade 0.14 0.34 1.88 3.64 9 45 134 170 0.12 0.23 1.36 2.67
Accommodation and food services 0.10 0.22 0.68 1.40 7 48 97 134 0.07 0.12 0.36 0.76
Transport, postal and warehousing 0.08 0.13 1.30 3.92 35 51 168 412 0.03 0.06 0.66 1.91
Financial and insurance services 0.07 0.15 1.22 4.02 25 78 211 565 0.01 0.03 0.50 1.54
Rental, hiring and real estate services 0.10 0.15 1.12 3.34 59 85 178 514 0.02 0.04 0.43 1.39 Professional, scientific and technical
services 0.09 0.18 1.24 3.91 47 66 207 617 0.02 0.05 0.44 1.41
Administrative and support services 0.08 0.14 0.78 2.88 36 53 129 320 0.03 0.05 0.27 0.82
Education and Training 0.07 0.15 0.78 2.10 32 51 78 226 0.03 0.06 0.37 0.81
Health care and social assistance 0.10 0.27 0.86 1.48 50 107 152 284 0.03 0.08 0.34 0.53
Arts and recreation services 0.08 0.15 0.58 - 32 46 83 - 0.04 0.07 0.31 -
Other services 0.08 0.17 0.81 3.42 26 46 89 375 0.05 0.08 0.45 1.38
Notes: Electricity, gas, water and waste services and Information, media and telecommunications ANZSIC industry divisions are excluded due to the small number of observations. Size of firm is by
employee headcount.
Source: ABS (2015) Expanded Analytical Business Longitudinal Database 2001–02 to 2012–13

The employment dynamics of Australian entrepreneurship 43
Table B5: Median micro-start-up industry value added, employees and labour productivity by age, five year employment growth performance and industry, 2006–2011
Industry value added, $m Number of employees Labour productivity, $’000 per employee
Employment at birth
Employment after five years
Employment at birth
Employment after five years
Employment at birth
Employment after five years
Industry division 0–9 0–9 10–19 20+ 0–9 0–9 10–19 20+ 0–9 0–9 10–19 20+
Agriculture, Forestry and fishing 0.04 0.07 0.24 0.64 0 0 12 28 9 40 19 19
Mining 0.04 0.02
2.99 0 2 - 44 -76 -86 - 60
Manufacturing 0.04 0.09 0.48 1.26 0 1 12 28 20 48 38 39
Construction 0.05 0.08 0.65 1.45 0 1 13 28 31 59 51 50
Wholesale trade 0.03 0.09 0.70 1.52 0 1 13 28 14 56 54 48
Retail trade 0.02 0.08 0.42 0.76 0 1 12 27 10 40 34 27
Accommodation and food services 0.02 0.08 0.30 0.57 1 2 13 30 6 34 23 19
Transport, postal and warehousing 0.04 0.07 0.55 1.41 0 1 12 32 31 53 43 42
Financial and insurance services 0.04 0.10 0.66 2.00 1 0 13 25 0 51 54 53
Rental, hiring and real estate services 0.06 0.09 0.59 1.62 0 0 13 30 18 53 45 52 Professional, scientific and technical
services 0.06 0.11 0.71 2.16 0 1 12 29 38 70 57 65
Administrative and support services 0.04 0.08 0.44 1.60 0 1 12 36 20 44 36 31
Education and Training 0.04 0.08 0.37 1.04 0 1 14 31 12 40 26 27
Health care and social assistance 0.06 0.16 0.50 1.00 0 1 12 28 31 82 39 34
Arts and recreation services 0.04 0.06 0.28 - 0 0 14 - 8 32 22 -
Other services 0.04 0.08 0.40 1.61 0 1 12 30 17 40 34 41
Notes: Electricity, gas, water and waste services and Information, media and telecommunications ANZSIC industry divisions are excluded due to the small number of observations. Size of firm is by
employee headcount. Labour productivity was estimated as Industry value added per employee.
Source: ABS (2015) Expanded Analytical Business Longitudinal Database 2001–02 to 2012–13
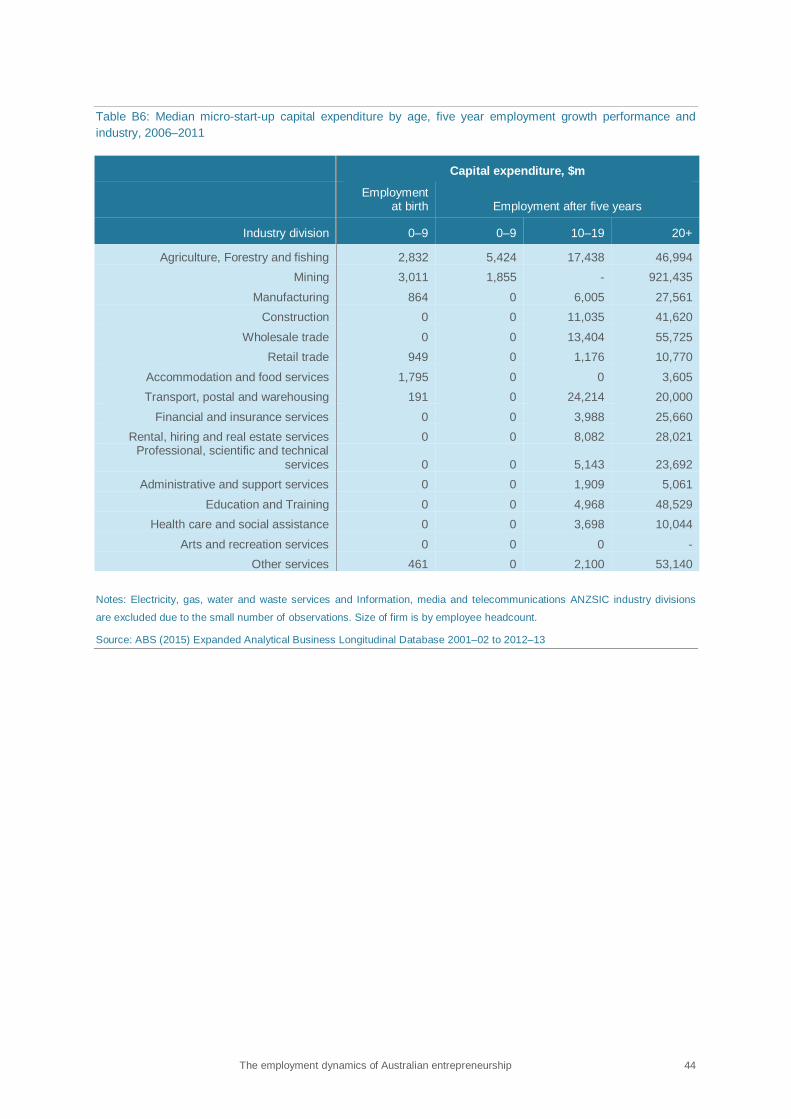
The employment dynamics of Australian entrepreneurship 44
Table B6: Median micro-start-up capital expenditure by age, five year employment growth performance and
industry, 2006–2011
Capital expenditure, $m
Employment at birth Employment after five years
Industry division 0–9 0–9 10–19 20+
Agriculture, Forestry and fishing 2,832 5,424 17,438 46,994
Mining 3,011 1,855 - 921,435
Manufacturing 864 0 6,005 27,561
Construction 0 0 11,035 41,620
Wholesale trade 0 0 13,404 55,725
Retail trade 949 0 1,176 10,770
Accommodation and food services 1,795 0 0 3,605
Transport, postal and warehousing 191 0 24,214 20,000
Financial and insurance services 0 0 3,988 25,660
Rental, hiring and real estate services 0 0 8,082 28,021 Professional, scientific and technical
services 0 0 5,143 23,692
Administrative and support services 0 0 1,909 5,061
Education and Training 0 0 4,968 48,529
Health care and social assistance 0 0 3,698 10,044
Arts and recreation services 0 0 0 -
Other services 461 0 2,100 53,140
Notes: Electricity, gas, water and waste services and Information, media and telecommunications ANZSIC industry divisions
are excluded due to the small number of observations. Size of firm is by employee headcount.
Source: ABS (2015) Expanded Analytical Business Longitudinal Database 2001–02 to 2012–13

The employment dynamics of Australian entrepreneurship 45
References Alinejad M, Balaguer A & Hendrickson L (2015) Financing innovation and entrepreneurship in Australia, Department of Industry and Science, Office of the Chief Economist (forthcoming)
Australian Bureau of Statistics (ABS; 2013a) Australian National Accounts: National Income, Expenditure and Product, December 2013, Cat. No. 5206.0
ABS (2001) Small Business in Australian, Cat. No. 1321.0
ABS (2013b) Microdata: Australian Census Longitudinal Dataset, 2006–2011, Cat. No. 2080.0
ABS (2015) Venture Capital and Later Stage Private Equity, Australia, 2013–14, Cat. No. 5678.0
Acemoglu D, Akcigit U, Bloom N & Kerr WR (2013) Innovation, reallocation, and growth. NBER Working Paper 18993.
Balaguer A, Pachernegg T & Hendrickson L (2015) The influence of R&D on firm performance in Australia, Department of Industry and Science, Office of the Chief Economist (forthcoming)
Balasubramanian N & Sivadasan J (2011) What happens when firms patent? New evidence from US economic census data. Review of Economics and Statistics 93(1): 126–46
Bartelsman EJ & Doms M (2000) Understanding productivity: Lessons from longitudinal microdata, Journal of Economic Literature 38(3): 569–94
Coad A, Daunfeldt S–O & Halvarsson D (2015) Bursting into life: Firm growth and growth persistence by age, Social Science Research Network (June 10, 2015).
Criscuolo C, Gal PN & Menon C (2014) The dynamics of employment growth: New evidence from 18 countries, OECD Science, Technology and Industry Policy Papers no. 14, OECD Publishing, http://dx.doi.org/10.1787/5jz417hj6hg6-en
Davidsson P & Wiklund P (2013) Introduction, In, New perspectives on firm growth (Davidsson P & Wiklund P, Eds) Edward Elgar, Cheltenham, UK
Davidsson P, Steffens P & Fitzsimmons J (2013) Growing profitable or growing from profits: putting the horse in front of the cart? In, New perspectives on firm growth (Davidsson P & Wiklund P, Eds) Edward Elgar, Cheltenham, UK
Decker R, Haltiwanger J, Jarmin R & Miranda J (2014) The role of entrepreneurship in US job creation and economic dynamism, The Journal of Economic Perspectives 28(3):3–24
Delmar F & Wiklund P (2013) The effect of small firm managers’ growth motivation on growth: A longitudinal study. In, New perspectives on firm growth (Davidsson P & Wiklund P, Eds) Edward Elgar, Cheltenham, UK
Department of Industry and Science (2014) Australian Innovation System report 2014, www.industry.gov.au/innovationreport
Fagerberg JE (2013) Innovation: A new guide, TIK Working Papers on Innovation Studies, No. 20131119
Foster L, Haltiwanger J & Krizan CJ (2001) ‘Aggregate productivity growth: Lessons from microeconomic evidence,’ In, New Developments in Productivity Analysis (Eds. Hulten CR, Dean ER & Harper MJ) p303–63, University of Chicago Press, Chicago and London
The employment dynamics of Australian entrepreneurship 46
Foster L, Haltiwanger J & Syverson C (2008) Reallocation, firm turnover, and efficiency: Selection on productivity or profitability? American Economic Review 98(1): 394–425
Fritsch M & Changoluisa J (2014) New firm formation and the productivity of manufacturing incumbents: Effects and mechanisms, Jena Economic Research Papers 2014 – 025
Hassan S & Drake P (2015) The geography of Australian innovative entrepreneurship, Department of Industry and Science, Office of the Chief Economist (forthcoming)
Hathaway I & Litan R (2014) The other ageing of America: The increasing dominance of older firms, Brookings Institute Research Paper
Hethy-Maier T & Schmieder JF (2013) Does the use of worker flows improve the analysis of establishment turnover? Evidence from German Administrative Data, NBER Working Paper 19730
Lentz R & Mortensen DT (2008) An empirical model of growth through product innovation, Econometrica 76(6): 1317–73
Loderer C, Neusser K & Waelchli U (2011) ‘Firm age and survival’, Available at SSRN 1430408
Menon C, Criscuolo C & Calvino G (2015) DYNEMP V.2 Progress report: Cross-country evidence on start-up dynamics, OECD, DSTI/IND(2015)5
Nyugen T & Hansell D (2014) Firm dynamics and productivity growth in Australian manufacturing and firm services, ABS Research Paper 1351.0.55.052
OECD (2007) The contribution of economic geography to GDP per capita, OECD, Paris ECO/CPE/WP1(2007)12
OECD (2015) OECD Innovation Strategy 2015, OECD, Paris, forthcoming
Schumpeter J (1942) Capitalism, socialism, and democracy, Harper & Bros. New York
Smith R & Hendrickson L (2015) Firm age and performance in Australia, Department of Industry and Science, Office of the Chief Economist (forthcoming)
Steffens P & Hechavarria D (2015) Global Entrepreneurship Monitor (GEM): 2014 Australia Report for Department of Industry and Science. Australian Centre for Entrepreneurship Research, QUT Business School, Queensland University of Technology, Brisbane
Swanepoel JA & Harrison AW (2015) The business size distribution in Australia, Department of Industry and Science, Office of the Chief Economist Research Paper (forthcoming)
Syverson C (2011) What determines productivity? Journal of Economic Literature 49(2): 326–65