Embed Size (px)
Citation preview

Kirkeby et al. Parasites & Vectors 2013, 6:67http://www.parasitesandvectors.com/content/6/1/67
RESEARCH Open Access
The range of attraction for light traps catchingCulicoides biting midges (Diptera:Ceratopogonidae)Carsten Kirkeby1*†, Kaare Græsbøll1,2†, Anders Stockmarr1,2, Lasse E Christiansen2 and Rene Bødker1
Abstract
Background: Culicoides are vectors of e.g. bluetongue virus and Schmallenberg virus in northern Europe. Lighttrapping is an important tool for detecting the presence and quantifying the abundance of vectors in the field. Untilnow, few studies have investigated the range of attraction of light traps.
Methods: Here we test a previously described mathematical model (Model I) and two novel models for the attractionof vectors to light traps (Model II and III). In Model I, Culicoides fly to the nearest trap from within a fixed range ofattraction. In Model II Culicoides fly towards areas with greater light intensity, and in Model III Culicoides evaluate lightsources in the field of view and fly towards the strongest. Model II and III incorporated the directionally dependentlight field created around light traps with fluorescent light tubes. All three models were fitted to light trap collectionsobtained from two novel experimental setups in the field where traps were placed in different configurations.
Results: Results showed that overlapping ranges of attraction of neighboring traps extended the shared range ofattraction. Model I did not fit data from any of the experimental setups. Model II could only fit data from one of thesetups, while Model III fitted data from both experimental setups.
Conclusions: The model with the best fit, Model III, indicates that Culicoides continuously evaluate the light sourcedirection and intensity. The maximum range of attraction of a single 4W CDC light trap was estimated to beapproximately 15.25 meters. The attraction towards light traps is different from the attraction to host animals and thuslight trap catches may not represent the vector species and numbers attracted to hosts.
Keywords: Culicoides, Range of attraction, Vector abundance, Light traps, Vector monitoring
BackgroundBiting midges (Diptera: Ceratopogonidae: Culicoides) arevectors of e.g. Bluetongue virus [1] and the newly discov-ered Schmallenberg virus in northern europe [2]. Due totheir crepuscular activity pattern, the standard trappingmethod is by (UV) light traps [3]. The vision of Culicoidesand Ceratopogonids in general has not been studied well[4], although their phototactic behavior is of epidemiolog-ical importance. This behavior influences their responseto light traps, which are widely used for determining
*Correspondence: [email protected]†Equal contributors1National Veterinary Institute, Technical University of Denmark. Bulowsvej 27,DK-1870 Frederiksberg C, DenmarkFull list of author information is available at the end of the article
the presence, abundance and phenology of Culicoides(e.g. [5-7]).An optimal sampling strategy to estimate insect abun-
dancemust rely on knowledge of the area or range coveredby a single trap. Many different terms have been used forthis measure, and we prefer to use the ‘range of attrac-tion’, describing the (maximum) distance at which insectsare attracted to the trap. This term allows for a non-symmetrical attraction range around the trap which isrelevant for traps equipped with light tubes. Few stud-ies have attempted to estimate the range of attraction forlight traps: Odetoyinbo [8] carried out a study where atrap was hung at different distances from an open win-dow which mosquitoes passed through at night. The aimwas to estimate the point where the trap caught morethan a simultaneously operated independent trap. Here,
© 2013 Kirkeby et al.; licensee BioMed Central Ltd. This is an Open Access article distributed under the terms of the CreativeCommons Attribution License (http://creativecommons.org/licenses/by/2.0), which permits unrestricted use, distribution, andreproduction in any medium, provided the original work is properly cited.

Kirkeby et al. Parasites & Vectors 2013, 6:67 Page 2 of 11http://www.parasitesandvectors.com/content/6/1/67
the ‘effective range’ for a CDC mini light trap was esti-mated to be approximately 5m. Baker & Sadovy [9] putup 125Wmercury vapor lamps at different distances fromthe release point of markedmoths. By varying the distancefrom the release point to the lamps, they found that theresponse distance was within 3m. More recently, Truxa& Fiedler (2012) [10] carried out a study where markedmoths were released at different distances to a UV-lighttrap. The catches showed that the ‘radius of attraction’was up to 40m in 5-min intervals. For Culicoides, Rigot& Gilbert (2012) [11] compared 8W Onderstepoort lighttraps and how they competed with each other at differ-ent distances. Background fluctuations in the Culicoidesabundance were monitored by an independent light trap.The analysis assumed a fixed radius of each trap, regard-less of the distance to other traps. The ‘effective trapradius’ was found to be approximately 30mwhen the trapswere running for 30-min intervals. However, Venter et al.(2012) [12], only found a ‘range of attraction’ for Culi-coides for the same trap type of between 2 and 4meters. Inthat experiment, two traps were hung at varying distancesto each other and the background fluctuations were mon-itored using an independent trap. The ‘range of attrac-tion’ was then the distance at which the two traps beganto catch less than the independent trap. Both of theselast studies hypothesized that Culicoides are attractedto the nearest trap, and that the light from the trap isisotropic (uniform in all directions). In the present studywe incorporated the directionally dependent (anisotropic)light created by the light tubes in the light traps into twonovel models for the attraction of Culicoides to light traps.We tested three different models for attraction of
Culicoides to light traps: Model I where the range ofattraction for each trap is isotropic and independent ofthe distance to adjacent traps and where Culicoides fly tothe nearest trap; Model II where Culicoides fly towardsthe direction with highest light-intensity, simulatinganisotropic light and where overlapping ranges of attrac-tion create an extended range of attraction; and ModelIII where overlapping ranges of attraction also create anextended range of attraction but where Culicoides contin-uously evaluate each light source in its field of view and flytowards the highest light-intensity. We used two differentexperimental setups to test themodels. By fitting themod-els to the relative trap catches in the experimental setupswe exclude factors influencing the level of abundance. Therange of attraction for Culicoides is then estimated fromthe model that best fit the trap data in both experimentalsetups.
MethodsExperiments were conducted in the summer of 2011, on afarm with approximately 70 cows in Klippinge, Denmark
(geographical coordinates: N55.3619, E12.3234). Thestudy field, measuring approximately 120 by 120 meters,was grazed by cattle during the day. Before dusk, the cattlewere excluded from the field, but had access to enclosureson the western side of the study site. The surroundingland cover was grazed fields and grain fields, so there wereno obstructions of Culicoides vision or flight next to thesetup. Approximately 100 meters from the experimentalsetup there was a cow stable and a dunghill with poten-tial breeding sites for the Obsoletus group. In a radiusof 500 m, there were at least three ponds with poten-tial breeding sites of the Pulicaris group. However, nobreeding sites were monitored during the study period.The experiment was set up close to the cattle to ensurea high density of Culicoides. There were no other sourcesof light pollution present on the field during the experi-ments. Culicoides were caught using CDC 1212 mini lighttraps (www.johnwhock.com). These traps are equippedwith a horizontally mounted 11 cm fluorescent tube emit-ting anisotropic UV-light. This means that the highestlight-intensity is seen perpendicular to the tube and nolight is seen from the ends of the tube. The light tubeswere placed at a height of 180 cm and all light tubeswere aligned along the transect line. Before each catchnight, freshly charged batteries were installed on the traps.The starting time of sampling was decided each catchnight to be when it was dark enough to perceive the lightfrom the traps with the naked eye at a few meters dis-tance. Traps were allowed to catch in intervals of one hourbefore they were emptied. Catch nights were chosen sub-jectively for optimal flight conditions for Culicoides: lowwind speed; no precipitation; high air humidity; no fogin the air; and not too low temperature. Weather vari-ables were monitored during the experiment using a DavisVantage Pro 2 weather station. No farm animals wereharmed during this study and permission to conduct theexperiment was obtained from the land owners before thestudy.
Experimental setupExperimental setup AIn the first experimental setup, 10 traps were set up ineach of two transects with higher trap density towards themiddle of the transects, aligned north-east to south-west(Figure 1).Within each transect, the traps were positionedat 0, 3, 9, 21 and 45meters from themiddle of the transect.In this way, the distance between traps was doubled foreach transect position. In the middle position, two trapswere placed with the light tubes separated by 12 cm. Twoparallel transects were set up in each catch interval andseparated by 100 meters. Setup A was run on the 27th(between 22.15 and 00.15 hours), 30th (21.15-00.15 hours)and 31st (22.15-00.15 hours) of July 2011.

Kirkeby et al. Parasites & Vectors 2013, 6:67 Page 3 of 11http://www.parasitesandvectors.com/content/6/1/67
Figure 1 Experimental setup. Experimental setup A and B. The plotsshow the study area viewed from above. Distance units are meters.Traps are represented by black dots. All traps were hung with thelight tubes along the transect line. In setup A, the middle dotrepresents two traps separated by 12 cm. In setup B, theconfiguration was rotated 90 degrees in some time intervals.
Experimental setup BIn the second experimental setup, 6 traps were placed intwo transects with higher density towards one end, alsoseparated by 100 meters. This setup was either alignednorth-east to south-west or north-east to south-west(Figure 1) in each catch interval. Within each transect, thetraps were placed at 0, 3, 9, 21, 45 and 93 meters from thestarting point, also doubling the distance between trapsfor each position. The transect directions were reversedso the end with more traps pointed in opposite directions.This setup was run on the 17th (N-S, 21.45-00.45 hours),the 18th (N-S, 21.45-00.45 hours) and on the 24th (E-W,21.15-00.15 hours) of July 2011.All light traps were equipped with new light tubes and
were aligned so that all the tubes were parallel to the tran-sect direction. Insects caught in the traps were sorted in adissection microscope. Culicoides were identified by wingmorphology according to Campbell & Pelham-Clinton[13] and female specimens of the Culicoides obsoletusgroup and the C. pulicaris group were identified and usedfor analysis. The two species groups contributed sepa-rately to the dataset so that the total number of study unitswere initially 54 transects, consisting of different speciesgroups, hourly catch intervals and transect positions.
ModelsWe investigated three mathematical models to explain theobserved fraction of catch per trap per transect. ModelI, ‘Nearest trap’, assumed a constant trap radius wherevectors always fly to the nearest trap, as suggested byRigot & Gilbert (2012) [11]. Model II, ‘Indirect light’, cal-culates the combined light field surrounding the traps,then assumes that Culicoides always fly toward areas ofhigher light intensity, and in this way range of attractionbecomes defined by a cutoff value in total light intensity.Model III, ‘Perceived light’, assumes that Culicoides fly inthe direction of what they perceive as the brightest light
source. The model approximates the perception of a lighttrap for Culicoideswith a Gaussian function, which meansthat the lights from closely placed traps overlap. Range ofattraction is again defined by a cutoff in light intensity.
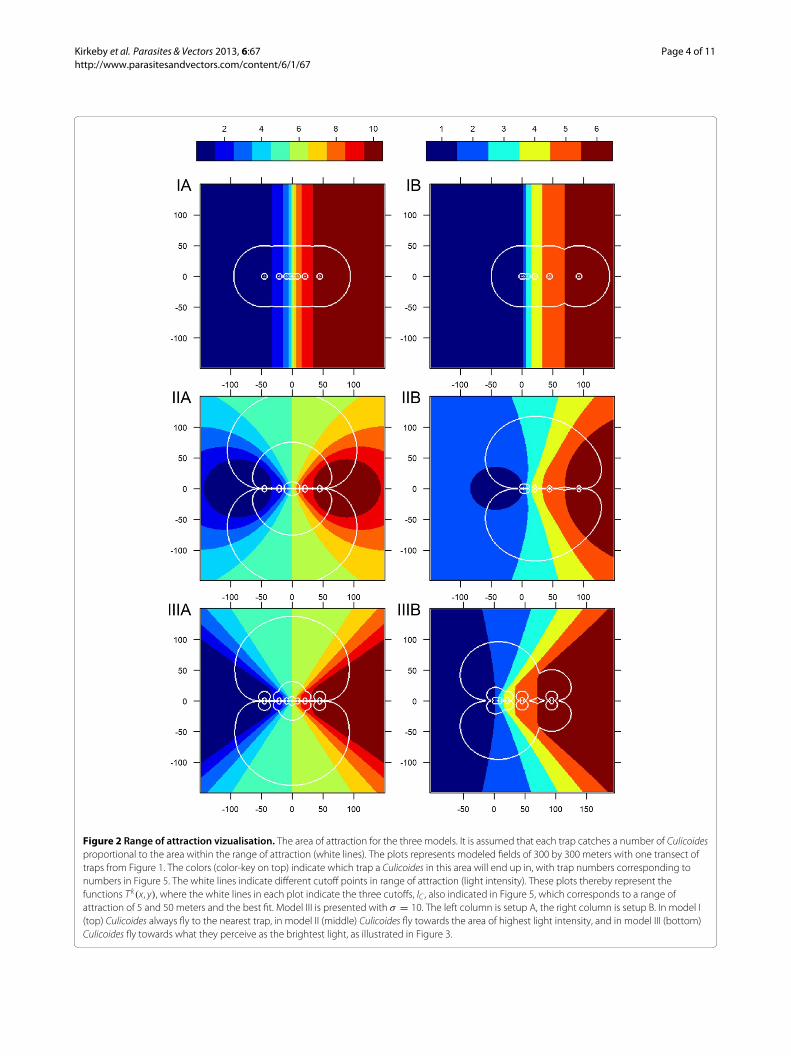
Model I - Nearest trapEffectively this model states that Culicoides always flytowards the nearest trap. Consequently traps are assumedto catch a number of Culicoides proportional to the areawithin the range of attraction, r (IA/B in Figure 2). If thedistance, d, between two neighboring traps is smaller thantwo times the range of attraction, each trap’s area of catchis reduced by half of the overlapping area. The model onlyallows for the catch area to be reduced by the nearestneighbor(s). The equations we present are only valid fortraps on a line. The predicted fraction of catch, CI
i , for thei’th trap is then:
AIi = πr2 −
∑j∈NN
(2r2 arctan
(2�dij
)− dij�
)
� =√r2 −
(dij2
)2
CIi = AI
i∑ni=1 AI
i(1)
Where AIi is the area within range of attraction for the
i’th trap minus half the area of the j’th trap, which is theone or two next neighbors,NN , dij is the distance betweenthe i’th and j’th trap, and n is the total number of trapsin the transect. AI
i is represented by one color per trap(i) within the white lines (range of attraction) in Figure 2.This type of model was investigated for Culicoides byRigot & Gilbert (2012) [11].
Model II - Indirect lightIn this model we assume that Culicoides always fly towardareas of higher light intensity, quite similar to movingtowards higher concentrations of scent molecules, whensearching by smell. We therefore calculate the total lightintensity, I(x, y), for the area around the traps:
I(x, y) =n∑
i=1
�(φi(x, y))(x − xi)2 + (y − yi)2
(2)
�(φi(x, y)) = | cos(φi(x, y))| (3)
Where n is the number of traps and xi, yi are the spatialcoordinates of the i’th trap. Culicoides in any given posi-tion are then assumed to fly along the highest gradient ofI(x, y). We model the anisotropic light field around trapsusing � , which is a function of the angle around eachtrap, φi(x, y), in concordance with Lambert’s cosine law.To model the attraction area we start one Culicoides for
Kirkeby et al. Parasites & Vectors 2013, 6:67 Page 4 of 11http://www.parasitesandvectors.com/content/6/1/67
Figure 2 Range of attraction vizualisation. The area of attraction for the three models. It is assumed that each trap catches a number of Culicoidesproportional to the area within the range of attraction (white lines). The plots represents modeled fields of 300 by 300 meters with one transect oftraps from Figure 1. The colors (color-key on top) indicate which trap a Culicoides in this area will end up in, with trap numbers corresponding tonumbers in Figure 5. The white lines indicate different cutoff points in range of attraction (light intensity). These plots thereby represent thefunctions Tk(x, y), where the white lines in each plot indicate the three cutoffs, IC , also indicated in Figure 5, which corresponds to a range ofattraction of 5 and 50 meters and the best fit. Model III is presented with σ = 10. The left column is setup A, the right column is setup B. In model I(top) Culicoides always fly to the nearest trap, in model II (middle) Culicoides fly towards the area of highest light intensity, and in model III (bottom)Culicoides fly towards what they perceive as the brightest light, as illustrated in Figure 3.

Kirkeby et al. Parasites & Vectors 2013, 6:67 Page 5 of 11http://www.parasitesandvectors.com/content/6/1/67
every square meter within at least 150 meters from thecentral trap, and simulate the attraction of light by individ-ually moving them in small steps along the largest gradientin the surrounding light field until they eventually arriveat a trap location. From this we can determine a func-tion TII(x, y)which tells which trap a single Culicoideswillfly to as a function of initial position (IIA/B in Figure 2).We can then define a cutoff, IC , in light intensity thatdefines how far away Culicoides are attracted towards thelight. And from this determine the fraction of catch ofCulicoides for the i’th trap, CII
i :
CIIi =
∑x,y I ( I(x, y) > IC ∧ TII(x, y) = i)∑
x,y I ( I(x, y) > IC)(4)
Where I is the indicator function. This equation andFigure 2 is then interpreted as that each trap in the tran-sect catch a fraction of Culicoides proportional to the areawithin the light cutoff.
Model III - Perceived lightThis model aims to recreate the view that Culicoides haveof the traps from every point on the area around thetraps. Culicoides will fly in the direction of the perceivedbrightest light. For every point on the field a 360° view isgenerated with a resolution of 1°, V (x, y,φ). This is calcu-lated by combining the light intensity from the i’th trap atevery point, Ii(x, y). Combined with anisotropic light, � ,and the inaccuracy Culicoides perceive the position of thelight traps, σ .
Ii(x, y) = �(φi(x, y))(x − xi)2 + (y − yi)2
(5)
V (x, y,φ) =n∑
i=1
Ii(x, y)σ√2π
exp(
− (φ − φi(x, y))2
2σ 2
)(6)
We again start one Culicoides for every square meter andsimulate their flight towards what they perceive as thestrongest light until they arrive at a trap location. Fromthis the function TIII(x, y) is determined which describeswhich trap a single Culicoides will fly to as a functionof initial position (Figure 2). We define a cutoff, IC , inlight intensity that defines how far away Culicoides areattracted towards the light. And from this we determinethe fractional catch of Culicoides per transect:
CIIIi =
∑x,y I (max(V (x, y,φ)) > IC ∧ TIII(x, y) = i)∑
x,y I (max(V (x, y,φ)) > IC)
(7)
The Culicoides fly in the direction they perceive to havethe brightest light. When Culicoides are far away the traplights seem to blend together because the angular distancebetween them is smaller and the σ smears the view. Asillustrated in Figure 3.
Range of attraction, rk , for model II and III must be cal-culated from the light intensity cutoff, IkC , which is a resultfrom the best fit of models to data. In the experimentalsetups the combination of light from the traps provides acomplex pattern for the combined range of attraction asseen in Figure 2. But for a single trap IkC determines therange of attraction perpendicular to the tube as:
rk =√
κk
IkC(8)
κ II = 1 , κ III = 1σ√2π
With κk being the light intensity one meter from a trap inthe k’th model. Model II and III are normalized differentlybecause the total light intensity from one lamp across theview function, V, is set to sum to one in model III.
Fitting to dataTo determine best fit we used the value of a χ2-test statis-tic (CSk) to evaluate the modeled fraction of catch Ck
i ,from the k’th model, with the observed data, Ci,j.
CSk =n∑
i=1
m∑j=1
(Ci,j − Eki,j)2
Eki,j(9)
Eki,j = Cki (r
k , σ) × Ij
Where n is the number of traps, m is the catch numberwith Ij being an identity vector of length j, so Eki,j is theexpected fraction of catch from model k repeated j timesequal to the number of separate catches. And Ck
i is thefractional catch from the models, which is dependent onrange of attraction and also σ in model III. The best fit isthe set of parameters (rk , σ ) that minimizes the value ofCSk . This method puts equal weight on each transect ofcatch. Given that the Ci,j is the relative catch per trap pertransect, the abundance of Culicoides does not have anyimpact on the analysis. This removes the need to includefactors which affect abundance in the model.All of the data was not included in the trap data. A tran-
sect of trap data was omitted if there were more than threezero catches, which was usually observed on days with avery low total catch. Many zero catches would bias thecatch distribution towards equal catches between traps,which would not represent the true catch distribution, butmerely reflect the variation in daily catch. In total 14 of 28trap data sets for setup A were excluded, while only 5 of26 where omitted for setup B. Thus a total of 35 transectswere included in the analysis. The analysed data fromsetup A was consequently from the 27th (between 23.15and 00.15 hours), the 30th (23.15-00.15 hours) and the31st (22.15-00.15 hours) of July 2011. For setup B analyseddata was from the 17th (N-S, 23.45-00.45 hours), the 18th

Kirkeby et al. Parasites & Vectors 2013, 6:67 Page 6 of 11http://www.parasitesandvectors.com/content/6/1/67
0 50 100 150 200 250 300 350
04
8
0 50 100 150 200 250 300 350
0.00
0.20
0 50 100 150 200 250 300 350
0.000
0.020
0 50 100 150 200 250 300 350
0.000
0.006
0 50 100 150 200 250 300 350
0.0000
0.0025
0 50 100 150 200 250 300 350
02
4
0 50 100 150 200 250 300 350
0.00
0.15
0 50 100 150 200 250 300 350
0.000
0.015
0 50 100 150 200 250 300 350
0.000
0.004
0 50 100 150 200 250 300 350
0.0000
0.0015
Figure 3 360 degrees field of view of a Culicoides. The light intensity of setup A as perceived by one Culicoides as a function of degrees on theangle of the transect. X-axes show the view angle in degrees where zero degrees is downwards orthogonal on the transect line and the angleincreases counterclockwise. Plots show views as if a single Culicoides approaches the central traps in a straight line perpendicular to (left), or in a 45degree angle to the transect (right). In the coordinate system of Figure 2 and equation (6), this corresponds to the coordinates (0,−i) (left) and(−i,−i) (right) where i = 1, 5, 25, 50, 100 meters, with σ = 10. Culicoides are assumed to fly towards the brightest perceived light, and as theperception is assumed to be Gaussian, Culicoidesmust be close to the transect (distance depends on σ ) to differentiate neighboring traps.
(N-S, 21.45-00.45 hours) and the 24th (E-W, 22.15-00.15hours) of July 2011.In the data there were three missing data points (NAs)
for setup A and two NAs for setup B. These were handledby using an Expectation Maximization (EM) procedure[14]. The EM converged in all cases after a maximum ofone step.In setup A data is presented symmetrized by averaging
over traps in pairs around the center of one transect oftraps. We symmetrized data to remove directional bias inthe experimental setup. However, the symmetrizing didnot affect fitting with the CS function, and symmetrizedand un-symmetrized data gave the same results. We choseto present the data symmetrized to allow for a better visualcomparison with the models, which will always give asymmetrical result for setup A.Confidence intervals on r and σ in model III were
determined using Fischer information theory as presented
in Madsen (2008) [15]. The method was implementedby approximating the CS-test curve to a second orderpolynomial using a power transformation to symmetrizearound the minimum value of the CS function (9). Noticethat this method produces non-symmetric confidenceintervals. To ensure that the model was not driven by thecatch on one night, one experimental type of setup, or oneCulicoides species we used the jackknife method on thedata. Which is to reanalyze the data excluding the datafrom one catch night at the time, each species group, oreach experimental setup at the time.
Results10,150 Culicoides were caught and included in the analy-sis, of which 1,817 specimens were from the C. obsoletusgroup and 8,333 specimens were from the C. pulicarisgroup. The hourly catches from each transect rangedbetween 3.6-27.8 (mean: 13.0) specimens per trap for the

Kirkeby et al. Parasites & Vectors 2013, 6:67 Page 7 of 11http://www.parasitesandvectors.com/content/6/1/67
C. obsoletus group and 2.8-177.8 (mean: 52.5) specimensper trap for the C. pulicaris group. Each transect in setupA comprised 90-278 (mean: 179.1) specimens from theC. obsoletus group and 312-1778 (mean: 970.3) specimensfrom the C. pulicaris group. In setup B, each transectcomprised 22-144 (mean: 61.8) specimens from the C.obsoletus group and 17-112 (mean: 63.4) specimens fromthe C. pulicaris group.The catch nights were chosen subjectively for optimal
flight conditions for Culicoides. During the catches, thetemperature was between 12.9 and 18.6 degrees Celcius.The dew point temperature was below the ambient tem-perature during the whole study, and the air humidity wasbetween 72% and 94%. The wind speed was between 0 and1.8 m/s, and no precipitation was measured. Thus therewas no rain, no fog in the air, high humidity, low windspeed and not too low temperatures.The best fit of the models was determined by minimiz-
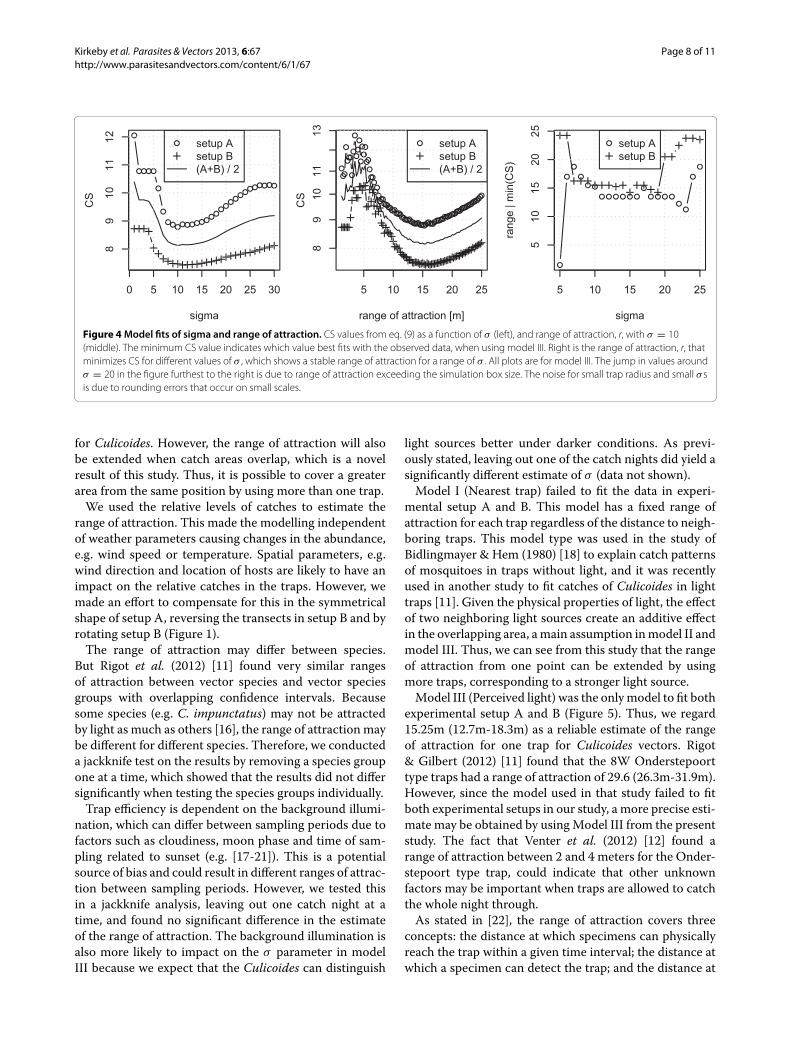
ing (9) as a function of the range of attraction r for modelI, as a function of light intensity cutoff IC in model II, andas a function of light intensity cutoff IC and σ in model III(Figure 4). For model II and III, IC is recalculated to r byusing (8).The catch distribution of different ranges of attraction
and the best fits of the models are presented in Figure 5.The collected trap data are numbered as presented inFigure 1. from left to right at y = 0.We generally observedthat traps catch a lower fraction ofCulicoideswhen placedcloser together. However, there are two very clear excep-tions when traps are placed close together. The two centraltraps in setup A (number 5 and 6) catch almost the sameas the outermost traps, and trap 1 in setup B caught ahigher fraction than the other traps. These observationsare strong indications that closely placed traps do notonly compete for Culicoides, but also amplify attraction.The characteristics of the models compared to data are asfollow (as seen in Figure 5).Model I - Nearest trap: When range of attraction is
lower than half the distance between the closest traps,the traps do not compete and will catch the same frac-tion of Culicoides. When going towards higher trap radiusthe center traps in setup A will catch a lower and lowerfraction due to competition with neighboring traps. Theoutermost traps will always catch the highest fraction dueto the lowest competition. Model I is therefore unable toreproduce the remarkable peak in the middle traps whichis observed in data from experimental setup A. More-over, it overestimates the catch in the outermost traps insetup B.Model II - Indirect light: In this model Culicoides are
attracted towards higher total light intensity, which is avery simple way of considering attraction to light. Fly-ing towards the strongest concentration of light attractsmore Culicoides to the central area of the trap setups. This
explains that for setup B the model predicts that traps2 and 3 for medium and large ranges of attraction catchmore than the outermost traps, which is contrary to theobserved data. We therefore observe that the fitted rII isvery different whether fitted to setup A or B.Model III - Perceived light: Culicoides in this model will
fly directly towards the perceived brightest light source.The two central traps in setup A are located within sucha small distance that Culicoides cannot distinguish themuntil within a very short distance, therefore they willappear as one trap with twice the brightness (Figure 3).This gives the added attraction to the middle traps whichproduce the central spike in the trap catch distribution,which is also observed in data from setup A.Model III alsofits data setup B where competition among traps 2, 3, and4 reduce their fraction of catch compared to the outer-most traps. Moreover, trap 1 is predicted to catch a higherfraction due to to the nearness of trap 2.In model III the CS function for both setup A and setup
B displayed a global minimum at σ = 10 (left in Figure 4).With a combined 95% confidence interval 7.2-13.8. Forσ = 10 the CS is a continuous function of r with a uniqueglobal minimum at rIII = 15.25 meters for both setup Aand B (middle in Figure 4). With a 95% confidence inter-val 12.7-18.3. Furthermore, we observed that for a broadrange of σ s (also covering the 95% confidence interval)the optimal single range of attraction is approximately thesame for setup A and B (right in Figure 4). Even thoughrIII is reported to 15.25 meters please note that CS valueswere only calculated per one quarter of a meter, and theprecision is not 1 centimeter.The jackknife tests indicated that the range of attrac-
tion did not change significantly when excluding any ofthe catch nights, experimental setups, or species groups.In model III the only significant aberration of the value ofσ was when excluding the catches on 30.07.11, on this datethe estimate changed to 14 with a 95% confidence interval9.9-19.7, while all other results where within confidencelevels (data not shown).We notice that model I does not fit any of the data
(Figure 5, top). Model II can only fit data with very dif-ferent values for r (Figure 5, middle). While model III isable to fit both setup A and B using the same values for σ
and r (Figure 5, bottom). SinceModel III is the only modelwhich can fit both experimental setups with the same val-ues of r we have not included a comparison of modelsusing information criteria.
DiscussionIn this study we found a range of attraction for Culicoidesat 15.25m. This means that the trap type used in thisstudy should be separated by at least 30.5m (25.4-36.6)to enable independent sampling. When traps are placedcloser than this, they will influence each other, competing
Kirkeby et al. Parasites & Vectors 2013, 6:67 Page 8 of 11http://www.parasitesandvectors.com/content/6/1/67
Figure 4Model fits of sigma and range of attraction. CS values from eq. (9) as a function of σ (left), and range of attraction, r, with σ = 10(middle). The minimum CS value indicates which value best fits with the observed data, when using model III. Right is the range of attraction, r, thatminimizes CS for different values of σ , which shows a stable range of attraction for a range of σ . All plots are for model III. The jump in values aroundσ = 20 in the figure furthest to the right is due to range of attraction exceeding the simulation box size. The noise for small trap radius and small σ sis due to rounding errors that occur on small scales.
for Culicoides. However, the range of attraction will alsobe extended when catch areas overlap, which is a novelresult of this study. Thus, it is possible to cover a greaterarea from the same position by using more than one trap.We used the relative levels of catches to estimate the
range of attraction. This made the modelling independentof weather parameters causing changes in the abundance,e.g. wind speed or temperature. Spatial parameters, e.g.wind direction and location of hosts are likely to have animpact on the relative catches in the traps. However, wemade an effort to compensate for this in the symmetricalshape of setup A, reversing the transects in setup B and byrotating setup B (Figure 1).The range of attraction may differ between species.
But Rigot et al. (2012) [11] found very similar rangesof attraction between vector species and vector speciesgroups with overlapping confidence intervals. Becausesome species (e.g. C. impunctatus) may not be attractedby light as much as others [16], the range of attractionmaybe different for different species. Therefore, we conducteda jackknife test on the results by removing a species groupone at a time, which showed that the results did not differsignificantly when testing the species groups individually.Trap efficiency is dependent on the background illumi-
nation, which can differ between sampling periods due tofactors such as cloudiness, moon phase and time of sam-pling related to sunset (e.g. [17-21]). This is a potentialsource of bias and could result in different ranges of attrac-tion between sampling periods. However, we tested thisin a jackknife analysis, leaving out one catch night at atime, and found no significant difference in the estimateof the range of attraction. The background illumination isalso more likely to impact on the σ parameter in modelIII because we expect that the Culicoides can distinguish
light sources better under darker conditions. As previ-ously stated, leaving out one of the catch nights did yield asignificantly different estimate of σ (data not shown).Model I (Nearest trap) failed to fit the data in experi-
mental setup A and B. This model has a fixed range ofattraction for each trap regardless of the distance to neigh-boring traps. This model type was used in the study ofBidlingmayer & Hem (1980) [18] to explain catch patternsof mosquitoes in traps without light, and it was recentlyused in another study to fit catches of Culicoides in lighttraps [11]. Given the physical properties of light, the effectof two neighboring light sources create an additive effectin the overlapping area, amain assumption inmodel II andmodel III. Thus, we can see from this study that the rangeof attraction from one point can be extended by usingmore traps, corresponding to a stronger light source.Model III (Perceived light) was the onlymodel to fit both
experimental setup A and B (Figure 5). Thus, we regard15.25m (12.7m-18.3m) as a reliable estimate of the rangeof attraction for one trap for Culicoides vectors. Rigot& Gilbert (2012) [11] found that the 8W Onderstepoorttype traps had a range of attraction of 29.6 (26.3m-31.9m).However, since the model used in that study failed to fitboth experimental setups in our study, a more precise esti-mate may be obtained by usingModel III from the presentstudy. The fact that Venter et al. (2012) [12] found arange of attraction between 2 and 4 meters for the Onder-stepoort type trap, could indicate that other unknownfactors may be important when traps are allowed to catchthe whole night through.As stated in [22], the range of attraction covers three
concepts: the distance at which specimens can physicallyreach the trap within a given time interval; the distance atwhich a specimen can detect the trap; and the distance at

Kirkeby et al. Parasites & Vectors 2013, 6:67 Page 9 of 11http://www.parasitesandvectors.com/content/6/1/67
Figure 5Model fits to experimental setups. Predicted fractional catch per trap given model I (nearest trap), II (indirect light), and III (perceivedlight) (top, middle, bottom) with the field data as boxplots, for setup A and B (left, right). The prediction is the fractional part of the area coveredwithin the range of attraction in Figure 2. The red line with circles is always the best fit of the model to the data. The predicted green and blue linesis fractional catch with a range of attraction of 5 or 50 meters. The ranges of attraction rk giving the best fit for the k’th model were: rIA/B < 0.06/1.5m, rIIA/B = 21/ < 2 m, and rIII = 15.25 m with σ = 10.

Kirkeby et al. Parasites & Vectors 2013, 6:67 Page 10 of 11http://www.parasitesandvectors.com/content/6/1/67
which a specimen shows directed movement towards thetrap. If traps are allowed to sample a longer time, data canbe influenced by other parameters such as wind directionandwind plumes created by host animals. If sampling timeis too short, the specimens within the range of attractionmay not be able to reach the trap before the sampling ends.To investigate the range of attraction and the influence oftime, different sampling intervals would be needed, whichis worth further research.The distance from the Culicoides to a trap is also worth
considering. We assumed general random flight with fullattraction towards the traps within the range of attrac-tion. However, the traps might attract a higher percentageof Culicoides in the vicinity closer to the traps com-pared to further out in the range of attraction, possiblyproportional to light intensity.In our models we assumed that Culicoides disperse
evenly within the field. However, the abundance of Culi-coides is likely to be higher near the cattle. We have triedto compensate for this by reversing the direction of thetransects in setup B. Setup A compensates for this bythe symmetry of the transect (Figure 1). Furthermore, theCulicoides may not be evenly dispersed when consecu-tive trapping is carried out because Culicoides within therange of attraction would be caught in the first trappingperiod and thus new Culicoides in the area would have tomigrate in by random flight. To explain this pattern, a bet-ter fit may be obtained by fitting data to the circumferenceof the attraction area rather than the area itself. This couldbe worth investigating in future research. In both modelII and model III, we assumed that all Culicoides caught inthe traps approached the traps from the same height asthe light sources, and therefore there were blind angles inthe ends of the light tubes. If the Culicoides approachedthe traps from a lower height, the blind angle would beless pronounced. Although Culicoides have been caughtat higher altitudes (e.g. [23]), and Venter et al. (2009) [24]caughtmostCulicoides at a height of 2.8m in South Africa,the main flying height for Culicoides vectors in northernEurope is still unknown.In Models II and III the light distribution around each
trap was anisotropic. We also simulated these two modelsusing isotropic light, but for both models anisotropic lightfitted data better (data not shown). This indicates that thedirection of the light tube in the trap is important, whichhas practical implications when catching Culicoides. If acertain area is to be monitored in a study, e.g. an enclo-sure with host animals, the catch size will depend on theangle of the trap to the area of interest. If trap catches areto be compared in a study, the standardization procedureshould include direction of the light traps.In this study,Model II modelled the light from each trap,
resulting in higher light intensity when ranges of attrac-tion overlap. This is comparable to a scent zone created
isotropically around a host animal if there is no windpresent. This model did not fit data as well as ModelIII did, where the Culicoides can perceive the individualsources of light at a distance and head for the strongestlight source. This is an important biological finding andindicates that the Culicoides show directed movementtowards a light source rather than a more random flighttowards areas with higher light intensity. The implicationsof this finding is important for other studies using lighttrap catches to estimate the number of Culicoides (andpossibly also other insects, e.g. mosquitoes) attracted tohost animals. We have shown here that the vectors evalu-ate light sources at a distance. This behaviour is differentfrom how we assume the vectors are attracted to hostanimals, i.e. following a plume of scent. Thus light trapcatches may not represent the number and species of vec-tors attracted to hosts very well, and should be used withcaution.
ConclusionsWe tested three different models to fit two different fielddata sets, and showed that the Culicoides are likely tolocate the trap by evaluating the direction of the strongestlight source in their field of view and then fly towards itrather than flying towards the nearest trap. We estimatedthe range of attraction for a single CDC 4W UV light trapto be 15.25m (12.7-18.3) perpendicular to the light tube.Therefore, we suggest that, in future studies, traps of thistype are separated by at least 30.5m (25.4-36.6) in order tobe independent. If they are placed closer than this, theirinteractions should be modelled as in model III in thisstudy. Light traps may not represent the number of vec-tors attracted to hosts because the attraction behavioursare different.
Competing interestThe authors declare that they have no competing interests.
Authors’ contributionsThis project is a part of the PhD project by CK at the Veterinary Institute at theTechnical University of Denmark and the PhD project by KG at the VeterinaryInstitute and Department for Informatics and Mathematical Modelling,Technical University of Denmark. CK conceived the study, carried out the fieldwork, participated in discussion of the modeling procedure and wrote thebackground, experimental setup, experimental setup results, discussion andconclusion sections of the manuscript and created Figure 1. KG conceived theframework of models II and III, carried out all modeling and model fitting andwrote the modeling and the model results sections of this paper. KG alsoparticipated in the discussion and conclusions sections and created Figures 2,3, 4 & 5. RB participated in conceiving the study, planning of field experimentsand discussion of the results. AS participated in the planning of the field workand model fitting and evaluation. LEC participated in conceiving model III, themodeling procedure, model fitting and evaluation. All authors read andapproved the final version of the manuscript.
AcknowledgementsThanks to Peter and Lone Hald at Rubjerggaard for providing space for thefield experiments, and Peter Lind at DTU Veterinary Institute for discussion ofresults and comments on the manuscript. This study was partially funded byEU grant FP7-261504 EDENext and is catalogued by the EDENext Steering
Kirkeby et al. Parasites & Vectors 2013, 6:67 Page 11 of 11http://www.parasitesandvectors.com/content/6/1/67
Committee as EDENext070 (http://www.edenext.eu). The contents of thispublication are the sole responsibility of the authors and do not necessarilyreflect the views of the European Commission.
Author details1National Veterinary Institute, Technical University of Denmark. Bulowsvej 27,DK-1870 Frederiksberg C, Denmark. 2Department of Informatics andMathematical Modelling, Technical University of Denmark. Asmussens Alle,DTU, Building 305, DK-2800 Lyngby, Denmark.
Received: 12 September 2012 Accepted: 20 February 2013Published: 15 March 2013
References1. Carpenter S, Lunt H, Arav D, Venter G, Mellor P: Oral susceptibility to
bluetongue virus of Culicoides (Diptera: Ceratopogonidae) from theUnited Kingdom. J Med Entomol 2006, 43:73–78.
2. Rasmussen L, Kristensen B, Kirkeby C, Rasmussen T, Belsham G, Bødker R,Bøtner A: Culicoids as vectors of schmallenberg virus. Emerg Infect Dis2012, 18(7):1204–1206.
3. Venter G, Labuschagne K, Hermanides K, Boikanyo S, Majatladi D, Morey L:Comparison of the efficiency of five suction light traps under fieldconditions in South Africa for the collection of Culicoides species. VetParasitol 2009, 166(3):299–307.
4. Allan S, Day J, Edman J: Visual ecology of biting flies. Annu Rev Entomol1987, 32:297–314.
5. Purse B, Tatem A, Caracappa S, Rogers D, Mellor P, Baylis M, Torina A:Modelling the distributions of Culicoides bluetongue virus vectorsin Sicily in relation to satellite-derived climate variables.Med VetEntomol 2004, 18(2):90–101.
6. Conte A, Goffredo M, Ippoliti C, Meiswinkel R: Influence of biotic andabiotic factors on the distribution and abundance of Culicoidesimicola and the Obsoletus Complex in Italy. Vet Parasitol 2007,150(4):333–344.
7. Takken W, Verhulst N, Scholte E, Jacobs F, Jongema Y, van Lammeren R:The phenology and population dynamics of Culicoides spp. indifferent ecosystems in The Netherlands. Prev Vet Med 2008, 87:41–54.
8. Odetoyinbo J: Preliminary investigation on the use of a light-trap forsampling malaria vectors in the Gambia. Bull World Health Org 1969,40(4):547.
9. Baker R, Sadovy Y: The distance and nature of the light-trap responseof moths. Nature 1978, 276:818–821.
10. Truxa C, Fiedler K: Attraction to light–from how far do moths(Lepidoptera) return to weak artificial sources of light? Eur J Entomol2012, 109:77–84.
11. Rigot T, Gilbert M: Quantifying the spatial dependence of Culicoidesmidge samples collected by Onderstepoort-type blacklight traps:an experimental approach to infer the range of attraction of lighttraps.Med Vet Entomol 2011, 26(2):152–161.
12. Venter G, Majatladi D, Labuschagne K, Boikanyo S, Morey L: Theattraction range of the Onderstepoort 220V light trap for Culicoidesbiting midges as determined under South African field conditions.Vet Parasitol 2012, 190(1-2):222–229.
13. Campbell J, Pelham-Clinton E: X.A taxonomic review of the britishspecies of Culicoides Latreille (Diptera, Ceratopogonidæ). Proc R SocEdinburgh Sect B Biol 1960, 67(03):181–302.
14. Little R, Rubin D: Statistical Analysis with Missing Data. New York: Wiley;1987.
15. Madsen H: Time Series Analysis: CRC Press; 2008.16. Holmes P, Boorman J: Light and suction trap catches of Culicoides
midges in Southern England.Med Vet Entomol 1987, 1(4):349–359.17. Bowden J, Church B: The influence of moonlight on catches of insects
in light-traps in Africa. Part II. The effect of moon phase on light-trapcatches. Bull Entomol Res 1973, 63(01):129–142.
18. Bidlingmayer W, Hem D: The range of visual attraction and the effectof competitive visual attractants uponmosquito (Diptera: Culicidae)flight. Bull Entomol Res 1980, 70(02):321–342.
19. Muirhead-Thomson R, et al.: Trap Responses of Flying Insects. The Influenceof Trap Design on Capture Efficiency: Academic Press Limited; 1991.
20. Nowinszky L: Nocturnal illumination and night flying insects. ApplEcol Environ Res 2004, 2:17–52.
21. Silver J:Mosquito Ecology: Field SamplingMethods: Springer Verlag; 2007.22. Wall C, Perry J: Range of action of moth sex-attractant sources.
Entomologia experimentalis et applicata 1987, 44:5–14.23. Chapman J, Reynolds D, Smith A, Smith E, Woiwod I: An aerial netting
study of insects migrating at high altitude over England. Bull EntomolRes, London 2004, 94(2):123–136.
24. Venter G, Hermanides K, Boikanyo S, Majatladi D, Morey L: The effect oflight trap height on the numbers of Culicoidesmidges collectedunder field conditions in South Africa. Vet Parasitol 2009,166(3):343–345.
doi:10.1186/1756-3305-6-67Cite this article as: Kirkeby et al.: The range of attraction for light trapscatching Culicoides biting midges (Diptera: Ceratopogonidae). Parasites &Vectors 2013 6:67.
Submit your next manuscript to BioMed Centraland take full advantage of:
• Convenient online submission
• Thorough peer review
• No space constraints or color figure charges
• Immediate publication on acceptance
• Inclusion in PubMed, CAS, Scopus and Google Scholar
• Research which is freely available for redistribution
Submit your manuscript at www.biomedcentral.com/submit