Embed Size (px)
Citation preview

Al Chami et al. Chemical and Biological Technologies in Agriculture 2014, 1:17http://www.chembioagro.com/content/1/1/17
RESEARCH Open Access
Extraction and characterization of bio-effectorsfrom agro-food processing by-products as plantgrowth promotersZiad Al Chami1*, Deaa Alwanney1, Sandra Angelica De Pascali2, Ivana Cavoski1 and Francesco Paolo Fanizzi2*
Abstract
Background: Recently, a novel concept ‘bio-effectors’ rose on to describe a group of products that are able to improveplant performance rather than fertilizers. Agro-food processing residues and by-products potentially represent importantsources of bio-effectors but they are currently not properly taken in consideration. To fulfill this gap, in these study, threefood processing by-products: (i) brewers' spent grain, (ii) fennel processing residues, and (iii) lemon processing residueswere chosen as bio-effector candidates. Raw materials were chemically characterized, and green extraction methodologywas optimized by using water, ethanol, and their mixture based on the extraction yields. Aqueous extracts were used forseed germination bioassays on Lepidium sativum seeds to evaluate their potential bioactivities. Thereafter, the extractswere chemically characterized and metabolites were detected by 1D and 2D NMR spectroscopy.
Results: Results are summarized as follows: (i) raw materials showed an interesting nutritional content; (ii) aqueousextraction resulted higher yield more than other used solvent; (iii) at high solvent extraction ratio, aqueous extractswere not phytotoxic but enhanced seed germination and root elongation; (iv) all aqueous extracts are differently richin nutrients, amino-acids, sugars, and other low molecular weight molecule compounds.
Conclusions: This study confirmed that efficient and simple recovery of bioactive compounds other than nutrientsfrom agro-food processing by-products appear to be the new frontier in their valorization.
Keywords: Bio-effectors; By-product; Barley; Fennel; Lemon; Green extraction; Nuclear magnetic resonance (NMR)
BackgroundSoil fertility is considered, after water, the second most limit-ing factor for agricultural production. The management ofsoil fertility is facing problems due to the limited availability oforganic fertilizer from sustainable sources, together with highprices of the available one, particularly in organic and inte-grated agriculture. Farmer dependence and reliance on nonre-newable resource, such as phosphorus, which will be depletedwithin next 50 to 100 years [1], make alternative plant nutri-tion strategies more urgent. Numerous researcher studieswere focused to find environmental-friendly and sustainablesources of nutrients, and different plant growth promoterseither synthesized or naturally-derived were tested. Recently,
* Correspondence: [email protected]; [email protected] - Istituto Agronomico Mediterraneo di Bari (IAMB), Via Ceglie 9,70010 Valenzano, BA, Italy2Dipartimento di Scienze e Tecnologie Biologiche ed Ambientali, Universitàdel Salento, Centro Ecotekne strada provinciale Lecce Monteroni, 73100Lecce, LE, Italy
© 2014 Al Chami et al.; licensee Springer. ThisAttribution License (http://creativecommons.orin any medium, provided the original work is p
a novel concept of ‘bio-effectors’ which describes productsthat are able to improve plant performances other than fertil-izers rose on. Bio-effectors promote plant growth through en-hancing or altering biological activity in the soil/plant system[2].The most common bio-effector present in the market
with a considerable amount produced annually (15 millionmetric tons) is seaweeds extract, although its collectionand handling is difficult [3]. Another one is humic sub-stances that are also produced intensively from lignite coalwhich is a nonrenewable source [4]. This indicates the im-portance of searching and studying new bio-effectors ex-tracted from sustainable sources. New candidates could beagro-food residues and by-products because they maycontain bioactive compounds like proteins, sugars andlipids, and specific aromatic and aliphatic compounds. Inaddition, they are low-cost and abundant materials.
is an Open Access article distributed under the terms of the Creative Commonsg/licenses/by/4.0), which permits unrestricted use, distribution, and reproductionroperly credited.

Al Chami et al. Chemical and Biological Technologies in Agriculture 2014, 1:17 Page 2 of 13http://www.chembioagro.com/content/1/1/17
Therefore, valorization of agro-food processing residues isreceiving increased attention and interest [5]. New greenextraction technologies like green extraction by usingnonhazardous solvents aside from minimizing energy con-sumption are one of the main purposes that attract atten-tion today [6]. The design of green and nonconventionalextraction methods is currently a hot research topic in themultidisciplinary area of applied chemistry, biology, andtechnology.Technology platform of the European Union (EU) en-
terprise provided a 2025 vision of strategic research pri-orities for organic researches. Bio-effectors cover theeco-functional intensification principles of increasingagricultural productivity by improving existing naturalprocesses [7]. EU regulation No. 834 authorized the useof plant derived materials, products, and by-products ofplant origin (such as oilseed cake meal, cocoa husks, andmalt culms) for fertilizers in organic agriculture [8].Moreover, lack of wide-range fertilizer options and au-thorized compounds like biopesticides in organic agri-culture are the main driving force of this research. Infact, the available commercial fertilizers in organic farm-ing are not comparable for their efficiency, solubility,and prices with those in conventional farming.Therefore, authorized efficient products, economically
available for the farmer, able to enhance plant growthand soil nutrients availability are needed. Such productsare necessary where chemicals are prohibited and whencrop nutrient demand is high. In this context, to detectnew sources of bio-effectors, three common agro-foodwaste, such as brewers spent grain (BSG), fennel pro-cessing residues (FPRs), and lemon processing residues(LPRs), were investigated. They were chosen due to theirhigh availability in the south of Italy. Total amount oflemon produced in Italy is around 570,000 tons year−1
mainly used for juice and liquor productions. Lemonproduction is concentrated in the south of Italy, espe-cially in Campania, Basilicata, and Sicily regions. Lemonharvest starts from February till the end of October ac-cording to the varieties. Fennel production is also con-centrated in the south of Italy, and FPRs are available inlarge quantities from October till March. The amount offennel produced in Italy is around 600,000 tons year−1
(data from the National Institute of Statistics (ISTAT)www.istat.it). Beer production in Italy reached 13 millionhl year−1 recently. More than 150,000 tons of malt and50,000 tons of other cereals are consumed for beer pro-duction (ASSOBIRRA, industrial association for beerand malt production, www.assobirra.it). BSG is thereforeavailable all the year in large quantities; breweries arealso distributed all over Italy. Many international brew-eries are located in Apulia region ad es. Birra Peroni islocated in Bari. Accordingly, the main objectives of thiswork are: (i) to explore some promising bio-effector
candidates which can be used in agriculture (namely fororganic farming), (ii) to develop more environment-friendly alternatives for plant nutrition strategies such asgreen extraction technology applied to agro-food process-ing residues and by-products, and (iii) to chemicallycharacterize the metabolic profile of the extracts for thechosen materials by using high-resolution nuclear mag-netic resonance (NMR) spectroscopy.
ExperimentalChemicalsDeionized water (Elix, Millipore Corporation, Bedford,MA, USA) and ethanol (Puriss p.a., ACS Reagent, St.Louis, MO, USA, absolute alcohol, without additive, ≥99.8%), HNO3, and H2O2 TraceSelect were purchased fromSigma Aldrich, (TraceSelect, Sigma-Aldrich, Steinheim,Germany). Ultrapure water (18.2 MΩ cm−1) was obtainedwith a Milli-Q purification system from Millipore (Milli-Q,Millipore Corporation, Bedford, MA, USA).
Raw material preparationsFPRs were brought from JONICA BIO packaging house(Montescaglioso, MT, Italy). FPRs were composed of un-marketable bulbs, green leaves, and external leaves ofbulbs of fennel. LPRs were brought from Solagri® (Solagri®,Sant'Agnello di Sorrento, NA, Italy). They consist of juic-ing pulp pomace, white albedo layer and full lemon fruitswhich cannot be peeled mechanically. The BSGs of barleywere brought from Birra Peroni company (Birra Peroni,Bari, Italy).Raw materials were chopped manually and air dried in a
greenhouse. Materials were turned and mixed for daily aer-ation to prevent fermentation. Greenhouse temperaturedid not exceed 35°C during the drying period. Then, air-dried materials were grinded with a mixer mill and passedthrough a 1-mm sieve to obtain homogeneous particlesizes. All chemical analysis and extraction were done onthe grinded and sieved air-dried materials.
MethodsSolvent choice and extraction yield determinationThree solvents (deionized water, ethanol, and a mixtureof ethanol: water 1:1; v/v), and three ratios (1:10; 1:25;and 1:50: w/v) with three replications were used for theextraction from BSG, FPR, and LPR, respectively. Thesubstrate/solvent ratios were selected on the basis ofthe experimental conditions required for a nearly quanti-tative extraction (higher solvent extraction ratio) and theexpected high phytotoxicity at lower solvent extractionratio. The latter was also confirmed by phytotoxicitytests (see below in the text).Materials were shacked with solvent for 30 min in
250 mL polyethylene bottles. Then centrifugation tookplace at 6,000 rpm for 10 min followed by filtration with

Al Chami et al. Chemical and Biological Technologies in Agriculture 2014, 1:17 Page 3 of 13http://www.chembioagro.com/content/1/1/17
Whatman No. 1 filter paper. An aliquot of the filteredextract was dried at 105°C for yield determination ac-cording to the following equation [9]:
Y ¼ DV
� 1R
C � 1000
where Y is the yield (g dry matter in extract / kg air-dried raw material), D is the dry matter weight (g) of theextract dried at 105°C, R is the extraction ratio, V is thevolume of the extract used for drying at 105°C (mL), andC is the correction factor calculated by dividing theweight of air-dried raw material on the weight of 105°Cdried raw material.The extracts with the highest yield were selected for
further tests and analyses.
Seed germination bioassaysSeed germination bioassays were conducted on Lepi-dium sativum seeds using aqueous extracts according tothe EPA protocol [10] and to the IRSA methods forphytotoxicity bioassays of organic substances [11]. Fivedifferent extraction ratios (1:10; 1:25; 1:50; 1:100; and1:200) for BSG and FPR aqueous extracts, whereas sixratios (1:10; 1:25; 1:50; 1:100, 1:200 and 1:400 w/v) forLPR bioassays were used. The ratio 1:400 was conductedonly for LPR aqueous extract because of its high toxicity.Bioassays were performed in plastic petri dishes withfour replicates. Each plastic petri dish contained tenseeds distributed on filter paper moistened with 2 mL oftested extract. Control was moistened with 2 mL of de-ionized water.Petri dishes were incubated in a growth chamber for
48 h at temperature 25 ± 5°C. The experiment was re-peated for FPR and LPR extracts as explained previouslybut for 144 hours. Germination index was calculatedusing the following equation:
GI %ð Þ ¼ RLTreatment � GSTreatment
RLControl � GSControl
Where GI is the germination index, RL is the root length,and GS is the number of germinated seed. When the ger-mination index exceeded 60%, the extract is considered notphytotoxic [11] and was selected for the further analyses.
Chemical analysisStandard methods have been used for the chemical ana-lyses [12]. In brief, the raw materials, residual humidity,and ash were determined successively in oven at 105°Cand 550°C. On the raw materials and on the extracts,total N was determined by the Kjeldahl method [13].Total macro- and micronutrient concentrations were de-termined by wet digestion (1 mL H2O2 and 5 mL HNO3)using a microwave digestion system (CEM model, MARS
Xpress); the samples were then cooled, diluted with ultra-pure water in a 50-mL volumetric flask, filtered throughWhatman No. 42 filter papers, and finally measured fortheir cation content by means of an inductively coupledplasma optical emission spectrometer (ICP-OES; ThermoElectron ICAP 6300 Series). Total P was measured colori-metrically on the mineralized samples by a spectropho-tometer (Heλios α UV-vis, UNICAM, Thermo ElectronCorporation) at 650 nm using modified ascorbic acidmethod [14].On the extracts, pH was measured using a pH
meter (Basic 20) with a standard glass electrode (Crison5050, Barcelona, Spain). Electrical conductivity was de-termined by a conductometer (XS cond 510). Ash wasdetermined on the extract after drying in the oven at105°C, and then samples were transferred in the muffleat 550°C. Total nitrogen was determined by the Kjeldahlmethod.Total phenolic contents of the extracts were assayed
according to Folin-Ciocalteu method. An aliquote of100 μl of extracts, calibration solutions, and blank werepipetted into separate test tubes, and 900 μL of distilledwater was added. After, 200 μL of Folin-Ciocalteu re-agent were added to each test tube. The mixture wasmixed well and allowed to equilibrate. After 5 min, 1 mLof a 10% (w/v) sodium carbonate solution was added.The mixture was swirled and put in a temperature bathat 40°C for 20 min. Then, the tubes were rapidly cooledand the maximum adsorption was measured at 740 nmusing a spectrophotometer (Heλios α UV-vis, UNICAM,Thermo Electron Corporation). Data were expressed asgallic acid equivalent (GAE) using gallic acid calibrationcurve. Spectrophotometric analysis that used 2,2-diphenyl-1-picrylhydrazyl (DPPH) was performed to determine the anti-oxidant activities. This assay is based on the ability of theantioxidant to scavenge the radical cation DPPH. Datawere expressed as Trolox equivalent antioxidant capacity(TEAC) using Trolox calibration curve. The in vitro anti-oxidant activities of extracts were performed in the follow-ing way: 10 μL of extracts were added to 3 mL of 0.04 mMDPPH ethyl acetate solution and mixed with glass baquet.The samples were kept in the dark for 60 min at roomtemperature, and then decrease in absorbance at 517 nmwas measured using the spectrophotometer (Heλios α UV-vis, UNICAM, Thermo Electron Corporation). Calibrationcurve in the range of 0.2/0.4/0.6/1.0/2.0/4.0/6.0 mmol L−1
were prepared for Trolox.
NMR profiling of BSG, FPR, and LPR extractsAn amount of 0.321 g of FPR, 0.270 g of BSG, and0.141 g of LPR dried extracts were dissolved in 1 mL of1.2 mM TSP in D2O solution, placed in a 5 mm NMRtube, and analyzed by multinuclear (1H and 13C), multi-dimensional NMR spectroscopy.

Al Chami et al. Chemical and Biological Technologies in Agriculture 2014, 1:17 Page 4 of 13http://www.chembioagro.com/content/1/1/17
All measurements were performed on a Bruker AvanceIII NMR spectrometer (Bruker, Karlsruhe, Germany) op-erating at 400.13 MHz for 1H observation, equippedwith a z-axis gradient coil and automatic tuning-matching (ATM).For each sample, a one-dimensional NOESY experi-
ment (referred to as 1D-NOESY), including a solventsignal saturation during relaxation and mixing time anda spoil gradient, was acquired using 256 free inductiondecays (FIDs), 64 K data points, a spectral width of12.019 Hz, an acquisition time of 3.42 s, a relaxationdelay of 4 s, and a mixing time of 10 ms.2D 1H J-resolved spectra with pre-saturation during
relaxation delay were recorded with a spectral width of4795.396 Hz on F2 and 60.020 Hz on F1, 4 K datapoints, 16 FIDs for 128 experiments, and 12 s repetitiondelay.
1H COSY spectra with pre-saturation during relaxationdelay were acquired with 4 K data points, a spectralwidth of 4795.396 Hz, 32 FIDs for 256 experiments, 2 srepetition delay, and 16 dummy scans.
1H-13C HSQC and 1H-13C HMBC NMR spectra wereacquired with 4 K data points, a spectral width of4795.396 Hz on 1H and 25156.211 Hz on 13C, 16 FIDsfor 256 experiments, 2 s repetition delay, 16 dummyscans.The acquisition and processing of spectra were per-
formed using the software TopSpin 2.1 (Bruker Biospin).The FIDs were multiplied by an exponential weightingfunction corresponding to a line broadening of 0.3 Hzbefore Fourier transformation, phasing, and base linecorrection. All spectra were referenced to the TSP signal(δ = 0.00 ppm), used as internal reference.The metabolites were assigned on the basis of 2D
NMR spectra analysis (2D 1H J-res, 1H COSY, 1H–13CHSQC, and HMBC) and comparison with publisheddata [15,16].
Statistical analysisAnalysis of variance (ANOVA) was carried out, and separ-ation of means was performed using LSD test at P = 0.05significance level. LSD test were computed using SASsoftware version 9 (SAS Institute, Cary, NC). Correlationmatrix at P = 0.05 significance level was performed usingXLSTAT 7.5.2 (Addinsoft, Paris, France).
Results and discussionRaw material characterizationAsh content, total nitrogen, macro-nutrients, micronu-trient, and total Cd and Pb contents of the raw materials(BSG, FPR, and LPR) are shown in Table 1. Ash contentin FPR and LPR were almost five times higher than thatin BSG. The ash content observed in BSG was approxi-mately half of what Mussatto and Roberto [17] reported.
This result could be due to the variation in raw materialin terms of cultivated plant varieties and/or processingprocedures (e.g., brewing procedures).Total N in the raw materials ranged from 14.5 to
47.9 g kg−1 while total P ranged from 1.95 to 4.80 g kg−1.In addition to the highest nitrogen content, BSG resultedto be the second higher source of phosphorus. BSG rawmaterial is also rich in total Cu, total Fe, and total Zn.Results of the chemical characterization of BSG was con-sistent with Khidzir et al. [18] for Mg but differed for Caand P. The obtained content of N and K is similar to thevalues previously reported by Gupta et al. [19]. High nitro-gen content in the BSG raw material is related to the rich-ness in protein as reported by Kotlar et al. [20].The highest concentrations of Ca and K were found in
LPR and FPR raw materials. FPR raw material and FPRextract were rich in K as previously reported by Biancoet al. [21]. FPR content in macro- and micronutrientswas similar to the findings of Muckensturm et al. [22].FPR raw material was rich in total P, Na, Mn, and Nicontents. Relative high Na content of FPR was estimatedto be 10 times higher than LPR and 100 times higherthan BSG. Fe was found to be the most abundant micro-element in all materials with content ranged from 114 to169 mg kg−1.LPR was the lowest source of almost all analyzed nu-
trients except for Ca. Low nutrient content in LPR wasalso previously reported by Su and Horvat [23] and con-firmed by USDA National Nutrient Database for Stand-ard Reference [24].Total Cd and Pb contents resulted below the limita-
tion of hazardous substances required by the Europeanregulations (EU ‘eco-label’; Commission Decision 2006/799/EC) [25] for soil improvers.
Solvent choice and extraction yield determinationFigure 1 shows the extraction yields for BSG, FPR, andLPR at 1:10, 1:25, and 1:50 solvent extraction ratios.Aqueous extracts gave the highest yields for FPR andLPR, while no significant differences were observedamong different solvents for BSG. Generally, EtOH ex-tract gave the lowest yield in comparison to the aqueousand EtOH-H2O mixture extract. However, yield obtainedby EtOH-H2O mixture was significantly lower than theyield obtained by water for both FPR and LPR. In gen-eral, and independently the solvent used, when the solv-ent extraction ratio increased, the extraction yield didnot increase significantly. Our results showed that whenthe content of ethanol in the solvent increases, the totalextraction yield decreases for FPR and LPR while no dif-ferences in yield was found in BSG. This may be due tothe higher polarity of water in comparison to ethanol[26] and to the higher polar metabolites content in FPRand LPR. In our study, aqueous extraction resulted in

Table 1 Ash content, total macro-and micronutrients, Cd, and Pb contents in raw materials (BSG, FPR, and LPR)
Raw materials Ash TotalN
TotalP
TotalCa
TotalK
TotalMg
TotalNa
TotalCu
TotalFe
TotalMn
TotalNi
TotalZn
TotalCd
TotalPb
% g kg−1 g kg−1 g kg−1 g kg−1 g kg−1 g kg−1 mg kg−1 mg kg−1 mg kg−1 mg kg−1 mg kg−1 mg kg−1 mg kg−1
BSG 4.10 ± 0.1 47.9 ± 0.7 4.79 ± 0.4 4.41 ± 0.5 0.51 ± 0.0 1.63 ± 0.1 0.07 ± 0.0 14.3 ± 1.4 169 ± 13 37.3 ± 2.1 2.5 ± 0.3 97.5 ± 7.9 < 0.01 0.28 ± 0.06
FPR 20.4 ± 0.8 30.9 ± 1.0 4.80 ± 0.8 6.67 ± 0.7 33.4 ± 1.1 1.58 ± 0.1 7.00 ± 0.2 8.94 ± 1.5 137 ± 21 75.5 ± 6.7 5.1 ± 0.8 26.4 ± 2.1 < 0.01 0.38 ± 0.09
LPR 20.1 ± 0.5 14.5 ± 0.6 1.95 ± 0.3 10.3 ± 0.5 9.04 ± 0.8 1.02 ± 0.1 0.70 ± 0.0 5.52 ± 1.0 114 ± 15 5.54 ± 0.6 1.8 ± 0.1 12.8 ± 1.0 < 0.01 0.19 ± 0.04
Values reported are average of three replicates ± standard deviation.BSG, brewers spent grain; FPR, fennel processing residues; LPR, lemon processing residues.
AlC
hamiet
al.Chemicaland
BiologicalTechnologiesin
Agriculture
2014,1:17Page
5of
13http://w
ww.chem
bioagro.com/content/1/1/17

Figure 1 Extraction yield of BSG, FPR, and LPR at 1:10, 1:25, and 1:50 extraction ratios. Means with different letters within the same rawmaterials indicate the significant difference between values at P < 0.05 (LSD Fisher's test). NS not significant, R ratio.
Al Chami et al. Chemical and Biological Technologies in Agriculture 2014, 1:17 Page 6 of 13http://www.chembioagro.com/content/1/1/17
higher yield than the mixture of EtOH-H2O and there-fore only aqueous extracts were used for further tests.In BSG extracts, changing the ratio and/or the solvent
did not affect obtained yields. In our study, applying dif-ferent solvent extraction ratios did not strongly changethe yields regardless the solvent or material and that wasin agreement with Kalia et al. [27].In FPR extracts, yields were not affect by changing the
solvent extraction ratio, while the solvent used had sig-nificant effect. The extraction yields for the different sol-vents ranked as follows: EtOH < EtOH-H2O <H2O. Theyield of the aqueous extract was almost eight timeshigher than for the EtOH extracts. The high extractionyield obtained from FPR could be due to the richness inhigh molecular weight polysaccharide as reported byTaie et al. [28]. On the other hand, Leal et al. [29] hasestimated the aqueous extraction yield of FPR by 16.8%,while it exceeded 45% in this study. The different FPRyields can be explained by the differences in extractionprocedures such as temperature, extraction time, and ra-tios. Our results varied also when compared to Il-Suket al. [30] who obtained an extraction yield equal to11.38%. Taie et al. [28] found significant differences inFPR extraction yield when different solvents and/or ratioswere applied and these results are similar to our findings.In LPR extract, similar results as FPR extracts were
obtained. In fact, aqueous extracts gave the same yieldwhen 1:10, 1:25, and 1:50 extraction ratios were applied.Similar results were obtained when EtOH was used.Conversely, the yield of LPR EtOH-H2O extracts varied sig-nificantly when different ratios were used. The yield was inthe order of 1:10 < 1:25 < 1:50 for LPR EtOH-H2O extracts.The yield of LPR extraction using EtOH-H2O extractionwas equal to 135 g kg−1 of fresh peel as determined byKang et al. [31]. The differences between our study and the
previous studies could be due to the higher percentage ofEtOH used in the mixture. The low yield of ethanolic ex-traction of LPR was confirmed by Zia-ur [32]. However, theextraction yield can be improved by other assistantmethods such as ultrasounding method [33].Generally, the compounds obtained by organic solvent
such as EtOH are different from those obtained by theaqueous extraction. Tsibranska et al. [34] found that theorganic solvents like ethanol can give two times highercontent of valuable compounds in the extract. However,aqueous extraction was adopted for many reasons otherthan the yield. Indeed, there are restrictions in organicsolvent use for green extraction technology as well as inorganic farming. Moreover, it should be underlined that(i) aqueous extraction is efficient and less expensive in com-parison to other solvents, nontoxic, and environmental-friendly alternative to conventional extraction techniques;(ii) it is easy for both field application and market registra-tion; (iii) organic solvents are phytotoxic for plants and, inaddition, extra work is needed to remove them from the ex-tract; (iv) other surfactant (e.g., tween, dimethyl sulfoxide)should be added to redissolve in water compounds ex-tracted with other organic solvents, increasing the cost ofthe bio-effector; (v) the extraction yields of some bioactivecomponents resulted better in water than ethanol at roomtemperature [35]; and (vi) the limitation of aqueous extrac-tion can be reduced by increasing the temperature [36]which rises the water polarity [37].
Seed germination bioassays for optimum solventextraction ratio determinationFigure 2 shows the germination indexes (GI) after 48 hof incubation using different aqueous extraction ratios.According to IRSA method [11], GI index below 60% isan indication of phytotoxic effect, while GI above 60%, is

Figure 2 Germination index after 48 h. Means with different letters indicate significant difference between values at P < 0.05 (LSD Fisher's test).Ng no germination. The asterisk denotes that the extraction ratio 1:400 was done only for LPR.
Al Chami et al. Chemical and Biological Technologies in Agriculture 2014, 1:17 Page 7 of 13http://www.chembioagro.com/content/1/1/17
considered not phytotoxic, and there is no harmful riskfor plant growth.The highest GI in each ratio of extraction was ob-
tained with BSG treatment followed by FPR treatment.BSG aqueous extract enhanced seed germination androot growth. In fact, GI index in BSG aqueous extractincreased by 20% in comparison to control at 1:50 ex-traction ratio. Seeds did not germinate in the FPR aque-ous extract at 1:10 extract ratio, and GI increased whenthe solvent extraction ratio increased. LPR was verytoxic and no seed germination was observed at 1:10,1:25, 1:50, 1:100, or 1:200 extraction ratios while GIreached 62% at 1:400 ratio.Due to the higher toxicity of FPR and LPR, the related
experiment was repeated for a longer time (144 h). Figure 3shows the improvement of GI for FPR and LPR aqueousextract after 144 h of seed incubations. No germinationwas registered for LPR extract at 1:25 and 1:50 ratios after
Figure 3 Germination index after 144 h. Means with different letters indNg no germination.
144 h and matched the results after 48 h, while slight in-crease in GI was obtained by LPR at 1:100 ratio (34%) and1:200 ratio resulted in GI equal to 66.7%.In order to understand the effects of the aqueous ex-
tracts on the GI, a correlation matrix was determinedbetween pH, EC, and GI for each aqueous extract. Thecorrelation matrices are shown in Table 2. GI is nega-tively correlated with EC. Salinity inhibits seed germin-ation due to an osmotic effect or a specific ion toxicity[38]. In addition, pH influences seed germination. Infact, seed germination is inhibited when pH is below 5and completely inhibited when the pH is below 4 [39].The correlation between pH value and GI explains thelow germination index obtained from LPR aqueous ex-tract which had the highest acidity. The low GI obtainedin FPR when low solvent extraction ratio is adoptedcould be due to the high EC and to the high total poly-phenols which can negatively affect seed germination.
icate significant difference between values at P < 0.05 (LSD Fisher's test).

Table 3 pH, EC, ash content, total macro- andmicronutrients, total Cd, total Pb, total polyphenolsand antioxidant activity content in BSG 1:25 FPR 1:100and LPR 1:200 aqueous extracts
Aqueousextracts
BSG 1:25 FPR 1:100 LPR 1:200
pH 5.5 ± 0.1 5.5 ± 0.2 3.3 ± 0.1
EC dS m−1 0.2 ± 0.0 0.6 ± 0.1 0.5 ± 0.0
Ash % 18.5 ± 0.2 25.0 ± 1.1 9.3 ± 0.3
Total N 40.0 ± 0.4 157 ± 10 10.0 ± 0.2
Total P 47.2 ± 0.2 43.6 ± 0.3 3.78 ± 0.2
Total K 19.4 ± 1.8 330 ± 8.7 50.1 ± 4.5
Total Ca 58.3 ± 0.4 8.22 ± 0.55 34.7 ± 2.7
Total Mg 34.3 ± 0.40 5.41 ± 0.8 5.49 ± 0.60
Total Na 5.44 ± 1.1 72.0 ± 2.3 5.46 ± 0.48
Total Cu mg L−1 0.05 ± 0.01 0.11 ± 0.00 0.05 ± 0.00
Total Fe 0.44 ± 0.08 0.43 ± 0.10 0.55 ± 0.04
Total Mn 0.32 ± 0.01 0.17 ± 0.00 0.03 ± 0.00
Total Ni 0.03 ± 0.01 0.06 ± 0.00 0.02 ± 0.00
Total Zn 0.18 ± 0.05 0.27 ± 0.06 0.27 ± 0.05
Total Cd <0.005 <0.005 <0.005
Total Pb 0.01 ± 0.00 0.01 ± 0.00 0.01 ± 0.00
Totalpolyphenols
g kg−1 10.57 ±1.96c
57.88 ±5.61a
49.54 ±3.13b
Antioxidantactivity
mM trolox L−1
1.81 ± 0.31c 5.55 ± 1.01a 3.77 ± 0.44b
Table 2 Correlation matrix between pH, EC, and GI(48 and 144 h) for BSG 1:25, FPR 1:100, and LPR 1:200aqueous extracts
GI (48 h) GI (144 h)
BSG pH 0.72 Nd
EC −0.86 Nd
FPR pH −0.76 −0.75
EC −0.85 −0.85
LPR pH 0.92 0.89
EC −0.40 −0.71
GI, germination index at 48 h and 144 h; BSG, brewers spent grain; FPR, fennelprocessing residues; LPR, lemon processing residues; Nd, not determined.Values in bold indicate significant P = 0.05 (two-tailed test).
Al Chami et al. Chemical and Biological Technologies in Agriculture 2014, 1:17 Page 8 of 13http://www.chembioagro.com/content/1/1/17
Total polyphenols are relatively high in FPR and LPR ex-tracts in comparison to BSG extract. Total polyphenolsare known to have germination inhibitor effect [40].However, when the toxicity of the extract is low, a re-
tardation in seed germination could be observed. In fact,at higher solvent extraction ratio for FPR and LPR, anincrease in germination index at 144 h test time was ob-served in comparison to 48 h. No seed germination wasobserved in LPR extract treatment at 1:200 ratio for thefirst 48 h while at 144 h, GI was equal to 66.7% which isconsidered the limit to classify the extract as nontoxic.Based on the obtained results, BSG 1:25, FPR 1:100, andLPR 1:200 (GI > 60%) were selected for the chemicalcharacterization.
Values reported are average of three replicates ± standard deviation. Withinsame row, means with different letters (a, b, c) indicate significant differencebetween values at P < 0.05(LSD Fisher's test).BSG, brewers spent grain; FPR, fennel processing residues; LPR, lemonprocessing residues.
Extract characterizationAsh content, total nitrogen, macro- and micronutrients,and heavy metal contents of each aqueous extract (BSG1: 25, FPR 1:100, and LPR 1: 200) are shown in Table 3.The results revealed that all extracts were rich in macro-and micronutrients; therefore, the use of these aqueousextracts can have an added value for plant nutrition. Thehighest EC (0.6 dS m−1) was measured in FPR extract.The lowest pH value (3.3) was measured in LPR extract.Ash content was highest in FPR in comparison to thosein LPR and BSG aqueous extracts. FPR extract wasfound to be almost the richest source of N, P, and K incomparison to those in LPR and BSG aqueous extracts.BSG extract was slightly higher in total P content thanthat in FPR extract. BSG extract showed the highest con-tent in total Ca and Mg. We found the FPR extract to bethe richest in total K content with more than 330 mg L−1.Total Mg content was the highest in BSG extract, andtotal Fe was the highest in LPR extract. FPR content oftotal Na was approximately 13 times higher than those inLPR and BSG contents. The highest concentrations of K,Cu, Na, Ni, and Zn were found in FPR extract. Fe is themost abundant microelement in all three materials withcontent ranged from 114 to 169 mg kg−1.
Total Pb content in all extract was around 0.01 mg L−1
which is considered very low, while total Cd content wasbelow the instrument detection limit (<0.01 mg L−1).Total polyphenols and antioxidant activity are shown
in the Table 3. Extracts of studied materials revealed dif-ferent amounts of polyphenols: 10.6, 57.9 and 49.5 g L−1
in BSG, FPR, and LPR, respectively. Aqueous extract ob-tained from FPR showed high polyphenolic content andantioxidant activity. Total polyphenols content in BSGaqueous extract was significantly lower than FPR andLPR aqueous extract. FPR extract showed an importantDPPH scavenging ability exhibited by the highest anti-oxidant activity (5.5 mM trolox L−1). LPR antioxidantactivity was much higher than BSG's.The low content of total polyphenols observed in BSG
extract may be due to their weak solubility in water.Both hydrolysis and saponification with NaOH are thesuitable extraction techniques of BSG polyphenols [41].Methanolic extraction was also used for quantificationand extraction of polyphenolic compounds from BSG byNaczk and Shahidi [42]. The high polyphenolic compounds

Al Chami et al. Chemical and Biological Technologies in Agriculture 2014, 1:17 Page 9 of 13http://www.chembioagro.com/content/1/1/17
observed in FPR is probably the reason for its high antioxi-dant activity [43]. Total polyphenols content measured inthis study (57.9 g kg−1) is in accordance with Munir et al.[44] but was higher than the total polyphenols content ob-served by Taie et al. [28] (31.94 g kg−1). Parejo et al. [45]referred the antioxidant activity of FPR to some com-pounds such as caffeoylquinic acid, rosmarinic acid, andkaempferol-3-O-glucoside. The high antioxidant activityof LPR extract was indicated by the strong scavengingability of free radicals, and nitrites [46]. The polyphenoliccontent of the aqueous solution of other types of citrus
Figure 4 1H NMR spectra of FPR, BSG, and LPR extracts in D2O.
peel powders seems to give different value (3.5 g kg−1) [31]in comparison with our result (49.5 g kg−1).High-resolution NMR spectroscopy represents a po-
tentially powerful tool for plant metabolite analysis [47].This technology has been previously utilized to profilemetabolites in clinical samples [48,49] but also to ac-count for the metabolic changes that occur during fer-mentation and/or production processes, and to evaluatethe quality of food and beverages such as oil and wine[50-52]. The main advantage of NMR spectroscopy, aswell as the sample preparation, is that it is not
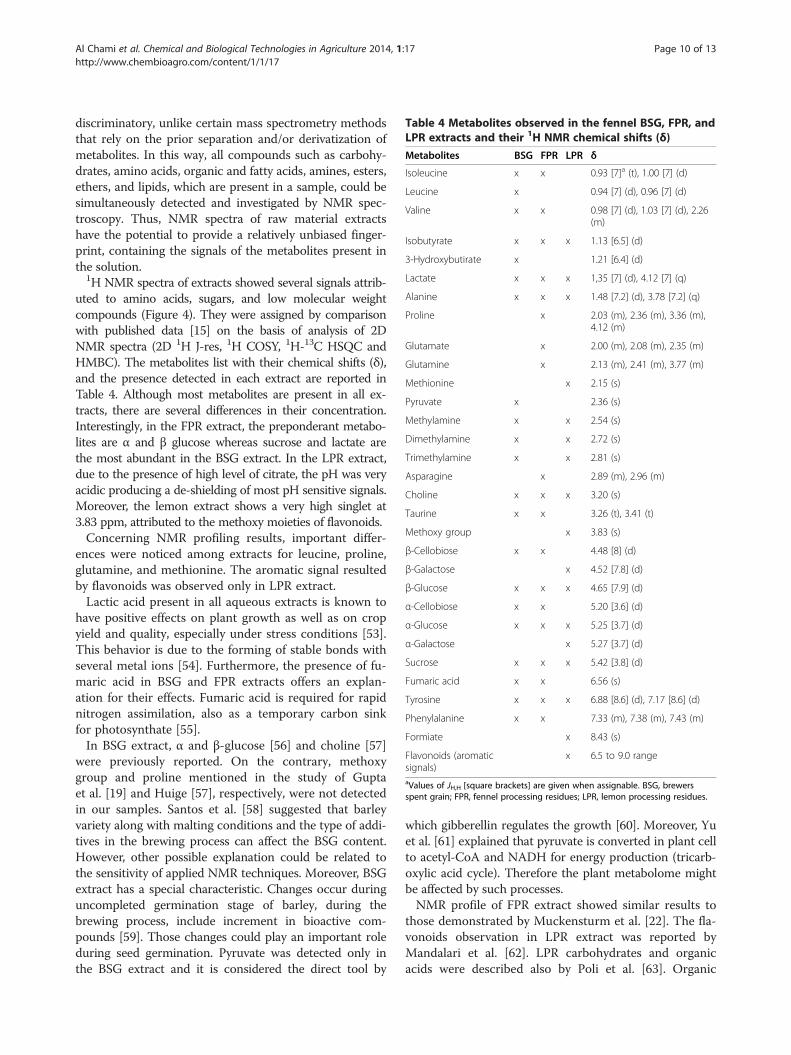
Table 4 Metabolites observed in the fennel BSG, FPR, andLPR extracts and their 1H NMR chemical shifts (δ)Metabolites BSG FPR LPR δ
Isoleucine x x 0.93 [7]a (t), 1.00 [7] (d)
Leucine x 0.94 [7] (d), 0.96 [7] (d)
Valine x x 0.98 [7] (d), 1.03 [7] (d), 2.26(m)
Isobutyrate x x x 1.13 [6.5] (d)
3-Hydroxybutirate x 1.21 [6.4] (d)
Lactate x x x 1,35 [7] (d), 4.12 [7] (q)
Alanine x x x 1.48 [7.2] (d), 3.78 [7.2] (q)
Proline x 2.03 (m), 2.36 (m), 3.36 (m),4.12 (m)
Glutamate x 2.00 (m), 2.08 (m), 2.35 (m)
Glutamine x 2.13 (m), 2.41 (m), 3.77 (m)
Methionine x 2.15 (s)
Pyruvate x 2.36 (s)
Methylamine x x 2.54 (s)
Dimethylamine x x 2.72 (s)
Trimethylamine x x 2.81 (s)
Asparagine x 2.89 (m), 2.96 (m)
Choline x x x 3.20 (s)
Taurine x x 3.26 (t), 3.41 (t)
Methoxy group x 3.83 (s)
β-Cellobiose x x 4.48 [8] (d)
β-Galactose x 4.52 [7.8] (d)
β-Glucose x x x 4.65 [7.9] (d)
α-Cellobiose x x 5.20 [3.6] (d)
α-Glucose x x x 5.25 [3.7] (d)
α-Galactose x 5.27 [3.7] (d)
Sucrose x x x 5.42 [3.8] (d)
Fumaric acid x x 6.56 (s)
Tyrosine x x x 6.88 [8.6] (d), 7.17 [8.6] (d)
Phenylalanine x x 7.33 (m), 7.38 (m), 7.43 (m)
Formiate x 8.43 (s)
Flavonoids (aromaticsignals)
x 6.5 to 9.0 range
aValues of JH,H [square brackets] are given when assignable. BSG, brewersspent grain; FPR, fennel processing residues; LPR, lemon processing residues.
Al Chami et al. Chemical and Biological Technologies in Agriculture 2014, 1:17 Page 10 of 13http://www.chembioagro.com/content/1/1/17
discriminatory, unlike certain mass spectrometry methodsthat rely on the prior separation and/or derivatization ofmetabolites. In this way, all compounds such as carbohy-drates, amino acids, organic and fatty acids, amines, esters,ethers, and lipids, which are present in a sample, could besimultaneously detected and investigated by NMR spec-troscopy. Thus, NMR spectra of raw material extractshave the potential to provide a relatively unbiased finger-print, containing the signals of the metabolites present inthe solution.
1H NMR spectra of extracts showed several signals attrib-uted to amino acids, sugars, and low molecular weightcompounds (Figure 4). They were assigned by comparisonwith published data [15] on the basis of analysis of 2DNMR spectra (2D 1H J-res, 1H COSY, 1H-13C HSQC andHMBC). The metabolites list with their chemical shifts (δ),and the presence detected in each extract are reported inTable 4. Although most metabolites are present in all ex-tracts, there are several differences in their concentration.Interestingly, in the FPR extract, the preponderant metabo-lites are α and β glucose whereas sucrose and lactate arethe most abundant in the BSG extract. In the LPR extract,due to the presence of high level of citrate, the pH was veryacidic producing a de-shielding of most pH sensitive signals.Moreover, the lemon extract shows a very high singlet at3.83 ppm, attributed to the methoxy moieties of flavonoids.Concerning NMR profiling results, important differ-
ences were noticed among extracts for leucine, proline,glutamine, and methionine. The aromatic signal resultedby flavonoids was observed only in LPR extract.Lactic acid present in all aqueous extracts is known to
have positive effects on plant growth as well as on cropyield and quality, especially under stress conditions [53].This behavior is due to the forming of stable bonds withseveral metal ions [54]. Furthermore, the presence of fu-maric acid in BSG and FPR extracts offers an explan-ation for their effects. Fumaric acid is required for rapidnitrogen assimilation, also as a temporary carbon sinkfor photosynthate [55].In BSG extract, α and β-glucose [56] and choline [57]
were previously reported. On the contrary, methoxygroup and proline mentioned in the study of Guptaet al. [19] and Huige [57], respectively, were not detectedin our samples. Santos et al. [58] suggested that barleyvariety along with malting conditions and the type of addi-tives in the brewing process can affect the BSG content.However, other possible explanation could be related tothe sensitivity of applied NMR techniques. Moreover, BSGextract has a special characteristic. Changes occur duringuncompleted germination stage of barley, during thebrewing process, include increment in bioactive com-pounds [59]. Those changes could play an important roleduring seed germination. Pyruvate was detected only inthe BSG extract and it is considered the direct tool by
which gibberellin regulates the growth [60]. Moreover, Yuet al. [61] explained that pyruvate is converted in plant cellto acetyl-CoA and NADH for energy production (tricarb-oxylic acid cycle). Therefore the plant metabolome mightbe affected by such processes.NMR profile of FPR extract showed similar results to
those demonstrated by Muckensturm et al. [22]. The fla-vonoids observation in LPR extract was reported byMandalari et al. [62]. LPR carbohydrates and organicacids were described also by Poli et al. [63]. Organic

Al Chami et al. Chemical and Biological Technologies in Agriculture 2014, 1:17 Page 11 of 13http://www.chembioagro.com/content/1/1/17
acids present in LPR extracts had also an important im-pact on plant growth. Starting from growth media, or-ganic acids carry negative charges which allow to makecations complexation and anions displacement [64]. Or-ganic acids can flow across lipid bilayer of hairy rootcells [65]. Citric acid of LPR is an important componentof the stress response and for plant growth [66].Finally, the aqueous extracts are rich in several low
molecular weight organic compounds, and can be goodcandidates to be tested as bio-effectors in a more de-tailed study.
ConclusionsPotential and practical contributions of tested raw mate-rials aqueous extracts as bio-effector candidates werediscussed. The agro-food processing residues and theirextracts studied above showed an interesting content,either at nutritional or biochemical level, and could beused as plant growth promoter. They are differently richin nutrients, amino-acids, sugars, and low molecularweight molecules as demonstrated by the chemical ana-lysis and NMR metabolic profiling. Furthermore, aque-ous extraction resulted higher yield with respect to otherused solvent. Water, safe and less expensive than otherorganic solvents, is effective for BSG, FPR, and LPR ex-tractions under different extraction ratios. In addition,aqueous extracts were not phytotoxic but enhanced seedgermination at higher solvent extraction ratio. BSGaqueous extract enhanced seed germination and rootgrowth. FPR aqueous extract, at low solvent extractionratio, showed low GI which increased when the solventextraction ratio increased. LPR was very toxic at lowsolvent extraction ratio; therefore, higher solvent extrac-tion ratios are required for the use of this product.Finally, the reuse of agro-food processing residues as a
potential source of bio-effectors suggests a rethinking ofplant nutritional management in a sustainable manner.Bio-effectors can be applied in both low input (organicand integrated) and high input (conventional) types ofagriculture. According to our results, we suggest thataqueous extracts could be used even in organic farming.However, further studies including comparison withother commercial plant growth promoters and toxicitystudies on the microbial soil community should be con-ducted to evaluate the effects of suggested bio-effectorson the soil/plant system.
Competing interestsThe authors declare that they have no competing interests.
Authors' contributionsACZ has made the research protocol, conception and design, analysis ofmacro- and micronutrients, phytotoxicity test, and extraction yields. He alsoparticipated in the other data acquisition and analysis and the whole datainterpretation. He has also made the manuscript drafting. AD is the Master'sStudent who followed the work to obtain his Master Degree. DPSA carried
out the NMR analysis and the NMR result writings. CI has made substantialcontributions to the conception and design, carried out the total polyphenolsanalysis and antioxidant activities, and helped to draft the manuscript and datainterpretation. FFP has made substantial contributions to the conception anddesign, manuscript revising and has given the final approval of the version tobe published. All authors read and approved the final manuscript.
AcknowledgmentsThe authors want to acknowledge the Mediterranean Agronomic Institute ofBari (MAIB) for supporting this research work and the Department ofBiotechnology and Environmental Science, University of Salento for the NMRanalysis. The authors want to thank JONICA BIO packaging house,Montescaglioso, Matera, Italy, for providing fennel processing residues;Solagri®, Sant' Agnello di Sorrento, Napoli, Italy for providing the lemonprocessing residues; and Birra Peroni company, Bari, Italy, for providing thebrewers' spent grains.
Received: 16 July 2014 Accepted: 20 September 2014
References1. Cordell D, Drangert JO, White S (2009) The story of phosphorus: global food
security and food for thought. Global Environ Chang 19(2):292–3052. European Commission C5068 (2011) FP7 Cooperation Work Programme
Theme 2: Food, Agriculture and Fisheries, and Biotechnologies. http://ec.europa.eu/research/participants/data/ref/fp7/89419/b-wp-201201_en.pdf.Accessed 08 October 2014
3. FAO (2007) FAO yearbook of fishery statistics: aquaculture production 2005.FAO Yearbook of Fishery Statistics 100(2):202. vii
4. Chen Y, Aviad T (1990) Effects of humic substances on plant growth. In:MacCarthy P, Clapp CE, Malcolm RL, Bloom PR (ed) Humic sbstances in soiland crop sciences. Soil Science Society of America Inc, Madison, Wisconsin, USA
5. Anastas PT, Warner JC (1998) Green chemistry: theory and practice. OxfordUniversity Press, Oxford
6. Kroyer GT (1998) Bioconversion of food processing wastes. In: Martin AM(ed) Bioconversion of waste materials to industrial products. SpringerScience, Business Media, New York
7. Urs N, Anamarija S, Otto S, Niels H, Marco S (2008) Vision for an organicfood and farming research agenda to 2025; organic knowledge for thefuture. Vision Research Agenda, European Technology Platforms (ETP).http://www.darcof.dk/research/grafik/Visions_08.pdf
8. EC (2007) Organic production and labelling of organic products andrepealing regulation. 834. Official Journal of the European Union, TheCouncil Of The European Union 91:23
9. Zhang S, Bi H, Liu C (2007) Extraction of bio-active components fromRhodiola sachalinensis under ultrahigh hydrostatic pressure. Sep PurifTechnol 57(2):277–282
10. EPA (1996) Ecological effects test guidelines. Seed Germination/RootElongation Toxicity Test, US Environmental Protection Agency. EPA.712–C–96–154
11. IRSA-Istituto di Ricerca sulle Acque (1983) Analisi della fitotossicità dellasostanza organica in decomposizione mediante bioassaggio Lepidiumsativum. Metodi Analitici per i Fanghi: Parametri biochimici e biologici.Quaderno IRSA 64:8.1–8.3
12. Trinchera A, Leita L, Sequi P (2006) Metodi di Analisi per i Fertilizzanti.Istituto Sperimentale per la Nutrizione delle Piante per conto del Ministerodelle politiche agricole alimentari e forestali, Roma, Italy
13. Bremner JM (1996) Nitrogen total. In: Sparks DL (ed) Methods of soilanalysis. Soil Science Society of America, Madison, Wisconsin
14. Olsen SR, Sommers LE (1982) Phosphorus. In: Page AL, Miller RH (ed)Methods of Soil Analysis, Part 2. 2nd ed. Agronomy Monograph 9, ASA andSSSA, Madison, WI, USA
15. Fan TWM (1996) Metabolite profiling by one- and two-dimensional NMRanalysis of complex mixtures. Prog Nucl Mag Res Sp 28(2):161–219
16. Nicholson JK, Foxall PJ, Spraul M, Farrant RD, Lindon LC (1995) 750 MHz 1H and1H-13C NMR spectroscopy of human blood plasma. Anal Chem 67(5):793–811
17. Mussatto SI, Roberto IC (2006) Chemical characterization and liberation ofpentose sugars from brewers spent grain. J Chem Technol Biot 81(3):268–274
18. Khidzir K, Noorlidah A, Agamuthu P (2010) Brewery spent grain: chemicalcharacteristics and utilization as an enzyme substrate. Malay J Sci 29(1):41–51

Al Chami et al. Chemical and Biological Technologies in Agriculture 2014, 1:17 Page 12 of 13http://www.chembioagro.com/content/1/1/17
19. Gupta M, Abu-Ghannam N, Gallaghar E (2010) Barley for brewing: characteristicchanges during malting, brewing and applications of its by-products. ComprRev Food Sci Food Saf 9(3):318–328
20. Kotlar CE, Belagardi M, Roura SI (2011) Brewer's spent grain: characterizationand standardization procedure for the enzymatic hydrolysis by Bacilluscereus strain. Biotechnol Appl Bioc 58(6):464–475
21. Bianco VV, Damato G, Girardi A (1994) Sowing dates, plant density and‘crown’ cutting on yield and quality of florence fennel “seed”. In: QuagliottiL, Belletti P (ed). Acta Hort 362:59–66
22. Muckensturm B, Foechterlen D, Reduron JP, Danton P, Hildenbrand M(1997) Phytochemical and chemotaxonomic studies of Foeniculum vulgare.Biochem Syst Ecol 25(4):353–358
23. Su HCF, Horvat R (1987) Isolation and characterization of four majorcomponents from insecticidally active lemon peel extract. J Agr Food Chem35(4):509–511
24. USDA (2011) Nutrient lists. National Nutrient Database for StandardReference, United States department of Agriculture. http://ndb.nal.usda.gov/ndb/foods/show?fg=9&man=&lfacet=&count=&max=25&sort=f&qlookup=&offset=175&format=Full&new=&rptfrm=nl&ndbno=09156&nutrient1=301&nutrient2=309&nutrient3=207&subset=0&totCount=336&measureby=m
25. Commission Decision 2006/799/EC (2006) Establishing revised ecological criteriaand the related assessment and verification requirements for the award of thecommunity eco-label to soil improvers. Official J L 325:28–34
26. Tian F, Li B, Ji B, Yang J, Zhang G, Chen Y, Luo Y (2009) Antioxidant andantimicrobial activities of consecutive extracts from Galla chinensis: thepolarity affects the bioactivities. Food Chem 113(1):173–179
27. Kalia K, Sharma K, Singh HP, Singh B (2008) Effects of extraction methods onphenolic contents and antioxidant activity in aerial parts of Potentillaatrosanguinea Lodd. and quantification of its phenolic constituents byRP-HPLC. J Agr Food Chem 56(21):10129–10134
28. Taie HAA, Helal MMI, Helmy WA, Amer H (2013) Chemical composition andbiological potentials of aqueous extracts of fennel (Foeniculum vulgare L).J Appl Sci Res 9(3):1759–1767
29. Leal PF, Almeida TS, Prado GHC, Prado JM, Meireles MAA (2011) Extractionkinetics and anethole content of fennel (Foeniculum vulgare) and anise seed(Pimpinella anisum) extracts obtained by soxhlet, ultrasound, percolation,centrifugation, and steam distillation. Separ Sci Technol 46(11):1848–1856
30. Il-Suk K, Mi-Ra Y, Ok-Hwan L, Suk-Nam K (2011) Antioxidant activities of hotwater extracts from various spices. Int J Mol Sci 12(6):4120–4131
31. Kang HJ, Chawla SP, Jo C, Kwon JH, Byun MW (2006) Studies on the developmentof functional powder from citrus peel. Bioresource Technol 97(4):614–620
32. Zia-ur R (2006) Citrus peel extract—a natural source of antioxidant. FoodChem 99(3):450–454
33. Londoño-Londoño J, Lima VR, Lara O, Gil A, Pasa TBC, Arango GJ, Pineda JRR(2010) Clean recovery of antioxidant flavonoids from citrus peel: Optimizing anaqueous ultrasound-assisted extraction method. Food Chem 119(1):81–87
34. Tsibranska I, Tylkowski B, Kochanov R, Alipieva K (2011) Extraction of biologicallyactive compounds from Sideritis ssp. L Food Bioprod Process 89(4):273–280
35. Kim WJ, Kim J, Veriansyah B, Kim JD, Lee YW, Oh SG, Tjandrawinata RR(2009) Extraction of bioactive components from Centella asiatica usingsubcritical water. J Supercrit Fluid 48(3):211–216
36. Gamiz-Gracia L, Luque de Castro MD (2000) Continuous subcritical waterextraction of medicinal plant essential oil: comparison with conventionaltechniques. Talanta 51(6):1179–1185
37. Tubtimdee C, Shotipruk A (2011) Extraction of phenolics from Terminaliachebula Retz with water–ethanol and water–propylene glycol and sugaring-out concentration of extracts. Sep Purif Technol 77(3):339–346
38. Katembe WJ, Ungar IA, Mitchell JP (1998) Effect of Salinity on Germination andSeedling Growth of two Atriplex species (Chenopodiaceae). Ann Bot 82(2):167–175
39. Redmann RE, Abouguendia ZM (1979) Germination and seedling growth onsubstrates with extreme pH: laboratory evaluation of buffers. J Appl Ecol16(3):901–907
40. Politycka B, Wójcik-Wojtkowiak D, Pudelski T (1985) Phenolic compounds asa cause of phytotoxicity in greenhouse substrates repeatedly used incucumber growing. Acta Hort 156:89–94
41. Stalikas CD (2007) Extraction, separation, and detection methods forphenolic acids and flavonoids. J Sep Sci 30(18):3268–3295
42. Naczk M, Shahidi F (2004) Extraction and analysis of phenolics in food.J Chromatogr A 1054(1–2):95–111
43. Shahidi F, Daun JK, DeClercq DR (1997) Glucosinolates in Brassica oilseeds:processing effects and extraction. In: Antinutrients and Phytochemicals in
Food. ACS Symposium Series. American Chemical Society. http://pubs.acs.org/doi/abs/10.1021/bk-1997-0662.ch009
44. Munir O, Ilhami G, I'Rfan OK (2010) Determination of in vitro antioxidantactivity of fennel (Foeniculum vulgare) seed extracts. LWT-Food Sci Technol36(2):263–271
45. Parejo I, Jauregui O, Sanchez-Rabaneda F, Viladomat F, Bastida J, Codina C(2004) Separation and characterization of phenolic compounds in fennel(Foeniculum vulgare) using liquid chromatography-negative electrosprayionization tandem mass spectrometry. J Agr Food Chem 52(12):3679–3687
46. Paari A, Naidu HK, Kanmani P, Satishkumar R, Yuvaraj N, Pattukumar V, Arul V(2012) Evaluation of irradiation and heat treatment on antioxidant propertiesof fruit peel extracts and its potential application during preservation of goatfish Parupenaeus indicus. Food Bioprocess Technol 5(5):1860–1870
47. Ward JL, Baker JM, Beale MH (2007) Recent applications of NMRspectroscopy in plant metabolomics. FEBS J 274(5):1126–1131
48. Nicholson JK, Wilson ID (1989) High-resolution proton magnetic resonancespectroscopy of biological fluids. Prog Nucl Magn Reson Spectrosc21(4–5):449–501
49. Del Coco L, Assfalg M, D'Onofrio M, Sallustio F, Pesce F, Fanizzi FP,Schena FP (2013) A proton nuclear magnetic resonance-basedmetabolomic approach in IgA nephropathy urinary profiles. Metabolomics9(3):740–751
50. Godelmann R, Fang F, Humpfer E, Scütz B, Bansbach M, Schäfer H, Spraul M(2013) Targeted and nontargeted wine analysis by 1H NMR spectroscopycombined with multivariate statistical analysis. Differentiation of importantparameters: Grape variety, geographical origin, year of vintage. J Agric FoodChem 61(23):5610–5619
51. Del Coco L, De Pascali SA, Fanizzi FP (2014) 1H NMR spectroscopy andmultivariate analysis of monovarietal EVOOs as a tool for modulatingCoratina-based blends. Foods 3(2):238–249
52. De Pascali SA, Coletta A, Del Coco L, Basile T, Gambacorta G, Fanizzi FP(2014) Viticultural practice and winemaking effects on metabolic profile ofNegroamaro. Food Chem 161:112–119
53. Bohme M (1999) Effects of lactate, humate and Bacillus subtilis on thegrowth of tomato plants in hydroponic systems. Acta Hort 481:231–239
54. Bohme M, Ouahid A, Shaban N (2000) Reaction of some vegetablecrops to treatments with lactate as bioregulator and fertilizer. Acta Hort514:33–40
55. Pracharoenwattana I, Zhou WX, Keech O, Francisco PB, Udomchalothorn T,Tschoep H, Stitt M, Gibon Y, Smith SM (2010) Arabidopsis has a cytosolicfumarase required for the massive allocation of photosynthate intofumaric acid and for rapid plant growth on high nitrogen. Plant J62(5):785–795
56. Mussatto S (2009) Biotechnological potential of brewing industry by-products. In: Nigam P, Pandey A (ed) Biotechnology for agro-industrialresidues utilisation. Springer, Netherlands
57. Huige N (1994) Brewery by-products and effluents. In: Wa H (ed) Handbookof brewing. Marcel Dekker, New York
58. Santos M, Jiménez JJ, Bartolomé B, Gómez-Cordovés C, del Nozal MJ(2003) Variability of brewer's spent grain within a brewery. Food Chem80(1):17–21
59. Madhujith T, Shahidi F (2007) Antioxidative and antiproliferative propertiesof selected barley (Hordeum vulgarae L.) cultivars and their potential forinhibition of low-density lipoprotein (LDL) cholesterol oxidation. J Agr FoodChem 55(13):5018–5024
60. Jan A, Nakamura H, Handa H, Ichikawa H, Matsumoto H, Komatsu S (2006)Gibberellin regulates mitochondrial pyruvate dehydrogenase activity in rice.Plant Cell Physiol 47(2):244–253
61. Yu H, Du X, Zhang F, Zhang F, Hu Y, Liu S, Jiang X, Wang G, Liu D (2012) Amutation in the E2 subunit of the mitochondrial pyruvate dehydrogenasecomplex in Arabidopsis reduces plant organ size and enhances theaccumulation of amino acids and intermediate products of the TCA Cycle.Planta 236(2):387–399
62. Mandalari G, Bennett RN, Bisignano G, Saija A, Dugo G, Lo Curto RB, FauldsCB, Waldron KW (2006) Characterization of flavonoids and Pectins frombergamot (Citrus bergamia Risso) peel, a major byproduct of essential oilextraction. J Agr Food Chem 54(1):197–203
63. Poli A, Anzelmo G, Fiorentino G, Nicolaus B, Tommonaro G, Donato PD(2011) Polysaccharides from wastes of vegetable industrial processing: newopportunities for their eco-friendly re-use. In: Elnashar M (ed) Biotechnologyof Biopolymers. InTech publication. doi:10.5772/16387

Al Chami et al. Chemical and Biological Technologies in Agriculture 2014, 1:17 Page 13 of 13http://www.chembioagro.com/content/1/1/17
64. Jones D (1998) Organic acids in the rhizosphere—a critical review. Plant Soil205(1):25–44
65. Dennis DT, Turpin DH, Lefebvre DD, Layzell DB (1997) Plant metabolism.Addison Wesley Longman Ltd, Harlow UK. Plant metabolism
66. Sun YL, Hong SK (2011) Effects of citric acid as an important component ofthe responses to saline and alkaline stress in the halophyte Leymuschinensis (Trin.). Plant Growth Regul 64(2):129–139
doi:10.1186/s40538-014-0017-xCite this article as: Al Chami et al.: Extraction and characterization ofbio-effectors from agro-food processing by-products as plant growthpromoters. Chemical and Biological Technologies in Agriculture 2014 1:17.
Submit your manuscript to a journal and benefi t from:
7 Convenient online submission
7 Rigorous peer review
7 Immediate publication on acceptance
7 Open access: articles freely available online
7 High visibility within the fi eld
7 Retaining the copyright to your article
Submit your next manuscript at 7 springeropen.com