Embed Size (px)
Citation preview
Cazalis et al. Intensive Care Medicine Experimental 2014, 2:20http://www.icm-experimental.com/content/2/1/20
RESEARCH Open Access
Early and dynamic changes in gene expression inseptic shock patients: a genome-wide approachMarie-Angélique Cazalis1*, Alain Lepape1,3,5, Fabienne Venet1,2,5, Florence Frager1, Bruno Mougin4, Hélène Vallin3,Malick Paye4, Alexandre Pachot1 and Guillaume Monneret1,2,5
* Correspondence: [email protected] Unit “Sepsis” Hospices Civilsde Lyon - bioMérieux, HôpitalEdouard Herriot - Hospices Civils deLyon, Pavillon P - 5 place d’Arsonval,69437 Lyon Cedex 03, FranceFull list of author information isavailable at the end of the article
©Am
Abstract
Background: As early and appropriate care of severe septic patients is associatedwith better outcome, understanding of the very first events in the disease processis needed. Pan-genomic analyses offer an interesting opportunity to study globalgenomic response within the very first hours after sepsis.The objective of this study was to investigate the systemic genomic response insevere intensive care unit (ICU) patients and determine whether patterns of geneexpression could be associated with clinical severity evaluated by the severity score.
Methods: Twenty-eight ICU patients were enrolled at the onset of septic shock.Blood samples were collected within 30 min and 24 and 48 h after shock andgenomic response was evaluated using microarrays. The genome-wide expressionpattern of blood leukocytes was sequentially compared to healthy volunteers andafter stratification based on Simplified Acute Physiology Score II (SAPSII) score toidentify potential mechanisms of dysregulation.
Results: Septic shock induces a global reprogramming of the whole leukocytetranscriptome affecting multiple functions and pathways (>71% of the whole genomewas modified). Most altered pathways were not significantly different betweenSAPSII-high and SAPSII-low groups of patients. However, the magnitude and theduration of these alterations were different between these two groups. Importantly,we observed that the more severe patients did not exhibit the strongest modulation.This indicates that some regulation mechanisms leading to recovery seem to takeplace at the early stage.
Conclusions: In conclusion, both pro- and anti-inflammatory processes, measured at thetranscriptomic level, are induced within the very first hours after septic shock. Interestingly,the more severe patients did not exhibit the strongest modulation. This highlights thatnot only the responses mechanisms by themselves but mainly their early and appropriateregulation are crucial for patient recovery. This reinforces the idea that an immediateand tailored aggressive care of patients, aimed at restoring an appropriately regulatedimmune response, may have a beneficial impact on the outcome.
Keywords: Septic shock; Transcriptomic; Microarray; Severity; SAPSII; Genomic response
BackgroundDespite improvements in initial resuscitation and supportive care, septic shock remains
the major cause of mortality in intensive care units (ICU) worldwide [1]. The failure of
15 years of clinical trials assessing adjunctive therapies together with recent research
2014 Cazalis et al.; licensee Springer. This is an Open Access article distributed under the terms of the Creative Commonsttribution License (http://creativecommons.org/licenses/by/2.0), which permits unrestricted use, distribution, and reproduction in anyedium, provided the original work is properly credited.

Cazalis et al. Intensive Care Medicine Experimental 2014, 2:20 Page 2 of 17http://www.icm-experimental.com/content/2/1/20
advances in pathophysiology [2,3] suggest the need to better define the disease and stratify
patients allowing for appropriate treatments and targeted therapy. Success in septic shock
treatment will rely on a more mediator-directed therapy and thus will require specific and
sensitive monitoring tools.
Many studies have aimed at dissecting mechanisms implicated in the disease, and it
is now well accepted that injuries in ICU patients lead not only to the initiation of an
uncontrolled and exacerbated pro-inflammatory response but also to a deep activation
of anti-inflammatory processes [4]. However, the exact chronology of this process remains
elusive [5]. It is well accepted that both systemic inflammatory response syndrome (SIRS)
and compensatory anti-inflammatory response syndrome (CARS) occur [6,7]. They may
be responsible for multiple-organ dysfunction syndrome (MODS) and cell reprograming/
immunosuppression [8,9]. From a clinical perspective, several studies have highlighted
that the first hours are critical for the response to injury and consequently for the patient’s
care and outcome [10-12]. This enforces the importance of characterizing patients early
in the process of the disease.
Microarray-based expression profiling provides an interesting opportunity to gain a
broader genome level ‘picture’ of a complex and heterogeneous clinical syndromes such
as septic shock [13]. These powerful genomic approaches are recommended by opinion
leaders to identify specific pathways that could be targeted by different drugs depending
on patients’ subset [3]. It is exemplified by a recent genomic description in trauma
patients [14], showing that mRNA genes of both immune activation and immune
suppression were concomitantly expressed early after injury.
As trauma and septic shock share similarities in pathophysiology and as the understand-
ing of the global host response in sepsis would have a major impact on the successful use
of targeted therapies [3], the main objective of the study was to analyze the genome-wide
expression patterns of blood leukocytes sequentially during the first 48 h after septic
shock. We also investigated whether patterns of gene expression within the first 48 h after
septic shock were different in the two extremes of clinical severity using a stratification
based on the Simplified Acute Physiology Score II (SAPSII).
MethodsPatients
Twenty-eight patients, 18 years and above, admitted to two ICUs of a university hospital
for septic shock were included. Their clinical characteristics are shown in Table 1. The
diagnosis of septic shock was based on the ACCP/SCCM criteria [15].
Sepsis is defined as the combination of a SIRS and infection diagnosed macroscopically
and microbiologically. SIRS is defined as a clinical situation involving at least two of the
following clinical criteria: hypothermia (<36°C) or hyperthermia (>38°C), tachycardia
(>90/min), tachypnea (>20 breaths/min) and/or arterial PCO2 of 32 mmHg or lower and/
or mechanical ventilation, and leukocytosis (>12,000/mm3) or leukopenia (<4,000/mm3).
Septic shock was defined as acute circulatory failure (systolic blood pressure <90 mmHg,
mean arterial pressure <65 mmHg, or a reduction in systolic blood pressure >40 mmHg
from baseline) despite adequate volume resuscitation. In order to limit potential confound-
ing effects of other conditions affecting immunity, patients with one or more severe comor-
bidities (i.e., the human immunodeficiency syndrome, hematologic malignancies evolving
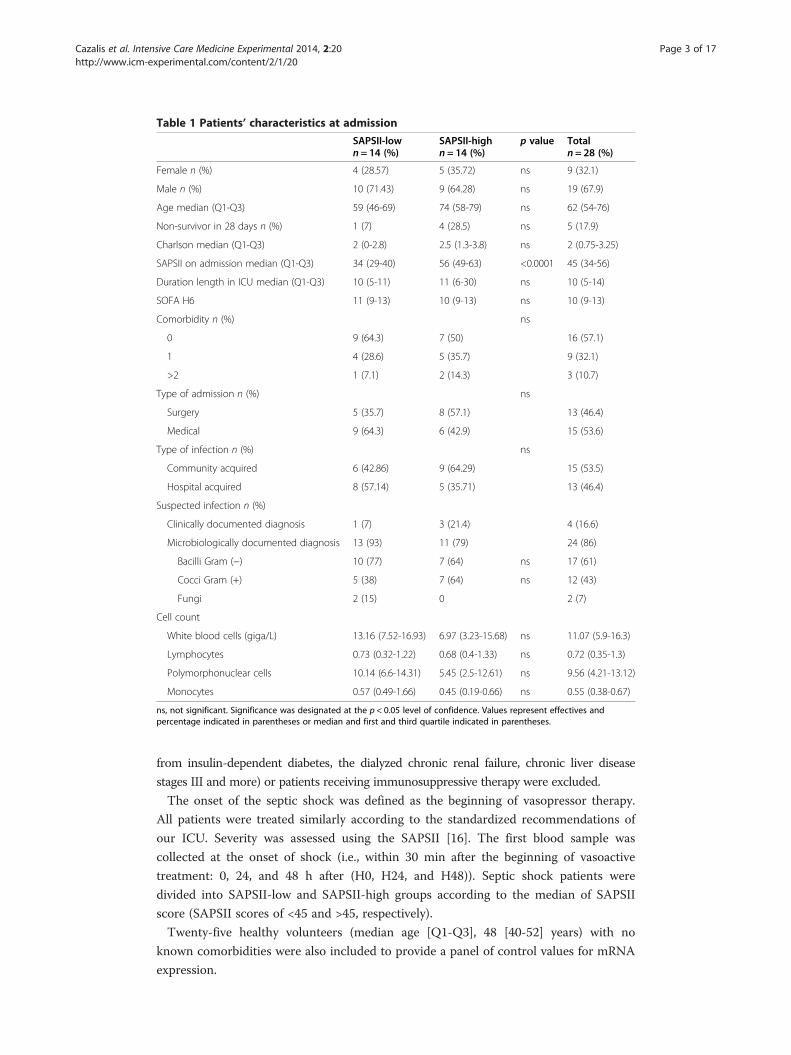
Table 1 Patients’ characteristics at admission
SAPSII-lown = 14 (%)
SAPSII-highn = 14 (%)
p value Totaln = 28 (%)
Female n (%) 4 (28.57) 5 (35.72) ns 9 (32.1)
Male n (%) 10 (71.43) 9 (64.28) ns 19 (67.9)
Age median (Q1-Q3) 59 (46-69) 74 (58-79) ns 62 (54-76)
Non-survivor in 28 days n (%) 1 (7) 4 (28.5) ns 5 (17.9)
Charlson median (Q1-Q3) 2 (0-2.8) 2.5 (1.3-3.8) ns 2 (0.75-3.25)
SAPSII on admission median (Q1-Q3) 34 (29-40) 56 (49-63) <0.0001 45 (34-56)
Duration length in ICU median (Q1-Q3) 10 (5-11) 11 (6-30) ns 10 (5-14)
SOFA H6 11 (9-13) 10 (9-13) ns 10 (9-13)
Comorbidity n (%) ns
0 9 (64.3) 7 (50) 16 (57.1)
1 4 (28.6) 5 (35.7) 9 (32.1)
>2 1 (7.1) 2 (14.3) 3 (10.7)
Type of admission n (%) ns
Surgery 5 (35.7) 8 (57.1) 13 (46.4)
Medical 9 (64.3) 6 (42.9) 15 (53.6)
Type of infection n (%) ns
Community acquired 6 (42.86) 9 (64.29) 15 (53.5)
Hospital acquired 8 (57.14) 5 (35.71) 13 (46.4)
Suspected infection n (%)
Clinically documented diagnosis 1 (7) 3 (21.4) 4 (16.6)
Microbiologically documented diagnosis 13 (93) 11 (79) 24 (86)
Bacilli Gram (−) 10 (77) 7 (64) ns 17 (61)
Cocci Gram (+) 5 (38) 7 (64) ns 12 (43)
Fungi 2 (15) 0 2 (7)
Cell count
White blood cells (giga/L) 13.16 (7.52-16.93) 6.97 (3.23-15.68) ns 11.07 (5.9-16.3)
Lymphocytes 0.73 (0.32-1.22) 0.68 (0.4-1.33) ns 0.72 (0.35-1.3)
Polymorphonuclear cells 10.14 (6.6-14.31) 5.45 (2.5-12.61) ns 9.56 (4.21-13.12)
Monocytes 0.57 (0.49-1.66) 0.45 (0.19-0.66) ns 0.55 (0.38-0.67)
ns, not significant. Significance was designated at the p < 0.05 level of confidence. Values represent effectives andpercentage indicated in parentheses or median and first and third quartile indicated in parentheses.
Cazalis et al. Intensive Care Medicine Experimental 2014, 2:20 Page 3 of 17http://www.icm-experimental.com/content/2/1/20
from insulin-dependent diabetes, the dialyzed chronic renal failure, chronic liver disease
stages III and more) or patients receiving immunosuppressive therapy were excluded.
The onset of the septic shock was defined as the beginning of vasopressor therapy.
All patients were treated similarly according to the standardized recommendations of
our ICU. Severity was assessed using the SAPSII [16]. The first blood sample was
collected at the onset of shock (i.e., within 30 min after the beginning of vasoactive
treatment: 0, 24, and 48 h after (H0, H24, and H48)). Septic shock patients were
divided into SAPSII-low and SAPSII-high groups according to the median of SAPSII
score (SAPSII scores of <45 and >45, respectively).
Twenty-five healthy volunteers (median age [Q1-Q3], 48 [40-52] years) with no
known comorbidities were also included to provide a panel of control values for mRNA
expression.

Cazalis et al. Intensive Care Medicine Experimental 2014, 2:20 Page 4 of 17http://www.icm-experimental.com/content/2/1/20
Protocol was approved by Comité consultatif de Protection de Personnes (CPP) de
Lyon A, and informed consent forms were signed by patients (or by a third party
based on the patient’s state of consciousness).
Sample collection, processing, and microarray hybridization
Peripheral blood samples were collected in PAXgene™ Blood RNA tubes (PreAnalytix,
Hombrechtikon, Switzerland) in order to stabilize mRNA [17]. Total RNA was ex-
tracted according to the manufacturer’s instructions. Briefly, total RNA was isolated using
the PAXgeneTM blood RNA kit (PreAnalytix). The residual genomic DNA was digested
using the RNase-Free DNase set (Qiagen Valencia, CA, USA). The integrity of the total
RNA was assessed using Agilent 2100 Bioanalyzer (Agilent Technologies, Santa Clara,
CA, USA). The 104 microarray experiments (corresponding to the three time points of
the 28 septic shock and the 25 healthy volunteers) were performed as previously de-
scribed [18]. Briefly, gene expressions were generated using GeneChip® Human Gen-
ome U133 Plus 2.0 arrays (Affymetrix, Sta. Clara, CA, USA) according to manufacturer’s
protocol. Affymetrix GeneChip Operating Software version 1.4 (GCOS) was used to man-
age GeneChip array data and to automate the control of GeneChip fluidics stations
(FS450) and scanner (GeneChip® Scanner 3000). Data from this experiment have been
deposited in the National Center for Biotechnology Information (NCBI) and are avail-
able in the GEO DataSets site under accession number GSE57065.
Reverse transcription and quantitative PCR
Total RNA was reverse transcribed into cDNA using the SuperScript III reverse
transcription-polymerase chain reaction (PCR) system (Invitrogen Life Technologies,
Carlsbad, CA, USA) according to the manufacturer’s instructions. mRNA expression
was quantified using quantitative real-time polymerase chain reaction. Briefly, PCR
reactions were performed using a LightCycler instrument with the Fast-Start DNA
Master SYBR Green I real-time PCR kit according to the manufacturer’s instructions
(Roche, Basel, Switzerland). Thermocycling was performed in a final volume of 20 μL
containing 3 mM of MgCl2 and 0.5 μM each of the required primers. PCR was per-
formed with an initial denaturation step of 10 min at 95°C followed by 40 cycles of a
touchdown PCR protocol (10 s at 95°C, 10 s annealing at 68°C to 58°C, and 16 s exten-
sion at 72°C). mRNA expression of genes was investigated using specific cDNA stan-
dards. The cDNA standard was prepared from purified PCR amplicons obtained for each
candidate genes: TBX21 (FP: 5′-TGTGACCCAGATGATTGTGCT-3′, RP: 5′-AG
CTGAGTAATCTCGGCATTC-3′), GATA3 (FP: 5′-AAGCGAAGGCTGTCTGCAG
C-3′, RP: 5′-GGGTCTGTTAATATTGTGAAGC-3′), CX3CR1 (FP: 5′-AGTCTGA
GCAGGACAGGGTG-3′, RP: 5′-GTCCCAAAGACCACGATGTCC-3′), HLA-DRA
(FP: 5′-GCCTCTTCTCAAGCACTGGGA-3′, RP: 5′-CCACCAGACCCACAGTC
AGG-3′), IRAK-3 (FP: 5′-CTCGGAATTTCTCTGCCAAG-3′, RP: 5′-GTGGGAGG
ATCTTCAGCAAA-3′), and for the housekeeping gene peptidylpropyl isomerase B
encoding for cyclophilin B; PPIB (FP: 5′-GGAGATGGCACAGGAGGAAAGA-3′, RP:
5′-GGGAGCCGTTGGTGTCTTTG-3′). The second derivative maximum method
was used with the LightCycler software to automatically determine the crossing point
for individual samples. Standard curves were generated by quadruplicate cDNA
Cazalis et al. Intensive Care Medicine Experimental 2014, 2:20 Page 5 of 17http://www.icm-experimental.com/content/2/1/20
standard. Relative standard curves describing the PCR efficiency of selected genes
were created and used to perform efficiency-corrected quantification with the LightCycler
Relative Quantification Software (Roche Molecular Biochemicals). The results were
expressed as a concentration ratio between the target gene mRNA and peptidylpropyl
isomerase B mRNA levels.
Data analysis
Univariate analysis was performed to compare characteristics between groups using either
the chi-squared or Mann-Whitney U test.
Gene expression data were imported into Partek Genomics Suite 6.5 (Partek, St Louis,
MO, USA) as .CEL files using default parameters. Transcriptomic data were normalized
with gc-Robust Multi-array Average (gcRMA) algorithm. The RMA method [19] consists
of three steps: background adjustment, quantile normalization [20], and probe set
summarization of the log-normalized data applying a median polishing procedure.
Differential expression analysis was performed using analysis of variance (ANOVA). A
step-up false discovery rate (FDR) was applied to p values from the linear contrasts to
determine a cutoff for significantly differentially expressed genes. Gene lists were created
using cutoff of FDR <0.05 and twofold change. Hierarchical clustering was performed
using the gene expression module from Partek. Euclidian distance method after
normalization by shift mean columns to mean of zero and scale to standard deviation
of 1 was used. Gene ontology, functional enrichment, and canonical pathways analyses
were performed using Ingenuity Pathway Analysis (IPA) [12,21] (www.ingenuity.com).
Fisher’s exact test was used to calculate the p value for determining the probability that
each function or pathway assigned to the dataset was due to chance alone. The Human
Genome U133 Plus 2.0 array was used as the reference.
ResultsPatients’ clinical characteristics
The patient’s characteristics at admission are presented in Table 1. The age and sex distri-
bution was similar to what is usually observed in septic shock patients’ cohorts, with a
percentage of male patients (63.3%) higher than female and a median age of 62 years. The
SAPSII and the Sequential Organ Failure Assessment (SOFA) scores were high (median
[Q1-Q3]: 45 [34-56] and 11 [9-13] respectively), although the mortality rate was lower
(18%) than usually described in the literature (>30%) for such severe patients [22].
Gene expression patterns in septic shock patients over time
Our microarray data showed clearly that septic shock patients developed major
genomic alterations during the first 48 h after the onset of shock affecting more
than 71% of the human genome. As shown in Figure 1A, most of these alterations
were already detectable within the first 30 min following admission since more than
60% of the human genome was already altered at H0.
In addition, the transcriptome disruptions observed at H0 appeared to be particularly
stable during the study period (Figure 1B). Indeed, over a total of 14,341 unique Entrez
genes differentially expressed (FDR adjusted probability <0.05), 8,885 were in common
between the three time points (i.e., H0, H24, and H48). While the mRNA expression of

Figure 1 Genes differentially expressed (GDE) between septic shock patients and healthy volunteers.(A) Results summary table representing the percentage of modulated genes using a false discovery rate (FDR)adjusted probability <0.05 over the 48 h compared to the human genome (Entrez genes included in HG-U133plus 2.0 microarray). The table also shows the percentage of significant (FDR <0.05 and FC >2) down- andupregulated genes. (B) Venn diagram representing the GDE between septic shock and healthy volunteersusing a false discovery rate (FDR) adjusted probability <0.05. Values represent the number of unique Entrezgenes found significantly changed in whole blood of patients at the onset of shock (H0) and 24 and 48 hafter (H24 and H48).
Cazalis et al. Intensive Care Medicine Experimental 2014, 2:20 Page 6 of 17http://www.icm-experimental.com/content/2/1/20
most of these genes was already altered at H0, their number seemed to decrease slowly
up to H48, indicating that most of the phenomenon had already occurred at admission.
When compared to healthy volunteers, the percentage of downregulated genes at H0
(56.1%) was higher than the percentage of upregulated ones (43.9%). The percentage of
downregulated genes trended toward a decrease, while the percentage of upregulated
ones increased over the first 48 h (53.7% and 47.8% of the downregulated genes at H24
and H48, respectively).
Biological functions and pathways involved in septic shock response
The gene ontology analysis performed on 8,885 genes commonly modulated at the
three time points showed an enrichment of infectious disease processes (Table 2). In
addition, most of the molecular functions deregulated during the first 48 h were associated
with cellular rearrangement.
Among the most increased canonical pathways enriched at H0 (Figure 2A), 6 out of
10 were related to molecules involved in the endotoxin tolerance or pathogen recognition
as well as cytokines/cytokine receptors, leading to increased inflammation and innate
immune response. For example, the expressions of IL1R1, IL1R2, IL1RAP, IL1RN, IL18,
IL18RAP, IL4R, IL10, IFNGR1, TGFBR1, IRAK3, MAP2K6, MAPK1, MAPK14, SOCS3,
S100A8, MMP9, LY96, JAK2, JAK3, and NFKBIA were significantly increased after shock.
In parallel, most of the top 10 gene families suppressed after septic shock were related
to T cell signaling and antigen-mediated response (Figure 2B). For example, expressions
of gene part of the T cell receptor (TCR) complex such as CD247, CD3E, CD3G, and
CD3D were markedly decreased, as well as antigen-presentation genes like HLA-DMA,
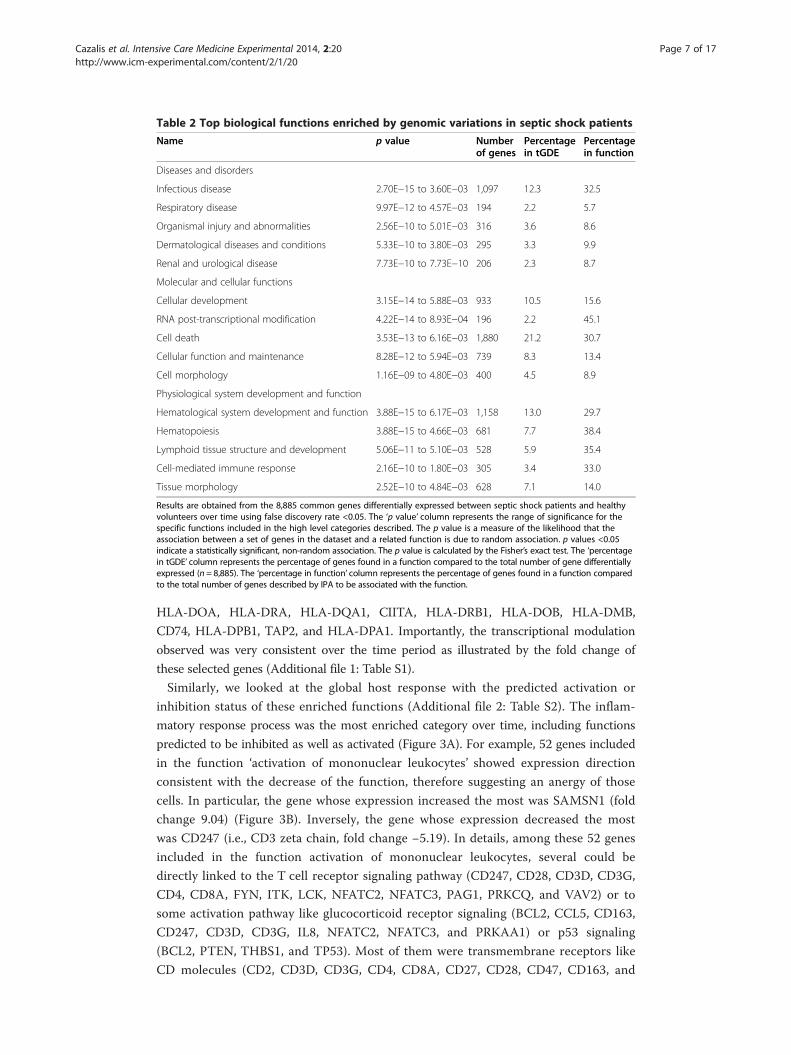
Table 2 Top biological functions enriched by genomic variations in septic shock patients
Name p value Numberof genes
Percentagein tGDE
Percentagein function
Diseases and disorders
Infectious disease 2.70E−15 to 3.60E−03 1,097 12.3 32.5
Respiratory disease 9.97E−12 to 4.57E−03 194 2.2 5.7
Organismal injury and abnormalities 2.56E−10 to 5.01E−03 316 3.6 8.6
Dermatological diseases and conditions 5.33E−10 to 3.80E−03 295 3.3 9.9
Renal and urological disease 7.73E−10 to 7.73E−10 206 2.3 8.7
Molecular and cellular functions
Cellular development 3.15E−14 to 5.88E−03 933 10.5 15.6
RNA post-transcriptional modification 4.22E−14 to 8.93E−04 196 2.2 45.1
Cell death 3.53E−13 to 6.16E−03 1,880 21.2 30.7
Cellular function and maintenance 8.28E−12 to 5.94E−03 739 8.3 13.4
Cell morphology 1.16E−09 to 4.80E−03 400 4.5 8.9
Physiological system development and function
Hematological system development and function 3.88E−15 to 6.17E−03 1,158 13.0 29.7
Hematopoiesis 3.88E−15 to 4.66E−03 681 7.7 38.4
Lymphoid tissue structure and development 5.06E−11 to 5.10E−03 528 5.9 35.4
Cell-mediated immune response 2.16E−10 to 1.80E−03 305 3.4 33.0
Tissue morphology 2.52E−10 to 4.84E−03 628 7.1 14.0
Results are obtained from the 8,885 common genes differentially expressed between septic shock patients and healthyvolunteers over time using false discovery rate <0.05. The ‘p value’ column represents the range of significance for thespecific functions included in the high level categories described. The p value is a measure of the likelihood that theassociation between a set of genes in the dataset and a related function is due to random association. p values <0.05indicate a statistically significant, non-random association. The p value is calculated by the Fisher’s exact test. The ‘percentagein tGDE’ column represents the percentage of genes found in a function compared to the total number of gene differentiallyexpressed (n = 8,885). The ‘percentage in function’ column represents the percentage of genes found in a function comparedto the total number of genes described by IPA to be associated with the function.
Cazalis et al. Intensive Care Medicine Experimental 2014, 2:20 Page 7 of 17http://www.icm-experimental.com/content/2/1/20
HLA-DOA, HLA-DRA, HLA-DQA1, CIITA, HLA-DRB1, HLA-DOB, HLA-DMB,
CD74, HLA-DPB1, TAP2, and HLA-DPA1. Importantly, the transcriptional modulation
observed was very consistent over the time period as illustrated by the fold change of
these selected genes (Additional file 1: Table S1).
Similarly, we looked at the global host response with the predicted activation or
inhibition status of these enriched functions (Additional file 2: Table S2). The inflam-
matory response process was the most enriched category over time, including functions
predicted to be inhibited as well as activated (Figure 3A). For example, 52 genes included
in the function ‘activation of mononuclear leukocytes’ showed expression direction
consistent with the decrease of the function, therefore suggesting an anergy of those
cells. In particular, the gene whose expression increased the most was SAMSN1 (fold
change 9.04) (Figure 3B). Inversely, the gene whose expression decreased the most
was CD247 (i.e., CD3 zeta chain, fold change −5.19). In details, among these 52 genes
included in the function activation of mononuclear leukocytes, several could be
directly linked to the T cell receptor signaling pathway (CD247, CD28, CD3D, CD3G,
CD4, CD8A, FYN, ITK, LCK, NFATC2, NFATC3, PAG1, PRKCQ, and VAV2) or to
some activation pathway like glucocorticoid receptor signaling (BCL2, CCL5, CD163,
CD247, CD3D, CD3G, IL8, NFATC2, NFATC3, and PRKAA1) or p53 signaling
(BCL2, PTEN, THBS1, and TP53). Most of them were transmembrane receptors like
CD molecules (CD2, CD3D, CD3G, CD4, CD8A, CD27, CD28, CD47, CD163, and

Figure 2 Top canonical pathways affected in septic shock. (A and B) The 10 top up- and downregulatedcanonical pathways enriched by genes differentially expressed over time. The graph shows the −log10 (p value)of the enrichment of the pathway.
Cazalis et al. Intensive Care Medicine Experimental 2014, 2:20 Page 8 of 17http://www.icm-experimental.com/content/2/1/20
CD247), MHC genes (CD74, HLA-DRA, and HLA-DRB1), or transcription factors
(GATA3, NFATC2, NFATC3, STAT4, TBX21, and TP53).
Inversely, the function ‘phagocytosis of cells’ was predicted to be activated during the
kinetic. The 22 genes involved in this function were found with expressions consistent
with its activation, either increased (e.g., PROS1, MERTK, FCGR1A, THBS1, or
ITGAM), or decreased (e.g., CD47, FOXP1, or FYN).
Five genes selected within these functional categories were validated by qRT-PCR. The
gene expressions measured by either microarray or qRT-PCR were highly correlated
(Additional file 3: Figure S1).
Functional analysis of genes in severe versus less severe patients
SAPSII is a reliable score for severity assessment in septic patients and is therefore
frequently used to stratify patients in clinical studies [23]. In order to investigate
whether the two extremes of severity after septic shock could be associated with
different genomic responses and overtime evolutions, we used the median SAPSII
values to stratify patients in our cohort in severe (SAPSII-high group, SAPSII >45)
and less severe (SAPSII-low group, SAPSII <45) groups. The clinical characteristics
for the SAPSII-high and SAPSII-low groups are presented in Table 1. A difference,
although not significant, was observed in mortality rate between the two severity
groups. We also observed a small difference between cell counts at admission, with

Figure 3 Enriched biological category analysis illustrated by inflammatory response function.(A) Inflammatory response functions (high-level functional category) found to be enriched by genesdifferentially expressed between septic shock patients and healthy volunteers over the 48 h. The z-scorevalue predicts the direction of change for the function. An absolute z-score of ≥2 is considered significant.A function is predicted to be increased if the z-score is ≥2 and decreased if the z-score is less than or equalto −2. Data for the comparison of septic shock patients versus healthy volunteers are represented at theonset of shock (H0) and 24 and 48 h after (H24, H48). (B) Highlight on the 52 genes that have expressiondirection consistent with decreases in activation of mononuclear leukocytes process.
Cazalis et al. Intensive Care Medicine Experimental 2014, 2:20 Page 9 of 17http://www.icm-experimental.com/content/2/1/20
decreased number of white blood cells in SAPSII-high group at admission (6.97
versus 13.16 in SAPSII-low group). This difference tended to decrease over the time
period, with 13.98 and 11.47 giga/L white blood cells at H48 for SAPSII-low and
SAPSII-high groups, respectively (data not shown).
Interestingly, an equal number of genes was significantly modulated (FDR <0.05;
fold change >2) in SAPSII-high and SAPSII-low groups compared to healthy volunteers at
the onset of shock (more than 67% of genes differentially expressed were in common -
Figure 4B). The highest difference in the response between SAPSII-low and SAPSII-high
groups was observed at H48 (1,735 genes differentially expressed in SAPSII-high analysis
compared to 1,161 in SAPSII-low group leading to only 44% of commonly regulated
genes at this time point) (Figure 4). Although the two severity groups seemed to have the
same genomic response at H0, the number of altered genes in SAPSII-low patients
decreased over the 48 h study period, returning to control values, whereas it remained
stable in the SAPSII-high group even with a trend toward increase (Figure 4C).
A functional analysis showed that the number of significantly enriched inhibited func-
tions was much higher than the number of activated ones (≈50 versus 15) (Figure 5A,B).
In the SAPSII-low patients group, a steady decrease in the number of statistically enriched
functions was observed (both inhibited and activated), while the number of activated
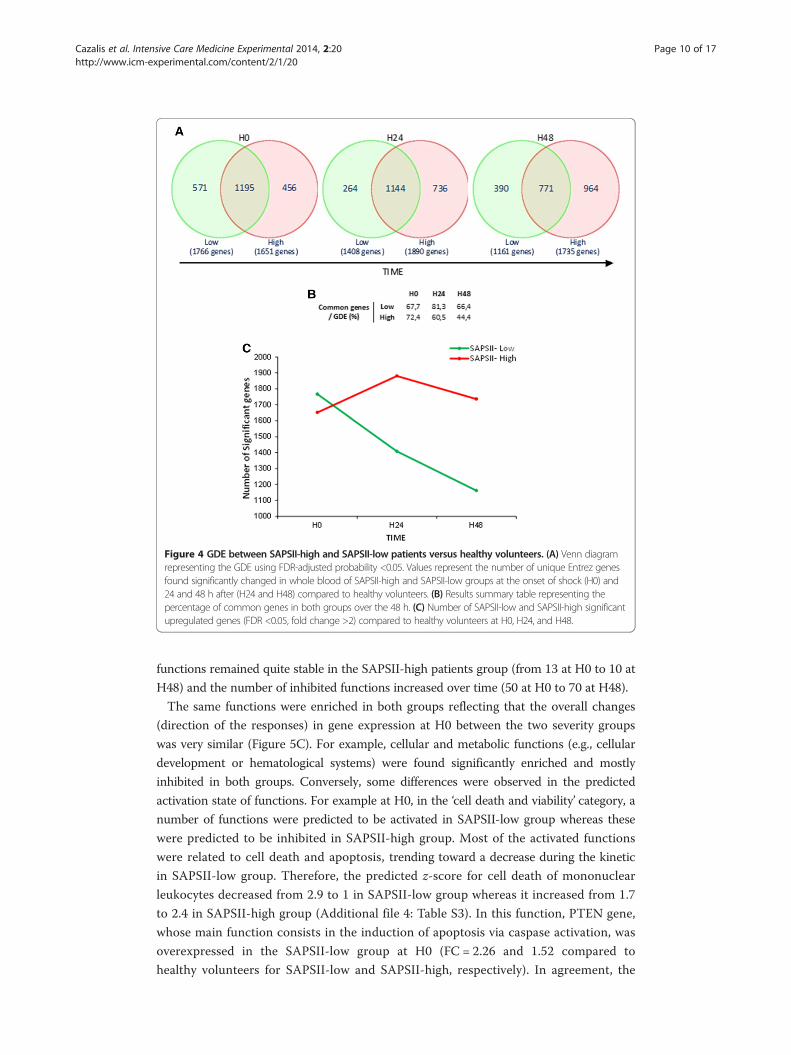
Figure 4 GDE between SAPSII-high and SAPSII-low patients versus healthy volunteers. (A) Venn diagramrepresenting the GDE using FDR-adjusted probability <0.05. Values represent the number of unique Entrez genesfound significantly changed in whole blood of SAPSII-high and SAPSII-low groups at the onset of shock (H0) and24 and 48 h after (H24 and H48) compared to healthy volunteers. (B) Results summary table representing thepercentage of common genes in both groups over the 48 h. (C) Number of SAPSII-low and SAPSII-high significantupregulated genes (FDR <0.05, fold change >2) compared to healthy volunteers at H0, H24, and H48.
Cazalis et al. Intensive Care Medicine Experimental 2014, 2:20 Page 10 of 17http://www.icm-experimental.com/content/2/1/20
functions remained quite stable in the SAPSII-high patients group (from 13 at H0 to 10 at
H48) and the number of inhibited functions increased over time (50 at H0 to 70 at H48).
The same functions were enriched in both groups reflecting that the overall changes
(direction of the responses) in gene expression at H0 between the two severity groups
was very similar (Figure 5C). For example, cellular and metabolic functions (e.g., cellular
development or hematological systems) were found significantly enriched and mostly
inhibited in both groups. Conversely, some differences were observed in the predicted
activation state of functions. For example at H0, in the ‘cell death and viability’ category, a
number of functions were predicted to be activated in SAPSII-low group whereas these
were predicted to be inhibited in SAPSII-high group. Most of the activated functions
were related to cell death and apoptosis, trending toward a decrease during the kinetic
in SAPSII-low group. Therefore, the predicted z-score for cell death of mononuclear
leukocytes decreased from 2.9 to 1 in SAPSII-low group whereas it increased from 1.7
to 2.4 in SAPSII-high group (Additional file 4: Table S3). In this function, PTEN gene,
whose main function consists in the induction of apoptosis via caspase activation, was
overexpressed in the SAPSII-low group at H0 (FC = 2.26 and 1.52 compared to
healthy volunteers for SAPSII-low and SAPSII-high, respectively). In agreement, the
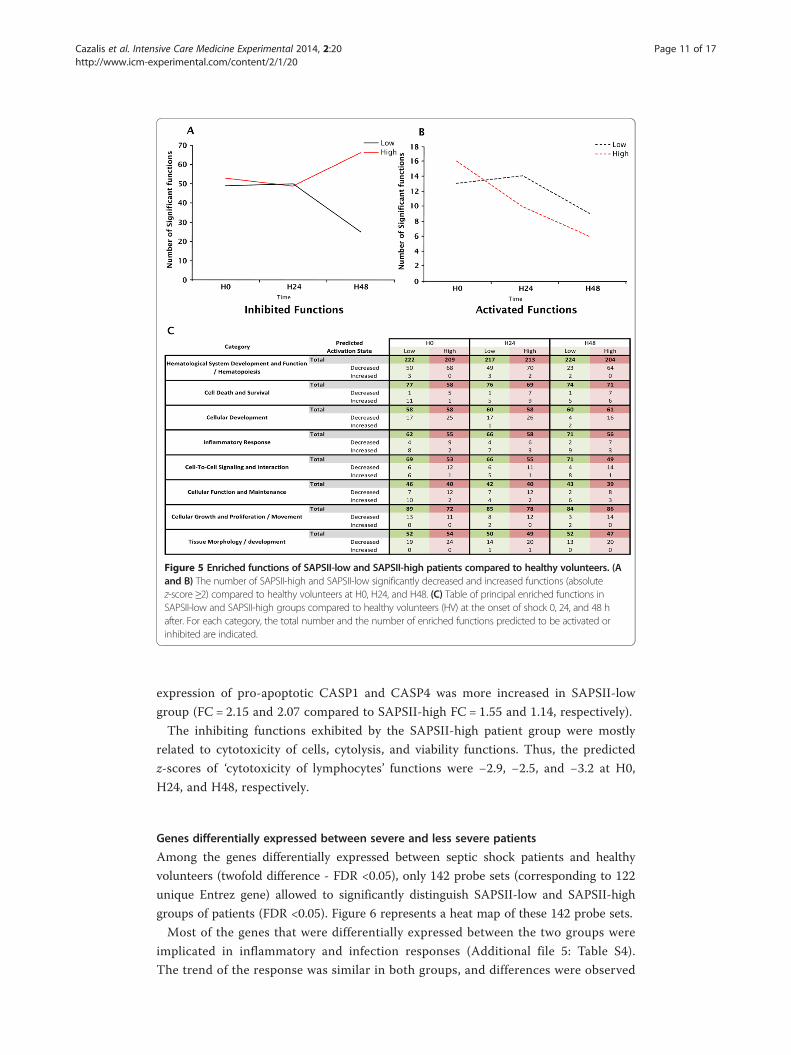
Figure 5 Enriched functions of SAPSII-low and SAPSII-high patients compared to healthy volunteers. (Aand B) The number of SAPSII-high and SAPSII-low significantly decreased and increased functions (absolutez-score ≥2) compared to healthy volunteers at H0, H24, and H48. (C) Table of principal enriched functions inSAPSII-low and SAPSII-high groups compared to healthy volunteers (HV) at the onset of shock 0, 24, and 48 hafter. For each category, the total number and the number of enriched functions predicted to be activated orinhibited are indicated.
Cazalis et al. Intensive Care Medicine Experimental 2014, 2:20 Page 11 of 17http://www.icm-experimental.com/content/2/1/20
expression of pro-apoptotic CASP1 and CASP4 was more increased in SAPSII-low
group (FC = 2.15 and 2.07 compared to SAPSII-high FC = 1.55 and 1.14, respectively).
The inhibiting functions exhibited by the SAPSII-high patient group were mostly
related to cytotoxicity of cells, cytolysis, and viability functions. Thus, the predicted
z-scores of ‘cytotoxicity of lymphocytes’ functions were −2.9, −2.5, and −3.2 at H0,
H24, and H48, respectively.
Genes differentially expressed between severe and less severe patients
Among the genes differentially expressed between septic shock patients and healthy
volunteers (twofold difference - FDR <0.05), only 142 probe sets (corresponding to 122
unique Entrez gene) allowed to significantly distinguish SAPSII-low and SAPSII-high
groups of patients (FDR <0.05). Figure 6 represents a heat map of these 142 probe sets.
Most of the genes that were differentially expressed between the two groups were
implicated in inflammatory and infection responses (Additional file 5: Table S4).
The trend of the response was similar in both groups, and differences were observed

Figure 6 Differences in gene expression between SAPSII-low and SAPSII-high groups. (A) Heat mapof 142 probe sets whose expression was (i) greater than or equal to twofold different (FDR <0.05) whencomparing healthy volunteers with SAPSII-low (Low) or SAPSII-high (High) groups and (ii) also significantlydifferent (FDR <0.05) between both groups of septic shock patients. Clustering was done using Euclidiandistance method after normalization (shift probe set expression to mean of zero and scale to standard deviationof 1). (B) A cluster illustrating genes that are downmodulated in patients versus controls, with genes remainingdownmodulated over time in SAPSII-high group only. (C) A cluster illustrating genes that are upmodulated inpatients versus controls, with genes remaining upmodulated over time in SAPSII-high group only. (D) A clusterillustrating a downmodulation in SAPSII-low group only. (E) A cluster illustrating an upmodulation in SAPSII-lowgroup only.
Cazalis et al. Intensive Care Medicine Experimental 2014, 2:20 Page 12 of 17http://www.icm-experimental.com/content/2/1/20
only at the level and the duration of the genomic response between the two severity
groups.
These 142 genes were hierarchically arranged into 14 clusters (Additional file 6:
Figure S2 and Figure 6). Those 14 clusters followed four distinct patterns of expressions
illustrated by the 4 clusters displayed in Figure 6 B,C,D,E.
For example, clusters 1 to 6 (Figure 6B) consisted in a panel of genes whose expressions
were less decreased and recovered rapidly to normal value during the 48 h in SAPSII-low
group but were decreased in SAPSII-high group with a delayed recovery. The genes
following this trend of expression were related to leukocytes activation and immune
response (BCL11B, BTN3A1, BTN3A2, BTN3A3, CX3CR1, DDX58, F2RL1, HLA-DQA1,
HLA-DQB1, HLA-DPB1, IGHM, IGKC, IL7R, IRF1, LCK, LTB, LY75, MME, MMP12,
PDE4B, PECAM1, PI3, PRKCH, PSMB9, RASGRP1, RORA, SFN, STAT1, and ZFP36L2)
and mostly linked to cell death (APOL6, AQP3, BCL11B, CAMK1D, CX3CR1, DDX58,
F2RL1, FGL2, GIMAP4, GZMA, IGHM, IGKC, IL32, IL7R, IRF1, ITGA4, LCK, LEF1,
LTB, MME, MX1, PARP14, PDE4B, PECAM1, PI3, POLB, PRKCH, PTGER4, RASGRP1,
SEMA4D, SGK1, STAT1, TAP2, XAF1, and ZFP36L2).
Cazalis et al. Intensive Care Medicine Experimental 2014, 2:20 Page 13 of 17http://www.icm-experimental.com/content/2/1/20
Clusters 13 and 14 (Figure 6C) illustrated genes with a small increase in gene expression
and a rapid recovery in SAPSII-low group of patients and a high increase over time in
SAPSII-high patients. Among these, we observed genes related to infection and cell viabil-
ity (ALOX12, ANKRD9, CA2, LCN2, MS4A4A, OLFM4, PF4, PPBP, RETN, and TCN1).
The last two patterns of expressions are illustrated by clusters 7 to 11 and 12
(Figure 6D,E). In contrast, to the previous patterns (clusters 1 to 6 and 13 and 14),
they showed an earlier and more pronounced response (over- and under-expressed)
in the SAPSII-low group. Genes found in these clusters were mostly implicated in
bacterial or viral infections (AGTRAP, CARD16, CASP1, CD274, CD46, CFD, CLEC2B,
DDX60L, HSP90AB1, MAN1A1, PKN2, and SLPI) and cell death or viability (AGTRAP,
BAG1, CASP1, CD274, CD46, CFD, HSP90AB1, HSPB1, LRRK2, PKN2, RBM3, SLAMF7,
SLC6A8, SLPI, and SNCA).
DiscussionTo our knowledge, this is the first study describing the very early genomic response to
septic shock. This study provides an important overview of the genome-wide expression
patterns of blood leukocytes over three time points (within 30 min after diagnosis and 24
and 48 h afterwards). Septic shock generates a massive genomic modulation with more
than 71% of the host transcriptome altered during the first 48 h after shock. This
phenomenon is a very aggressive process as it occurs rapidly and is already present at the
very early stage of the syndrome with more than 60% of the modification already in place
(Figure 1). As described in trauma patients [14], septic shock appears to produce a global
reprogramming of the leukocyte transcriptome affecting multiple cellular and molecular
functions and pathways. However, the magnitude of the transcriptome modifications
seemed to be earlier, faster, and bigger in septic shock, as regards of the extent and
rapidity by which the deregulation occurred. Indeed, more than 71% of the genomic
modifications occurred during the first 48 h, whereas most of the alterations described by
Xiao et al. in trauma patients were observed over the first 28 days.
Most of the altered molecular functions were associated to cellular rearrangement
(morphology, function, maintenance, and development), therefore suggesting metabolic
adaptations (Table 2). Indeed, several studies have shown that metabolic modifications
occur during severe injuries and could lead to a metabolic hibernation. This phenomenon
plays a role in protecting cells from death leading to multiple organ failures [24,25] and
immune-inflammation control [26].
The decrease of leukocyte pathways and functions (Figures 2B and 5A) suggests an
anergy of those cells. As an example, SAMSN1, whose expression increased the most
(Figure 3B), has been defined as an inhibitor of B cell spreading [27]. Inversely, CD247,
whose expression decreased the most, is the CD3ζ-chain, considered as the rate-limiting
factor of TCR/CD3 complex formation [28]. This was consistent with the decreased
expression of CD3 on circulating lymphocytes observed in septic shock patients [29].
Inversely, the function ‘phagocytosis of cells’ was predicted to be activated during the
kinetic. These results could be related to efferocytosis of dying/dead cells triggered by
anti-inflammatory signals in a process of resolving inflammation [30].
Taken together, the patterns of gene expression highlighted that the mechanisms of
immune activation and repression are obviously concomitant at the very early phase of

Cazalis et al. Intensive Care Medicine Experimental 2014, 2:20 Page 14 of 17http://www.icm-experimental.com/content/2/1/20
septic shock (Figure 3 and Additional file 6: Figure S2), probably before obvious clinical
signs. We cannot exclude that earlier modification in gene expression might also have
occurred before patients fulfilled the diagnostic criteria of septic shock. Here, we
described only the modulation that were observed during the first 48 h after beginning
vasopressor therapy. This is in accordance with numerous clinical observations made
in the literature showing altered leukocyte functions after septic shock [4,31-33]. This
also agrees with previously published data regarding transcription profiles in human
sepsis [34] and in trauma patients [14].
Of utmost importance, the early regulation mechanisms observed suggests that the time
window to improve the outcome of patient with appropriate therapeutic begins very early
after the onset of shock. This observation has been also suggested recently [35].
Interestingly, when comparing genomic responses of the two severity groups, we
observed that the overall changes (direction of the responses) in gene expression at H0
between these groups were very similar. Importantly, the difference between the two
severity groups was particularly noticeable in the degree and the duration of the altered
acute inflammatory response.
Most of the activated functions in both groups were related to cell death and apoptosis.
However, they were predicted to be activated and trending toward a decrease during the
kinetic in SAPSII-low group, whereas these were predicted to be inhibited in SAPSII-high
group. These modifications could be related to T cells undergoing apoptosis, therefore
limiting self-harmful effects for the host [36]. This observation emphasized that an appro-
priate response very early in the process might limit or avoid exacerbated inflammation
that would lead to increase severity. Inhibited cytotoxicity of cells and ‘viability’ functions,
observed in SAPSII-high patient group, again suggests that the SAPSII-low patient group
may have developed a better response (or an appropriate response regulation) and a
rapid trend toward recovery, while the SAPSII-high group of patients showed a delayed
response and an impaired immune dysfunction.
Four distinct patterns associated with the two groups of severity were observed. The
two first patterns indicated that SAPSII-low group seemed to have smaller and shorter
deregulation of their genomic response as compared with the more severe patients. For
example, in clusters 13 and 14 (Figure 6C), OLFM4 (negative regulator of bacterial
killing) and RETN and MS4A4A (related to PPARγ that overexpression has been
linked to poor outcome [37]) had increased expressions and no return to baseline in
SAPSII-high group. This suggested that the bacterial clearance and cell viability were
more jeopardized in this group.
Once again, these first two patterns indicated that SAPSII-low group seemed to have
smaller and shorter deregulation of their genomic response as compared with the more
severe patients.
In contrast, the two last patterns showed an earlier and more pronounced response
in the SAPSII-low group. These results suggest that those genes may play a role in the
very early negative feedback mechanisms that limit the process of inflammation during
septic shock. Thus, the SAPSII-low group may exhibit a better and rapidly appropriate
regulation of the immune and inflammatory response leading to a subsequent better
outcome. This agrees with the observation that the number of significant upregulated
genes is lower in the SAPSII-high group and increases during the kinetic while decreasing
in the SAPSII-low group (Figure 4C).

Cazalis et al. Intensive Care Medicine Experimental 2014, 2:20 Page 15 of 17http://www.icm-experimental.com/content/2/1/20
These results of the utmost importance may suggest that regulatory mechanisms
leading to recovery may take place very early after septic shock and thus that the time
window to improve the outcome of patients with appropriate therapeutics may begin
very early after the onset of shock. Indeed, beyond the fact that differences between the
two severity groups were particularly noticeable in the degree and the duration of the
altered acute inflammatory response, we observed that the more severe patients did not
exhibit the strongest modulation for every process changed (e.g., cell death at H0) in
part suggesting that an early and appropriate regulation may be the key for a suitable
response. Thus, genes involved in these regulatory processes might be of major interest
in additional studies.
There are some limitations of our study. First, our healthy volunteers’ cohort was not
age/sex matched with patients (5 men and 20 women in healthy volunteers group). In
our opinion, this is not a major issue as important results were mostly obtained from
comparison between patients regarding kinetics approach. Second, as the SAPSII-high
group tends to be older, the delayed and impaired immune response might have been
related to age rather than severity. An additional analysis using ANOVA indicated that
the modulation of gene expression was not related to age of patients (data not shown).
Third, a reduced number of patients was enrolled and despite a high level of severity
(median SAPSII = 45; median SOFA = 10), a low mortality rate was observed. We were
therefore not able to study gene expression according to prognosis. Fourth, gene
expression analyses were performed in whole blood samples that do not reveal the
entire genomic dysfunctions leading to organ failure. Nevertheless, this compartment
could indirectly reflect the damages observed in organs and is more easily accessible. In
addition, there was a trend toward a lower number of polymorphonuclear cells in high
SAPSII patients, but this was not statistically significant. Moreover, we did not found
any difference between SAPSII-low and SAPSII-high groups regarding the lymphocyte
counts. The differences observed and functions highlighted in our study are unlikely
to be due to the differences in cell subpopulations between these groups. Lastly, no
functional testing was done to validate that SAPSII-low group has a better integrity of
their immune system or a better and earlier recovery. However, the results observed
were coherent with findings already published in the literature. Although further
studies will be needed to study deeper the mechanisms of systemic inflammatory
response regulation (especially the link between genomic disturbances and immune
functional testing), this study provides a first overview of the mechanisms involved at
the earliest time and at the transcriptomic level after septic shock and may contribute
to orientate the next investigations.
ConclusionsPan-genomic approaches, allowing global investigation, should provide crucial keys to
understand the much focused orientation of the immune response induced by stress
events.
These results could contribute to improved management of patients. Indeed, genes
implicated very early in the regulatory mechanisms of the response to septic shock
could become high medical value biomarkers allowing individualized treatments aimed
at restricting the dysfunctions induced by exacerbated or uncontrolled inflammation.

Cazalis et al. Intensive Care Medicine Experimental 2014, 2:20 Page 16 of 17http://www.icm-experimental.com/content/2/1/20
Additional files
Additional file 1: Table S1. Modulation over the first 48 h of septic shock for selected genes highlighted by thefunctional analysis.
Additional file 2: Table S2. Significant category in septic shock patients over time compared to healthyvolunteers. The table shows the predicted activation or inhibition status of the enriched functions.
Additional file 3: Figure S1. qRT-PCR correlation with Affymetrix data.
Additional file 4: Table S3. Significant ‘cell death’ functions in septic shock patients over time compared tohealthy volunteers.
Additional file 5: Table S4. Significant categories enriched by the 142 probe sets differentially expressed between.
Additional file 6: Figure S2. Comparison of gene expression patterns of the 142 probe sets differentiallyexpressed (FDR <0.05) between both groups of septic shock patients. Expressions at 0, 24, and 48 h after septicshock of genes in each of the 14 clusters from hierarchical clustering in Figure 6.
Competing interestsThe authors declare that they have no competing interests.
Authors’ contributionsAL, BM, AP, and GM conceived the study. MAC performed the experiments. MAC, FV, FF, and MP performed thestatistical analyses and biological interpretations. All contributed to drafting and critical revision of the manuscript.All authors read and approved the final manuscript.
AcknowledgementsThis project is part of Advanced Diagnostics for New Therapeutic Approaches coordinated by Merieux Alliance andsupported by the French public agency OSEO. GM, FV, and AL are supported by funds from the Hospices Civils de Lyon.
Author details1Joint Unit “Sepsis” Hospices Civils de Lyon - bioMérieux, Hôpital Edouard Herriot - Hospices Civils de Lyon, Pavillon P -5 place d’Arsonval, 69437 Lyon Cedex 03, France. 2Immunology Laboratory, Hôpital Edouard Herriot, 69437 Lyon,France. 3Intensive Care Units, Centre Hospitalier Lyon-Sud, 69310 Pierre Bénite, France. 4bioMérieux, Chemin de l’Orme,69280 Marcy l’Etoile, France. 5EAM 4174, Université Lyon 1/Hospices Civils de Lyon, 69437 Lyon, France.
Received: 19 December 2013 Accepted: 28 May 2014
References
1. Annane D, Bellissant E, Cavaillon JM (2005) Septic shock. Lancet 365(9453):63–782. (2012) Focus issue. Nat Med 18(7):3. Cohen J, Opal S, Calandra T (2012) Sepsis studies need new direction. Lancet Infect Dis 12(7):503–54. Monneret G, Venet F, Pachot A, Lepape A (2008) Monitoring immune dysfunctions in the septic patient: a newskin for the old ceremony. Mol Med 14:64–785. Russell JA (2011) Gene expression in human sepsis: what have we learned? Crit Care 15:1216. Oberholzer A, Oberholzer C, Moldawer LL (2001) Sepsis syndromes: understanding the role of innate and acquired
immunity. Shock Aug 16(2):83–967. Adib-Conquy M, Cavaillon JM (2009) Compensatory anti-inflammatory response syndrome. Thromb Haemost
101(1):36–47, Review8. Hotchkiss RS, Coopersmith CM, McDunn JE, Ferguson TA (2009) The sepsis seesaw: tilting toward
immunosuppression. Nat Med 15:496–4979. Boomer JS, To K, Chang KC, Takasu O, Osborne DF, Walton AH, Bricker TL, Jarman SD II, Kreisel D, Krupnick AS,
Srivastava A, Swanson PE, Green JM, Hotchkiss RS (2011) Immunosuppression in patients who die of sepsis andmultiple organ failure. JAMA 306(23):2594–605
10. Rivers E, Nguyen B, Havstad S, Ressler J, Muzzin A, Knoblich B, Peterson E, Tomlanovich M, Early Goal-DirectedTherapy Collaborative Group (2001) Early goal-directed therapy in the treatment of severe sepsis and septic shock.N Engl J Med 345(19):1368–77
11. Levy MM, Macias WL, Vincent JL, Russell JA, Silva E, Trzaskoma B, Williams MD (2005) Early changes in organsfunction predict eventual survival in severe sepsis. Crit Care Med 33:2194–2201
12. Calvano SE, Xiao W, Richards DR, Felciano RM, Baker HV, Cho RJ, Chen RO, Brownstein BH, Cobb JP, Tschoeke SK,Miller-Graziano C, Moldawer LL, Mindrinos MN, Davis RW, Tompkins RG, Lowry SF, Inflamm and Host Response toInjury Large Scale Collab. Res. Program (2005) A network-based analysis of systemic inflammation in humans.Nature 437(7061):1032–7
13. Wong HR (2012) Clinical review: sepsis and septic shock–the potential of gene arrays. Crit Care 16(1):204, Review14. Xiao W, Mindrinos MN, Seok J, Cuschieri J, Cuenca AG, Gao H, Hayden DL, Hennessy L, Moore EE, Minei JP, Bankey
PE, Johnson JL, Sperry J, Nathens AB, Billiar TR, West MA, Brownstein BH, Mason PH, Baker HV, Finnerty CC,Jeschke MG, López MC, Klein MB, Gamelli RL, Gibran NS, Arnoldo B, Xu W, Zhang Y, Calvano SE, McDonald-SmithGP et al (2011) A genomic storm in critically injured humans. J Exp Med 208(13):2581–90
15. Bone RC, Balk RA, Cerra FB, Dellinger RP, Fein AM, Knaus WA, Schein RM, Sibbald WJ (1992) Definitions forsepsis and organ failure and guidelines for the use of innovative therapies in sepsis: the ACCP/SCCMConsensus Conference Committee: American College of Chest Physicians/Society of Critical Care Medicine.Chest 101:1644–1655
Cazalis et al. Intensive Care Medicine Experimental 2014, 2:20 Page 17 of 17http://www.icm-experimental.com/content/2/1/20
16. Le Gall JR, Lemeshow S, Saulnier F (1993) A new simplified acute physiology score (SAPS II) based on a European/North American multicenter study. J Am Med Assoc 270:2957–2963
17. Rainen L, Oelmueller U, Jurgensen S, Wyrich R, Ballas C, Schram J, Herdman C, Bankaitis-Davis D, Nicholls N, TrollingerD, Tryon V (2002) Stabilization of mRNA expression in whole blood samples. Clin Chem 48:1883–1890
18. Venet F, Pachot A, Debard AL, Bohe J, Bienvenu J, Lepape A, Powell WS, Monneret G (2006) Human CD4+CD25+regulatory T lymphocytes inhibit lipopolysaccharide-induced monocyte survival through a Fas/Fas ligand-dependent mechanism. J Immunol 177(9):6540–7
19. Irizarry RA, Hobbs B, Collin F, Beazer-Barclay YD, Antonellis KJ, Scherf U, Speed TP (2003) Exploration, normalization,and summaries of high density oligonucleotide array probe level data. Biostatistics 4:249–264
20. Bolstad BM, Irizarry RA, Astrand M, Speed TP (2003) A comparison of normalization methods for high densityoligonucleotide array data based on variance and bias. Bioinformatics 19:185–193
21. Laudanski K, Miller-Graziano C, Xiao W, Mindrinos MN, Richards DR, De A, Moldawer LL, Maier RV, Bankey P, BakerHV, Brownstein BH, Cobb JP, Calvano SE, Davis RW, Tompkins RG (2006) Cell-specific expression and pathwayanalyses reveal alterations in trauma-related human T cell and monocyte pathways. Proc Natl Acad Sci U S A103(42):15564–9
22. Angus DC, Linde-Zwirble WT, Lidicker J, Clermont G, Carcillo J, Pinsky MR (2001) Epidemiology of severesepsis in the United States: analysis of incidence, outcome, and associated costs of care. Crit Care Med 29(7):1303–10
23. Tseng CC, Liu SF, Wang CC, Tu ML, Chung YH, Lin MC, Fang WF (2012) Impact of clinical severity index, infectivepathogens, and initial empiric antibiotic use on hospital mortality in patients with ventilator-associated pneumonia.Am J Infect Control 40(7):648–52
24. Mongardon N, Dyson A, Singer M (2009) Is MOF an outcome parameter or a transient, adaptive state in criticalillness? Curr Opin Crit Care 15(5):431–6
25. Mongardon N, Singer M (2010) The evolutionary role of nutrition and metabolic support in critical illness.Crit Care Clin 26(3):443–50, vii-viii. Review
26. Kominsky DJ, Campbell EL, Colgan SP (2010) Metabolic shifts in immunity and inflammation. J Immunol 184(8):4062–8, Review
27. von Holleben M, Gohla A, Janssen KP, Iritani BM, Beer-Hammer S (2011) Immunoinhibitory adapter protein Srchomology domain 3 lymphocyte protein 2 (SLy2) regulates actin dynamics and B cell spreading. J Biol Chem286(15):13489–501
28. Molnár V, Balogh A, Matkó J, Cope AP, Buzás EI, Falus A, Nagy G (2012) CD3ζ-chain expression of human Tlymphocytes is regulated by TNF via Src-like adaptor protein-dependent proteasomal degradation. J Immunol189(4):1602–10
29. Venet F, Bohé J, Debard AL, Bienvenu J, Lepape A, Monneret G (2005) Both percentage of gammadelta Tlymphocytes and CD3 expression are reduced during septic shock. Crit Care Med 33(12):2836–40
30. Michlewska S, Dransfield I, Megson IL, Rossi AG (2009) Macrophage phagocytosis of apoptotic neutrophils iscritically regulated by the opposing actions of pro-inflammatory and anti-inflammatory agents: key role for TNF-α.FASEB J 23(3):844–54
31. André MC, Gille C, Glemser P, Woiterski J, Hsu HY, Spring B, Keppeler H, Kramer BW, Handgretinger R, Poets CF,Lauber K, Orlikowsky TW (2012) Bacterial reprogramming of PBMCs impairs monocyte phagocytosis andmodulates adaptive T cell responses. J Leukoc Biol 91(6):977–89
32. Faivre V, Lukaszewicz AC, Alves A, Charron D, Payen D, Haziot A (2012) Human monocytes differentiate intodendritic cells subsets that induce anergic and regulatory T cells in sepsis. PLoS One 7(10):e47209
33. Hotchkiss RS, Monneret G, Payen D (2013) Immunosuppression in sepsis: a novel understanding of the disorderand a new therapeutic approach. Lancet Infect Dis 13(3):260–8, Review
34. Tang BM, Huang SJ, McLean AS (2010) Genome-wide transcription profiling of human sepsis: a systematic review.Crit Care 14:R237
35. Reinhart K, Bauer M, Riedemann NC, Hartoga CS (2012) New approaches to Sepsis: molecular diagnostics andbiomarkers. Clin Microbiol Rev 25(4):609–34
36. Schmidt MV, Paulus P, Kuhn AM, Weigert A, Morbitzer V, Zacharowski K, Kempf VA, Brüne B, von Knethen A (2011)Peroxisome proliferator-activated receptor γ-induced T cell apoptosis reduces survival during polymicrobial sepsis.Am J Respir Crit Care Med 184(1):64–74
37. Kaplan JM, Denenberg A, Monaco M, Nowell M, Wong H, Zingarelli B (2009) Changes in peroxisome proliferator-activated receptor-gamma activity in children with septic shock. Intensive Care Med 36(1):123–30
doi:10.1186/s40635-014-0020-3Cite this article as: Cazalis et al.: Early and dynamic changes in gene expression in septic shock patients: agenome-wide approach. Intensive Care Medicine Experimental 2014 2:20.


![[HMG] 04 - Gene Evolution · Genome EvolutionGenome Evolution [Gene Evolution] Genome changes • Mutation • Recombination • Transposition • Gene transfer (e.g., between organelles](https://img.dokumen.tips/doc/110x75/5f1a27241c38cf435819dbb5/hmg-04-gene-evolution-genome-evolutiongenome-evolution-gene-evolution-genome.jpg)


