Embed Size (px)
Citation preview

13WELL DRILING
ELMİ ƏSƏRLƏR w PROCEEDINGS w НАУЧНЫЕ ТРУДЫ 2012 №32012 №3
In order to improve the calculation precision of foam underbalanced drilling theory model, based on an investigation of fluid flow during a foam underbalanced drilling field application and using modern computational fluid dynamics (CFD), numerical simulation research on the flow lows of gas-liquid two phase annulus flow in foam drilling process is conducted. A flow field model for the 8 Ѕ " PDC bit at third open process in foam underbalanced drilling is established. Annulus pressure and gas-liquid flow laws of drilling fluid near the bit at different depth are analyzed in depth with field condition drilling parameters. The results of our simulation model and those of the field model are compared, the comparison reveals that the difference is less than 5.7%, which justifies the feasibility of our simulation model. The bottom hole pressure of different well sections is predicted and the results show that annulus flow rate decreases with increasing depth of the well section. For different gas injection rates and liquid-based foam injection rates, the bottom hole pressure of 8 Ѕ " PDC bit will increase if the liquid injection rate is increased or the gas injection rate is decreased. When the liquid injection rate is 250L/min, the gas injection rate should be greater than 40000L/min, or the drilling efficiency will be impacted and, in the worse case, sticking accidents may happen.Keywords: foam drilling, numerical simulation; power law, gas-liquid two phase flow, pressure prediction.E-mail: [email protected]: 10.5510/OGP20120300117
УДК 622.276.5:550.064.45
RESEARCH ON THE FLOW LAWS OF BOTTOM-HOLE FLOWING OF FOAM UNDERBALANCED DRILLING
D.Fucheng1,2, Z.Xiaohua2, D.Jingen1, H.Lianbo1
(1 China University of Petroleum, 2 Southwest Petroleum University)
IntroductionIn recent years, domestic and foreign scholars have
conducted a lot of research on the flow lows of annulus multi phase flow in foam drilling process, but most of them are based on the foam rheological experiment and the empiric formulas are mostly used during the analyses. Researchers of Daqing oilfield and China university of geosciences such as WangHongJun [1, 2] analyzed the rheology of foam drilling fluid with experimental approach. They discovered than the power law with yield value model or Hector-and rheological model can describe the rheological characteristics of foam. Researchers of China university of petroleum (East China) such as Zhangrui [3] tested the sheer stress of three kinds of foam drilling fluid, and concluded that the Bingham mode is more suitable for these three kinds of drilling fluid. Other researchers of China University of petroleum (East China) such as Gui Liping [4]applied researched the rheology, density change and flow resistance of foam drilling flow under high temperature and high pressure with experiment result. They found that the fluid reveals the flow characteristics of power-low fluid and that its density increases with the increasing of pressure. Researchers of China University of Petroleum (East China) such as Di Hongzhang etc [5-9] tested the influence of particle deposition on the density of foam drilling fluid and measured the fluid density change caused by the particle deposition. They concluded that the curve model determined by Boltzman formula is suitable
to describe the relationship of the change of drilling fluid density and time.
For the study of multiphase flow of foam underbalanced drilling, experimental research [10 to 11] on the rheological properties of liquid foam is in the majority and it has been widely recognized that power law model is most suitable model for the rheology describe of foam drilling fluid. The key point of foam underbalanced drilling process is the calculation and control of wellbore pressure, because during the drilling process high volume gas and liquid-based foam will be injected into the wellbore and the flow of foam drilling fluid is extremely complex. In this paper, simulation analyses are conducted for the multi flow of foam drilling fluid with power-low characteristics. The relationship of bottom hole pressure and the depth of the hole is studied and the influence of liquid injection and gas injection on bottom hole pressure is also researched, which can provide a guide for the design and control of the bottom hole pressure and a theory support for the determination of ground gas injection.
1. Calculation model1.1. The establishment of the modelThe tong-nan-ba structure belt of the south is
terrestrial strata, and the sand strata and mudstone strata are interlaced. Moreover, the feature of the strata are easy to hydrate and thus sloughing and collapsing. Based on these features, during the drilling process,

2012 №3 ELMİ ƏSƏRLƏR w PROCEEDINGS w НАУЧНЫЕ ТРУДЫ
14 WELL DRILING
2012 №3
Optimal and Fast Drilling Program should be applied to improve the drilling speed, to shorten the soak time of the strata, thus to ensure the stability of the wellbore. According to the well design, the second open well section of 151~1502 m will be drilled with air drilling fluid. The well section that below the beginning of the third open, which is 1502 m, will be drilled with foam drilling fluid. The downhole assembly will be used in the drilling process is :Φ 216 mm bit + float valve + shock absorber + non magnetic collar × 1+ drill collars × 2 root + bypass valve + drill collars × 9 + jar +drill pipe + backpressure valve + Kelly cock. The bits figures are shown in figure 1 and 2.
The most important drilling parameters design in the process of foam drilling includes: the design of drilling fluid equivalent density (or the design of bottom hole pressure), gas and liquid fluid injection design and the hydraulic parameters profile design of drilling fluid. In the drilling process, the purpose of the design of bottom hole pressure is to control the bottom negative pressure within a proper range. In order to provide a guide for foam drilling, this paper research the bottom hole pressure by using numerical simulation approach with the drilling tool and drilling parameters information.
A three-dimensional geometry model of Φ216 mm PDC is established using 3D software. The 3D drawing of the bit is showed in figure 3. The computation model of the flow field of the area near the bit in foam drilling is given by boolean operation, based on the finite element analysis software analyses of bit and drill pipe model.
Fig.1. The tricone bit and PDC bit used in the drilling process
Fig.2 8½″PDC bit used in the third open drilling process
Fig.3. The 3D drawing of 8½″PDCbit and its computation model

15WELL DRILING
ELMİ ƏSƏRLƏR w PROCEEDINGS w НАУЧНЫЕ ТРУДЫ 2012 №32012 №3
1.2. The computation of boundary condition inlet boundary conditionThe flow rate computation formula at different well
depth is showed in formula (1), with which we can get the inlet flow rate at different depth.
(1)
Where, QR is the volume flow rate of cuttings. QL , QG stand for liquid flow rate and gas flow rate
respectively m3/s;Ap is the area of flowing section, m2.According to the ideal gas status equation, the flow
rate of gas in the foam is as follows:
(2)
TSC, T stand for ground temperature and well bole temperature respectively, K;
PSC, P represent the ground pressure and well bole pressure respectively, Pa;
QSC is the ground gas flow rate m3/s.(2) The determination of parameter K and n of power
law fluid The main part of drilling fluid used for foam drilling
includes injected gas and foam-based drilling fluid, the rest is cutting and formation fluid (natural gas, crude oil and ground water). In this paper, the interaction of cuttings and formation fluid is not considered. It is assumed that the annulus flow is gas-liquid two phase flow and that the density of gas is the mixed density of its components. What’s more, the foam-based drilling fluid is considered as power law fluid and the injected gas is regarded as ideal gas.
In the past 30 years, many scholars have done a lot of research on the rheological model of foam drilling fluid, and applied it to the computation of foam hydraulic calculation. These scholars include Beyer, Blauer, Sanghani, Reidenbach, Valko—Economides, Gardiner, etc.[12-13]
Mitchell thinks that according to the different of foam quality, the drilling fluid can be divided into four categories: fluid with foam quality G of 0~52% belongs to the first section, called foam dispersing section. In this section, the drilling fluid is Newton fluid and the bubbles are separate when flowing. Fluid with foam quality G of 52~74% is in the second section, called foam interfering section. The bubbles of the fluid within this section experience interfering and begin to conflict, the bubbles will gather and thus the viscosity and dynamic shear force will increase. Fluid with foam quality G of 74~96% is belongs to the third section, called foam stable section. In this section, the spherical bubbles are force into parallelepiped ones and the fluid features Bingham fluid or pseudoplastic fluid with yield value. And the last one is fog section. Sanghani and Ikoku [14-16] gained the relationship of consistency coefficient K and rheological behavior index n with foam quality G, which is showed as the following formulas.
K = -0.15629+56.147G-312.77G2+576.56G3+63.96G4 - - 960.46G5 - 154.68G6 + 1670.2G7 - 937.88G8 (3)
n = 0.095932+2.3654G-10.467G2+12.955G3++14.467G4 - 39.673G5 + 20.652G6 (4)
Where G stands for the foam quality, dimensionless: (5)
(Obviously, in the process of foam drilling, because of the difference of foam gas and chemical treatment agent, the type of foam also different and thus the mathematical relationship of K-G and n-G, which is not taken into consideration in this paper.)
In the process of the simulation of foam drilling, the liquid-gas two phase flow laws at the bit of vertical well section at different depth is simulated with the consideration of the difference of well section temperature (the temperature of well section can be gained with the geothermal gradients 2o/100 m) and pressure. In this process the influence of temperature change on the foam quality and rheological behavior of drilling liquid also are taken into consideration. The relationship of consistency coefficient K and rheological behavior index n with the well depth is showed in figure 4, 5.
Fig.4. The relationship of consistency coefficient K and rheological behavior index n with the well depth
Fig.5. The relationship of foam quality G with the well depth
G L RF
p
Q Q QV
A+ +
=
SCG SC
SC
p TQ Q
pT=
/11
1
SC SC
SC SCL R
SC SC SC
QG pG
G QGp Q Q
p G p
= =−
+ + +
2.9
3.0
3.1
3.2
3.3
3.4
3.5
3.6
3.7
3.8
3.9
1500
2000
2500
3000
3500
4000
4500
5000
5500
6000
Well depth, m
The
cons
iste
ncy
coef
ficie
nt, K
0.25
0.26
0.26
0.27
0.27
0.28
0.28
0.29
0.29
0.30
0.30
n
K
Rhe
olog
ical
beh
avio
r ind
ex n
0.71
0.73
0.75
0.77
0.79
0.81
0.83
1500
2000
2500
3000
3500
4000
4500
5000
5500
6000
Well depth, m
Foam
qua
lity,
G
2012 №3 ELMİ ƏSƏRLƏR w PROCEEDINGS w НАУЧНЫЕ ТРУДЫ
16 WELL DRILING
2012 №3
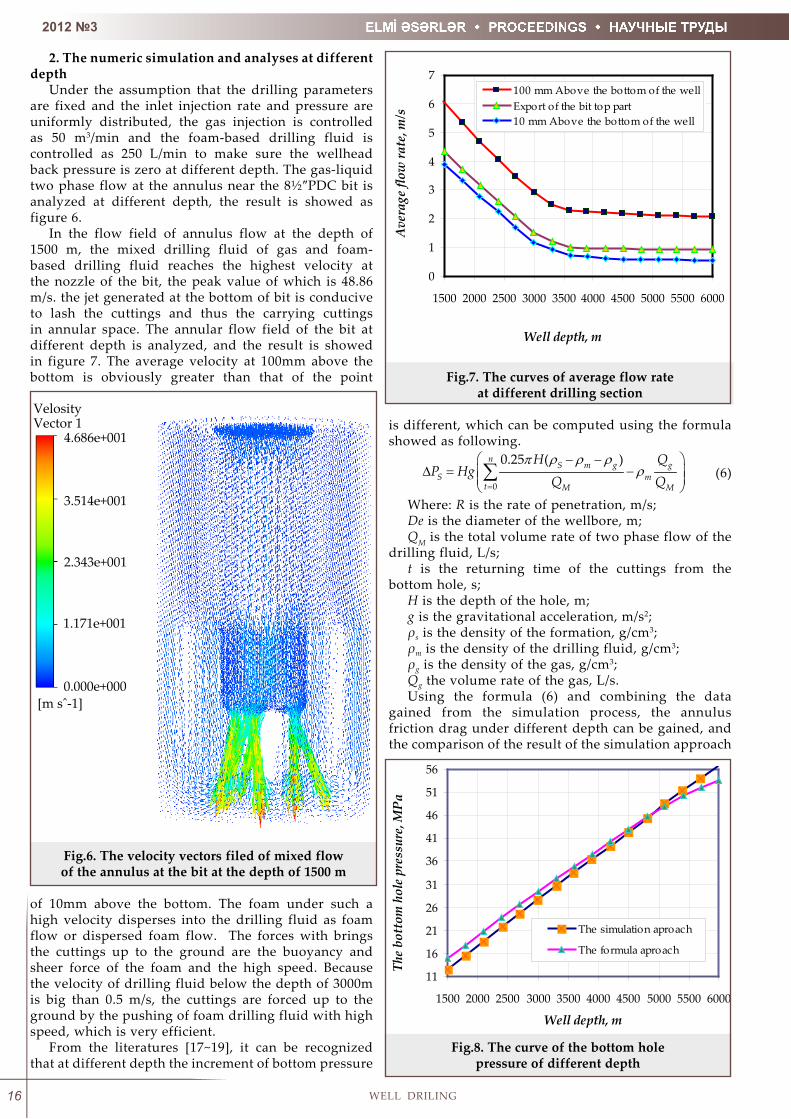
2. The numeric simulation and analyses at different depth
Under the assumption that the drilling parameters are fixed and the inlet injection rate and pressure are uniformly distributed, the gas injection is controlled as 50 m3/min and the foam-based drilling fluid is controlled as 250 L/min to make sure the wellhead back pressure is zero at different depth. The gas-liquid two phase flow at the annulus near the 8½″PDC bit is analyzed at different depth, the result is showed as figure 6.
In the flow field of annulus flow at the depth of 1500 m, the mixed drilling fluid of gas and foam-based drilling fluid reaches the highest velocity at the nozzle of the bit, the peak value of which is 48.86 m/s. the jet generated at the bottom of bit is conducive to lash the cuttings and thus the carrying cuttings in annular space. The annular flow field of the bit at different depth is analyzed, and the result is showed in figure 7. The average velocity at 100mm above the bottom is obviously greater than that of the point
of 10mm above the bottom. The foam under such a high velocity disperses into the drilling fluid as foam flow or dispersed foam flow. The forces with brings the cuttings up to the ground are the buoyancy and sheer force of the foam and the high speed. Because the velocity of drilling fluid below the depth of 3000m is big than 0.5 m/s, the cuttings are forced up to the ground by the pushing of foam drilling fluid with high speed, which is very efficient.
From the literatures [17~19], it can be recognized that at different depth the increment of bottom pressure
is different, which can be computed using the formula showed as following.
(6)
Where: R is the rate of penetration, m/s;De is the diameter of the wellbore, m;QM is the total volume rate of two phase flow of the
drilling fluid, L/s; t is the returning time of the cuttings from the
bottom hole, s;H is the depth of the hole, m;g is the gravitational acceleration, m/s2;ρs is the density of the formation, g/cm3;ρm is the density of the drilling fluid, g/cm3;ρg is the density of the gas, g/cm3;Qg the volume rate of the gas, L/s.Using the formula (6) and combining the data
gained from the simulation process, the annulus friction drag under different depth can be gained, and the comparison of the result of the simulation approach
Fig.6. The velocity vectors filed of mixed flow of the annulus at the bit at the depth of 1500 m
Fig.7. The curves of average flow rate at different drilling section
0
0.25 ( )nS m g g
S mt M M
H QP Hg
Q Qπ ρ ρ ρ
ρ=
− − ∆ = −
∑
Fig.8. The curve of the bottom hole pressure of different depth
0
1
2
3
4
5
6
7
1500 2000 2500 3000 3500 4000 4500 5000 5500 6000
Well depth, m
Ave
rage
flow
rate
, m/s
100 mm Above the bottom of the wellExport of the bit top part10 mm Above the bottom of the well
11
16
21
26
31
36
41
46
51
56
1500 2000 2500 3000 3500 4000 4500 5000 5500 6000
Well depth, m
The
bott
om h
ole
pres
sure
, MP
a
The simulation aproach
The formula aproach

17WELL DRILING
ELMİ ƏSƏRLƏR w PROCEEDINGS w НАУЧНЫЕ ТРУДЫ 2012 №32012 №3
and the formula approach, which is showed in figure 8.With the comparison of the results of the
simulation approach and the formula approach, it can be concluded that the difference is with 4.8%. Thus, we can determine the bottom hole negative pressure and the drilling fluid windows with the guide of the result of simulation.
3. The analyses of the relationship of the bottom hole pressure and the gas injection
In this section, the consistency coefficient K and rheological behavior index n of the drilling fluid are analyzed when the depth of the hole is 5000 m, the injection rate of the foam-based drilling fluid is 250 L/min, and the simulation gas injection rate ranges from 103 L/min to 104 L/min. After the data analyses and computation, the consistency coefficient K and rheological behavior
index n of different depth is showed in figure 9. Meantime, the foam quality G changes with different
gas injection rate, which is showed in figure 10.For a particular depth of the hole and different gas
injection rate, the gas –liquid two phase flow of the annulus near the 8½″PDC bit is studied, the result of which is showed in figure 11,
Form the figure 11, it can be gained that if the gas
injection rate is 6×10³ L/min, the peak of the velocity occurs at the nozzle, which is 55.47 m/s. The annular flow field near the bit is studied with different gas injection rate. The result is showed in figure 12.
From figure 12, we can conclude that when the gas injection rate is less than 4×10³ L/min, the annular velocity of the point 10mm above the bottom hole will below 0.5 m/s, which is less than the least threshold of
Fig.9. The change of the consistency coefficient K and rheological behavior
index n with different gas injection rate
Fig.10. The change of the foam quality G with different gas injection rate
Fig.11. The velocity vector of annulus bit the bit with gas injection rate of 6×10³ L/min
Fig.12. The curve of average velocity with different gas injection rate
0.30.40.50.60.70.80.9
1 2 3 4 5 6 7 8 9 10
Gaz injection rate, *10 4 L/min
The
foam
qua
lity,
G
2.0
2.5
3.0
3.5
4.0
4.5
5.0
1 2 3 4 5 6 7 8 9 10
Gaz injection rate, *10 4 L/min
The
cons
iste
ncy
coef
ficie
nt, K
0.20
0.22
0.24
0.26
0.28
0.30
0.32
0.34K
nR
heol
ogic
al
0.2
0.7
1.2
1.7
2.2
2.7
3.2
3.7
1 2 3 4 5 6 7 8 9 10
Gaz injection rate, *10 4 L/min
Ave
rage
flow
rate
, m/s
10 mm above the bottom of the well100 mm above the bottom of the wellExport of the bit top part
2012 №3 ELMİ ƏSƏRLƏR w PROCEEDINGS w НАУЧНЫЕ ТРУДЫ
18 WELL DRILING
2012 №3
carrying cuttings. Thus, at this depth of bottom hole, if the gas injection less than 4×10³ L/min, the carrying cutting is inefficient and will negatively impact the drilling pressure, in worse case, even lead to sticking.
The bottom hole pressure will decrease if the gas injection rate increase, so does the increment of bottom hole pressure, which indicates that we can control the bottom hole pressure by adjusting the gas injection rate. Specifically speaking, if the bottom hole pressure is enough to exceed the formation pressure, increasing the gas injection rate can realize the negative pressure drilling again and guarantee
the success of the underbanlanced drilling, and vice versa. To ensure the success of the underbalanced drilling, when increasing the gas injection volume, the bottom hole pressure changes small within 2.6%, range. Combined with the experience formula, the bottom hole pressure of the simulation approach is 2.7% differ from it.
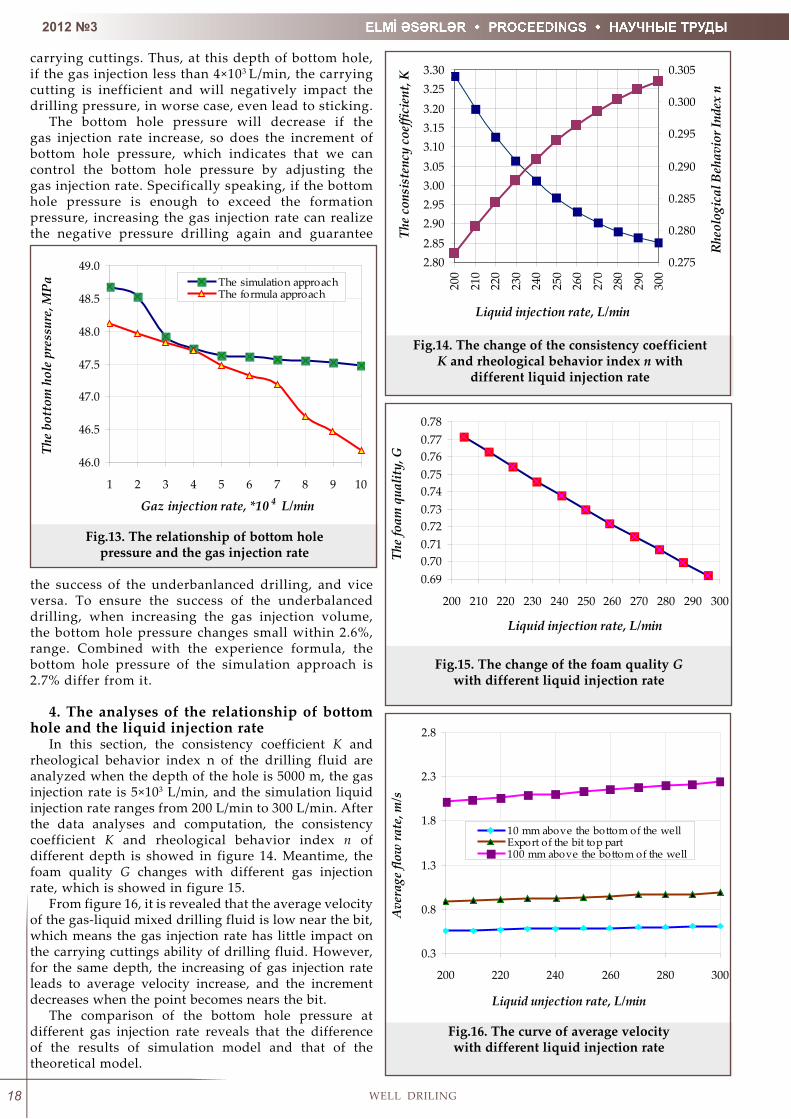
4. The analyses of the relationship of bottom hole and the liquid injection rate
In this section, the consistency coefficient K and rheological behavior index n of the drilling fluid are analyzed when the depth of the hole is 5000 m, the gas injection rate is 5×10³ L/min, and the simulation liquid injection rate ranges from 200 L/min to 300 L/min. After the data analyses and computation, the consistency coefficient K and rheological behavior index n of different depth is showed in figure 14. Meantime, the foam quality G changes with different gas injection rate, which is showed in figure 15.
From figure 16, it is revealed that the average velocity of the gas-liquid mixed drilling fluid is low near the bit, which means the gas injection rate has little impact on the carrying cuttings ability of drilling fluid. However, for the same depth, the increasing of gas injection rate leads to average velocity increase, and the increment decreases when the point becomes nears the bit.
The comparison of the bottom hole pressure at different gas injection rate reveals that the difference of the results of simulation model and that of the theoretical model.
Fig.13. The relationship of bottom hole pressure and the gas injection rate
Fig.14. The change of the consistency coefficient K and rheological behavior index n with
different liquid injection rate
2.802.852.902.953.003.053.103.153.203.253.30
200
210
220
230
240
250
260
270
280
290
300
Liquid injection rate, L/min
The
cons
iste
ncy
coef
ficie
nt, K
0.275
0.280
0.285
0.290
0.295
0.300
0.305
Rhe
olog
ical
Beh
avio
r Ind
ex n
0.690.700.710.720.730.740.750.760.770.78
200 210 220 230 240 250 260 270 280 290 300
Liquid injection rate, L/min
The
foam
qua
lity,
G
Fig.15. The change of the foam quality G with different liquid injection rate
Fig.16. The curve of average velocity with different liquid injection rate
46.0
46.5
47.0
47.5
48.0
48.5
49.0
1 2 3 4 5 6 7 8 9 10
Gaz injection rate, *10 4 L/min
The
bott
om h
ole
pres
sure
, MP
a The simulation approachThe formula approach
0.3
0.8
1.3
1.8
2.3
2.8
200 220 240 260 280 300
Liquid unjection rate, L/min
Ave
rage
flow
rate
, m/s
10 mm above the bottom of the wellExport of the bit top part100 mm above the bottom of the well

19WELL DRILING
ELMİ ƏSƏRLƏR w PROCEEDINGS w НАУЧНЫЕ ТРУДЫ 2012 №32012 №3
5. ConclusionsWith modern computational fluid dynamics method, the
flow field of the gas-liquid two phase flow of foam drilling near the bit is established. The analyses of this paper are based on the drilling parameters of field condition, and by comparison, we conclude that the difference of the results of simulation model and theoretical model is within 5.7%, which verifies the feasibility of simulation model.
The annular flow field of 8½″PDC is established, and the pressure at different depth is predicted. From the prediction results, it can be gained that the average velocity decreases as the depth of the point increases.
The bottom hole pressure near the 8½″PDC bit with different gas injection rate and liquid injection rate is analyzed. With the analyzing result, we know that the bottom hole pressure increases when the gas injection rate decreases and the liquid injection rate increases. Moreover, when the liquid injection rate is 250 L/min, the gas injection rate should be bigger than 4×10³ L/min, or the drilling efficiency will be negatively impacted, in worse case, sticking may occur.
The increase of the gas or liquid injection rate will lead to the increase of the drilling fluid velocity. However, the comparison shows that the increase of the gas injection rate has a bigger effect and thus a better cuttings carrying ability.
Fig.17. The curve of bottom hole pressure with different liquid injection rate
Reference1. W.Hongjun, L.Guoqing, Zh.Xiuhua et al. Study on rheological properties and establishment of
rheological model of aphron drilling fluid //Sino-Global Energy. -2009. -V.12. -No.3. –P.292. W.Guijuan, D.Yuxing, C.Leliang et al. Aphron-base drilling fluid technology //Drilling fluid and
completion fluid. -2004. -V.21. -No.3. -P.443. Zh.Rui, W.Ruihe, Q.Zhengsong. Temperature/pressure relationships of yield stress and plastic
viscosity for foamed drilling fluids //Oilfield chemistry. -2005. -V.22. -No.1. –P.64. G.Liping, H.Hongsheng. Flow experiment of circulative micro-foam drilling fluid in well bore
under HTHP conditions //Journal of Daqing Petroleum Institute. -2007. -V.7. –P.415. G.Hongzhang, L.Weidong, C.Lin. Influence of granule sedimentation on density change of foam
drilling fluid //Drilling fluid and completion fluid. -2005. -V.22. -No.4. -P336. G.Hongzhang, J.Li, R.Xuming. Viscosity-temperature and viscosity-pressure relation characteristics
of foam drilling fluid //Driuing fluid and completion fluid. -2004. -V.21. -No.4. –P.187. Q.Guokun, G.Hongzhang, L.Yanming et al. Simulation study on how the density of foam drilling
fluid varies with well depth //Petroleum drilling techniques. -2004. -V.5. –P.228. L.Songyan, L.Zhaomin, L.Binfei et al. Numerical simulation of flow field in foam generator //Oil
field equipment. -2009. -V.38. -No.2. –P.59. L.Zhaomin, L.Songyan, L.Riyi, X.Xianping. The application of nitrogen foam acid stimulation
technology in well huagang 104-P2 //Drilling fluid & completion fluid. 2009.V.26.No.4.45p10. L.Xiaoming, P.Xiaolin. Study of recyclable micro-foam drilling fluid //Journal of Southwest
Petroleum Institute. -2002. -V.24. -No.6. –P.5311. L.Xiaoming, P.Xiaolin, L.Xingshu et al. A new method on analyzing the stability of foam drilling
fluids //Journal of Southwest Petroleum Institute. -2004. -V.26. -No.2. –P.4712. R.Rommetveit, A.Carlos. Designing underbalanced and lightweight drilling operations: Recent
technology developments and field applications //SPE 69449-MS. Latin American and Caribbean Petroleum Engineering Conference. – 2001. -Buenos Aires. –Argentina
13. C.Perez—Tellez. Improved bottom hole pressure control for underbalanced drilling operations. //Ph.D. Dissertation. Louisiana State University and Agricultural& Mechanical College. -2003
14. S.I.Kam, W.W.Frenier, S.N.Davies. Experimental study of high temperature foam for acid diversion //SPE 82266-MS. European Formation Damage Conference. -2003. -The Hague. –Netherlands
15. C.D.Ivan, F.B.Growcock. J.E.Friedheim. Chemical and physical characterization of aphron- based drilling fluids //SPE 77445-MS. Annual Technical Conference and Exhibition. -2002. -San Antonio. –Texas
16. J.Montilva, C.D.Ivan, J.E.Friedheim et al. Aphron drilling fluid: Field lessons from successful application in drilling depleted reservoirs in Lake Maracaibo //Offshore Technology Conference. -2002. -Houston.
46.0
46.5
47.0
47.5
48.0
48.5
200 220 240 260 280 300
Liquid injection rate, L/min
The
bott
om h
ole
pres
sure
, MP
a
The simulation approach
The formula approach

2012 №3 ELMİ ƏSƏRLƏR w PROCEEDINGS w НАУЧНЫЕ ТРУДЫ
20 WELL DRILING
2012 №3
17. Z.Yingcao, L.Yonggui, L.Zhiwen et al. Bottom hole pressure control technology in underbalanced drilling //Oil drilling & production technology. -2007. -V.29. -No.2. –P.13
18. L.Shiying. The research model and numerical simulation in underbalanced drilling //Ph.D. Dissertation. Southwest Petroleum Institute. -1999
19. Z.Yingcao, G.Deli, L.Yonggui. New model for calculating bottom hole pressure of multiphase flow in annulus of underbalanced straight well //Acta Petrolei Sinica. -2005. -V.26. -No.2. –P.96
Исследование минимальных показателей потока при бурении на депрессии с промывкой пенообразным раствором
Д.Фушенг1,2, Ж.Хиаохуа2, Д.Жинген1, Х.Лянбо1
(1 Китайский Нефтяной Университет, 2 Юго-Западный Нефтяной Университет)
Реферат
Целью работы является улучшение точности расчета теоретической модели бурения на депрес-сии с применением пенных систем, основанное на исследовании и изучении потока жидкости, используя современные методы вычислительной гидрогазодинамики (ВГД) и цифрового модели-рования двухфазового затрубного течения. Была определена модель потока жидкости в промыс-ловых условиях для 8½"-го долота ИСМ во время бурения на депрессии с использованием пеных систем. На основе параметров режима бурения были проанализированы значения затрубного дав-ления и параметров газожидкостного потока промывочной жидкости возле долота на различных глубинах. Сравнив результаты нашего моделирования и скважинные данные мы выявили, что раз-ница между ними составляет менее 5.7%, что подтверждает практическую применимость нашей модели. Результаты прогнозирования забойного давления различных секций ствола скважины показывают, что с увеличением глубины исследуемой секции скважины скорость затрубного пото-ка уменьшается. При различных темпах закачивания газа и пенообразующего состава забойное давление возрастает с увеличением скорости нагнетания жидкости или с понижением скорости нагнетания газа. Если скорость нагнетания жидкости достигает 250 л/мин, то скорость нагнетания газа должна превышать 40000 л/мин, в противном случае это повлияет на эффективность бурения, а в худшем - может привести к прихвату.
Depressiyada qazma zamanı köpüklü məhlullayuyulduqda axının minimal göstəricilərinin tədqiqi
D.Fuşenq1,2, J.Xiaohua2, D.Jinqen1, H.Lyanbo1
(1 Çin Neft Universiteti, 2 Cənub-Qərb Neft Universiti)
Xülasə
İşin məqsədi, maye axınının tədqiqi və öyrənilməsinə əsaslanaraq, ikifazalı boruarxası axının nəzəri modelləşdirilməsi və hidroqazdinamikanın müasir hesablama metodikalarından istifadə edilməklə köpüklü sistemlərin istifadəsilə depressiyada qazmanın nəzəri modelinin dəqiq hesablanmasının yaxşılaşdırılmasından ibarətdir. Köpüklü sistemlərin istifadəsilə depressiyada qazma zamanı mədən şərairində 8½" İSM balta üçün maye axınının modeli müəyyən edilmişdir. Mədən şəraitində qazıma rejiminin parametrləri əsasında baltanın atrafında boruarxası təzyiqin qiymətləri və yuyucu mayenin qaz – maye axının parametrlərinin qiymətləri müxtəlif dərinliklərdə təhlil edilmişdir. Biz öz modelimiz ilə quyu məlumatlarını müqayisə edərək aydınlaşdırdıq ki, onların arasındakı fərq 5.7%-dən azdır ki, bu da bizim modelin praktiki olaraq tətbiq olunmasını təsdiq edir. Quyu lüləsinin müxtəlif seksiyalarında quyudibi təzyiqin proqnozlaşdırılmasının nəticələri göstərir ki, quyunun tədqiq edilən seksiyasının dərinliyi artdıqca, boruarxası axının sürəti azalır. Qazın və köpüklü sistemlərin müxtəlif sürətlə quyuya vurulması zamanı, quyudibi təzyiq mayenin vurulma sürətinin artırılması və ya qazın vurulma sürətinin azalması nəticəsində artır. Əgər mayenin vurulma sürəti 250 l/dəq - yə çatarsa qazın vurulma sürəti 40000 l/dəq – ni ötməlidir, əks halda bu qazıma işlərinin səmərəliliyinə təsir edə bilər, ən pis halda tutulmaya gətirib çıxarda bilər.