Embed Size (px)
Citation preview

Research on Engineered Barrier Technology by
CRESP's Landfill Partnership
Craig H. Benson, PhD, PE, DGEWisconsin Distinguished Professor
University of Wisconsin-Madison/[email protected]
1

W A S T E ACCESS
ROAD
On-Site Disposal Facility (OSDF):aka LLW or MW Landfill
FinalCover
System
LinerSystem
MONITORING
WELLS
Figure courtesy M. Othman, Geosyntec Consultants

The Challenge – Confident Design for a Millennium
3
1 10 100 1000
Engi
neer
ing
Prop
erty
Time (years)
As-Built Current FieldResearch & Experience
?
?
?Analogs

Purpose of Landfill Partnership
4
• Conduct independent applied research to address landfill technology issues that cross-cut the DOE complex.
• Provide forum to discuss regulatory conflicts and shortcomings, and to recommend technological solutions.
• Participate in independent technical reviews related to DOE technologies or sites.

Relevance
5
• OSDFs (landfills) are key step in D&D/restoration at EM sites; stakeholder concerns regarding long-term performance impede acceptance/permitting.
• NAS (2009) identifies existing knowledge on long-term performance of waste containment structures as a principle science and technology gap for EM. Credibility gap for stakeholders.
• LP to provide source terms for EM’s ASCEM (analogous to CBP).

Technical Priorities to Build Confidence1. Develop confidence in the long-term (1000 yr)
performance of OSDF designs.2. Understanding of degradation mechanisms
affecting containment systems in OSDFs.3. Understand and quantify how final covers evolve
over the design life of OSDFs.4. Develop confidence in models used for PAs of
OSDFs and characterize uncertainty in predictions.5. Create and evaluate monitoring strategies that
build confidence in the performance of OSDFs.
6

Approach to Build Technical Confidence• Understand our existing technology – does it
work as well as we predict?• Understand how barriers degrade or evolve
over time so that we can make confident long-term predictions.
• Develop reliable methods (e.g., computer tools) to predict performance in as-built state, and as barrier degrades.
7
1. Understanding our Existing Technology
• State-of-the-art: knowledge base from field studies of barrier performance.– Resistive barrier technologies– Water balance barrier technologies
• State-of-the-art: lessons learned from field studies of cover soil pedogenesis.
• Leachate source terms for LLW disposal facilities.
8

2. Developing Prediction Methods• Mechanistic description of radionuclide
sorption and diffusion in barrier systems.• Assessing methods to measure radionuclide
sorption and diffusion in barrier systems• Accounting for large-particle effects in soil
water retention.• Efficacy of transport models for predicting
transport through barrier systems.
• Evaluating how input uncertainty/sparseness affects uncertainty in model predictions.
9

3. Understanding Barrier Degradation• Geomembrane degradation & life expectancy
in LLW facilities.• Degradation of bentonite barriers due to ion
exchange, hydration-exchange kinetics, and environmental stress (freezing, drying).
• Degradation of bentonite barriers exposed to concrete surfaces.
• Design strategies that manage degradation & ensure adequate performance (e.g., evolutionary covers, surface treatments).
10

11
Speculative discussion at Paducah in March ‘11.
Literature suggests lifespan may be more than 1000 yr.
No data for conditions in LLW or MW facilities.
No credible scientific data for LLW or MW to draw inference, but
methods from solid waste literature
Geomembrane Degradation

Durability Tests in Synthetic LLW Leachate
12
• Three temperatures (50, 70, & 90 C)
• Three solutions (DI, LLW, and LLW-Rad)
• 2 mm HDPE (ERDF, OSDF).

Parameters LLW
AverageSynthetic
Target
TOC (mg/L) 7.73 8
Reduction Potential (mV)
114.86 120
pH 7.21 7Inorganic Macrocomponents (mM/L)
Calcium 3.71 4Magnesium 4.49 5
Sodium 5.27 5.6Potassium 0.38 0.5
Sulfate 7.11 7.5Chloride 4.7 5
Nitrate/Nitrite 1.42 1.5Alkalinity 3.42 3.5
Metals (mM/L)Aluminum 0.022 0.03
Arsenic 0.00066 0.001Barium 0.0017 0.002Copper 0.00011 0.0002
Iron 0.032 0.05Lithium 0.015 0.02
Manganese 0.0082 0.01Strontium 0.015 0.02
Zinc 0.0003 0.0005Radionuclides (ERDF Ave)
Uranium (µg/L) 1488 1500H-3 (pCi/L) 111530 120000
Tc-99 (pCi/L) 730 800

Geomembrane Incubators

Major Cations in LLW Leachate
15
1x10⁻¹
1x100
1x101
1x10²
OSDF ERDF EMWMF ICDF All LLW MSW OSDF ERDF EMWMF ICDF All LLW MSW
Co
ncen
trat
ion
(m
mo
l/L)
Ca Mg(a) (b)
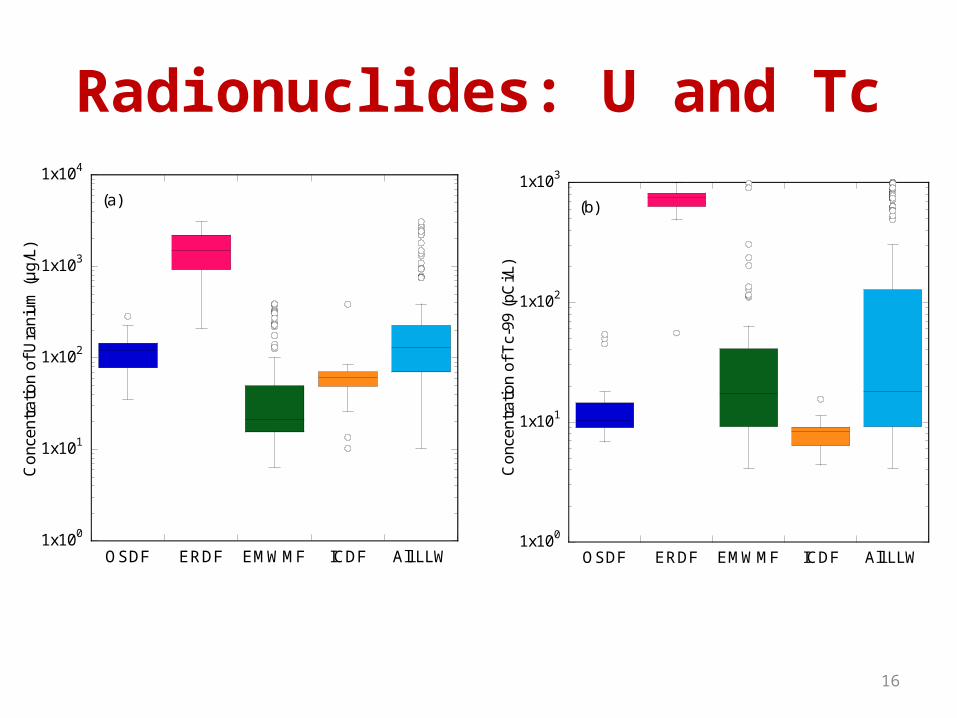
Radionuclides: U and Tc
16
1x100
1x101
1x10²
1x10³
1x10⁴
OSDF ERDF EMWMF ICDF All LLW
Co
ncen
trat
ion
of U
ran
ium
(µ
g/L
)
(a)
1x100
1x101
1x10²
1x10³
OSDF ERDF EMWMF ICDF All LLW
Co
ncen
trat
ion
of T
c-99
(pC
i/L)
(b)

Temporal Behavior: U and Tc
17
1x100
1x101
1x10²
1x10³
1x10⁴
0 2 4 6 8 10 12
OSDFERDFEMWMFICDF
Co
ncen
trat
ion
of
Ura
niu
m (
µg
/L)
Time (yr)
(a)
1x100
1x101
1x10²
1x10³
0 2 4 6 8 10 12
OSDFERDFEMWMFICDF
Co
ncen
trat
ion
of T
ech
netiu
m (
pC
i/L)
Time (yr)
(b)

Temporal Behavior: Sr and Tritium
18
1x10⁻¹
1x100
1x101
1x10²
1x10³
0 1 2 3 4 5 6 7 8
EMWMFICDF
Time (yr)
Co
ncen
trat
ion
of
Str
oni
um-9
0 (p
Ci/L
)
(c)
1x100
1x101
1x10²
1x10³
1x10⁴
1x10⁵
1x10⁶
0 2 4 6 8 10 12
ERDF
EMWMF
ICDF
Co
ncen
trat
ion
of T
ritiu
m (
pC
i/L)
Time (yr)
(d)

Coupling Hydrological & Erosion Control on Covers
19
631 m
631 m
807 m
452 m
Max Elevation = 1606 mMin Elevation = 1584 m
1606 m
1584 m
• Used Cheney Disposal Facility (Grand Junction, CO) as base case
• SIBERIA landform evolution model (1000 yr simulation)
• SVFLUX variably saturated flow model for hydrology.

Erosion on Rip-Rap Covers
20
Resistive Cover Soil Profile
305 mm
150 mm
610 mm
610 mm
915 mm
Remaining
Cover top layer
Bedding layer (Rip-rap only)
Frost protection layer
Radon barrier
Transition layer
Tailings
1000 Year Erosion - Vegetated Riprap CoverSemi-Arid Climate
1 m2 m3 m4 m5 m6 m7 m
Rip-rap surface layer

21
Resistive Cover Soil Profile
305 mm
150 mm
610 mm
610 mm
915 mm
Remaining
Cover top layer
Bedding layer (Rip-rap only)
Frost protection layer
Radon barrier
Transition layer
Tailings
1000 Year Erosion - Vegetated 40% Gravel Admixture CoverSemi-Arid Climate
2 m4 m6 m8 m
Gravel Admixture Topsoil Surface Layer
Coupling Hydrological & Erosion Control on Covers: Gravel Admixture Cover

Hydrological Prediction for Grand Junction, CO
22
To
pso
il
Gra
ve
l A
dm
ixtu
re
Rip
-ra
p
To
pso
il
Gra
ve
l A
dm
ixtu
re
Rip
-ra
p
En
d-o
f-ye
ar
Cu
mu
lativ
e P
erc
ola
tio
n (
mm
)
-200
-100
0
100
200Typical Wettest • Gravel admixture
covers have net release to atmosphere
• Rip-rap covers harvest water – collect and drain into waste.
• Similar efficacy for erosion control!
FlowInto
Waste
FlowOut of Waste

Transport Parameters for Barriers
23
Diffusion and sorption tests for geomembranes.
Evaluating new geomembrane with exceptionally low radon diffusion coefficient.

Transport Prediction for Barriers
24
152 mm I.D.
Upper reservoir
Compacted clay linerGeomembrane
Effluent bagInfluent bag
Samplingport
Threaded tie-rod
120
mm
80 m
m
Sampling port
Glass fiber filter
30 m
m 3
0 m
m
60
mm
(a)
Sampling port
70 mm 12 mm 70 mm
Leachate
Geomembrane
Soil Liner
z = 0
Co Concentration
z
CsPartition out of geomembrane`Cg = Cs Kg
Partition intogeomembraneCg = Co Kg
Lg
Ls
Diffusion throughgeomembrane
Concentration distribution
Co= Leachate Concentration
Cg= VOC Concentration in Geomembrane
Cs= VOC Concentration in Soil Pore Water
Kg= Partition Coefficient of Geomembrane
Lg= Thickness of Geomembrane
Ls= Thickness of Soil Liner

Prediction - TCE Transport in Clay Barrier
25
0
10
20
30
40
50
0 50 100 150 200 250 300 350 400
Replicate 1 (depth=60mm)Replicate 2 (depth=60mm)Replicate 3 (depth=60mm)Foose et al. (2002) (depth=60mm)POLLUTE (depth=60mm)Replicate 2 (depth=90mm)Foose et al. (2002) (depth=90mm)POLLUTE (depth=90mm)
Time (days)
Co
nce
ntra
tion
(mg
/L)
(c) TCE
Forward “Class A” predictions using independently measured input parameters (not calibrated)
Summary Remarks• Independent basic to applied research focused
on developing confidence in containment facilities.
• Focus on topics that our stakeholders indicate are important.
• Assess full-scale facilities and near full-scale demonstrations, understand fundamental mechanisms, and create/validate predictive models.
26


![George Benson - The Best of George Benson[1]](https://img.dokumen.tips/doc/110x75/5695cf541a28ab9b028d9c4a/george-benson-the-best-of-george-benson1.jpg)


![Benson Lecture Inpla[1] Phil Benson](https://img.dokumen.tips/doc/110x75/5549e849b4c90518488b4ca4/benson-lecture-inpla1-phil-benson.jpg)

