Embed Size (px)
Citation preview

Research needs towards resilient communities
Paolo Franchin
2018, June 18th – Thessaloniki, Greece
Community
People Infrastructure
Users System
Engineering
Political, economical, cultural Methods, tools (quantitative)
Obstacles to achieving resilience
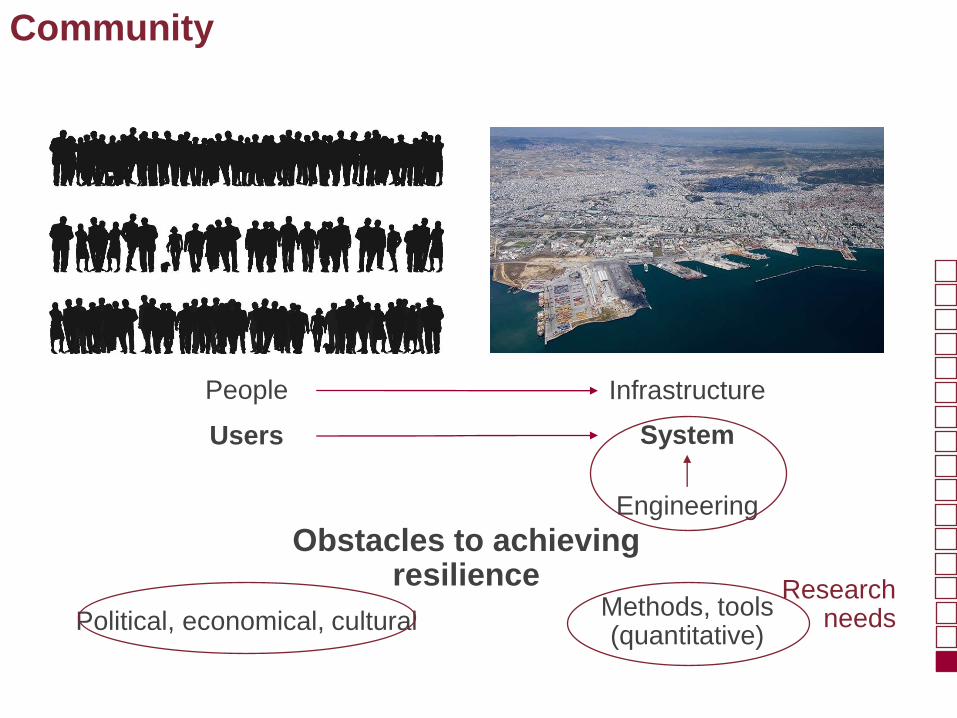
Research needs

Resilience
Resilience is difficult to quantify because it is a systemic metric...
0
ft
tR Q t dt
(Bruneau et al 2003)
Sta
te
Time Shock Shock

System
Resilience is difficult to quantify because it is a systemic metric...
…and system is complex
Amplification
Interpolation
(Franchin 2014)(SYNERG, 2009-2013)

Resilience assessment → Resilience design
Assessing resilience is a difficult task, Designing/building it into the system is even more
Two, non mutually exclusive strategies to invest resources
Sta
te
Time
(Bruneau et al 2003)
Pre
ventio
n
Ro
bu
stn
es
s
Redundancy Resourcefulness

Uncertainty in time of
occurrence of shocks
Prevention or cure?
Sta
te
Time
Cure: reasons to wait
Time to next shock
(Meadows et al 2004)
Time to next
election

Prevention or cure?
In praise of prevention
Uncertainty for 𝑡 > 𝑡𝑠ℎ𝑜𝑐𝑘 much larger
What if the shock is TOO LARGE? Preventing the loss may be the only way
𝑡𝑠ℎ𝑜𝑐𝑘
Sta
te =
GD
P
Time
L.A. Northridge 1997
Pre-shock
GDP Disaster
(years)
Pompeii 79
Unsustainable
(never)
Disturbance
Japan, Tohoku 2011 Catastrophe,
partially
unsustainable
(decades)
Progetto CASE, Italy 2009
UNPREDICTABLE
Resilience
Ris
k
(Zio 2018)
(Davis 2014)
Resilience
Research needs
Hazard
Component|Damage
System|Consequences Physical/Function
al
𝑃(𝐷|𝐼)
Intensity 𝐼
Improve
surrogate
models
(fragilities)
As simple as possible,
but not simpler (flow-
based)
Sensitivity to
plug-in models
Simulation at the
base of risk analysis
since the ’70s
because:
• Rare events
• Complex system
• Experimentation
economically
unsustainable &
physically
infeasible
+
Unprecedented
cheap computing
power
Validation
Decision Support
System Using system sims to
inform decision making
𝑃𝑡𝑎𝑟𝑔𝑒𝑡
Resilience-
based
design
(RBD)
1
2
3

1: Resilience-based design
(Bisch 2015-18)
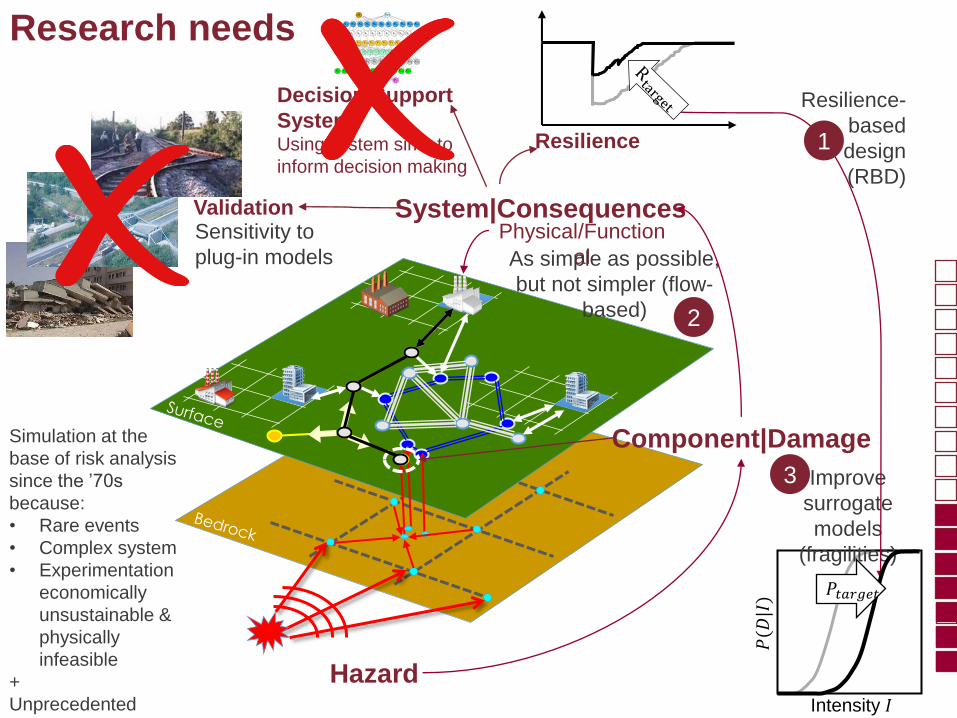
Resilience-based design: 𝑅 → 𝑃
The question is how safe is safe enough?
Codes started with life safety, they’re moving to damage control, will they end up with community resilience?
i.e. Performance-based design with resilience-based targets

Resilience-based design: 𝑅 → 𝑃
System level
Component or sub-system level
Undesired outcome
Core
damage
Radioactivity
release
Reactivity
control Fuel
cooling Confinement
Vital plant functions
Frontline systems
Containment
spray system
Support systems
Water Electrical
System level
Component or sub-system level
TO
P-D
OW
N
BO
TT
OM
-UP
Outmigration
Housing Education Employment
Vital community functions
Undesired outcome
Primary systems (bldgs)
Residential Offices Factories Schools Hospitals
Secondary systems (lifelines)
Water Waste
Public
services
Energy Commun
ication Transport
Unsustainable
impact
Nuclear Power Plant Community
(Mieler et al 2013)
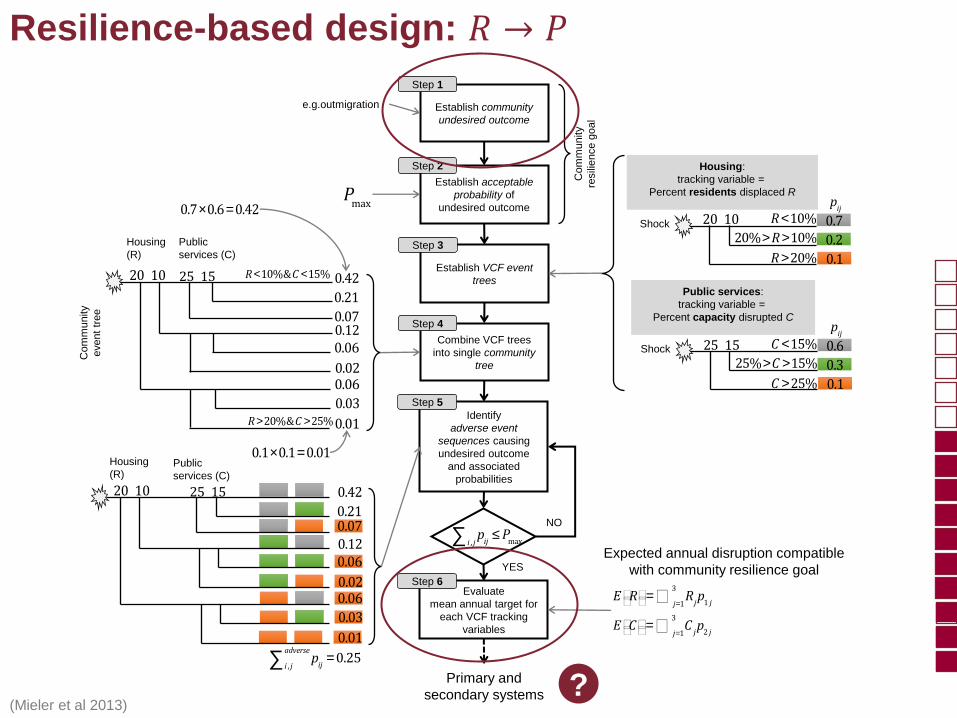
Resilience-based design: 𝑅 → 𝑃
Establish VCF event
trees
Step 3
Combine VCF trees
into single community
tree
Step 4
Com
munity
resili
ence g
oal
p
iji , jå £ Pmax
NO
Primary and
secondary systems
Shock 25 15
C >25%25%>C >15%
C <15% 0.6p
ij
Public services:
tracking variable =
Percent capacity disrupted C
0.3
0.1
Shock 20 10
R >20%20%> R >10%
R <10% 0.7p
ij
Housing:
tracking variable =
Percent residents displaced R
0.2
0.1
Establish acceptable
probability of
undesired outcome
Step 2
Pmax
Establish community
undesired outcome
Step 1
e.g.outmigration
Com
munity
event
tree
Evaluate
mean annual target for
each VCF tracking
variables
Step 6
YES
E Réééé= Rjp1 jj=1
3
é
E Céééé= Cjp2 jj=1
3
é
Expected annual disruption compatible
with community resilience goal
20 10
Housing
(R)
Public
services (C)
25 15 0.42
0.21
0.070.12
0.06
0.02
0.06
0.03
0.01
R <10%&C <15%
R >20%&C >25%
0.7´0.6=0.42
0.1´0.1=0.01
0.42
0.210.07
0.12
0.06
0.02
0.06
0.03
0.01
Identify
adverse event
sequences causing
undesired outcome
and associated
probabilities
Step 5
20 10
Housing
(R) Public
services (C)
25 15
p
iji , j
adverse
å =0.25
(Mieler et al 2013) ?

Resilience-based design: 𝑅 → 𝑃
Systemic analysis can fill this gap
{{
1 1
VCF service system system
n n m m
D I I D1 2 3
Public services
Service
importance
matrix (1×n)
serviceI
Service P
olic
e
Health-c
are
Fo
od
0.3 0.3 0.4
Serv
ices
0.4
Systems
Police
Health-care
Food
Primary Secondary
Polic
e s
tatio
ns
Hospitals
Sto
res
Wate
r
Ele
ctr
ic p
ow
er
Fu
el (o
il)
Roads
0.5
0.5
0.2 0.20.2
0.2 0.10.10.1
0.1 0.10.20.1
System
importance
matrix (n×m)
systemI
New hospital tolerable
disruption (unknown)
Disruption to existing
Buildings and lifelines
(from systemic analysis!)
,2 ,2
,1
,1
VCF service system system
system
service system
DD
I I D
I I
Still
just an
idea
{ {
,1 ,2 ,1
,2
,1 ,1 ,2 ,2
1 11 1 1 ( 1) ( 1) 1
1 1 1 1
VCF service
system system system
system
service system system service system system
n nn n m m
DD
D
II I
D
I I I I D1 2 3 14 2 43 1 2 3 14 2 43
1 4 2 4 3 1 4 4 4 2 4 4 43
Resilience-based performance target for a new hospital
Hospital ∈ Health-Care System ∈ Public Services VCF
𝑃𝐶 = 2 × 10⁻⁴ ÷10−5?

2: System model

*
* *
T
D D seismic D
S S D D
I q Q h Q h 0
I h I h r q 0
% %% % %%
%% %% % %
o
*
* *
with
T
D
S S D D
I q Q 0
h r q I h I h r q 0 r q Rq q
System functional model
0 1 1 0
0 1 0 1
1 0 0 1
1 0 1 0
0 0 1 1
e vn nI
e3
e4
e5
e2
e1 v4
v1
v3
v2
4
5
V
E
n
n
e3
e4
e5
e2
e1 v4
v1
v3
v2
0 11 0
0 1 0 1* ** 1 0 0 1
1 0 1 0
0 0 1 1
e ve De S
n n n nn nS DI II
e3
e4
e5
e2
e1 v4 demand
v1 source
v3
v2
V S Dn n n
1 0 1 1
0 1 1 1
1 1 1 1
1 1 1 1
v vn nA
Head
driven
Additional
demands
Balance (flow continuity at nodes)
Resistance (line loss)
1
1
edge flows
node demands
Q 0 if junction
e
D
n
n
i
q
Q
Assessment problem,
not design! • Post-event demand model
must be linked to systemic
damage
• Done for water and gas
• Source capacity still missing

Connectivity Flow
(Cavalieri et al 2014)
System functional model
Power networks: much more difficult problem (SECD formulated in 1955 still no fast/robust solution technique)
People are doing everything ranging from pure connectivity, to DC (linearized), to AC (nonlinear). Truth is that even AC is incomplete
Power networks
3: Components’ models

Systemic analysis → 100s or 1000s of components → surrogate models
Component damage model
𝑝 𝐿𝑆𝑖,2 𝐼𝑖
𝑝 𝐿𝑆𝑖,1 𝐼𝑖
𝐼𝑖 = 𝑥
Intact
Damaged
Collapsed
𝑝 𝐶𝑖 = 0 𝑥
𝑝 𝐶𝑖 = 1 𝑥
𝑝 𝐶𝑖 = 2 𝑥
𝐼𝑖 is just one parameter of ground motion
𝑰𝑖|𝐼𝑖 other GM parameters depend on site
Fragility is structure & site-dependent
Fragility from field damage → difficult to generalize → numerical
simulation
𝐼𝑖 𝐶𝑖
fragility 𝑝(𝐿𝑆𝑖𝑗|𝐼𝑖) → damage given intensity 𝑝(𝐶𝑖|𝐼𝑖)
Calibrated models

Component damage model
Fragility analysis via numerical simulation is a delicate business. Results depend on: ground motions, numerical model, analysis
method, statistical method and modelled uncertainty

Refined fragility analysis of archetype buildings should not be used to support fragility functions for classes of assets!
Component damage model
(Borzi et al 2015)(Franchin et al 2016)(RINTC Workgroup, 2018)
0 0.1 0.2 0.3 0.4 0.50
0.1
0.2
0.3
0.4
0.5
0.6
0.7
0.8
0.9
1
PGA (g)
Da
ma
ge
fra
gili
ty
0 1 2 3 4 50
0.1
0.2
0.3
0.4
0.5
0.6
0.7
0.8
0.9
1
PGA (g)
Colla
pse
fra
gili
ty
0
20
40
60
80
100
120
140
160
180
0
10
20
30
40
50
−25
−20
−15
−10
−5
0
0 0.05 0.1 0.15 0.2 0.25 0.3 0.35 0.40
1
2
3
4
5
PGA (g)
Y
bridge database (a) bridge information model (b)
bridge finite element model (c) multiple stripe analysis (d)
Carriageway (3 decks)!
Deck (1 span)!
Deck (3 spans)!
Deck (1 span)!
Pier segments!
Foundation!
Deck joint!
Abutment!
Deck (3 spans)!
Spans!
Span segments!
Individual runs (each is one two-components
ground motion)"
Lognormal fit
to analysis results"
Deck: Elastic frame elements"
Restrained node"
Free node"
Link/Connection:
twoNodeLink element"
Fixed-base (double-node, option for SSI & multiple-support excitation)"
Base nodes of pier segment
constrained to upper node of foundation"
Deck: intermediate masses/dofs"
Deck joint: zeroLength element"
Pier segments & transverse beams:"
BeamWithHinges element"
D4 project 2009-2012 450+ bridges
𝐼𝑖 𝐶𝑖
𝑀
𝜂 𝜀 𝐸
𝐵𝐺
Bridge
geometry
𝐵𝑀
Bridge
materials
𝑆475
Site seismicity:
fragility is site-dependent
BN-based fragility
Lo
ss
direct 𝐿𝐷 = ∑𝐿𝐷𝑖 indirect 𝐿𝐼 = ∑𝐿𝐼𝑖 + ∑∑𝐿𝐼𝑖𝑗
RINTC project 2015-2018 Tens of RC, PRC, URM, steel
buildings

Conclusions

• Resilience is improved by reducing vulnerability and improving response/recovery
• Vulnerability reduction seems the most reliable, given the uncertainty in 𝑡 > 𝑡𝑠ℎ𝑜𝑐𝑘
• Components’ damage: need better surrogate models Fundamental research in structural and geotechnical engineering is still needed
• Systems’ behaviour: need more realistic representation (flow! Or enhanced/smart connectivity…)
• If former two are achieved, systemic analysis will be reliable enough to link performance of the components to global community resilience goals. This will provide: • A rational basis for performance targets in next generation
codes
• Support for building decision-support systems for use in real time
Conclusions

Thank you!
Funding:
European Commission:
FP7 project SYNER-G – Systemic analysis framework
Italian Department of Civil Protection:
Reluis project RINTC – Seismic risk of Italian code-conforming buildings
Reluis project RS6 – Seismic risk to lifelines
EUCENTRE project d4 – Seismic vulnerability of Italian highway bridges
Contributors:
Francesco Cavalieri, Pierre Gehl G. Weatherill, F. Noto, A. Lupoi, F. Mollaioli, S. Tesfamariam, S. Giovinazzi