Embed Size (px)
Citation preview

4
I
c 3
RESEARCH MEMORANDUM
EXPERIMENTAL ZWESTLGATIOW O F TIlE AERODYNAMIC LOADING
ON A HELICOPTER ROTOR BLADE IN FOR-WARD FLIGHT
By John P. Rabbott, Jr., and G a r y B. Churchi l l
FOR AERONAUTICS WASHINGTON October 25, 1956

f 4 NO. 2
r
NACA Reseezch Memorandum 'L36i07
..
! John P. Rabbott, Jr., and Gary B. Churchill
October 1956
Pege 26: Replace figure 4 with corrected figure 4 attached. The error corrected is in the curve labeled b l in the lower plot (fig. 4(b) ) .
Issued 12-6-57
I.
c

By Jo'm P . Rabbott, Jr . , and Gary B. Churchill October 1956
Page 10:
The formula for pbzse angle & i?? the next line t o the last should be corrected as follows:
Pages 19, 20, and 21:
Irrzszmch as the incorrect f o r m d ~ was used to coxpute the phase angles presented i n t sb les I1 to V, these tables should be replaced wl th revised tables I1 t o V &tache&.

Tip-sped ratio, p
- 5
1.85 - 148 -12 8
194 192 - 183 110 -2
-25 194 175
107 51: 4
-25 188 172
132 24 -3 -31- 161 183
52 -20 -47 -20 32 117
-
-
-
n
- 1 2 3 4 5 6
1 2 3 4 5 6
-
2 3 3 (repeat) 4 1
-12
45 -2
97 153 236
-13 -3 192 208 198
-56
204
1 -42 -81 53 -23
-91 -3
-128 -89 249 29
189 45 187 176 224 202
-158 35 225 174 -37 211
194
-118 -122 12 -3 174 193
25 1.43 153 181 65 97 182 182 193 -15
- 1 2
-20 78 1-56 1b3 127
-1 -7 26 162
158 129
0.08
166 22 -17 187 159 23
.10
1 2 3 4
2 - 1 2 3 4 5 6 - 1 2 3 r: 5 6 - 7
2 3 4 5 6
-
-
10 -15 122 -33 -104 119
-109 5
i -1.5 197 131
i -28
-15 6
-15 179 126 -27
.15
-134
-17 -19 ' -53 10 5 -5 -56 -41
-120 -110 -120 -7 128
81 75 i 248 137
-61
61 56 -3 e 131- 143 64 -101 -107 189 -34 -33 -106
3 2 -4 -45 -47
.20
.2L
~ -24 5
-1-3 -109
i 174 79
-29 4
-24 -103 140 65
16 14
-133 -107 -22 114
49 -16 -18 -1.7 27 -48 -
.29

THIS PAGE IS U N C L A S S I F m -. - 3 -
TBTA IIi. - HAKWNLC AMIYSIS OF TFXOFETICAL SECTION LIFT
ip = 0.20; I;ZR = 482 ft/sec; f' = 2.2 s q ft; r / R = 0.74 r L
loading, lb/sq f t
0.00223 1.23
1.85
0.021
.012
.015
.005
I I
0.142 1-2 0.007
.131 o .016
.126 o I010
.125 o . O E
Tip-speed ratio, p
0.08
.10
-15
.x)
.24
.29
92, 03, deg
- deg
-123 4
-15 6
0 -5
-9 2
-5
4-24 8
7
2
-101
-82

I
CT
0.00223
.ooU7
.00761
Disk loeding, lb/sq ft
1.24
2.47
4.20
0.023
.007
. ook
0.144
.118
.125
0.028
.024
.022
KACA - Langley Fleld, VP.

ID
c
Y
c
d I
I.
NATIONAL ADVISORY C W I T T S ~ R O N A U T I C S
RJISVDLRCR MEMORANDUM
ON A -KELICOP!ER ROTOR BLADE IN FOFNAm FLIGHT
BY J o b P. Rabbott, Jr., and G a r y €3. Churcbill
SUMMARY
An exgerhental investigation of the aerodynmic loading on one blade of a two-blade teeter ing rotor hes been condircted i n forward f l i g h t f o r a tip-speed-ratio range of 0.08 to 0.29 at a disk loading of about 2.1: pounds per square foot and a t i p sneed of about, 480 feet per second. Chordvlse loading distributions at f ive ssanwise stations and the variation of sec- tion loading and t o t a l blade l i f t w i t h azimluth positior, are presented. Also determined are the krarmonic content and phase angles of section and t o t a l blade lift f o r the first six harmonics of rotor speed. The data shut a much greater harmonic content, vhich, i n general, varies inversely with t ip-speed ratio for the range or’ tip-speed ratios investigated, than a w-i- form ifl lm- theory would predict . The nondbeensional spanwise load iw is infiicated to be relatively constant w i t h thrust coefficient azld tiq-speed ra t io .
INTXODUCTION
A knovledge of the chordwise and szanwise aerodynamic loading dis- t r ibut ion on a helicoqter rotor blade is ofter- required to predict possible sources of vibrat ion exci ta t ion which lead t o stress acd fatigue problems i n the rotor system.
P.l-ti?ough zresent rotor theory (refs. 1 a d 2) predicts the overall r o t o r thrust md pwer reguired sufficiently w e l l , it does not, i n g e n e r d , indicate the gresence of zpprecizble higher harmonic air loads Ebove the secand hzmonic, inssrnuch as a uniform induced velocity across the rotor disk is usually assmed. Because of the very complex nature of the flow i n a rotor wake, the calculation or’ the actuzl induced flow pa t te rn is a very diff icul t mthematical problem. Kmiever, there are recent theories availzble, sizch as those of references 3 and k , which nore closely approxi- m-Le the sc tua l induced velocity distribution than does e s h p l e uniform in f lmr assungtion.
In a srevious experimentel investigation of rotor-blade loading (ref. 3 ) , the aerotiynamic loading on a model rotor blade w a s dete-dned -

2 NACA €!&I 136107
for a vide vzriety of fl ight conditions but kL.d not indicate harmonic loads above the second hamanic beceuse of the lov freqGency response of the neas-zirq eqcipnent.
+
In orher t o grovide the designer w i t h a more quantitative- view of rotor-blade loaang t h n calciiLations or orevious measuren;e_n-ts would indi- cate, an investigation has been conaucted in t ne Lzngley fu l l - sca le twnei t o xeas-me the chordwise and spanvise aerodpmnlic loading dis t r ibut ion on a helfcapter rotor biaiie i n s t a t i c t h r u s t acd I’onmrd f l i g h t . Tie s t a t i c - t b z u s t results are presented in reference 6, an8 the present pa>&r covers the forderd-flight data. Test conditions, which vere a l l below stall i n simulated level flig2.-t, correspand t o a range of tip-sgeed ratios of 0.08 L
t o 0.29 f o r EL disk loading of about 2.k porul-ds per square foot and a r o t a t i o m l t l p sgeed of about 480 f e e t c, =r second.
0
1
Differential pressures bet%-een the u2ger ana lover surfaces were meas-med a t ten chor&ise locations f o r f i ve spanwise staticlns a t each test condition. The deta were reeuced to give chordwise an0 spanwise loading distrlbutions and tne variation of section and t o t a l blade load with az izu th . The l a t t e r data were tnen hamonically analyzed to give ths emplitl*tdes and phase angles of section and total load for the first s i x ham-onics sf rotor speed. These &ta are presented and a coxparison i s rmde with the loading predicted on tine basis of an assurned uniform inflow. Rotor forces, shaft torque, and blade motions were also measured and are presented herein.
a’ projection of angle Setween rotor force vector and axis of no feathering in plane containing f l ight path and axis of no feathering
C blade sectiol? ck?ord, ft
cl
CT t P x - ~ s t coezf icien-t , T ltR2p (m )2

NACA FN ~56107 - 3
Y
C
L
”
D drag, lb
f equLvalext f lat-plate area representing parasite drag, based on unit 6rag coefficient, Helicopter parasite drag , sq I”t
2
20
1,
L
LO
Ln
n
v
1 v X
c
3L
a-r * ..
9 I
instantaneous section l i f t , lb
steady term ir- series for sect ion l i f t , lb/ in .
coeff ic ient of cos(n$ + $A i n series for sect ion l i f t , lb/in.
instcntaneous t o k l blade Eft, lb
steaiiy tern i n s e r i e s f o r t o t a l blede lift, lb
ccef f ic ien t of cos (n$ + an) in s e r i e s f o r t o t a l blade l i f t , lb
harmonic order
loca l dynanic Bressure, lb/sq ft
radial d i s t m c e t o blade element, P t
blzde ratiius measured from cer-ter of rotatiorz, f t
rotor thrust, lb
ilzduced inflov veloclty et rotor, Ft/sec
moxentum vaiize or” induced velocity i n hovering,
forward velocity, f t /sec
dis-knce from leading edge t o any point on chord, ft
rotor angle of attack; angle beheen projection in plane of syrrxietzy of a i s of no featiiering and Line perpendicular to flight path, positive rearward, deg
blaae-elemeot angle of attack, xeasu-red from l i ne or” zero left, deg
blade-section ?itch angle; angle between l i n e of zero l i f t or” blade section and plane perpendicaar -Lo axis of no feethering, deg

4
h
n
inflow ratio, (v sin a - v) QR
t i p s p e e d r a t i o , 'Os a sl.R
nass density of air, slugs/cu f t
phase arqle, with respect to zero azixuth, of amglitude of nth hamonic or" section lift, deg
phase angle, vith respect to zer3 azimuth, of amplitude of nth harmonic of total b lade l i f t , deg
blade azimuth angle xeasured from dovn-wind posi t ion in direc- t ion of rotation, deg
rotor aEgular velocity, raUans/sec
DESCXPTION OF EQUIPMENT
The equisment, u i t h t'ne exceptior- of the bhdemotion indicators , i s described in de t a i l i n r e f e rence 5, bct i s reviewed briefly here.
Rotor Elades
The rotor blades are of rectsngular plan fom, untwisted, end have a &.meter of approximtely 15 f ee t , &z1 NACA 0012 a i r fo i l sec t ion , and a rator so l id i ty of 0.097. One blade of the tvo-blede teetering rotor is i n s t r n e n t e d t o measwe the different ia l pressmes bet-geen the upper end *
lover surfaces a t ten chordxqise locations a t each of f ive s~anwise sta- t ions. Sigme I is a sketch of the instrmented blade showing the prin- cipal diEensions an6 the Fressure-orifi#ce locations. Figure 2 show the Cietails of the teetering rotor k b .
The r&.,or-blade s t i f f aes s , both i n bending end i n torsion, i s very high. The ben6ing stil'fness varies fron e maxixi? of =bout 9,0'30,OGC paunds per square inch a t the root to a 6znstan-l value of 2,850,oco pounds ger sqmre inch for the outboard 40 percent of the blade s p n . The overzl l tors iocal s t i f fness , measured betveen the bla&e root m& blade t i p , is 278 ir_ch-?omds per degree of t w i s t .

NACA m ~56107
Pressure-Pickup Installation
5
. Y
The pressure pickups used are NACA miniatwe electr ical pressure gages ( re f . 7) of a va r i ab le - induckce tme . F i f ty gages are mounted Lnside the rotor blade i n such a wzy that neither cectrifugal force nor flapqing accelerations affect gage output. Inasmuch as the rotor i s of the teeter ing t f le (wit'noxL drag hinges), there can be no appreciable in-skne motion to affect tne geges. A short length of tubing connects each gage to the appropr ia te pa i r of or i f ices . The tubing diameter and length are constast for a l l gages in order to maintain constant aaqlitzde and phase response between gages. The anigl-i_tude and phase
the pressure da'& w e r e recorded, k-ere calibrated. The overall frequency response fo r the system w a s determir-ed t o be f l a t t o about 60 cycles Der
system, indegendent of frequency, which mcunted t o 80 of azimukh. There- fore , th i s lag is 16O Tor the second harmonic, 2 4 O f o r the third harmonic, and so for th .
c response f o r the measuring systen, including the oscillograph on which
L second, the s ix th harmonic of ro tor speed. There vas a t i m e l a g i n the
Although 45 s l ip r i ngs were avai lable for e lectr ical connect ion between the rotating and s ta t ionary par ts or" the model, this amber vas 20% suff ic ien t to enable a l l f ive p ressure s ta t ions to be recorded at one tine. Therefore, a remotely oserated stepsing switch, located on the rotor hub, w a s enployed whereby s ta t ions 1, 2, End 3 (a t r/R = 0.31, 0.56, and 0.75, respectively) were recorded simultaneously. The switch vas then edvanced and s ta t ions 3, 4, and 5 ( s t r / R = 0.75, 0.85., and 0.95, respecuvely) were recorded. Statio2 3 w z s thus recorded twice a t each test point as a check OE the repeatabi l i ty of the data.
Blade-Motion Indicators
Blaiie p i tch a-n-gles and flapping angles were meesured by smll veriable transformers mounted 0x1 the rotor hub, as shbvlm i n f i g u r e 2. A n input power of 400 cycles was used for each pickup and the output w a s filtered to g ive e single sine-vave trace with mgli tcde prosort iom1 to pi tch angle or flepping an-gle. The response of the system w a s f l&t over the operating range. However, there vas a time l ag which varied w i t h frequency and which was accounted for i n t-he data-reduction process. Although r e l i eb le data were obtained, this systern is not recornended fo r fu tu re work because of the complicated calibration and cia-La-redizction nethods required.
L
Test Vehicle end Wind Turin-el
i
L
Figure 3 shows the nosel Fr- operat ion in the Lazxley full-scale tunnel. The rotor forces are transmitted through the shielded strrbs t o the wind- t m e l balance. A corrplete descrigtioll of thx wind ta rne l and i ts equipment

6
is given i n reference 8. The torque input was rneasured by means of a strain-gage beam nounted 011 the rotor shaft.
In order to obtain the force tares 02 t3e basic model, the Eodel was operated xi th blades off for the rar-ge of tunnel speeds End shaft angles cf attack to be covered i n the t es t s . L i f t , drag, side force, and shaf t torcpe tares were recorded. Tien, i n order to sirnulate a given f l i g h t coldi t ion for a given tunnel speed and rotor speed, the desired thrust and parasite drag were set end the side forces trimmed approximtely to zero, the moCel tare forces being t&en into accolmt. Oscillograph records were taken or" the pressure data and blade Eotions. The sk?aPt torque vas recorded on a gotent imeter . Each oscillogragh trace corre- sgondirig to the output of a pressure gage was read a t k8 points per cycle. The readings f o r corresponding points for 10 cycles were averaged and recorded on automztic punch cards. Autcrmatic comguting mchines tinen converted t h t s average t o a pressme different ia l and surne& tihe outgut a t each spanwise station to give the section loading. The section loadir,g X E S thee Ps,rnonically amlyzed to give tkre amplitude and p h s e angle, with respect to x r o azimuth, of each harmonic of loading. A correction for t'ce time l a g i n t'te instramentation described previously was then intro- duced. %e values of section loading, when plotted against radius, were mnxal ly integrated to give total blaee lift a t 24 points per cycle. These data were t k n harmonically analyzed t o give the aql i tude an6 pkase angle of each kmnonic of total b lade l i f t .
A si%iLar malys is , f o r eigbt 2oints ger cycle, was xzde of' the blade-motim. traces, excegt thzt t'ke site and cosine componellts of $he harcon3.c motions, correspsniirg -Lo l owi t cd ina l and lateral blade flapping and pitch angles, respectively, were obtained.
The tunnel jet-boundary correction was assumed t o be zero inasmuch as the tunnel canfiguration, with a ground plane instal led, is similar to that described in r e f e reme 9 vhich showed the correction to be cegligible. A stream-angle correctio2 was applied to the rctor angles of attack.
Perr'o-mnce Data
As aiscussed previously, the madel force tares were measwed and accxnted I'cr i n se-b-ling the Cesired rotor forces a t each test condition. CcxGarisoli- of t2e drag tares t~us cbtained with those neasured cn the
li
d

NACA FM ~56107 - 7
same mdel i n a ?revi-ous investigation showed a large variation. Inasnuch as the baluce parasite-drag values, therefore, were i n doubt, the ro tor parasi te-dreg-l i f t rc t ios for performance calculations were taken t o be
Y
c
..
D
where a, t ie control axis angle of attack, w&s obtaiced from aeasured bla& motions and a ' w a s computed from rei'ereoce 10. Table i shows a discrepancy betveen the rotor disk load obtained f r m t'he w i n d - t m e l balance aod t k t obtained Trom integrated pressure data. The difference is less than 2 percent a t p = 0.10, 0.15, and 0.20 but varies fron 6 t o 11 percent a t the other iAzee t ip-speed ratios. Tnis difference i s simi- l a r t o that ~ s c u s s e d i n reference 6, i n t h t the integrated pressme l i f t is always less than the t-mel-balance l i f t for the th rus t coef f ic ien ts covered i n this t e s t . The t-mnel-balance L i f t was usea i n performaace calculations.
Figure 4(e) presents e comparison of the measured ro tor power required with that calculated fron references 1, 10, acd 11. Tie shapes of the Eeasured and theoretical curves are similar an5 the magnitudes agree fa i r ly w e l l , a mxhm difference of about 8 percent occurring a t = 0.15.
Figure k (b ) presents a comparison of the blade flapging ar?gles =ea- sured a t the rotor hub with the calculated vzlues of reference 1. The longitudinal flzpping a1 shows fair agreemnt. For m mconed teetering rotor, as used i n this t e s t , with uniform inflow, theory predicts no leteral flzpping bl, whereas the measu_rements shov an eppreciable value. A longitudinal variation in induced velocity, as dlscussed i n reference 12, o r blade bendi34 would groduce some lateral flapping.
No higher harmollics of blade flapgig4 were measured greater than 0 .lo, which is within the accuracy of the rneaswirg equipmeEt.
Sectlon Aerodynanic Loading
Chordvise loa6ing diszr ibut ion.- Figce 5 presents saaple chordwise loading distribztions obtained a t z t ip-sgeed ratio of 0.29 for severa l azimuth positions. The clj_rves, i n general, are similar to those thzt would be expected from tvc-W!!ensional tests or theory, with the exceptior- of r/R = 0.95. Here, over the rear p a r t of the disk, the lo&ding on the rear portio= of tiie chord becones negative. In refereace 6 (s ta t ic- thnust r e sd . t s ) a similm e f fec t w a s noted i n that the treiling-edge loading a t ./E? = 0.95 was lower th&n two-dimensional d ~ t a would show. This lower

8 __ NACA RM ~56107
value of loading was attribzted t o a p s s i ' o l e spenwise boundary-layer growth h e t o rotat ion which added to the exgected reduction in lift, due to t ip e f fec ts . S ince re fe rence 4 bas been pblished, two-dimensional t e s t s of t'ne instrunented rotor blafie h v e been nade i n t h e Langley low- turbdence 3ressure tunnel. Figure 6 shows some serople results from these tests. Figure 6, which is siIliilar to f i g w e 7 of reference 6, conpares the measured chordvise loaclira i n s t a t i c t-r lrust with the meas-cred two- CiiEensioml data and theoretical loadings. A t r / R = 0.75 (f ig . 6( a ) ), which i s representative of inboard stations, good agreement between t i e three loading distributions indicates t b 2 t approxhately tvo-dimensional E o v e x i s t s i n t h F s region. For r / R = 0.95 ( f ig . 6 (b ) ) , the t v o - dimensional xeesurements egree very ve l1 with the calculated loading dis- t r ibut ion for the NACA 0012 proTile. Hozever, the trailing-edge Loadfng is considerzbly laver for the s ta t ic - thrus t tests, as discussed in reference 5 .
f lov e f fec t , a s imilar effect would be emected to be xost pronounced i n forward f l i g h t over the rear sortion of the rotcr Bisk where the forward- speed component xoilld add t o any radial flov present. Similzrly, over tile forwed ?ortion of the disk, the fortard-speed component, directed radially inboard, would teml t o minimize any rad ia l flow &ue t o rotat ion. This trend i s seen in f igwe 5(e) a t r / R = C.95.
i n orEer for tkis decreased trailing-edge loading to be a sgank-ise
The xain effect of S L C ~ a chorcwise loading clhange from two-dimensioml .r
rcsLLts yo-Lid be t o Intrc&uce a possible perFodic blase twist i n a torsion- a l ly f lex ib le ro tor 'clade, which might not be accomted for in design calcu- la t ions. KLthough it is believed t2ra-i the section lift clkrscter is t ics can be accxately obtained w i t k the present instrmentation, it is f e l t t ha t mare chor6vise sressure or i f ices , gar t icclar ly in t i e trailing-edge region, wo~l:l be required to detemine definitely the var ia t ion in sect ion pi tching noment x i t i azimAth.
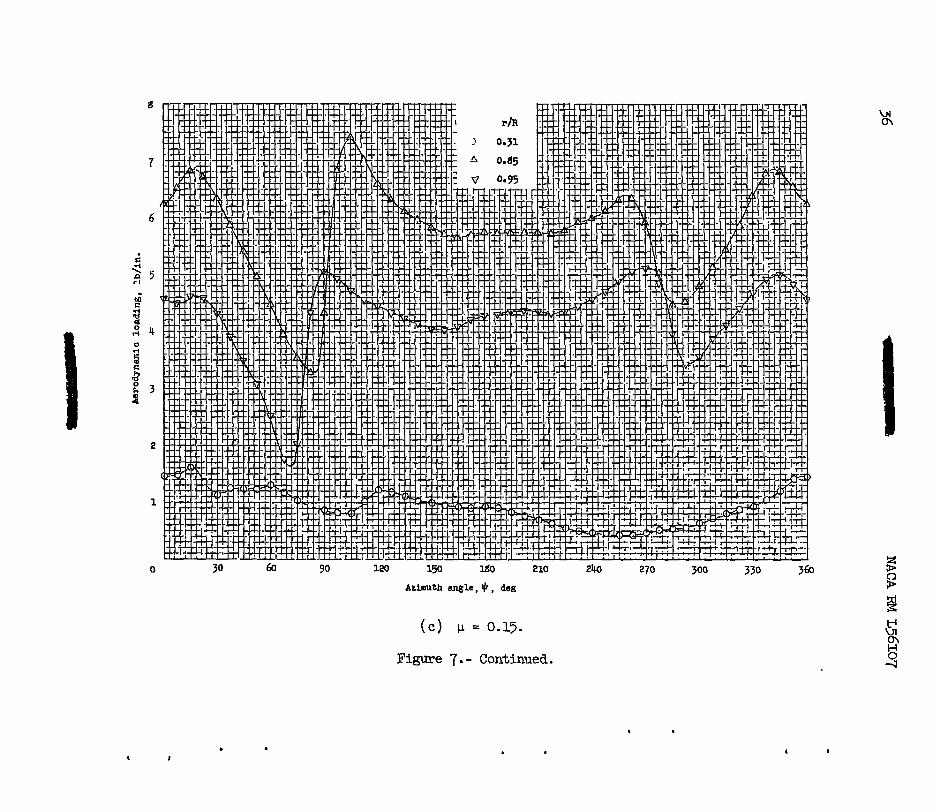
Variation of section aeroQnmic loadLng u i t h azimLth.- Figure 7 pre- ser-ts the var ia t icn i?- section aerodynamic ioading with azimuth for the f ive rzdial s t a t ions f c r a range of t is-speed ratios. As described in t he section entitled "Description of Equipment,, " the data a t r/R = 0.75 were caken txice. Both sets of data goints =re presented in order to give an Fndicetion of the repeatabi l i ty of the data.
- The rmiE e f f ec t s t o be noticed are the h&monic content 2nd the change .
i n shape of t i e c-wves vi th t i2-speed ra t io . Consider first the oufbozrd statcons (r/B = G.75, 0.85, and 0.95). A t a t ip-speed ratio of 0.08, ( f ig . 7(a)), w>ich corresponds t o a t rans i t ion conc%tion from hovering t o feTiar\?. f l ight ahere the inchced-velocity disspzetry is the greatest , the magnitEde of the loading veries by e factor of 3 t o 'I., with sharp gradients i n t f ie regicns of 90" and 27C* of az imth . Tne lerge grad5ents i n loading * s q g e s t a re la t ively large harr;zonic colltent in this f l ight condi t ion. A t a greater fsrward speed, u = 0.20 ( f ig . 7 ( d) ) , Yne magnitude of the loading II -

2D
- r
c
variztFon w i T I azin-dth h s decreased somewhat and the curves tend t o smooth out over the retreating portion of the rotor a s k .
At the highest tiy-sgeed ratio, p = 0.29, e value x-hich corresponds t o a higher cruising speed but is st i l l b e l o . stall, the inflow through the rotor i s =ore nearly unifom-because of the lerger component of for- w a r 6 sgeed. Tnis condition would suggest a less severe var ia t ion in l i f t , as the measured dats show i n f igure 7(f). PLthough the magnitude of loading variation i s st i l l of t'he same order as at p = 0.20 (Tig. 7(d) ) , it is now predonimntly first and second harmonk i n nature.
If the t ip-speed ratio were increased to a point where re t rez t ing blade s t a l l occurred, or if the forwsrd-speed ccmponent were an mpreciably grea te r par t or" the local dynamic pressure, higher harm-onic loading would probably be evidenced again. No such data were obtained i n the present tests, but these ct;nditions should be covered i n future investigations.
If t'ne inboard stations (r/R = 0.31 and 0.56) are considered next, an opgosite treed with t ip-speed ratio is noted from that seen ?or the out- bosrd stations. Inasmuch as the loca l blade l i f t 5s low at the inboard s ta t ions , par t icu lar ly a t r/R = 0.31, the induced velocity i s correspond- ir?gly low and the vzr iz t ion in sec t ion lift i s mainly due t o changes i n dynamic pressure, a t a relat ively constmt sect ion angle of a-ltack. TF-e local dynamic pressure can be emressed as
s i n -#
A t the lox< tig-speed ratios, u s i n @ i s small compared with the radius term End t'ne loca l dynamic pressme is minly due to ro ta t ion , End, thus, i s relztively constant. Therefore, the section l i f t i s a l so r e l a t ive ly constant with azimuth as in f igure 7(a). A t the bigher tip-speed ratios, the forward-speed congonent i s appreciable and results in a greater c'hange i n l i f t v i t h szimuth.
A t the higher forward speeds, the blade flzpsing increases because of the greater rotor infflow and introduces a l s g e r v a r i a t i o n in l i f t than changes i n local dynmic pressure alone woad produce, as seen i n f i g - ure 7(f).
In orCier t o i l l u s t r a t e t h e e f f e c t of the inclusion of bigher harmonic loadillgs having larger magnitudes than wodd be predicted by a s tandard theory Tor E uniform inflow (ref. 1), f igure 8 gives a corngarison of the measured va r i z t ion i n s ec t ion Loading w i t h azimuth a t r/R = 0.75 v i t h the variation FredLcted by theory. The theoretical curve has beec a6Jizsted t o give the sane average load as the measured data in each case.
I

10 I NACA REI ~56107
T1! blade section angle of attack for a teeter ing rotor can be expressed as in reference 1:
h + pal
- + p s i n y 3
% = e - a1 s i n $ + r
With t'ne assumption 03 uniform inflow and zero coning angle, h is con- stm-t fo r a given condition a d nc ia teral f lepping c r second harnonic blade motior, i s predicted. Tierefore, the longitudi2al flapping and the Local velocity mainly fieternice the variation i n Lift with szimuth. A t a lmd t ip-speed ra t io ( f ig . 8( a) ) wlhere the fla-gping E g l e i s small and the velocity relativeiy constant, the theoretical curve shows very l i t t l e change i n L i f t , wkereas the neas-=e& &"La incicate the greatest variation. A t the higher forward speeds, the theoretical cL-ve approaches the measured data, inasmuch as both ere predminantly second harmonic.
- 4
Ir2monic contel t of section loading.- The hamanic content of the mas-ued 6ata can be seen in figme 9, vhich ?resents the harmonic axpli- tudes, in bar-graGh f o r c , of the data of f igure 7. The &shed l ines denote repeated data goints a t r/R = 0.75. Inasmuch zs t i e v a r i a t i o n i n s e c t i o n l i f t i s periodic ir- nature, It can be represented in harmonic- ser ies form as
This ser ies i s equivalent t o t'ne more cormon Fourier series expansion of a haxoolic function
where
2, = JA,2+E,2
where and Bn &-e general Fourier series ccefficients.

NACA RM L56iO7 11
The r a t i o of the nth harmonic loading 2, to the steady compo- Eent lo, in percent , i s presented in f igure 9. The phase angles Fd, with respect to zero ezimuth are presented in table I1 for each hannonic. When the resalts of f igure 9 are interpreted, it should be noted that a l t h o q h th-e hamonic amplitudes are very lerge percentagewise for t'ne most inboard station, r/R = 0.31, t'ney represent e small force since the stea&y component i s very small. This i s par t icu lar ly t rue a t the high tip-speed r a t io s , where the steady load is nearly zero. However, this spanwise sta- tion could correspond to an antinoce position m d , therefore, could be important ir- a vibration analysis.
A t the low tip-speed ratios, e l l harmonics through the s i x t h , i n gen- eral, are appreciable and could be sources of v ibra t ion exc i ta t ion for the helicopter components. These vibrations end t'ne resul t ing fa t igue would be most inportant for the load-l i f ter tyye ol" helicopter which normally operates a t law tip-speed ratios. A t t ip-speed ratios above 0.2, the loading becones predominantly Tirst and seconfi harmonic, the higher har- monics being only 2 t o 5 percent of t l e average load, 8 s tn f igure g ( f ) , where p = 0.29. Even a t the high tip-speed ratios, however, i f some l igh t ly daxyed component of tAe helicoyter i s near resonance with a mul- t i p l e of rotor speed, a source of vibration is >resent frorn the higher harmonic air loads.
iieference 13, uhich is m- investigation of dynamic rotor-blade bending moments OII a f l igh t he l icopter , shows o vsr ia t ion in harmonic bentiipz-moment amplitudes w i t h t ip-speed ra t io similar to the var ia t ion i n blade loading indicated here.
During the deta-reduction process several hzrmonics hlgher than the f i r s t six prescated here were determined. Although some amplitude d is - to r t ion i s present above the s ix th harmonic, the response or" the system i s re la t ive ly flet to the tenth harmonic; i n t ' M s range, a11 harmonic loadings were apsreciably smaller in magnitude than the sixth.
A s discussed i n the sect ion ent i t led " k s t Procedure and Dnto. Reduction," the output of each pressure gage w a s reed a t 48 points per cycle T o r 10 cycles, and the corresponding points were averaged before the sectior_ loading and harmonic analyses were obtained. This method of analysis w a s done because some var ia t ion in ou tput fron? cycle to cycle could be seen from an inspection of the oscil logrash records. In order t o check the val idi ty of t h i s srocedwe and t o Oeterrnine xhether any variation i n harmonic colztent with time was present, an analysis was made of three IndivLdud cycles for r/R = 0.75 at p = 0.08 for both the origir_al and the check goints. Cycles 1, 5 , snd LO were Enalyzed for both conditions. Tne t h e i n t e r v z l between cycles considered was one-half sec- ond, and a9proxixately 10 seconds elapsed between or iginel and check points. An inspection of these results shoved that the percentage harmonic ampli- tudes bad a spread of +1 percent and the ph2se angles were within 215O.

12 NACA RM ~56107
Spanwise Loading Distribution
Tke spanvise loading distribution is given in f i gu re 10 for several azimuth positions a t three tip-speed ratios. Figure l O ( a ) i s f o r p = 0.08, a transition condition, where the greatest variation in sectior, loading with azimith was fowd ea r l i e r . This figure shovs tht tine s2anvise loading dis - t r ibut ion is also very irregwlar a t this condition. me loading curves tend t o smooth out with increasill-@; fomard speed, a r d at p = 0.29 ( f ig . lO(c)), where the ragnitude of the rotor indxced velocity is szall campared with the total inflow, the spanwise loading distribctians aore nearly resembl-e those neasured in s ta t ic t ? rus t , as g iven in re fe rence 6.
c
A coxparison of the data of figure 10 with the spznvise loadizl@; curves of reference 6 i n s t a t i c t h r u s t i n 6 i c a t e s that a greater tis loss i s evi- denced i n the famard-f l ight conat ion, as shorm by the re la t ive ly lower I
loading a t r/R = 0.95 cmpared with the xore inboard stations.
Althoagh the instantaneous spanwise loadhg d i s t r ibu t ions show a vari- a t ion with tig-speed ratio, it can be sho-vn that the steady-loading distri- bution is relatively constanz.
In f igure 11 the steady section loaiiing i s nondiniensionalized by 3
dividing by the average sparwise loading; Y'ht is, the quantity 10 is LO/R
plotted against r / R . Figure l l ( a ) for the present fomard-fl ight &at2 (for which <?ere was no r e t r ea t ing t i p stall) shows that the nondixensional steady-loading curves are constant within about LO percent for a range of tip-speed ratios 02 0.08 t o C.29 within a thrust-coefficient range of 0.00367 t o 0.00462. A similar curve i s shown in f i gu re l l (b ) for the s ta t ic - thrus t data of reference 6 covering a w i d e r range of thrust coeffi- cients from 0.00334 t o O.OOggg, a l l velues being below stall.
As discussed i n reference 6, the scanwise loading distribution near tne blade t ip i s e. function of thrust coefficient, because of t i p l o s s effects , which contribute to the scatter of the &ta at r/R = 0.95.
Tce section eerodynamic loading h s been calculated a t r / R = 0.75, a uniform induced velocity being assumed, for four thrust coeff ic ients bracketing the measured da.ta a t a tip-s.rseed r a t i o of 0.20. The result ing var ia t ion in l i f t with azimuth was harmonicelly analyzes, and the results ere presented i n table 111. The mglitudes are given in nondixensional fom, as i n f i gu re 9. me ghase angles are given ~ l s o . Tae t&ble indi- cates that t i e theoretical harzonic amplitudes, in percent of average load, are essentially constant with thrut coef f ic ien t in forward f l i g h t . The phase angles ere also approximately constant, the first and th i rd harmonics showing the largest variance, inasmuch as the magnitudes of loading are small with a corresponding ciecrease i n accuracy.

r
..
Therefore, until edditional experimental data are available, the nondinensional harmonic Loading given i n f i g u r e 9 might ten ta t ive ly be zpplied t o ro tor blades of sailar configuration a t different thrust coef- f i c i en t s . Soze discussion is given in reference 6 of methods of calculating t h e s p m i s e aerodynamic loading d i s t r ibu t ion in s ta t ic thrust which might be used e6 an approximetion t o t h e average forward-flight loading.
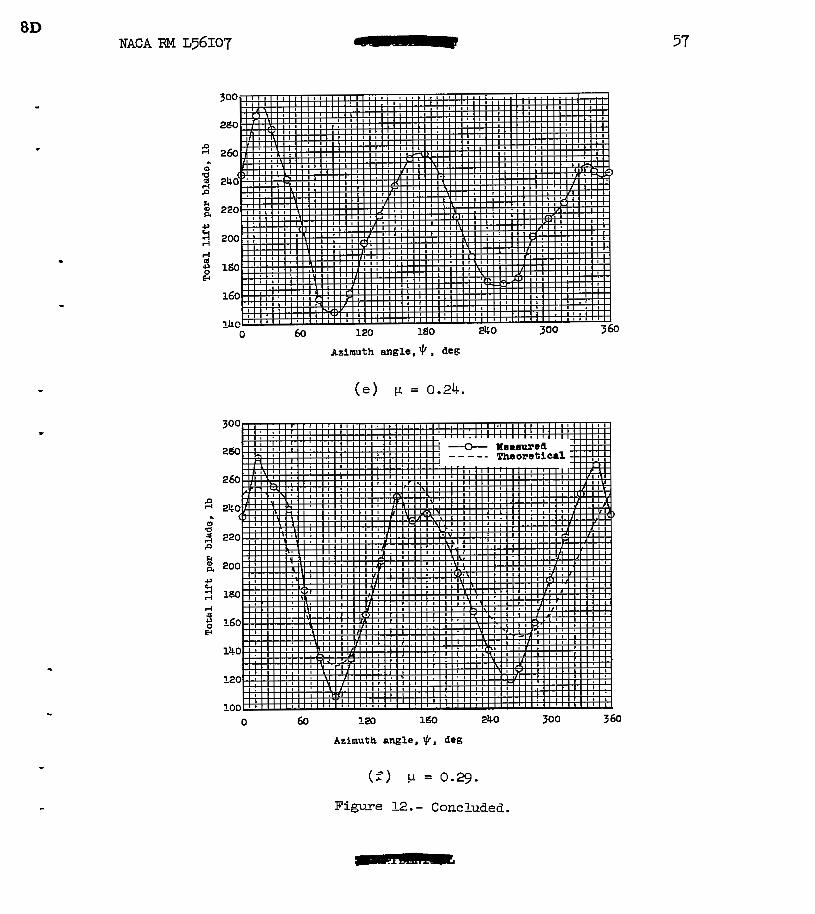
Total Blade L i f t
The spanwise loadiGg dis t r ibut ions a t 24 azimuth posit ions were in tegra ted to g ive to ta l blade lift which is plot ted agsinst azimuth i n figure 12 f o r e range of t ig-speed ratios. The chnge in shape of these curves with tip-speed ratio i s s imilar to the changes in the sect ion loading data es discussed previously. Tce higher hamonics sgain are most apgarent a t the low Tomard s p e e e and decrease with increasing tip-speed r a t i o t o a predominant second hamonic a t the high tip-speed ratios.
The theoretical blade l i f t due t o a unifom inflow is compared with t,he measured data in f i gu re 12 for t h e e tip-speed ratios. By the saxe reasoning discussed with the section loading date, a t IJ- = 0.08 the theory pred ic t s ve ry l i t t l e vz r i a t ion i n t o t a l l i f t with azimutll, vhere the mea- surexents indicate the greetest variation. A t p = 0.20 ( f ig . 12(d) ) , the theoretical amplitudes are approac'ning the meesurments, although the har- rnon5c content differs great ly and, a t p. = 0.29 ( f i g . 1 2 ( f ) ) , where the magnitude of the rotor induced flow i s small compared w i t ' ? t h e t o t a l inflow, the egreement between theory znd experiment i s fa i r ly c lose . The Ioeasured l i f t i s now predorninantly second harmonic, es the theory pred ic t s i n a11 cases, and the amplitudes of loading are of t i e same order or" magnitcde.
The re su l t s of a harmonic analysis of the ~ e z s u r e d t o t a l blade l i f t are given i n f i g u r e 13 and table IV. Figure 13 presents the harmonic Wli- tudes a s e Fercent of the steaiiy l i f t per blade, and table IV gives the corresponding phase angles. The var ia t ion i n hzrmonic content of t o t a l blade l i f t with t ip-speed ratio is seen to be less definite, except for the second harmonic, than was indicated for the section data.
The resu l t s of a harmonic analysis of the variation of theoretical blade lift with azimuth are given i n table V f o r a tip-speed ratio of 0.20 and tki-ree thrust coefficients bracketing the neasurexents. This table shows th&t i n forirard ?light the amplitudes of harmonLC loading, as a per- cent of the steady load, and the phase angles are essentially constant w i t h thzust coeff ic ient for t he t o t a l l i f t 2s ve l1 as the section lcading &is- cusseti ea r l i e r .
Figme 1 b presents the variation of root-mean-sqxare 'rarmonic ampli- tudes of to ta l b lace l i f t w i t h t he r a t i a of forward sgeed t o the momentum
t

14 - NACA RM ~56107
value of induced velocity in hovering. The root-mean-square amplitude is defined as d
This gu lantity may be thought of as an overall average k! tarmonic content of t o t a l blade l i f t . The root-mean-square amplitude appears t o peak a t a veloci ty ra t io of about 2, corresponding t o a t ip-speed ratio of about 0.1,- where the higher h m o n i c s predoroinate. The curve then decreases t o a min- inu2 a t about V/vo = 4 (a t ip-speed ratio of about 0.2) as the higher har-
c
monics decrease i n magnituc5e and increases thereaf ter to the highest for- war6 s.seed investigated as the second harmonic loading becomes increasingly larger.
The variation of aerodynmic moment about the flapping hinge with azimuth w&s deterxir-ea fo r one fl ight condition, p = 0.08. These data were harmonically amlyzea a36 shawed that there was no eppreciable first herxoEic aeroOynamic rnornent, as i s t o be expected for a rotor wi th a zero- offset f lapping hinge.
Zotor-Disk Lcad Distribction
.4n overal l vie%r of tine changes is rotor-disk load distribution w i t h for-gard speed can be seen i n figure 15 where section loading in pounds per inch is plot ted in contow form over the rotor disk , fo r e. range of tip-speed ra t ios . As with t i e data previously discussed, the contour loading shows the greatest nonunifcmity a t the lowest tip-speed ratio and becoroes rela- t ive ly smoother a t the high tip-speed ratios. The region of maximun; loading also ch-anges xith fom-arci speed, shif t ing f ro= the f ront to the rear of tine rotor j l s k w i t h increasing t ipspeed ra t io .
The sharp loadice; changes in the region of Oo ezb-uYi.1 in f i gu res 15(b), l 5 (c ) , and 15(d) may be a t t r ibutable to the effects of the wake of the rotor hub.
-
CONCLUSIONS
The r e sc l t s of an experimer,tal investigation of the chordwise and I
spanwise aerodynanic loading cHstriblrklon on a t.rro-blat5e untwisted teetering helicopter rotor biade in sixdated l e v e l f l i g h t f o r a renge of tip-speed
f
I,

r a t io s of 0.08 t o 0.29 a t a disk lcad of =bout 2.4 sounds per square foot h end a t i p speed of 480 f ee t pe r second lead to the folloving conclusions:
1. Tne chor&dse loasr -g dis t r ibut ions =re, i n general, conventional -m in appearence; however, E. Low or negative l o a d i r g on the rear por+ion of
the blade chord a t the 95-percent-radius s'ation is Tomd over the r e a r of the rotor S s k . This condition is posstbly caused by a spznwise boundary- layer growth due to ro ta t ion which adds t o the expected decrease6 loading due t o t i p e f f e c t s .
2. The vzriztion of section lmdi~x m d t o t s 1 blade l i f t w i t h azimuth - shows a muc'rl-larger-hamonFc content tiran a miform-inflow theory would gredict . The first snd second harmonics ten& to increase w i t h tip-speed r a t io , h-hereas the third t o sixth decrease for the rarse of tip-speed - rz t ios t es ted .
3 . Tne spanvise aerodpmnic loading distributiom &re i r r e g u l a r i n shzGe zt lov t is -speed rs t ios but become smoother a t iccreased forward speeds where the magrritude of the r o t o r i n h c e d flow i s smeller compared witin the to ta l inflow. -
4. Tce ncnclinensional spanwise losdicg is indicated to be re la t ive ly constant with thrust coeff ic ient em3 t ip-speed ratio; this result suggests the possibi l i ty of extendiag the present results to ro to r s os" similar con- f igura t ion a t other thrust coeff ic ients below s t a l l .
5 . The root-xean-sqmre hamonic mplitudes of t o t a l blade L i T t peak in the transit ion region, decrease sonewhat a t e ncderate cruise condition, and then increase agzirr t o the bighest forward speed covered in the tests.
6. The contows of loading over the rotor disk are slso found t o becoae more uniforn as t ip-speed ratio increases. Peak loading position s h i f t s frorn the f ront t o the reer of the disk with increasing tip-speed rakio . Langley Aeronautical Laboratory,
National Advisory Cormittee for Aeronautics, Langley Field, Va., August 3, 1956.

16
REFERENCES
NACA RM ~56107
1. Bailey, F. J., Jr.: A Sinlplified Theoretical Met'nod of Determining the Characterist ics of a L i f t i r g Rotor i n Forwzrd Flight. NACA Rep. 716, r 1941.
2. Gessow, Alfred, and C r i m , Almer D.: Ar- Extension of Lifting Rotor Theory To Cover Operation a t Large Angles of Attack and High Inflow Conditions. NACA TN 2562, 1952.
3. Castles, Welter, Jr., and DeLeew, Jacob H e n r i : The Normal Component of the Induced Velocity in the Vic in i ty of a Lift ing Rotor and Sone - 3xamples of Its Application. NACA Rep. 1184, 1954. (Supersedes NACA mT 2912. )
c
4. Heyson, Harry H., and Katzoff, S.: Normal Colrrponent of Indcced Velocity . In tW-Vt:Cinity of a Lif t ing Rotor With a Nonuniform Disk Loading. EACA mJ 3690, 1956. "
5 . Meyer, John R., Jr., aad Falabella, Gaetaco, Jr.: An Investigation of - the Experimental Aerodynamic Loading on EL Model Helicopter Rotor Blade. NACA mT 2953, 1953.
6. Rabbott, John P., Jr.: Stetie-Thrust Weasuremer-ts of the Aerodynamic Loadlng on e. Eelicopter Rotor B lack . NACA TN 3688, 1956.
7. Patterson, John L.: A Miniature Electrical Pressure Gage Uti l iz ing a Stretched Flat Ciaphragm. PTACA !IN 2659, 1952.
8. DeFrance, Smith J.: The N.A.C.A. Full-Scale Wind -el. NACA Rep. 459, 1933.
9. Silverstein, Abe, and a t z o f f , S.: Emerhental Invest igat ion of Wind- . W e 1 Interference on the Downwash BehinB an Airfoi l . NACA Rep. 609, 1937
10. h e r , Kenneth B., and Gustafson, F. B.: Charts for Estimation of Longitudinal-Stability Derivetives for e. Helicopter Rotor i n Forward Fl ight . NACA TN 2309, 1951.
11. Eziley, F. J., Jr., and Gustafson, F. B.: Charts for Estimation of the Chzracterist ics of a Helicopter Rotor i n Forward Flight. I - Trofi le *
Drag-Lift Ratio for Untxistec? Rectangular Blades. NACA WR L-110, lgick. (Forxerly NACA ACR L4HO7. )
12. Migotsky, Ewene: Full-Scale Investigetion of the Blade Notion of the PV-2 Helicopter Rotor. KACA TN 1521, 1948. -

3D NACA FM ~56107 - 1.7
13. Daughaday, H., and Kline, J.: An Approach to the Determination of Eigher Sarmonic Rotor Blade Stresses. Rep. No. CALL-52, Cornell Aero. Lab., Inc., Mar. 1953.

TABU I. - SUMMARY OF IWST CONDITIONS
Tip-speed ratio, p
0 .oo
.LO
9 15
.20
.24
29
Disk load lb/sq .rt I I Thrust coefficient
Balance data
2.20
2.44
2 . JI.1
2 . 'r'l 2 .y(
2 .4.4
Rotor pressure measurements
2.06
2.41
2.38
2.43
2.36
2.16
Balance d a b
0.00 393
.00446
.00487
. 00467
.00476
.0044.5
Hotor pressure measurements
0.00367
.0011-40
.00482
.00460
.001156
.00391c
* J
deg sq ft
-1.1 --- -1 .g
3.2 -9.8
3.1 -6.8
2.5 -4.0
2.8
-11.7 2.7

~
Tipspeed ratio, p 0
- 1 2
4 0.08 3
I
Phase angle, gn, deg, for station -
4 I 3
-29 -88 -72 -56 -129 -20
-1-77 31 174 -125
-46 -10
30 35
-143 -140 -111 -97
-160 38 48 -94 86 -44
73 31 91 149 3k 130
108 35 177 148 -162 78
-172 -1-3 -138 -108 -137 -95
7 k7 -73 101 19i -E
~ 2 6 27 64
-=9 -44 135
58 27 68 178 -41 32
64 30 82 175 -56 51
1-75 -3
-177 -106 184 -104
62 23 1-79 -10 3 -19 40
41 27 62 1-77 -87 28
3 (repeat )
-176 35 167 -114 22 -38
-161 36 85 -92 80 -33
32 26 64
-111 -39 134
73 22 66 i88 -30 26
62 29 83 169
46
46 28 73 171 -53 42
4 1 5
-157
61 64 -116 20 -168
-1l.h 60 -94 -107 82 -85
-149 10
-166
66 -78 51
-119 93 -72 -107 64 -68
~~
-85
‘1.5 55 -22 9 -90
154 93 -84 -101 -16 -65
19 -115 -7 8 44 52 152 99 -78 -74 -1-9 -76
-2 -35 15 52 141 96 144 88
-129 55 -47 -10
~~
18 48
-7 I 155

20 - NACA RM ~56107
TABLE 111.- HAKMONIC ANALYSIS O F THEOKETTCAL S E C T I O N LIFT
L
~~~
0.00223
00335
.00447
.0073k
0.007
.016
.010
.012
-82
TABU IV. - PHASE ANGIX FOR EACH FAYMONIC
ratio, deg deg
0.08 13 -1
.10 6 -2
-129
-108
-114
-166
27
-144 -
3

NACA RM ~56107 21
TABLE V. - HARMONIC AN!GYSIS O F THEORETICAL
T O T ! BLADE LIFT
= 0.20; OR = 482 ft/sec; f = 2.2 sq f q L
0.00223
. OOk47
.00761
~
Disk loadirrg , Lb/sq ft
1.24
2.47
4.20
0.023
.007
-004
0.144
.118
.125
180
180
180 - .024 I -90
.022 -go
0.028 -go

"
+"- 15.3'' "4 1 3 4 5
Chordwise x l c station
a 5 O . 1
Figure 1.- Blade layout showing location of premure orifices. Airfoil section, NACA 0012; rotor solidity, CI = 0.037.
I I

I 1 e 1
2-89201.1 Figure 2,- Detailed view of hub,
w nl

Figure 2. - Concluded.
I
4 I
I UI I? cn H
11 0

'* I I I
I I c
I - .
L-83264.2 Figure 3. - General view of model in Langley full-scale tunnel.
L" u1 r n I-I 0
, 4
I I

26
. 40r - . ”
0
(b) 3lade ~otions.
Tip-rpeed Patio, CI.
0
Figure 4. - Performance data.

q ._ ""- . ""_ .. . . -5" I
1 .
1 EKRATA NO. 2
NACA Reseszch Memorandum %si07
By John P. Rebbott, Jr., and Gary B. Churchill October 1956
Page 26: Replace figure 4 with corrected figure 4 attached. The error corrected is in the curve labeled b l in the lower plot (fig. k(b) ) .
Issued 12-6-57
Y I .

1 1 I 1 1 I I I 0 40 430 120
Vl¶looltg, ft/sec
(b) Blade motFoos.
Figure 4.- Perfo-rmance data.

I I I
2
a' 3 L!
3 *I
0 .2 .4 .6 .8 1.0 ._.-
1.0 rlC
.5
0
o .P . I I .G .I 1.0 XI0
1.5
1.0
.5
0
-5
1.5
1.0
.5
0
-3 0 .2 .It .6 .8 1.0
XI0
I
(a) r / ~ = 0.31. 1.5
1.0 1.0
.5 .5
0 a
4 -5
1.5 1.5
1.0 1.0
.5 .5
0 0
-3 0 .2 .4 .6 ,8 1.0 0 .2 .U .G -8 1.0
-3
xlc XI0
(b) r/R = 0.56.
1.0
.5
0
0 .2 .6 .LI 1.0
X l G
1.
.5
0
-5
1.0
.5
0
-.5 o .2 .II .b .a 1.0 w c
Figure 5. - Representative chordwise loading dislributions at several. azimuth positions. p = 0.29.

e‘
3.0
2.5
2.0
1.5
1.0
.5
0
2.5
2.0
1.5
1.0
.5
0
. ” -
-- ” 0 .2 .4 .b .8 1.0
( c ) r/R = 0.‘75.
Figure 5. - Continued.
I

"
I I # I 4 t
I 1
I (a), r /R = 0.85.
Figure 5 . - Continued.

0 .2 .4 .6 .S 1.0
d e
( e ) r/R = 0.93.
Figure 3. - Concluded.
0 2 .4 .6 .E 1.0 =IC
0 .2 .4 .6 .8 1.0
X / C
w 0
u I? cn H
4 0
I I
I

. r
.r4
3.5 -
3.5 - - --e-. Hovering t e s t s
e"" 'h-dimensional theory Two-diinensional t e s t s
(a) r / ~ = 0.75; = 0.3. (b) r[R = 0.93; cz = 0.26.
Figure 6.- Comparison of experimental hovering t e s t s , two-dimensional teszs, and theoretical chordwise loading at the same lift coeff Icient for two radial 1-oca.tions. For hovering
w I"
tests, rn = 496 ft/scc; e = 8.5'.

w N
(a) p = 0.08.

I I . I
I 0
I I
( a) Concluded.
Figure 7. - Con-Limed.
w w

I I
(a) 11 = 0.10.
Figure 7. - Continued.
I Ui I? o\ H
4 0

"_ I I
(b) Concluded.
Figure 7.- Continued. w u1
c1
I 1
( c ) p = 0.15.
Figure 7. - Continued.
I UI L" o\ H
"J 0

"
. I
e
I I
I E
Azimuth ~ ~ 1 0 , $, dog
( c ) Concluded.
Figure '7. - Continued.
I

I (a) p = 0.20.
Figure 7. - Continued.
I

(a) Concluded.
Figure 7. - Contimed.

9
I
7
6
5
4
3
2
1
0
-1
( c ) p = 0.24.
Figure 7 - Continued.
I Z
B

d f rl
k
2
".
1 I
0
Aalmutb angle, $, dog
(I?) Concluded.
Figure '7. - Cont inucd..
I

9
8
7
6
e
1
0
-1
-e
(f) p = 0.29.
Figure '7. - Continued. .

I I
I
(:r ) Concluded.
F f w c 7.- Concluded.
I w -F

44
$ 4 a rl
(a) cl = 0 . ~ 8 .
rl 0 2
3 f
Theoretical
(b) U = 0.20.
60 120 lg0 240 300 360
Azimuth angie, 6. de&
( c ) ' u. = 0.29.

100
1 2 3 4 5 6 1 2 3 4 5 6 1 2 3 4 5 6 1 2 3 4 5 6 r/H = 0.31 r/R = 0.75 r/R = 0.85 r /R = 0.95 2, = 0.77 2, = 2.1 2 0 = 3.26 2, = 5.49 2, = 4.51
(a) p = 0.08.
Figure 9.- Harmonic amplitude of section aerodynamic loading as percent of steady section load.

1 . 2 3 4 5 6 1 2 3 4 5 6 1 2 3 4 5 6 1 2 3 4 5 6 r /R = 0.31 r / R = 0.56 r/R = 0.75 r /R = &85 r/R = 0.95 z, = 0.90 ‘I, = 2.56 t o = 4.21 z o = 6.12 1, = 4.57
(b) p = 0.10.
Figure 9.- Continued.
I I
I
L
I I I

1 I a I I
I n
( c ) p = 0.15.
Figure 9. - Continued.

r /R = 0.31 r/R = 0.56 P/R = 0.85 . = 0.86 ‘1, = 2.69 I , = 6.25 2, = 3.9 Z E
(a) p = 0.20. 3! I? u Cn H 0 4
Figure 9. - Continued.
I 1
I
I
I I 1 I

Figurc 9. - Continued. \D -!=

n = 1 2 3 4 5 6 1 2 3 4 5 6 1 2 3 4 5 6 1 2 3 4 5 6 1 2 3 4 5 6 r/K = 0.31 r/R = 0.56 r /R = .0.75 r/R = 0.85 t o = 0.42 z, = 2.27 2, = 4.01 2, = 6.07 r'R 2, = = 3*9 0415
(f) p = 0.29.
Figure 9.- Concluded.
I I
I
I 1 I

I r , I
e .
. d
0
0 w n .5 1.0
8
6
4
2
0 0
8
6
4
2
0 .5 1.0
6
6
I,
2
( E L ) p = 0.08.
Spanwise aerodynamic load distribution at various azimuth positions

8
6
4
2
0 .5 1.0 F I R
0 .5 1.0
r/R
0 -5 1.0 r/n
I
0
8
6
0
E
6
u
2
0
8
6
4
2
.5 1.0 0 r/n
.5 1.0
r/R
.5 1 r/R
.5 1 .o rlil
H
Figure 10. - Continued.
I I I I I

I
1 I c 1
* I
1
10
(1
6
II
2
0
-2 0 .5
r/R
10
8
6
II
2
0 " -- P -I""
-2 0 .4
r/R 1.0
10
6
6
II
2
0
-2 0
r/R .5
6 I
6 6 6
4 I, u
2 2 2
0 0 0 0 0
10 10 10
I 8 8
6 6 6
I1 I, II
2 2 2
0 n 0 " ""-," 0 - ._I. /
." - "_ --I. -. ". "
"2 " 0 .5
1
1.0 0 -2 -2
.5 "._ -
1.0 0 .5 1.0 0 .5 1.0
r/R r/U r/n
-2 -
( c ) p = 0.29.
Figure 10. - Concl.uded.

"
( a) Porwc;rd fl ight. (b) Siatic t h r u s t (ref. 6 ) .
Figure 11. - Nondimennional spanwise aerodynamic loading d-istr,ibul;ion for several. static-thrust md forward-f light conditions.
I 1 I

55
(a) u = 0.08.
.
0 60 120 ld0 240 300 Azimuth engle, c , deg
(b) CL = 0.19.
Figure 12.- V ~ r i 2 t i 0 1 1 of t o t a l blade lift w i t h azhut lz.

N K A RM ~56107
300
280
260
240
220
2co
180
160
140
300
280
ff 260 ..
8 220 a
3 200 u
rl
140
8D NACA RM L56IO7
a
0 a P 4
57
0 60 I20 1go 240 30 0 3 60
Azimuth angle, $fs dag
(f) u = 0.29.
Figure 12.- Concludeii.

30
20
10
0 n =
(a) p = C.C8. (b) p = 9.10.
n - 1 2 3 4 5 6
( a ) CI = 0.20.
n = I e 3 4 5 6
(e) p = 0.24.
n - 1 2 3 4 5 6
(f) p = 0.29.
FigLlre 13.- Harmonic mplitude of t o t a l blade lift as percent of steady lift .

""
b I
20
10
0
1 1
2 4
V I V O
Figure 14.- Variation of rool-mean-square harmonic amplitude of t o t a l blade lift, as percent of steady l i f t , with velocity'ratio.

60
O0

61
O0

62
.

.
O0
Figure 15. - Continued.

.
= 0.24; a, = -9.8'; C T ~ = 0. ~0436 . Sh&ded are& aenotes reversed- velocity regio3.
Figure 13. - Contintzec?.
.

9D JWCA RM L56IO7
(f) p = 0.29; a = -lL.T0; CTr, = 0.005gk. ShaCied me& denotes reversed- &
velocity region.
Figure 19.- Concluded.
XACA - Langley FIeld, Va.