Embed Size (px)
Citation preview
Paula J. DempseyGlenn Research Center, Cleveland, Ohio
David G. Lewicki and Harry J. DeckerU.S. Army Research Laboratory, Glenn Research Center, Cleveland, Ohio
Transmission Bearing Damage DetectionUsing Decision Fusion Analysis
NASA/TM—2004-213382
November 2004
ARL–TR–3328U.S. ARMY
RESEARCH LABORATORY
https://ntrs.nasa.gov/search.jsp?R=20040191330 2018-06-27T07:34:03+00:00Z
The NASA STI Program Office . . . in Profile
Since its founding, NASA has been dedicated tothe advancement of aeronautics and spacescience. The NASA Scientific and TechnicalInformation (STI) Program Office plays a key partin helping NASA maintain this important role.
The NASA STI Program Office is operated byLangley Research Center, the Lead Center forNASA’s scientific and technical information. TheNASA STI Program Office provides access to theNASA STI Database, the largest collection ofaeronautical and space science STI in the world.The Program Office is also NASA’s institutionalmechanism for disseminating the results of itsresearch and development activities. These resultsare published by NASA in the NASA STI ReportSeries, which includes the following report types:
• TECHNICAL PUBLICATION. Reports ofcompleted research or a major significantphase of research that present the results ofNASA programs and include extensive dataor theoretical analysis. Includes compilationsof significant scientific and technical data andinformation deemed to be of continuingreference value. NASA’s counterpart of peer-reviewed formal professional papers buthas less stringent limitations on manuscriptlength and extent of graphic presentations.
• TECHNICAL MEMORANDUM. Scientificand technical findings that are preliminary orof specialized interest, e.g., quick releasereports, working papers, and bibliographiesthat contain minimal annotation. Does notcontain extensive analysis.
• CONTRACTOR REPORT. Scientific andtechnical findings by NASA-sponsoredcontractors and grantees.
• CONFERENCE PUBLICATION. Collectedpapers from scientific and technicalconferences, symposia, seminars, or othermeetings sponsored or cosponsored byNASA.
• SPECIAL PUBLICATION. Scientific,technical, or historical information fromNASA programs, projects, and missions,often concerned with subjects havingsubstantial public interest.
• TECHNICAL TRANSLATION. English-language translations of foreign scientificand technical material pertinent to NASA’smission.
Specialized services that complement the STIProgram Office’s diverse offerings includecreating custom thesauri, building customizeddatabases, organizing and publishing researchresults . . . even providing videos.
For more information about the NASA STIProgram Office, see the following:
• Access the NASA STI Program Home Pageat http://www.sti.nasa.gov
• E-mail your question via the Internet [email protected]
• Fax your question to the NASA AccessHelp Desk at 301–621–0134
• Telephone the NASA Access Help Desk at301–621–0390
• Write to: NASA Access Help Desk NASA Center for AeroSpace Information 7121 Standard Drive Hanover, MD 21076
Paula J. DempseyGlenn Research Center, Cleveland, Ohio
David G. Lewicki and Harry J. DeckerU.S. Army Research Laboratory, Glenn Research Center, Cleveland, Ohio
Transmission Bearing Damage DetectionUsing Decision Fusion Analysis
NASA/TM—2004-213382
November 2004
National Aeronautics andSpace Administration
Glenn Research Center
ARL–TR–3328U.S. ARMY
RESEARCH LABORATORY

Available from
NASA Center for Aerospace Information7121 Standard DriveHanover, MD 21076
National Technical Information Service5285 Port Royal RoadSpringfield, VA 22100
Available electronically at http://gltrs.grc.nasa.gov
Trade names or manufacturers’ names are used in this report foridentification only. This usage does not constitute an officialendorsement, either expressed or implied, by the National
Aeronautics and Space Administration.
NASA/TM—2004-213382 1
Transmission Bearing Damage Detection Using Decision Fusion Analysis
Paula J. Dempsey
National Aeronautics and Space Administration Glenn Research Center Cleveland, Ohio 44135
David G. Lewicki and Harry J. Decker
U.S. Army Research Laboratory Glenn Research Center Cleveland, Ohio 44135
ABSTRACT A diagnostic tool was developed for detecting fatigue damage to rolling element bearings in an OH-58 main rotor transmission. Two different monitoring technologies, oil debris analysis and vibration, were integrated using data fusion into a health monitoring system for detecting bearing surface fatigue pitting damage. This integrated system showed improved detection and decision-making capabilities as compared to using individual monitoring technologies. This diagnostic tool was evaluated by collecting vibration and oil debris data from tests performed in the NASA Glenn 500 hp Helicopter Transmission Test Stand. Data was collected during experiments performed in this test rig when two unanticipated bearing failures occurred. Results show that combining the vibration and oil debris measurement technologies improves the detection of pitting damage on spiral bevel gears duplex ball bearings and spiral bevel pinion triplex ball bearings in a main rotor transmission.
INTRODUCTION Helicopter transmission integrity is important to helicopter safety because helicopters depend on the power train for propulsion, lift, and flight maneuvering. In order to detect impending transmission failures, the ideal diagnostic tools used in the health monitoring system would provide real-time health monitoring of the transmission and would demonstrate a high level of reliable detection to minimize false alarms. Today’s helicopter health monitoring systems (HUMS) are not yet capable of real-time, on-line, health monitoring. Current data collected by HUMS is processed after the flight, and the health status reported is often plagued with high false alarm rates and undetected faults. The current fault detection rate of commercially available HUMS through vibration analysis is 70% (Larder (1999)). Often these systems are complex and require extensive interpretation by trained diagnosticians (Pouradier and Trouvé (2001)). The objective of this research was to integrate oil debris and vibration based gear damage detection techniques into a health monitoring system capable of detecting bearing pitting damage with improved detection and decision-making capabilities as compared to existing individual diagnostic tools.
NASA/TM—2004-213382 2
This hypothesis will be evaluated experimentally with vibration and oil debris data collected from tests performed in the NASA Glenn 500 hp Helicopter Transmission Test Stand. Vibration data was collected from accelerometers installed on the transmission housing. Oil debris data will be collected using a commercially available in-line oil debris sensor. Oil debris and vibration data will then be integrated using fuzzy logic and decision fusion analysis techniques. The goal of this research is to provide the end user with clear information on the health of the bearings.
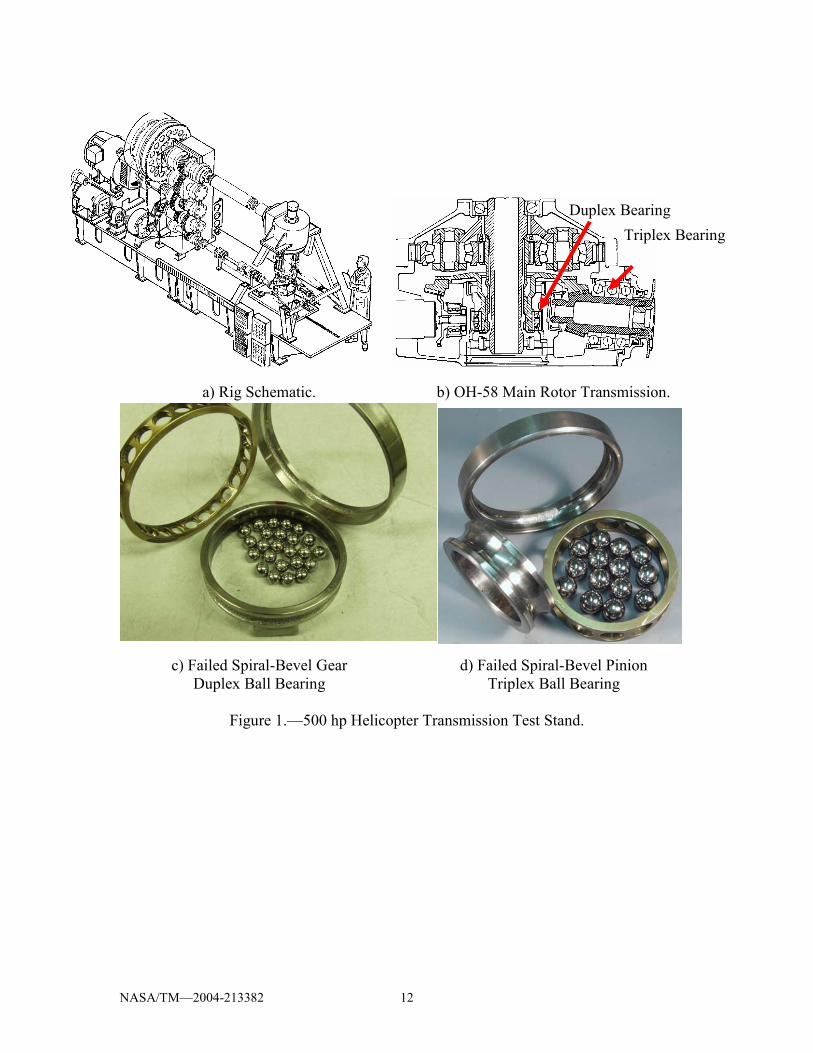
EXPERIMENTAL Experimental data were recorded from tests performed in the NASA Glenn 500 hp Helicopter Transmission Test Stand as shown in figure 1a and described in detail in reference (Lewicki (1987)). The test stand operates on the closed-loop or torque-regenerative principle. A 200 hp variable-speed direct-current (DC) motor powers the test stand and controls the speed. A 15 hp DC motor provides the torque in the closed loop through use of a magnetic particle clutch and differential gearbox. A mast shaft loading system in the test stand simulates rotor loads imposed on the test transmission output mast shaft. Two vertical load cylinders connected to a loading yoke produce lift loads. One horizontal load cylinder produces bending load. The test transmission was the OH-58 main rotor transmission (fig. 1b). The design maximum torque and speed for the OH-58A main-rotor transmission is 350 N-m input torque and 6060 rpm input speed (corresponding to 298 hp). The transmission is a two-stage reduction gearbox. The first stage is a spiral bevel gear set with a 19-tooth pinion that meshes with a 71-tooth gear. Triplex ball bearings and one roller bearing support the bevel-pinion shaft. Duplex ball bearings and one roller bearing support the bevel-gear shaft in an overhung configuration. A planetary mesh provides the second reduction stage. The bevel-gear shaft is splined to a sun gear shaft. The 27-tooth sun gear drives three or four 35-tooth planet gears, depending on the model. The planet gears mesh with a 99-tooth fixed ring gear splined to the transmission housing. Power is taken out through the planet carrier splined to the output mast shaft. The output shaft is supported on top by a split-inner-race ball bearing and on the bottom by a roller bearing. The overall reduction ratio of the main power train is 17.44:1. The unanticipated bearing failures under discussion in this paper failed during scheduled crack propagation tests. Details of these tests can be found in the following reference, (Decker and Lewicki (2003)). During these tests, the test transmission was run at 6060 rpm input speed and various levels of torque (280 to 525 N-m) with the goal of initiating and detecting a pinion tooth crack and detecting the crack with vibration based algorithms.
NASA/TM—2004-213382 3
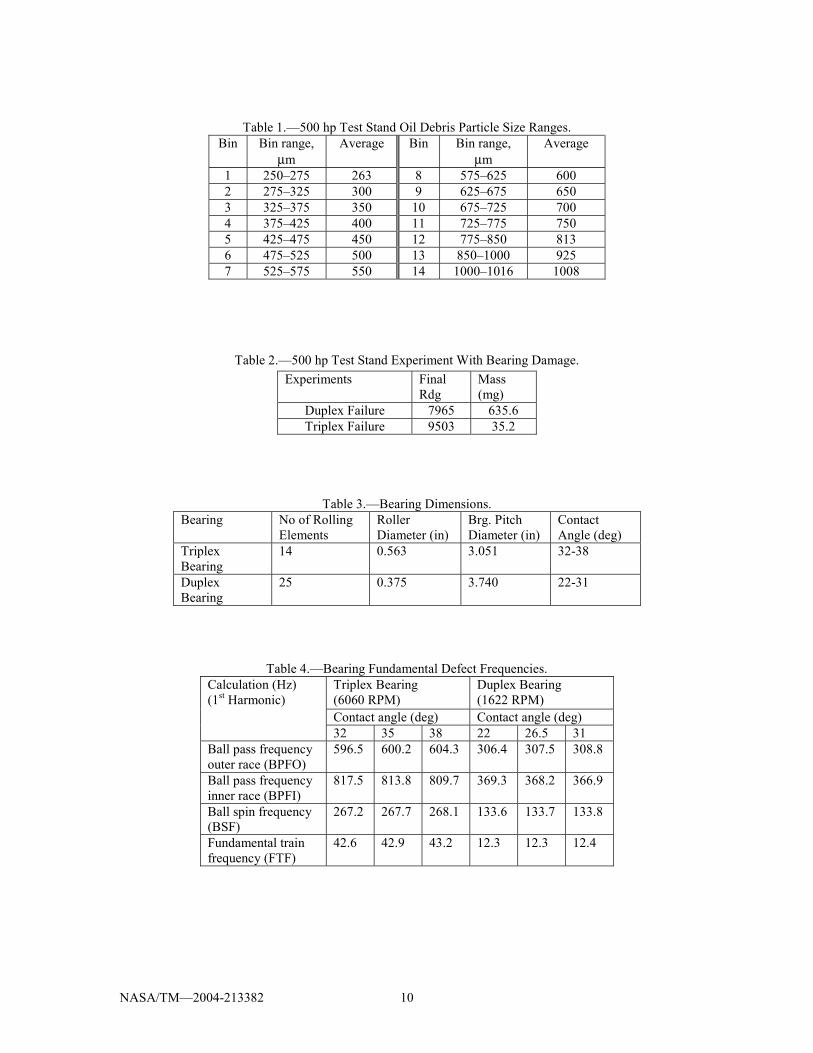
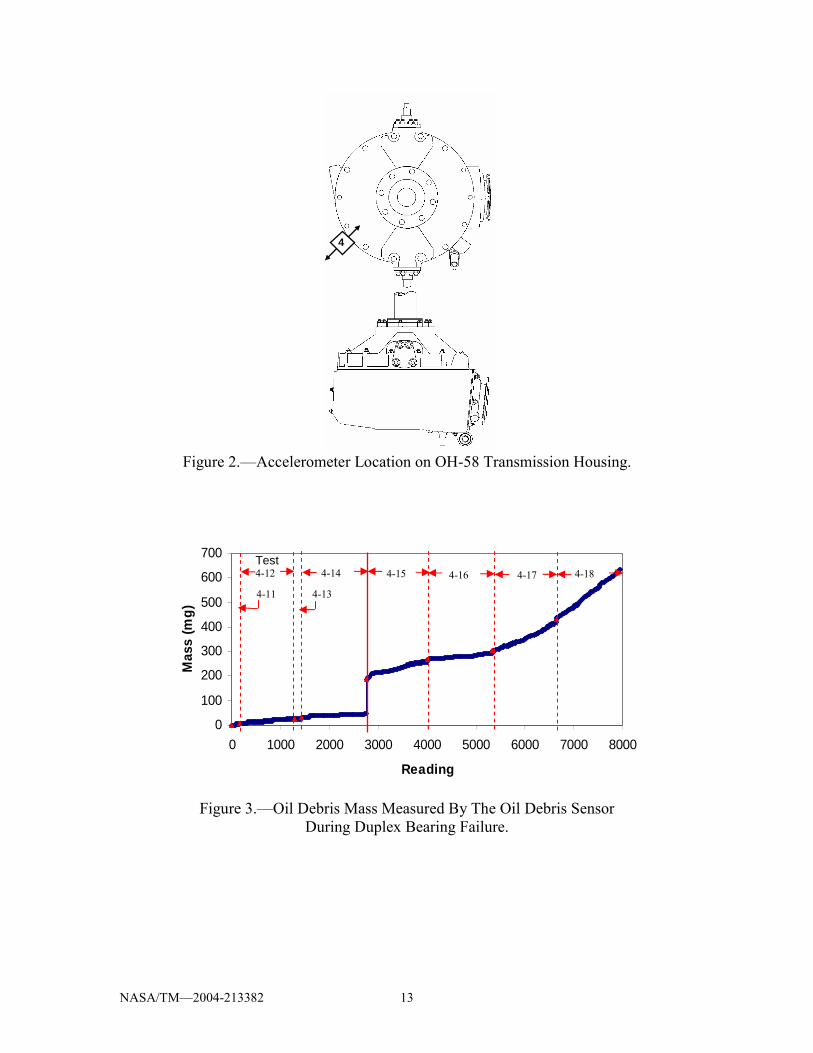
Vibration data was collected from accelerometers located on the transmission housing as shown in figure 2. For this analysis, only accelerometer A4 was used due to its proximity to the failed bearings. Torque was measured by a commercially available torque meter connected to the input shaft loop. Oil debris data were collected every 15 seconds with a commercially available oil debris sensor that measures the change in a magnetic field caused by passage of a metal particle. The amplitude of the sensor output signal is proportional to the particle mass. The sensor counts the number of particles, their approximate size based on user defined particle size ranges, and calculates an accumulated mass (Howe, B.; and Muir, D. (1998)). Fourteen size ranges were measured, with the smallest particle detected equal to 250 microns. Table 1 lists the 14 particle size ranges and the average particle size used to calculate accumulated mass. After 33 hours of run time with data collection the transmission was disassembled, due to excessive chip detection indication and debris on the chip detector, and a spalled spiral-bevel gear duplex ball bearing was found (fig. 1c). A new bearing was installed and the transmission was cleaned and re-assembled. After an additional 39 hours of run time, the transmission was disassembled and a spalled spiral-bevel pinion triplex ball bearing was found (fig. 1d).
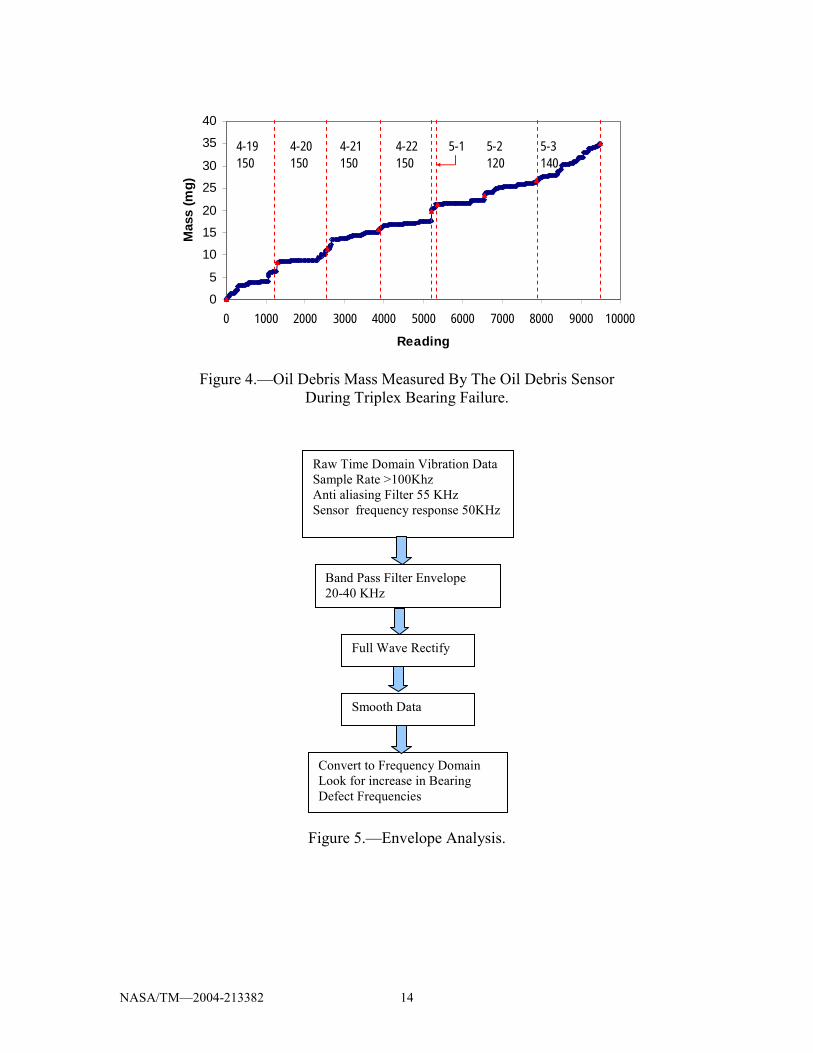
RESULTS AND DISCUSSION The bearings failed during 2 separate sets of experiments performed in the 500 hp Helicopter Transmission Test Stand. Since this was an unanticipated bearing failure, damage progression data is unavailable. Table 2 lists the total number of readings for each experiment and the amount of wear debris measured by the oil debris sensor at test completion. Table 3 identifies the dimensions of both bearings. Note the accumulated mass as detected from the oil debris sensor was reset to zero at the start of the test and after the duplex ball bearing failure. The oil debris accumulated mass measured by the oil debris sensor is shown in figure 3 for the duplex bearing failure. The dashed lines in figure 3 identify data sets that relate back to the crack propagation tests (Decker and Lewicki (2003)). Torque was at 150% during all of these tests. A spalled spiral-bevel gear duplex ball bearing was found at the end of data set 4-18. After reading 2755, a significant increase in accumulated debris occurred at reading number 2756. This also coincided with the test transmission chip detector indication of debris. At the end of the tests, over half of the bearing inner race, over half of the outer race, and most of the balls were damaged (fig. 1c). A technique recommended by the manufacturer for setting oil debris mass alarm limits using an inductance type oil debris sensor is listed in the manufacturers catalog (MetalSCAN User’s Manual). This technique uses the bearing geometry to set an alarm threshold based on the total accumulated mass of the ferromagnetic debris, Malarm, as calculated in equation 1 below. This mass alarm limit is based on outer race damage, in which the outer race spall angle is large enough to allow 2 balls in the damaged portion at the same time.
NASA/TM—2004-213382 4
ddb
alarm BPN
KM 360= (1)
The K factor was obtained experimentally by the sensor manufacturer based on data collected from over 40 bearing failures (MetalSCAN User’s Manual). A K factor of 4.47 for single row ball bearings was used for this application. A mass alarm value of 90 mg was calculated for the duplex bearing. This value coincides with the solid line shown on figure 3, where the mass showed a significant increase at the start of data set 4-15, reading 2756. The manufacturer also provides a method to calculate mass warning, 0.1 times the mass alarm, to indicate initial spall development. This level, 9 mg, was reached at reading 225. Since the bearings were not inspected at this reading, the reliability of the warning cannot be correlated to a specific level of damage. A spalled spiral-bevel pinion triplex ball bearing was also found at the end of another set of experiments. The oil debris accumulated mass measured by the oil debris sensor is shown in figure 4 for the triplex bearing failure. The dashed lines in figure 4 also identify data sets that relate back to the crack propagation tests. Torque was 150% during the data sets 4-19 through 4-22, 120% for 5-1 and 5-2, and 140% for 5-3. A constant increase in debris occurred during this test. At the end of the test, a small portion of the outer bearing race was damaged (fig. 1d). A mass alarm value of 197 mg was calculated for the triplex bearing. This mass value was never achieved during testing. The manufacturer also indicates a mass warning value of 0.1 times the mass alarm, 19.7 mg. This level was reached at reading 5216. The oil debris sensor is located in the lubrication system downstream of the gears and bearings. Although the sensor may indicate a component is degrading due to an increase in oil debris mass caused by the generation of debris, it cannot indicate which component is failing. For this reason, multi-sensor data fusion is a technique that can be applied by combining oil debris data and vibration diagnostic tools to indicate pitting damage to the duplex and triplex bearings. Fusing vibration and oil debris measurement technologies has been shown to improve the detection of pitting damage on spiral bevel gears and spur as compared to using individual monitoring technologies (Dempsey (2002), Dempsey (2002)). Multisensor data fusion is a process similar to methods humans use to integrate data from multiple sources and senses to make decisions. In this process, data from multiple sensors are combined to perform inferences that are not possible from a single sensor. Sensor data can be fused from the raw data level, feature level, or decision level. Decision level fusion was chosen to integrate these features because this does not limit the fusion process to a specific feature. By performing fusion at the decision level, new features can be added to the system or different features can be used without changing the
Where: Nb = number of rolling elements Pd = bearing pitch diameter (in) Bd = rolling element diameter (in) K = constant for ball bearings (mg/deg in2)
NASA/TM—2004-213382 5
entire analysis. This allows the most flexibility when applying this process to other condition based systems since, in most cases, different sensors and post-processing methods are used. Vibration analysis requires identification of the cause of the vibration levels. In this system, both gears and bearings can dominate the vibration signals. The same accelerometers can be used to identify gear or bearing defects. This analysis will focus on bearing diagnostics because gear failures were not present during these experiments. Rolling element bearing fault frequencies are generated when a bearing begins to fatigue. These faults create periodic frequencies when the bearing rotates and are often referred to as fundamental defect frequencies (Crawford and Crawford 1992). The following bearing defect frequencies were calculated for the two bearings in the transmission that failed: Ball pass frequency outer race (BPFO); Ball pass frequency inner race (BPFI); Ball spin frequency (BSF); and Fundamental train frequency (FTF). Table 3 lists the bearing dimensions used to calculate the bearing characteristic frequencies. Table 4 lists the fundamental defect frequencies calculated for the duplex and triplex bearings from the following equations:
60
cos12
RPMPBN
BPFId
db ⋅⎟⎟⎠
⎞⎜⎜⎝
⎛+⋅= θ (2)
60
cos12
RPMPBN
BPFOd
db ⋅⎟⎟⎠
⎞⎜⎜⎝
⎛−⋅= θ (3)
( )60
cos12
22
RPMPB
BP
BSFd
d
d
d ⋅⎟⎟
⎠
⎞
⎜⎜
⎝
⎛⎟⎟⎠
⎞⎜⎜⎝
⎛−⋅= θ (4)
60
cos121 RPM
PB
FTFd
d ⋅⎟⎟⎠
⎞⎜⎜⎝
⎛−⋅= θ (5)
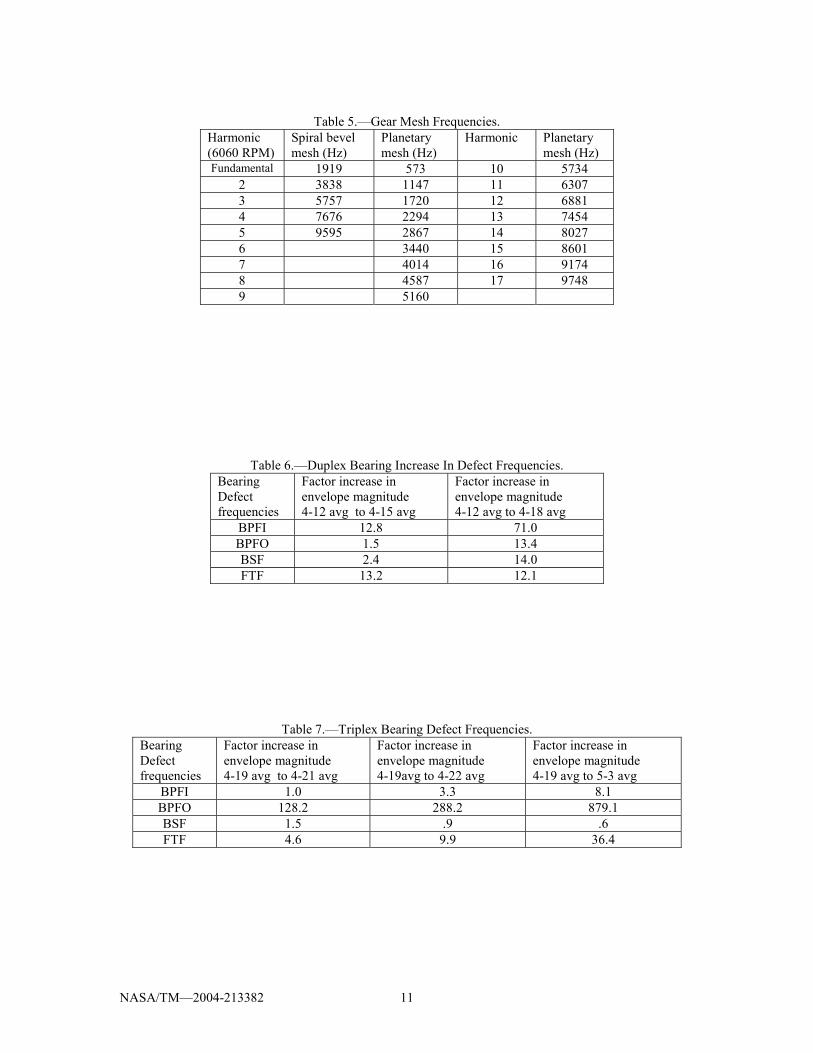
Several vibration based techniques exist for extracting bearing defect frequencies from vibration data. Howard (1994) provides an excellent overview of these diagnostic tools. Time domain, frequency domain, and envelope analysis techniques were considered for detecting the two bearing fatigue failures. However, when analyzing bearings in gearboxes, it is often difficult to extract the bearing defect frequencies due to the harmonics of the gear mesh frequencies that are present in the system as shown in Table 5. In general the vibration at the gear mesh frequencies are much greater than that at the bearing frequencies.
Where: Nb = Number of balls or rollers Bd = Ball or Roller diameter Pd = Bearing Pitch Diameter Ө = Contact angle
NASA/TM—2004-213382 6
One technique is to visually analyze the vibration signal in the time domain, looking for repetitive impacts that correspond to the rotation of the rolling elements past the race damage for each shaft revolution. Time domain statistical parameters such as RMS, peak, crest factor, and kurtosis can also be calculated for a sample of time domain data. Due to the dominant gear meshing frequencies in the time domain plots, this method was not feasible. Another technique, analyzing the vibration signal in the frequency domain uses an FFT to estimate the power spectrum of the discrete time signal. From the spectrum, characteristic bearing defect frequencies are identified, and the change in amplitude is used for trending. Related to this is a cepstrum analysis of the vibration data. Cepstrum analysis is the logarithmic power spectrum of the original power spectrum. The frequency spectrum is analyzed for frequencies that correspond to bearing defect frequency harmonics and sidebands. This method was also not practical due to the dominant gear meshing frequencies in the spectrum. The technique selected for this application was envelope analysis. This technique is based on the principle that each time a defect in a rolling element makes contact with another bearing surface, an impulse of vibration is generated. The bearing resonances are excited by these periodic impacts that correlate to the bearing defect frequencies. In order to apply this technique, the vibration data is bandpass filtered around a structural resonance. Next, a full wave rectification circuit is applied, followed by a smoothing circuit to recover the envelope signal. Then, the envelope signal is converted from the time domain to the frequency domain. The magnitude of the bearing defect frequencies is then plotted over the length of the test. A block diagram of the envelope analysis applied to the vibration data is shown in figure 5. The signal was bandpass filtered from 20-40 KHz because this range is dominated by structural resonances, not gear mesh frequencies (Howard 1994). The magnitude of the FFT for specific bearing defect frequencies was plotted at different intervals to determine if it increased significantly during the test.
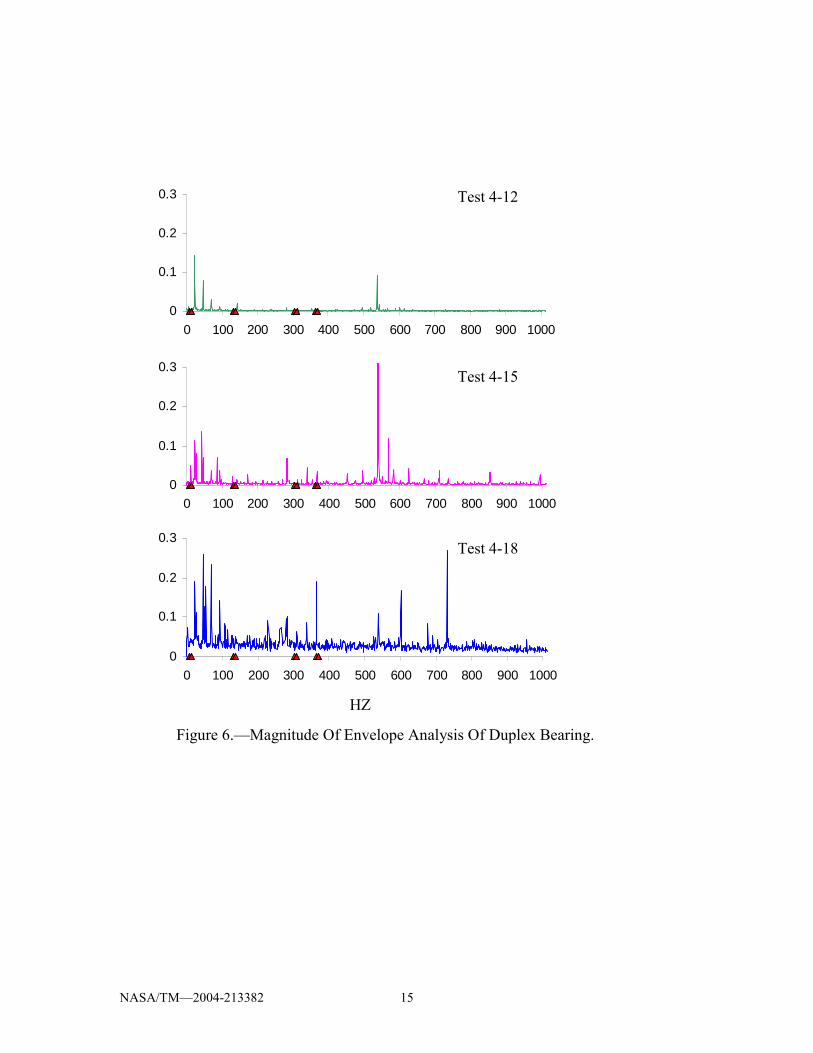
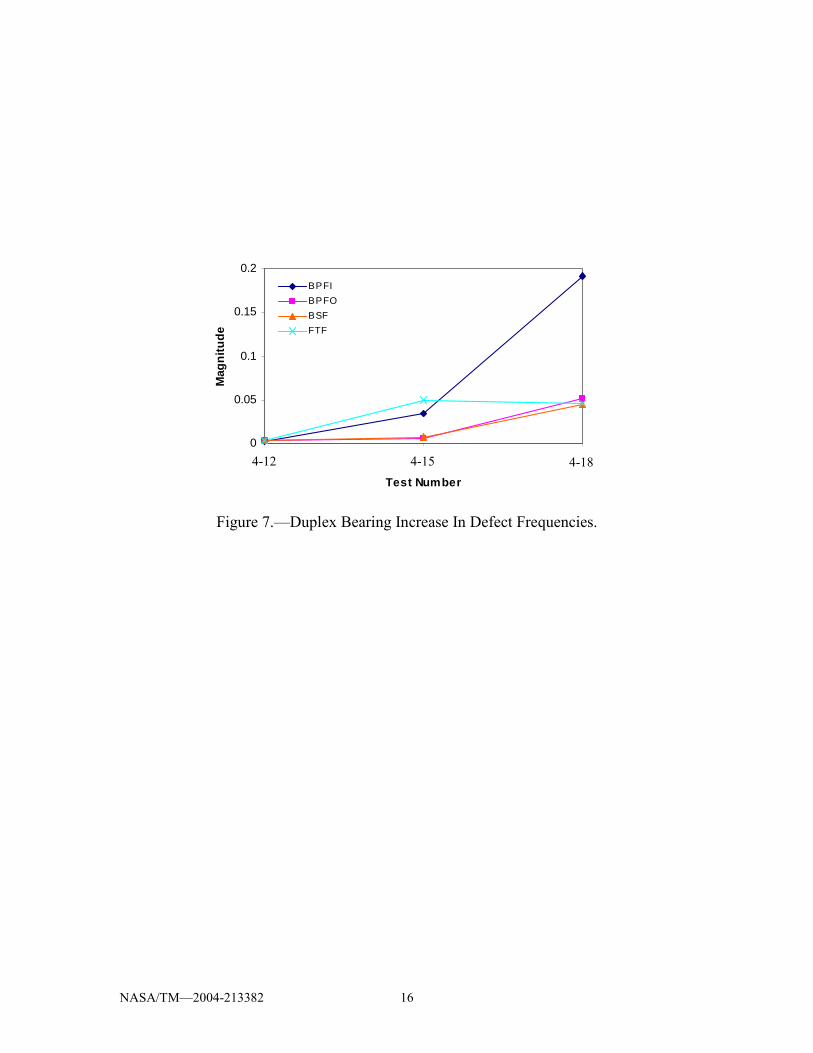
The enveloped spectrum data for the duplex bearing failure was analyzed and is plotted in figure 6. The data shown, 4-12 average, 4-15 average and 4-18 average was taken at 3 different times during testing. Referencing figure 3, average 4-12, is the average spectrum during readings 436-445, average 4-15 is the average for readings 3983-4002, and average 4-18 is the average for readings 7945-7959. Note the time between readings was approximately 15 seconds. For figures 6, the triangles on the X-axes indicate the duplex bearing defect median frequency listed in Table 4 + 3Hz to account for frequency bandwidth and varying contact angles. The magnitude at the defect frequencies plotted in figure 7 increased significantly from test 4-12 to 4-15 and 4-18. Table 6 lists the multiplication factor increase in the envelope magnitude of the bearing defect frequencies from test 4-12 to test 4-15 and from test 4-12 to test 4-18. All of the bearing defect frequencies showed a significant increase at test completion. Results of this analysis indicate an increase in magnitude at these frequencies can be used as a bearing damage diagnostic tool.
NASA/TM—2004-213382 7
The enveloped spectrum data for the triplex bearing failure was analyzed and is plotted in figure 8. The data shown, 4-19 average, 4-21 average 4-22 average, and 5-3 average was taken at 4 different times during testing. Referencing figure 4, average 4-19, is the average spectrum during readings 745-749, average 4-21 is the average for readings 3227-3231, average 4-22 is the average for readings 4532-4536, and average 5-3 is the average for readings 9339-9343. The triangles on the X-axis indicate triplex bearing defect frequencies listed in Table 3 + 3Hz for FTF and BSF, + 5Hz for BPFO and BPFI to account for frequency bandwidth and varying contact angles. The magnitude at the defect frequencies plotted in figure 9, increased significantly from test 4-12 to 4-15 and 4-18. Table 7 lists the multiplication factor increase in the envelope magnitude of the bearing defect frequencies from test 4-19 to tests 4-21, 4-22, and 5-3. All of the bearing defect frequencies showed a significant increase at test completion. Results of this analysis indicate an increase in magnitude at these frequencies can be used as a bearing damage diagnostic tool. It should also be noted that only outer race damage occurred during this test, and this feature showed the largest increase in magnitude. This feature also indicated the outer race bearing damage before the oil debris warning limit previously discussed. Due to the limited bearing failure progression data available, a theoretical framework of a data fusion model that can be used for transmission bearing damage detection will be discussed. Development of a reliable fuzzy logic model to indicate the health of a component requires sensor data collected from the bearing when it was known to be healthy, and when it was known to be damaged. A minimum of 16 experiments with at least 5 with or without damage is required to verify the data used to build the model reflects the actual process (Dempsey (2003)). During these two tests, the approximate time the bearing was damaged was unknown during testing. When the bearing was found damaged, it was removed. Bearing failure progression data is required when defining the membership functions for indicating bearing health. Because this data was unavailable, this is strictly a theoretical framework that will continue to be developed as additional bearing failure progression data becomes available. A theoretical framework of a data fusion model applied to transmission bearing damage detection is shown in figure 10. Envelope analysis is applied to the accelerometer installed on the transmission housing previously shown in figure 2. One important step in the data fusion process is the preprocessing of the sensor data to reduce the quantity of data and improve the quality of data prior to and during the feature extraction stage. An increase in the magnitude of the envelope data were used as the input into the fuzzy logic system. The accumulated mass threshold calculated from equation (1) is used as the feature for the oil debris sensor. The output is the state of the bearing. Fuzzy logic is a technique that can be used to identify the damage level on each feature and to perform the decision level fusion process on the features. Commercially available software is available to build the model, create and edit fuzzy inference systems, and provide a convenient method to map an input space to an output space (Fuzzy Logic Toolbox (1998)). The fuzzy system consists of fuzzy input/output variables, a set of fuzzy rules and a fuzzy inference method. The Mamdani type inference system was used for
NASA/TM—2004-213382 8
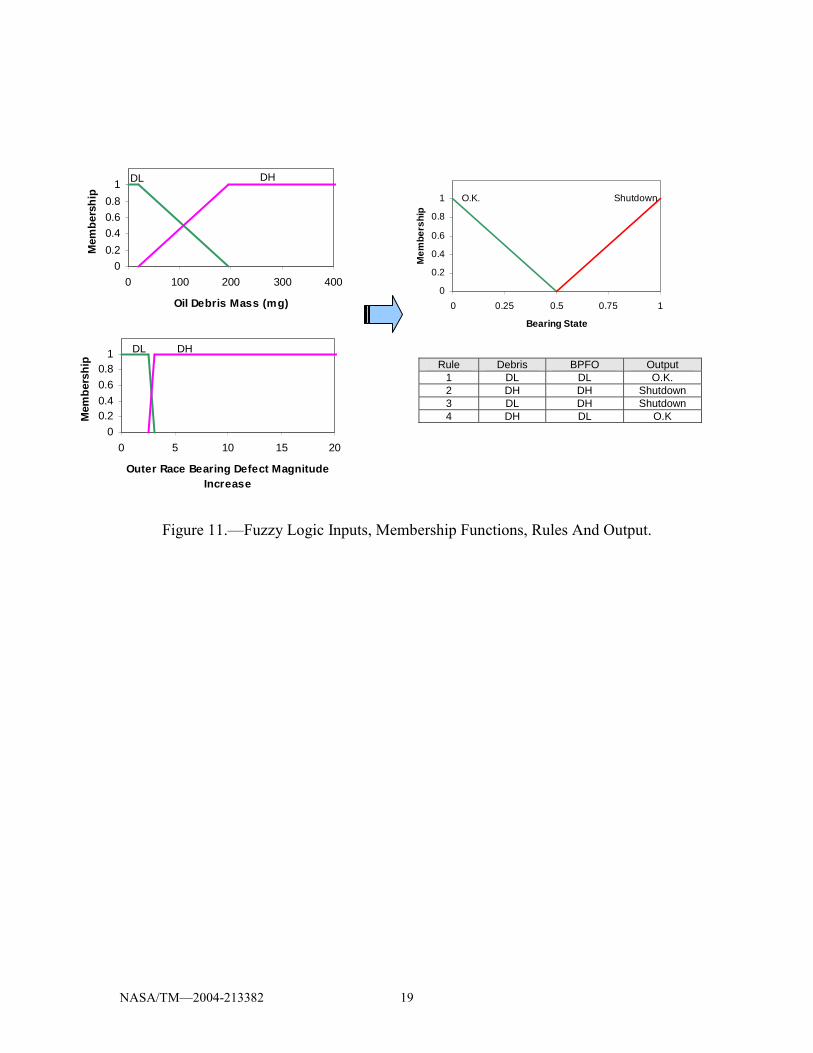
this application (Zadeh (1973)). The inputs were converted to degrees of membership, rules were defined and combined into a single fuzzy set, and then the fuzzy membership information was converted into a single output using the Mean of the Maximum (MOM) defuzzification method. The inputs are the damage detection features, the rules are defined based on the expertise of the diagnostician, and the outputs are the states of the bearings. The input space consists of level of damage indicated by the oil debris and vibration features. Membership functions for the features are defined as levels of damage. Levels of damage are damage low (DL) and damage high (DH). The two states of the bearings are O.K. (no damage) and Shutdown (damage). The steps required to apply this model to the triplex bearing will be discussed. The membership function for oil debris mass was defined using the mass warning and alarm limits (19.7, 197) calculated in equation 1. The membership function for the envelope magnitude was defined as an increase in envelope magnitude instead of using the absolute value of the magnitude. If this was on-line, new readings would be compared to previous readings to determine if the value increased by a predefined factor. Separate membership functions and rules could be identified for each type of failure such as inner race damage (BPFI), outer race damage (BPFO), or ball damage (BSF). This analysis will focus on the outer race damage, the only damage observed at test completion. Once the vibration feature exceeds a limit, the damage high (DH) level for this membership function does not change. The membership function limits were defined by calculating the increase in magnitude of the BPFO for the triplex bearing that was larger than the increase in magnitude for the BPFI, since the inner race did not indicate damage. Rules were defined based on the limited data. As more failure progression data becomes available, the membership functions will require modification. The output of the model is the health of the bearing outer race. The input membership functions, rules, and output membership functions are shown in figure 11. Based on this model, shutdown due to high damage would have been indicated during triplex experiment 4-21, reading 3231, shown on figure 4. However, as more data is obtained, the rules and membership functions will be modified to more reliably indicate bearing health.
CONCLUSIONS
An oil debris diagnostic tool was evaluated for detecting fatigue damage to bearings from tests performed in the NASA Glenn 500 hp Transmission Test Stand. Based on this analysis, the following conclusions can be made.
1. Envelope analysis combined with oil debris analysis can identify a transmission bearing failure.
2. If the bearing diagnostic feature was on-line, it would have detected the triplex
race damage prior to the oil debris sensor.
NASA/TM—2004-213382 9
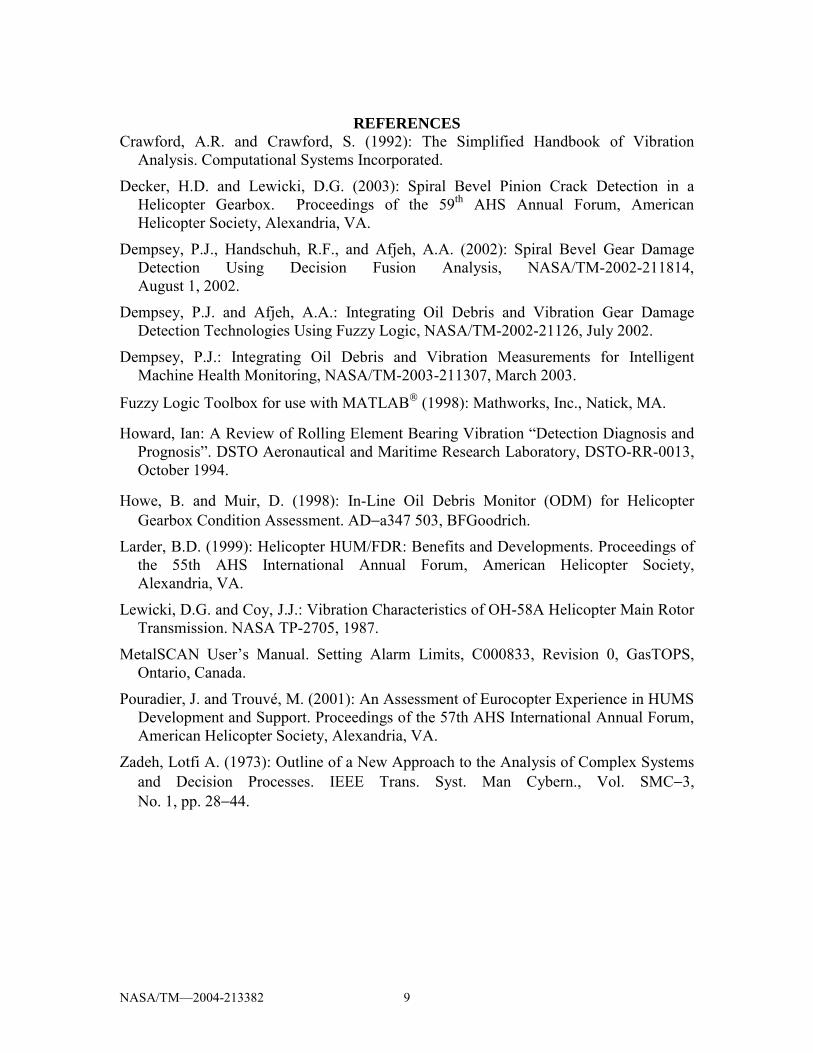
REFERENCES
Crawford, A.R. and Crawford, S. (1992): The Simplified Handbook of Vibration Analysis. Computational Systems Incorporated.
Decker, H.D. and Lewicki, D.G. (2003): Spiral Bevel Pinion Crack Detection in a Helicopter Gearbox. Proceedings of the 59th AHS Annual Forum, American Helicopter Society, Alexandria, VA.
Dempsey, P.J., Handschuh, R.F., and Afjeh, A.A. (2002): Spiral Bevel Gear Damage Detection Using Decision Fusion Analysis, NASA/TM-2002-211814, August 1, 2002.
Dempsey, P.J. and Afjeh, A.A.: Integrating Oil Debris and Vibration Gear Damage Detection Technologies Using Fuzzy Logic, NASA/TM-2002-21126, July 2002.
Dempsey, P.J.: Integrating Oil Debris and Vibration Measurements for Intelligent Machine Health Monitoring, NASA/TM-2003-211307, March 2003.
Fuzzy Logic Toolbox for use with MATLAB® (1998): Mathworks, Inc., Natick, MA. Howard, Ian: A Review of Rolling Element Bearing Vibration “Detection Diagnosis and
Prognosis”. DSTO Aeronautical and Maritime Research Laboratory, DSTO-RR-0013, October 1994.
Howe, B. and Muir, D. (1998): In-Line Oil Debris Monitor (ODM) for Helicopter
Gearbox Condition Assessment. AD−a347 503, BFGoodrich.
Larder, B.D. (1999): Helicopter HUM/FDR: Benefits and Developments. Proceedings of the 55th AHS International Annual Forum, American Helicopter Society, Alexandria, VA.
Lewicki, D.G. and Coy, J.J.: Vibration Characteristics of OH-58A Helicopter Main Rotor Transmission. NASA TP-2705, 1987.
MetalSCAN User’s Manual. Setting Alarm Limits, C000833, Revision 0, GasTOPS, Ontario, Canada.
Pouradier, J. and Trouvé, M. (2001): An Assessment of Eurocopter Experience in HUMS Development and Support. Proceedings of the 57th AHS International Annual Forum, American Helicopter Society, Alexandria, VA.
Zadeh, Lotfi A. (1973): Outline of a New Approach to the Analysis of Complex Systems and Decision Processes. IEEE Trans. Syst. Man Cybern., Vol. SMC−3, No. 1, pp. 28−44.
NASA/TM—2004-213382 10
Table 2.—500 hp Test Stand Experiment With Bearing Damage.
Table 3.—Bearing Dimensions. Bearing No of Rolling
Elements Roller Diameter (in)
Brg. Pitch Diameter (in)
Contact Angle (deg)
Triplex Bearing
14 0.563 3.051 32-38
Duplex Bearing
25 0.375 3.740 22-31
Table 4.—Bearing Fundamental Defect Frequencies. Triplex Bearing (6060 RPM)
Duplex Bearing (1622 RPM)
Contact angle (deg) Contact angle (deg)
Calculation (Hz) (1st Harmonic)
32 35 38 22 26.5 31 Ball pass frequency outer race (BPFO)
596.5 600.2 604.3 306.4 307.5 308.8
Ball pass frequency inner race (BPFI)
817.5 813.8 809.7 369.3 368.2 366.9
Ball spin frequency (BSF)
267.2 267.7 268.1 133.6 133.7 133.8
Fundamental train frequency (FTF)
42.6 42.9 43.2 12.3 12.3 12.4
Table 1.—500 hp Test Stand Oil Debris Particle Size Ranges. Bin Bin range,
µm Average Bin Bin range,
µm Average
1 250–275 263 8 575–625 600 2 275–325 300 9 625–675 650 3 325–375 350 10 675–725 700 4 375–425 400 11 725–775 750 5 425–475 450 12 775–850 813 6 475–525 500 13 850–1000 925 7 525–575 550 14 1000–1016 1008
Experiments
Final Rdg
Mass (mg)
Duplex Failure 7965 635.6 Triplex Failure 9503 35.2
NASA/TM—2004-213382 11
Table 5.—Gear Mesh Frequencies.
Harmonic (6060 RPM)
Spiral bevel mesh (Hz)
Planetary mesh (Hz)
Harmonic
Planetary mesh (Hz)
Fundamental 1919 573 10 5734 2 3838 1147 11 6307 3 5757 1720 12 6881 4 7676 2294 13 7454 5 9595 2867 14 8027 6 3440 15 8601 7 4014 16 9174 8 4587 17 9748 9 5160
Table 6.—Duplex Bearing Increase In Defect Frequencies. Bearing Defect frequencies
Factor increase in envelope magnitude 4-12 avg to 4-15 avg
Factor increase in envelope magnitude 4-12 avg to 4-18 avg
BPFI 12.8 71.0 BPFO 1.5 13.4 BSF 2.4 14.0 FTF 13.2 12.1
Table 7.—Triplex Bearing Defect Frequencies. Bearing Defect frequencies
Factor increase in envelope magnitude 4-19 avg to 4-21 avg
Factor increase in envelope magnitude 4-19avg to 4-22 avg
Factor increase in envelope magnitude 4-19 avg to 5-3 avg
BPFI 1.0 3.3 8.1 BPFO 128.2 288.2 879.1 BSF 1.5 .9 .6 FTF 4.6 9.9 36.4
NASA/TM—2004-213382 12
Figure 1.—500 hp Helicopter Transmission Test Stand.
a) Rig Schematic. b) OH-58 Main Rotor Transmission.
c) Failed Spiral-Bevel Gear Duplex Ball Bearing
d) Failed Spiral-Bevel Pinion Triplex Ball Bearing
Triplex BearingDuplex Bearing
NASA/TM—2004-213382 13
Figure 2.—Accelerometer Location on OH-58 Transmission Housing.
Figure 3.—Oil Debris Mass Measured By The Oil Debris Sensor
During Duplex Bearing Failure.
0
100
200
300
400
500
600
700
0 1000 2000 3000 4000 5000 6000 7000 8000
Reading
Mas
s (m
g)
4-14 Test 4-12 4-15 4-16 4-17 4-18
4-134-11
4
NASA/TM—2004-213382 14
0
5
10
15
20
25
30
35
40
0 1000 2000 3000 4000 5000 6000 7000 8000 9000 10000
Reading
Mas
s (m
g)
4-19150
4-20150
4-21150
4-22150
5-1 5-2120
5-3140
Figure 4.—Oil Debris Mass Measured By The Oil Debris Sensor
During Triplex Bearing Failure.
Figure 5.—Envelope Analysis.
Raw Time Domain Vibration Data Sample Rate >100Khz Anti aliasing Filter 55 KHz Sensor frequency response 50KHz
Band Pass Filter Envelope 20-40 KHz
Full Wave Rectify
Smooth Data
Convert to Frequency Domain Look for increase in Bearing Defect Frequencies
NASA/TM—2004-213382 15
0
0.1
0.2
0.3
0 100 200 300 400 500 600 700 800 900 1000
0
0.1
0.2
0.3
0 100 200 300 400 500 600 700 800 900 1000
0
0.1
0.2
0.3
0 100 200 300 400 500 600 700 800 900 1000
Test 4-12
Test 4-15
Test 4-18
HZ
Figure 6.—Magnitude Of Envelope Analysis Of Duplex Bearing.
NASA/TM—2004-213382 16
0
0.05
0.1
0.15
0.2
1 2 3
Test Number
Mag
nitu
de
BPFIBPFOBSFFTF
Figure 7.—Duplex Bearing Increase In Defect Frequencies.
4-12 4-15 4-18

NASA/TM—2004-213382 17
0
1
2
3
0 500 1000 1500 2000 2500 3000 3500 4000
0
2
4
6
0 500 1000 1500 2000 2500 3000 3500 4000
0
2
4
6
0 500 1000 1500 2000 2500 3000 3500 4000
0
6
12
18
0 500 1000 1500 2000 2500 3000 3500 4000
HZ
Test 4-19
Test 4-21
Test 4-22
Test 5-3
Figure 8.—Magnitude Of Envelope Analysis Of Triplex Bearing.

NASA/TM—2004-213382 18
0
5
10
15
20
1 2 3 4
Test Number
Mag
nitu
de
BPFIBPFOBSFFTF
Figure 9.—Triplex Bearing Increase In Defect Frequencies.
Figure 10.—Data Fusion Model.
4-19 4-21 4-22 5-3
Sensor Feature Extraction
Identity Declaration
Oil Debris Sensor
Accel. Envelope Magnitude
Mass(mg)
Fuzzy Logic
Fuzzy Logic
Decision Level Fusion
Bearing State
Decision Fusion
NASA/TM—2004-213382 19
Figure 11.—Fuzzy Logic Inputs, Membership Functions, Rules And Output.
Rule Debris BPFO Output 1 DL DL O.K. 2 DH DH Shutdown 3 DL DH Shutdown 4 DH DL O.K
0
0.2
0.4
0.6
0.8
1
0 0.25 0.5 0.75 1
Bearing State
Mem
bers
hip
O.K. Shutdown
00.20.40.60.8
11.2
0 5 10 15 20
Outer Race Bearing Defect Magnitude Increase
Mem
bers
hip
00.20.40.60.8
11.2
0 100 200 300 400
Oil Debris Mass (mg)
Mem
bers
hip
DL DH
DL DH

This publication is available from the NASA Center for AeroSpace Information, 301–621–0390.
REPORT DOCUMENTATION PAGE
2. REPORT DATE
19. SECURITY CLASSIFICATION OF ABSTRACT
18. SECURITY CLASSIFICATION OF THIS PAGE
Public reporting burden for this collection of information is estimated to average 1 hour per response, including the time for reviewing instructions, searching existing data sources,gathering and maintaining the data needed, and completing and reviewing the collection of information. Send comments regarding this burden estimate or any other aspect of thiscollection of information, including suggestions for reducing this burden, to Washington Headquarters Services, Directorate for Information Operations and Reports, 1215 JeffersonDavis Highway, Suite 1204, Arlington, VA 22202-4302, and to the Office of Management and Budget, Paperwork Reduction Project (0704-0188), Washington, DC 20503.
NSN 7540-01-280-5500 Standard Form 298 (Rev. 2-89)Prescribed by ANSI Std. Z39-18298-102
Form ApprovedOMB No. 0704-0188
12b. DISTRIBUTION CODE
8. PERFORMING ORGANIZATION REPORT NUMBER
5. FUNDING NUMBERS
3. REPORT TYPE AND DATES COVERED
4. TITLE AND SUBTITLE
6. AUTHOR(S)
7. PERFORMING ORGANIZATION NAME(S) AND ADDRESS(ES)
11. SUPPLEMENTARY NOTES
12a. DISTRIBUTION/AVAILABILITY STATEMENT
13. ABSTRACT (Maximum 200 words)
14. SUBJECT TERMS
17. SECURITY CLASSIFICATION OF REPORT
16. PRICE CODE
15. NUMBER OF PAGES
20. LIMITATION OF ABSTRACT
Unclassified Unclassified
Technical Memorandum
Unclassified
1. AGENCY USE ONLY (Leave blank)
10. SPONSORING/MONITORING AGENCY REPORT NUMBER
9. SPONSORING/MONITORING AGENCY NAME(S) AND ADDRESS(ES)
National Aeronautics and Space AdministrationWashington, DC 20546–0001andU.S. Army Research LaboratoryAdelphi, Maryland 20783–1145
National Aeronautics and Space AdministrationJohn H. Glenn Research Center at Lewis FieldCleveland, Ohio 44135–3191
Available electronically at http://gltrs.grc.nasa.gov
November 2004
NASA TM—2004-213382ARL–TR–3328
E–14890
25
Transmission Bearing Damage Detection Using Decision Fusion Analysis
Paula J. Dempsey, David G. Lewicki, and Harry J. Decker
Diagnostics, Bearings, Vibration, Oil debris
Unclassified -UnlimitedSubject Category: 01 Distribution: Nonstandard
WBS–22–302–05–101L162211A47A
Paula J. Dempsey, NASA Glenn Research Center; David G. Lewicki and Harry J. Decker, U.S. Army Research Laboratory,NASA Glenn Research Center. Responsible person, Paula J. Dempsey, organization code 5950, 216–433–[email protected], [email protected], [email protected]
A diagnostic tool was developed for detecting fatigue damage to rolling element bearings in an OH-58 main rotortransmission. Two different monitoring technologies, oil debris analysis and vibration, were integrated using datafusion into a health monitoring system for detecting bearing surface fatigue pitting damage. This integrated systemshowed improved detection and decision-making capabilities as compared to using individual monitoring technologies.This diagnostic tool was evaluated by collecting vibration and oil debris data from tests performed in the NASA Glenn500 hp Helicopter Transmission Test Stand. Data was collected during experiments performed in this test rig when twounanticipated bearing failures occurred. Results show that combining the vibration and oil debris measurementtechnologies improves the detection of pitting damage on spiral bevel gears duplex ball bearings and spiral bevelpinion triplex ball bearings in a main rotor transmission.