Embed Size (px)
Citation preview
ISSN 0040-0378
Tea Research Foundation (Central Africa)
Quarterly Newsletter
April 1993 Table of Contents
1 Weather
2 Soil moisture ddicit
3 Crop yields
4 Comment
5 Notes and news
6 Fluid Bed Dryer monitoring and control
7 The drought: A review
Number 110
2
2
2
A.M. Whittle 3
3
S.J. Temple 4
B.Mhwaila 8
Not for publication in p r t or wholc without permission of the Director, Tea Research Fomdation (Central Africa)
TRFQNLll0 -2-
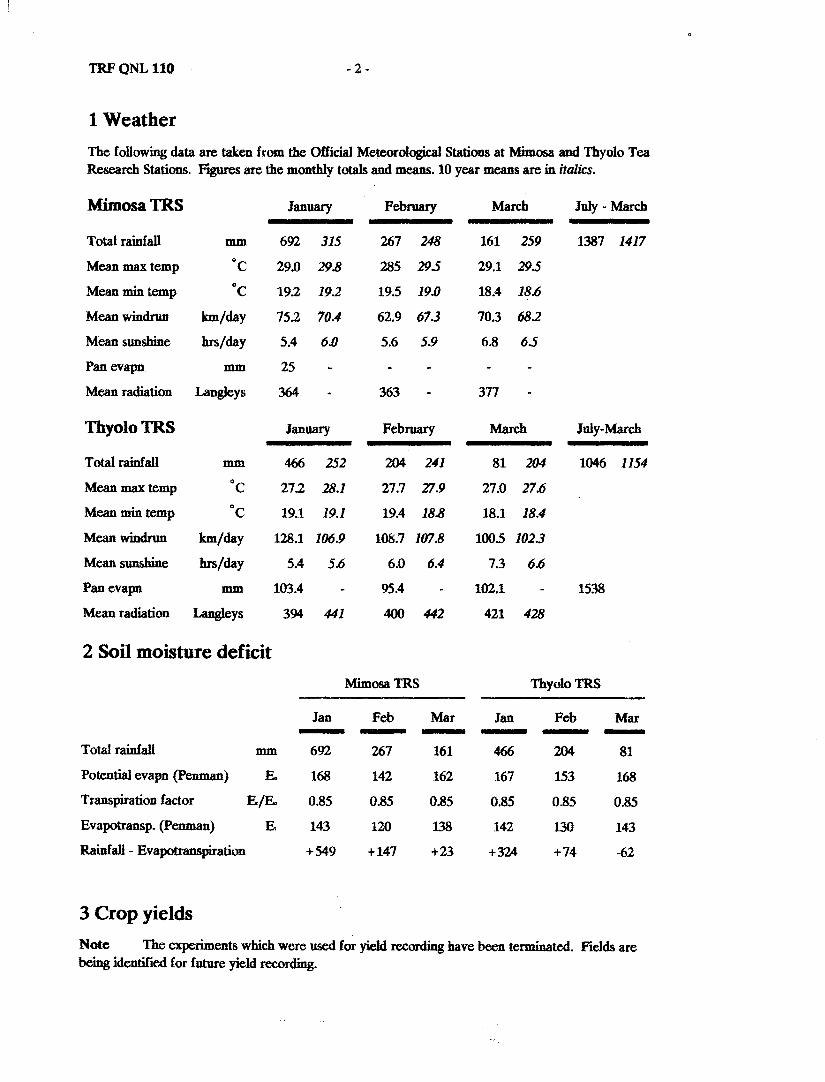
1 WeatherThe following data are taken from the Official Meteorological Stations at Mimosa and Thyolo TeaResearch Stations. F'tgUreSare the monthly totals and means. 10 year means are in italics.MimosaTRS
JanuaryFebruaryMarchJuly - March
Total rainfall
mm69231526724816125913871417
Mean max temp
°c29.029.828529.529.129.5
Mean min temp
°c19219.219.519.018.418.6
Mean windrun
km/day75.270.462.967.370.368.2
Mean sunshine
hrs/day5.46.0 5.65.9 6.86.5
Panevapn
mm25
Mean radiation
Langleys364363377
ThyoloTRS
JanuaryFebruaryMarchJuly-March
Total rainfall
mm466252204241 81204 10461154
Mean max temp
°c27228.127.727.927.027.6
Mean min temp
°c19.119.119.418.818.118.4
Mean windrun
kmfday128.1106.9108.7107.8100.5102.3
Mean sunshine
hrs/day5.45.66.06.4 7.36.6
Panevapn
mm103.4 95.4102.11538
Mean radiation
Langleys394441400442 421428
2 Soil moisture deficit Mimosa TRS
ThyoloTRS
Jan
FebMarJanFebMar-Total rainfallmm69226716146620481
Potential evapn (Penman)
Eo168142162167153168
Transpiration factor
BfB.0.850.850.850.850.850.85
Evapotransp. (Penman)
E.143120138142130143
Rainfall - Evapotranspiration
+549+147+23+324+74-62
3 Crop yields
Note The experiments which were used for yield recording have been terminated. Fields arebeing identified for future yield recording.
- 3 -
As is normal at this time of year, staff arepreparing for contributions to Field. Days with
the resul~ that papers for the QNL· tend to getheld over. ApolOgies are therefore in order forthe late circulation ohhis 'newsletter but we hopethat with the July edition we will be back onschedule.
We continue to remain short staffed and I must
thank staff, both senior and junior, for their
forbearance during this past, very busy season.During April we have welcomed Simon Wtlkieas the new Assistant Director (Research) andSimon's arrival should now enable us to press onwith, and implement, a revised work programme.A new T~l Committee has been
establish~with. industry representatives, toadvise on research dire.ctions; there seemed littlepoint in commencing the committee beforeSimon's arrival but it is now expected to meetshortly and to play a crucial role in researchplanning.
Presumably prompted by the recent droughtthere has recently been expressed a widespread
5 Notes and News
'fRFQNLllO
A.M. Whittle
interest in long-tenn weather forecasting. Oneinstitute with expertise in this field is theClimatology Unit at The University ofWitwatersrand. Though their forecasts are basedon global data, the detailed forecasts are currentlyrestricted to South Africa; this means that North
Transvaal is as close as we can get.
There is active interest in extending forecasts toneighbouring countries but the ,*-alue;wi1ldependon the data supplied. TRF is willing to act as a
"clearing house" for meteoro1~ data.going toWits and for dissemination of forecasts if alid
when they are issued; forecasts are normally notissued monthly but as circumstances dictate.Essentially, the data required are monthly rainfalltotals for as long as possible, the longer the better,to establish patterns; for these purposes twentyyears is considered virtually useless. Any estatewishing to assist with establishing the data can .send me the data either as a hard copy or disc,which will be returned. The value and accuracyof the service will in great part be dependent on
the coverage provided, so if estat~ could dig outtheir rainfall data it would be much. ~ppreqated.
Correction
A mistake crept into the typesetting of the articlein QNL 109, Table 1, where the headings forWater (kg) and Dry matter (kg) were transposed.Also in Table 2 the hea~ "70% wither" should
have covered the "Total Vfeight"column as wellas the following two columns.· ~pologies for anyconfusion caused.
SIT
Excerpts from a Tea Planters' Dictioury
Chemical withering - this process involves nochemicals and need not involve any withering
(q.v.). It is purely a biological process which ..occurs after leaf has been removed from the bush
but before theeeUs Mve been damaged by theLTP, stuffing into sacks and jumping on them, orany other process.
CooIiDg room - a room through which air isdrawn a.ndinto which water is sprayed. The airis cooled to exactly the same extent as it would
, be by passing it trough dhool. A breeding groundfor Legionnaires Disease.
Dhool _. green: mashed up lea leaf, whichgradually tUrns brown. If your wither (q.v.) istoo soft or too hard, it will end up looking like
TRFQNLll0 -4-
green paint or grass clippings. The one consistentquality of dbool is its magnetic attraction forfloors.
Fermentation - this is a process which is appliedto dbool (q.v.) wbere it is not fermented, butoxidized by enzymatic reactions. Fermentationis an anaerobic process which produces far moreinteresting beverages than tea.
Plnting -a fteld activity very rarely carried outby Tea Planters. One year's planting gives thirtyto a hundred years' plucking.
W'tthering - a process whicb occurs naturally ifit is given a chance, once leaf bas been removedfrom the bush. In most withering sheds, the staleair does not have mucb of a chance to escape toallow further withering to take place. Physicalwithering involves removal of water (and shouldperhaps be called wilting), wbereas chemicalwithering does not. Hard withering is wben toomuch moisture bas been removed so the leaf is
too soft, and soft withering is when too littlemoisture has been removed so the leaf is too hard
(or vice versa).
SJT
6 Fluid Bed Dryer monitoring and controlSJ. Temple
Introduction
Perhaps the item in QNL 109 on automatic dryercontrol was slightly premature. From visitingfactories in the region, it appears that althoughthe factory engineers understand the basics of thedrying process, the factory managers have littleor no idea of what they are looking at with dryertemperature probes.
Hot air supply
In the dryer, the fU'Stparameter that is measuredis the input temperature. Where steam is used asthe heat ,transfer medium between fire and hot
air, control of air temperature should beautomatic and simple. At TRF, we have beenusing the Spirax Sarco type of thermostatic valve.This has a long bulb which is inserted into thedelivery air from the beaters, coupled to the valvebody by a flexible tube about 2 metres long. Wefind that the recording of air temperaturesdelivered by this system is very consistent, butsome factories wbere the same system is installeddo not get such good control. This is probablydue to bad placement of the sensor tubes (forwhich the manufacturers give no guidance). If
they are fitted too close to the radiator, they willnot sense the average air temperature that issupplied to the dryer. They should be as fardownstream from the radiators as possible, andit helps if there is something like a bend or adamper between the radiator and the sensor toensure good mixing of the air.
So if the sensor tubes are installed correctly andthe boiler is of adequate size for the load, air inputtemperature should not vary significantly. Oncethe reliability of the thermostatic controls hasbeen established, it may not even be necessaryto measure the input temperature. Of course, ifthe beaters or boilers are inadequate, no amountof control will help.
Of course, if a different method of beating the airis used, alternative methods of thermostaticcontrol must be used but there is no reason for
these to be complicated or expensive.
We now have a dryer which is supplied with air,variable in flow rate but of controlled
temperature. All the followiug discussionassumes that we have controlled hot air
temperatures. Let us now look at what happens
- 5-
to the dhool and the moisture in it, to be able tointerpret the tc:rnperature readings we get from
above i:hedry~. be<:t
Constant rate drying
When the dhool enters, the dryer, there is around2.5 times as much water as dry matter in it. Thesurface (and neat-surface) moisture willevaporate at a high ratej'almost purely dependenton the capacity of the dryer air to take itawayand to supply the latent heat of evaporation. Theair leaving the dhool at this stage will be fullysaturated, so the wet bulb temperature will equalthe dry bulb temperature, and this .\Villbedetermined by the heat absorbed by the moisturefrom the hot air as the moisture evaporates. Thistemperature tends to be around 40 0C in mostdryers. We can use '!ery hot air without risk ofbumingin this part of the qryer,as,the heat g~sinto latent heat of evaporation rather than heating
up the dhool. The limit to air, te~pc(J;at,urewill
occur when the outer layer of the, M,qolparticleis dried so rapidly that the surf~ is: sealed,preventing easy movement of the interiormoisture to the surface for evaporation. Thisphenomenon is known as "case hardening", andis most often observed on balls of dhool; withfinely divided dhool the surface area is extremelyhigh in relation to,.the volume so it is unlikely tooccur except" at' ridiculously high dryingtemperatures (over 160 0 C).
Falling rate drying
When this highly mobile portion of the dhoolmoisture bas been lost, (at about 40% moisture
content wet basis) the rate <>fdryingwill start tofall. There is no longer free moisture on thesurface 'Of the dhool, and the moisture that isevaporating will come flOm the inside of theparticles. The rate of movement from the inside
to the outer surface will gradually fall, as' ~~ .moisture has further and further to travel to reach
the surface where it can be evaporated.
TRFONLllO
As the rate of drying is no longer determined bythe heat available in the drying air by! by the rateof diffusion, not all the -heat in the air. will be
utilised to evaporate moisture so the exhaust airtemperature will start to rise, and the temperatureof the dhool with it. This limits our air
temperature at this stage; too high a temperaturewill damage the valUable constituents.: ,-'. "
Once all the free moisture in the tea has beenevaporated, we still have some further moistureto evaporate. This is the amount of water thatthe dry tea is capable of picking up from theatmosphere in storage, in a hygroscopic mani:ler.It is quite strongly attached to the organic matterin the tea particle, so is quite difficult to remove;this results in a second falling rate period ofdrying, but as the rates during this period are verymilch less than the frrst falling rate phase, this isconsidered a separate part of the drying process.
As the beat in the air being fed to the dryer is notbeing used to evaporate water to a significantextent, the exhaust air temperature will be similarto the inlet temperature. Some of the heat willgo to increase the temperature of the dhoo1,which
will be close to the air tf~~rature .. Any furtherdrop in air temperature m~t 'tom~from cold air
enteringth.e dryer delivery '?~, or heat losses
through ~edry~r wall~.At ~'po~t, too high anair temPi!ature wiU'burn the tea. '
Graphical representation
The best way to look at the conditions in the dryeris to plot graphs with the distance along the dryeras the horizontal (x) axis.
TRFQNLll0 ·6-
Dryer operating correctly Dryer not at steady state9S 9S
Temperatureabovedhool
constant rot.
dhooll"Distance along dryer
folli"g rato 2
dry lea out
Temperotureabovedhool
dhoOl InDistance along dryer
dry lea out
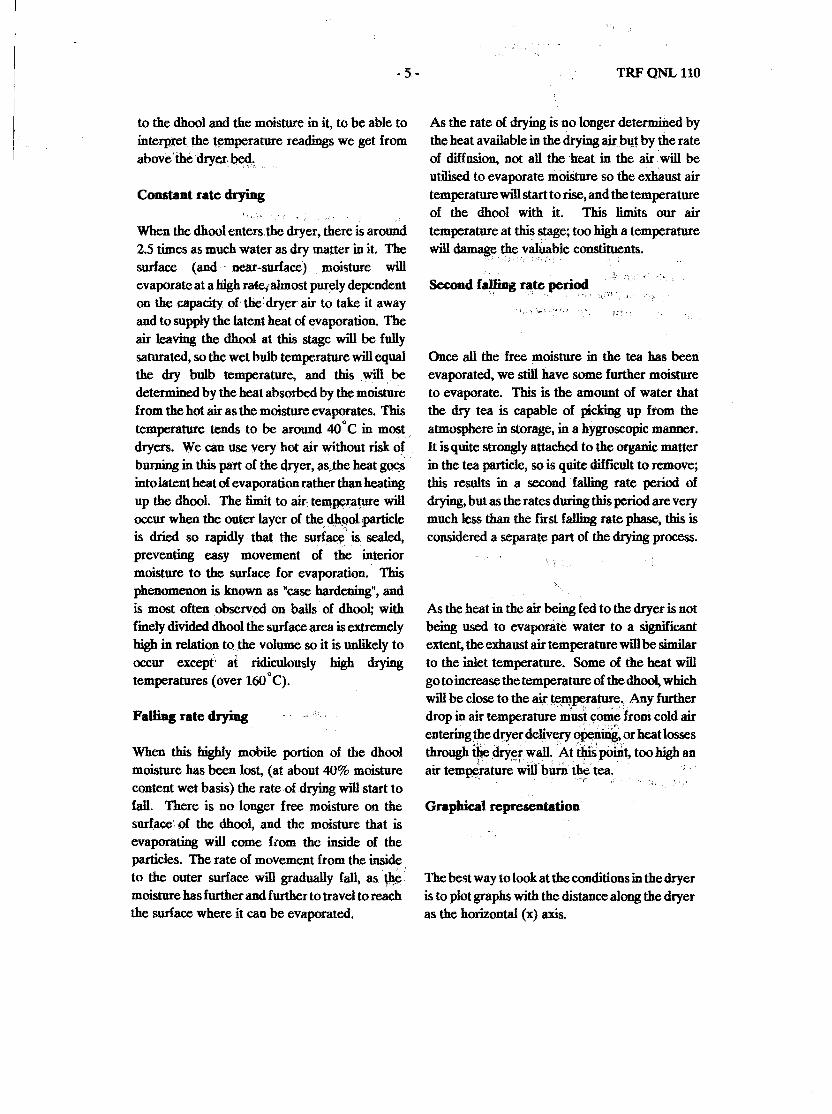
A curve like this is only obtained when a dryeris so operated that there is a steady flow of dhoolin, and a steady flow of made tea out, with
constant airflow and temperature settings. Ittakes some time from start-up to reach thesesteady state conditions and there is always atemptation to alter settings before the steady stateis reached, thus disturbing the system again. Ifthe flow of dhool is intermittent, or the weirs,airflow or other variables are altered, the picturewill be very different.
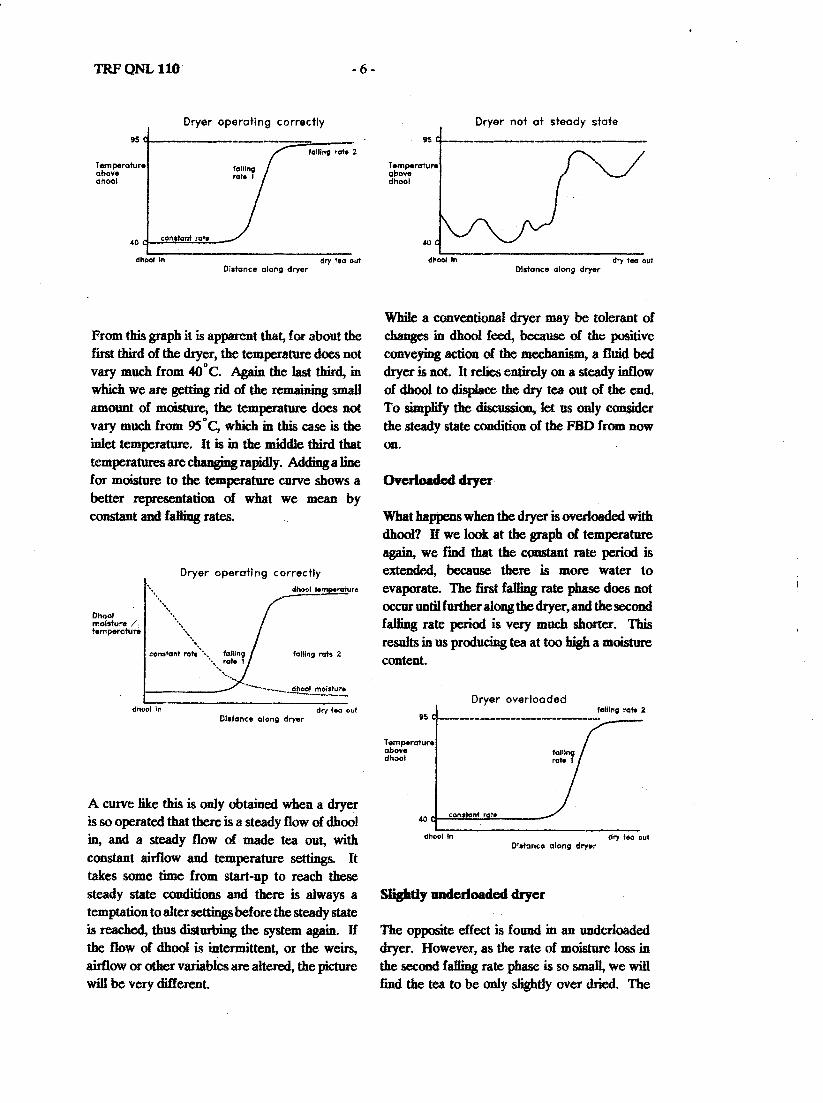
From this graph it is apparent that, for about thefirst third of the dryer, the temperature does notvary much from 40 aC. Again the last third, inwhich we are getting rid of the remaining smallamount of moisture, the temperature does notvary much from 950C, which in this case is theinlet temperature. It is in the middle third thattemperatures are changing rapidly. Adding a linefor moisture to the temperature curve shows abetter representation of what we mean byconstant and falling rates.
dry tee oulDistance along dry.r
Temperotureabovedhool
dhool In
While a conventional dryer may be tolerant ofchanges in dhool feed, because of the positiveconveying action of the mechanism, a fluid beddryer is !lOt. It relies entirely on a steady inflowof dhool to displace the dry tea out of the end.To simplify the discussion, let us only con$iderthe steady state condition of the FBD from nowon.
9S
Dryer overloaded
OYerloaclecldryer
What hapPens when the dryer is overloaded withdhool? If we look at the graph of temperatureagain, we fmd that the cODstant rate period isextended, because there is more water to
evaporate. The fU'Stfalling rate phase does notoccur untilfurther along the dryer, and the secondfalling rate period is very much shorter. Thisresults in us producing tea at too high a moisturecontent.
sliglatly uderloaded dryer
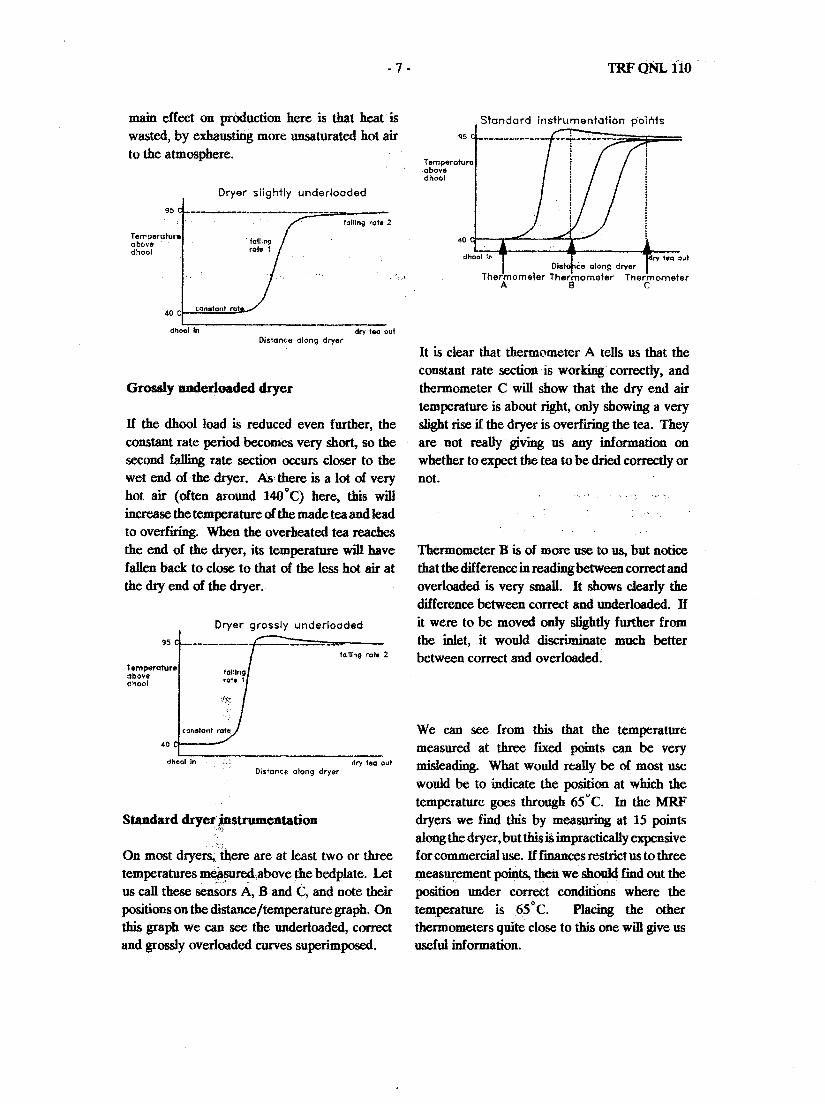
The opposite effect is found in an underloadeddryer. However, as the rate of moisture los.~inthe second faDing rate phase is so small, we willfmd the tea to be only slightly over dried. The
folll"g nm 2
dry fea ouf
dhool l0l!!l!!!!!!.ur.r--
Distance along dryer
Dryer operating correctly
dhool in
Dhoolmoisture /tern perature
- 7 - TRFQNLilO
95
Dryer slightly underloaded
40
95
Temperatureabovedhool
Standard instrumentatibnpoirits
dhool fl~
falling rot. Z
constant rot40
Temperutur·.abc,vedhool
main effect on prOduction here is that heat iswasted, by exhausting more unsaturated hot airto the atmosphere.
Dryer grossly underloaded
On most dryers; there are at least two or three
temperatures ~;above the bedplate. Letus call these se~~rs A, Band· C, and note their
positions on the distance/temperature graph. Onthis graph we can see the underloaded, correctand grossly overloaded curves superimposed.
If the dhool load is reduced even further, the
constant rate period becomes very short, so thesecond falling rate section occurs closer to thewet end of the dryer. As there is a lot of veryhot air (often around 1400 C) here, this willincrease the temperature of the made tea and leadto overfiring. When the overheated tea reaches
the end of the dryer, its temperature will havefalIen back to close to that of the less hot air at
the dry end of the dryer.
It is clear that thermometer A tells us that the
constant rate section·is working· correctly, andthermometer C will show that the dry end airtemperature is about right, only showing a veryslight rise if the dryer is overfiring the tea. Theyare not really giving us any information onwhether to expect the tea to be dried correctly ornot.
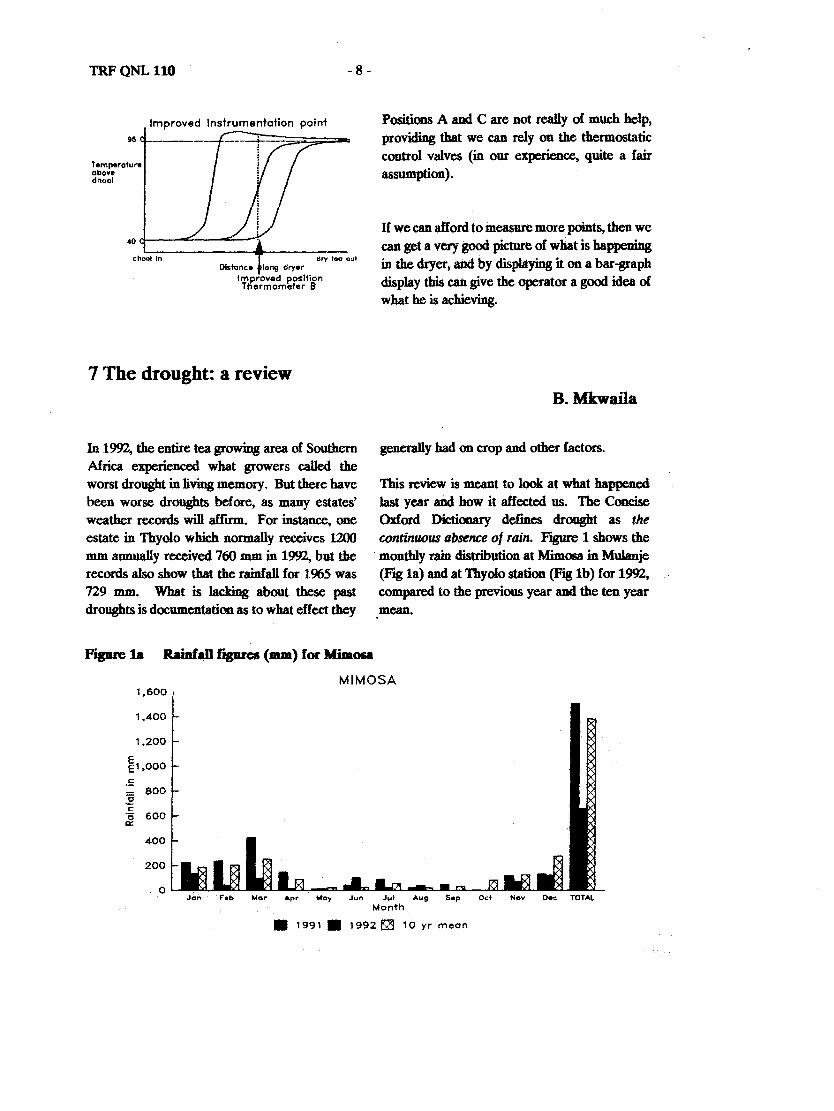
We can see from this that the temperaturemeasured at three fixed points can be verymisleading. What would really be of most usewould be to indicate the position at which thetemperature goes through 65 Q C. In the MRFdryers we find this by measuring at 15 pointsalong the dryer, but this is impractically expensivefor commercial use. If finances restrict us to three
rneasUI'ementpoints, t:hcfuwe should rmd out theposition under correct conditiOns where the
temperature is65Q C. Placing the otherthermometers quite close to this one will give ususeful information.
ThermometerBis of more use to us, but notice
that the difference in reading between correct andoverloaded is very small. It shows clearly thedifference between correct and underloaded. If
it were to be moved only slightly further fromthe inlet, it would discriminate much betterbetween correct and overloaded.
dry tea oul
dry tea outdhool In
Distant. along dryer
40
Distant •• along dryer
dooal In
Grossly nnderloaded dryer
95
Temperatureabovedhool
Standard dryer instrumentation'",,)
Improved instrumentation point
TRF ONL 110
95
Temperatureabovedhoal
40
dhool in
-8-
dry tea outDlsta"ce 10"9 dry.r
Improved posiiionThermometer B
Positions A and C are not really of much help,providing that we can rely on the thermostaticcontrol valves (in our eJtperience, quite a fairassumption).
If we can afford to measure more points, then we
can get a very good picture of what is happeningin the dryer, and by displaying it on a bar-graphdisplay this can give the operator a good idea ofwhat he is achieving.
7 The drought: a review
In 1992, the entire tea growing area of SouthernAfrica experienced what growers called theworst drought in living memory. But there havebeen worse droughts before, as many estates'weather records will affum. For instance, oneestate in Thyolo which normany receives 1200mm annually received 760 mm in 1992, but therecords also show that the rainfall for 1965 was
729 mm. What is Jacking about these pastdroughts is documentation as to what effect they
B.Mkwaila
generally had on crop and other factors.
This review is meant to look at what happenedlast year and how it affected us. The ConciseOxford Dictionary dermes drought as thecontinuous absence of rain. FtgUre 1 shows themonthly rain distribution at Mimosa in Mulanje(Fig 1a) and at Thyolo station (Fig 1b) for 1992,compared to the previous year and the ten yearmean.
Figure 18 lWnfaD figures (DUD) for Mimosa
MIMOSA1.600
1,4001,200EE',OOO.£:E
800
c'0 600
Q:400
2000
F.b War A~ ~ Jun Jut Aug S.p Oct N~ D~ ro~Month
• 1991 • 1992 &:9 10 yr mean
TRFQNLll0
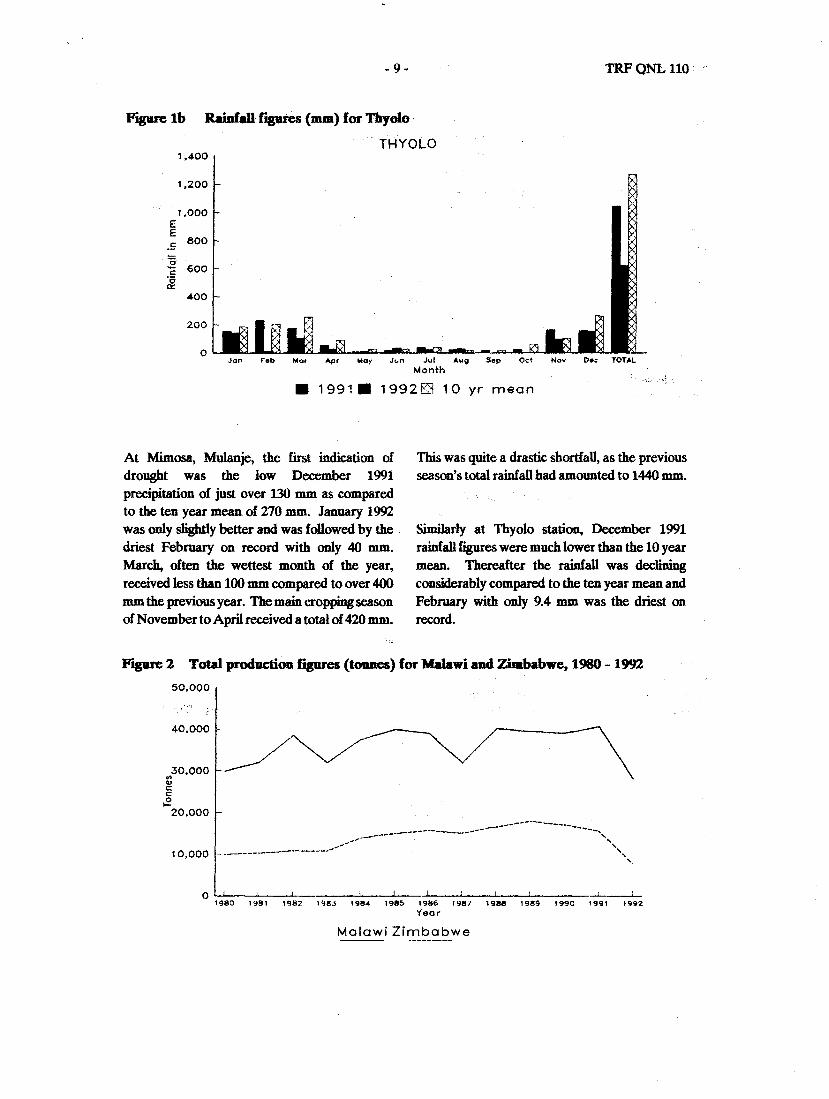
YJgUe Ib RaiDfall fJgUtes (nun) for TItyolo .
THYOLO1,400
1,200
1.000EE
Jo" F'.b Mar Apr May J\Jn JulMonth
.r:800
;;600C
~
400
200
o
• 1991. 1992K1 10 yr mean
At Mimosa, Mulanje, the first indication ofdrought was the low December 1991precipitation of just over 130 mm as comparedto the ten year mean of 270 mm. January 1992was only slightly better and was followed by thedriest February on record with only 40 mm.March, often the wettest month of the year,received less than 100 mm compared to over 400mm the previous year. The main cropping seasonof November to April received a total of 420 mm.
This was quite a drastic shortfall, as the previousseason's total rainfall had amounted to 1440 mm.
Similarly at Thyolo station, December 1991rainfall figures were much lower than the 10 yearmean. Thereafter the rainfall was decliningconsiderably compared to the ten year mean andFebruary with only 9.4 mm was the driest onrecord.
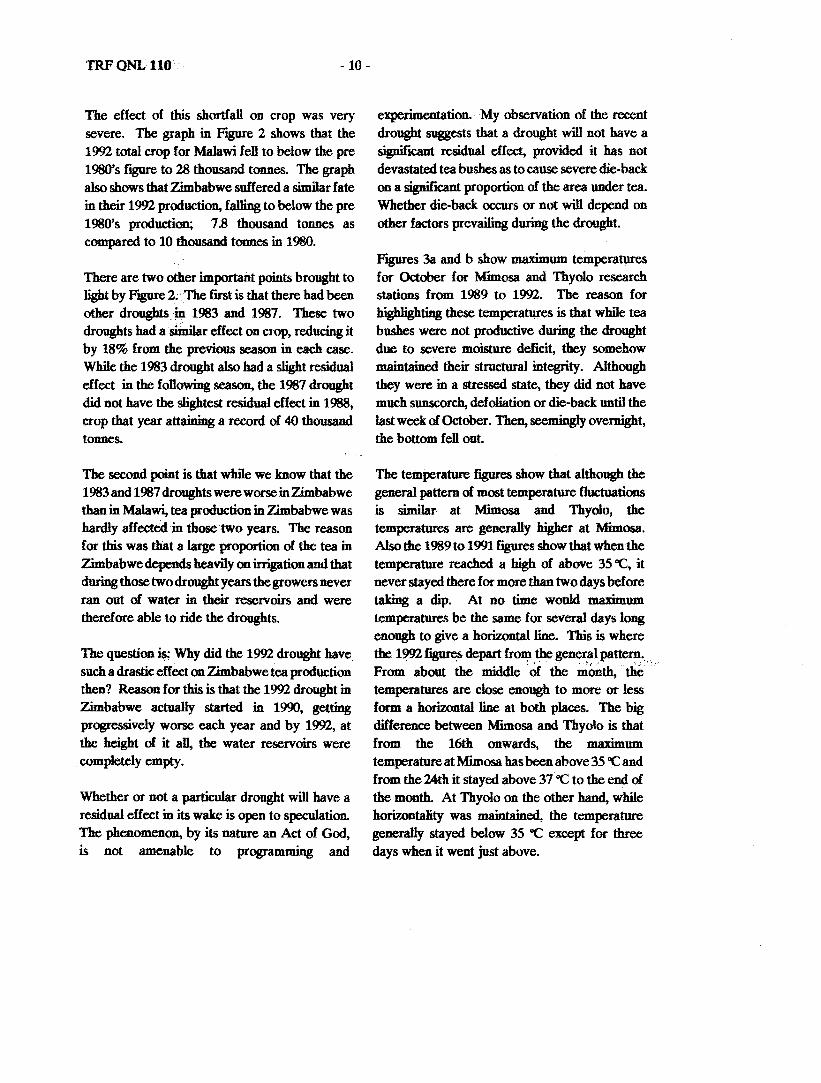
Figure 2 Total production figures (tODlles)for Malawi and Zimbabwe, 1980 - 199250.000
40.000
30,000'"CI>
c:c:~
20.000
10,000
---------------------------_ .._----------_ ..._-- •..._-"-,-,- "
----------------------~' " '.
o I I I [-L..---l.-1980 1981 1982 1983 1984 1985 1986 1987 1988 1989 1990 '991 1992
Year
Malawi Zimbabwe
TRF QNL 110 - 10-
The effect of this shortfall on crop was verysevere. The graph in Figure 2 shows that the1992 total crop for Malawi fell to below the pre1980's ftgure to 28 thousand tonnes. The graphalso shows that Zimbabwe suffered a similar fate
in their 1992 production, falling to below the pre1980's production; 7.8 thousand tonnes ascompared to 10 thousand tonnes in 1980.
There are two other important points brought tolight by F"tgUre2; 'The rust is that there had beenother drough1s'~ 1983 and 1987. These twodroughts had asiinilar effect on crop, reducing itby 18% from the previous season in each case.While the 1983 drought also had a slight residualeffect in the following season, the 1987 droughtdid not have the slightest residual effect in 1988,crop that year attaining a record of 40 thousandtonnes.
The second point is that while we know that the1983and 1987 droughts were worse in Zimbabwethan in Malawi, tea production in ZimbabWe washardly affected in those two years. The reasonfor this was that a large proportion of the tea inZimbabwe depends heavily on irrigation and thatduring those two drought years the growers neverran out of water in their reservoirs and were
therefore able to ride the droughts.
The question,i$: Why did the 1992 drought havesuch a drastic effect on Zimbabwe tea productionthen? Reason for this is that the 1992 drought inZimbabwe actually started in 1990, gettingprogressively worse each year and by 1992, atthe height of it all, the water reservoirs werecompletely empty.
Whether or not a particular drought will have aresidual effect in its wake is open to speculation.The phenomenon, by its nature an Act of God,is not amenable to programming and
experimentation. My observation of the recentdrought suggests that a drought will not have asignificant residual effect, provided it has notdevastated tea bushes as to cause severe die-back
on a signiftcant proportion of the area under tea.Whether die-back occurs or not will depend onother factors prevailing during the drought.
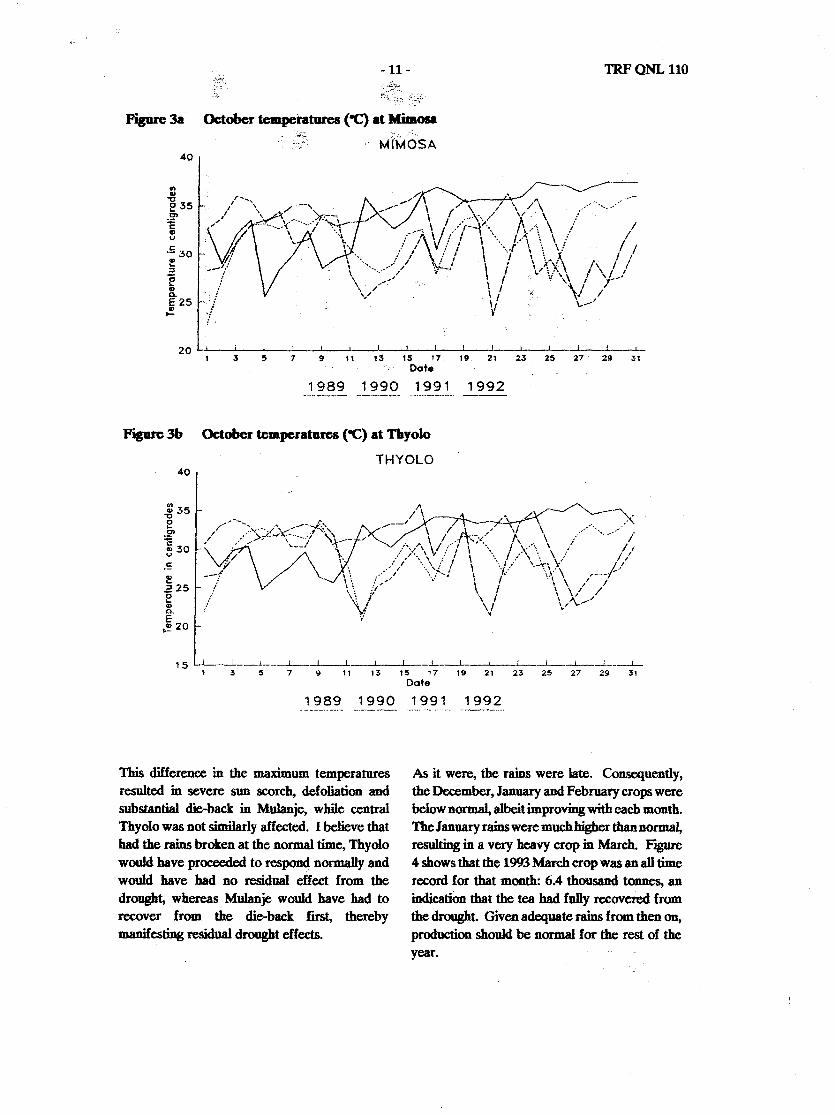
F"tgUfes3a and b show maximum temperaturesfor October for Mimosa and Thyolo researchstations from 1989 to 1992. The reason for
bighlighting these temperatqx'es is that while teabushes were not productive during the droughtdue to severe moisture defICit, they somehowmaintained their structural integrity. Althoughthey were in a stressed state, they did not havemuch sunscorch, defoliation or die-back until the
last week of October. Then, seemingly overnight,the bottom fell out.
The temperature figures show that although thegeneral pattern of most temperature fluctuationsis similar at Mimosa and Thyolo, thetemperatures are generally higher at Mimosa.Also the 1989 to 1991 figures show that when thetemperature reached a high of above 35 "C, itnever stayed there for more than two days beforetaking a dip. At no time would maximumtemperatures be the same for several days longenough to give a horizontal line. This is where
the 1992 figures depart from.thegeneralpattem.,From about the middle 'of the ~onth," the ",'temperatures are close enough to more or lessform a horizontal line at both places. The bigdifference between Mimosa and Thyol0 is thatfrom the 16th onwards, the maximumtemperature at Mimosa has been above 35 "C andfrom the 24th it stayed above 37 "C to the end ofthe month. At Thyolo on the other hand, whilehorizontality was maintained. the temperaturegenerally stayed below 35°C except for threedays when it went just above.
-11-
YJgUI'C 3a October temperatures ("C) at Mimosa
t"frMOSA40
TRFQNL1l0
.530~::l
e.,Q.E 25••
to-
20
---......... ...------.•.•.."/.\ -'\'. .-_- \ I \ / \ / \ .----./\ I "--\;';../ '{ \ ;"
\ I ...r--\ '. / \ ,.\ \:' /
:-.-:'\.\ :' I "'. ,.-\" \ \ ;" /:' I 1/ i I \ ", " \ \ \! I I•• I •• I \ '.' \: '. I;"/ !: \ / \ ',_.~. I!
......... / :Y--i \ i \/";':Z\ 1\ I !, ',/ < '/ \ V \\ I ,C,, /. \ / \ I I\/ \ / .' I
'/ \...-'~
LI .L-....lI3
57911131517.19.212325272931Date
1989199019911992--_._------------~~-..--_ ...-._._.
YJgUI'C 3b October temperatures (OC) at Thyolo
THYOLO
15 '_.L- ..---.I.-......---l..---l I L-....I I .L..--L--L--L. __L-3 5 7 9 11 13 15 17 19 21 23 25 27 29 31
Date
1989199019911992
This difference in the maximum temperaturesresulted in severe sun scorch, defoliation andsubstantial die-back in Mulanje, while centralTbyolo was not similarly affected. I believe thatbad the rains broken at the normal time, Tbyolowould have proceeded to respond normally andwould have had no residual effect from the
drought, whereas Mulanje would have had torecover from. the die-back first, therebymanifesting residual drought effects.
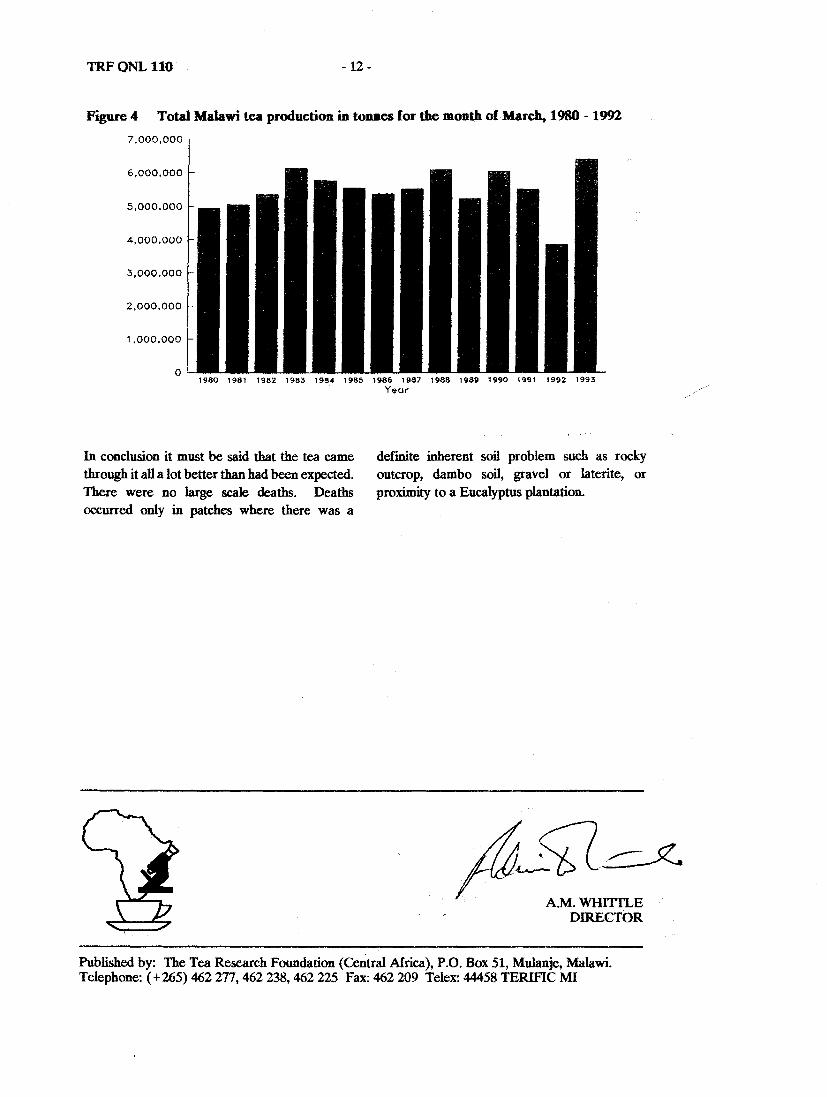
As it were, the rams were late. Consequently,the December, January and February crops werebelow normal, albeit improving with each month.The January rains were muchbigher tbannormaJ,resulting in a very heavy crop in March. FtgUl"C4 shows that the 1993 March crop was an all timerecord for that month: 6.4 thousand tonnes, anindicatiOn that the tea had fully recovered fromthe drought. Given adequate rains from.then on,production should be normal for the rest of theyear.
TRFQNL 110 - 12-
Figure 4 Total Malawi tea production in tonnes for the month ofMarc~ 1980 -19927,000,000
6,000,000
5,000,000
4,000,000
3,000,000
2,000,000 -
1,000,000
o1980 1981 1982 1983 1984 1985 1986 1987 1988 1989 1990 1991 1992 1993
Year
In conclusion it must be said that the tea came
through it all a lot better than had been expected.There were no large scale deaths. Deathsoccurred only in patches where there was a
definite inherent soil problem such as rock]'outcrop, dambo soil, gravel or laterite, orproximity to a Eucalyptus plantation.
A...;..CJ~rw< AM. WHITTLEDIRECTOR
Published by: The Tea Research Foundation (Central Africa), P.O. Box 51, Mulanje, Malawi.Telephone: ( +265) 462 277, 462 238, 462 225 Fax: 462 209 Telex: 44458 TERIFIC MI