Embed Size (px)
DESCRIPTION
Research Experiences For Teachers: The Impacts on Their Students and the Economy. Jay Dubner Columbia University Summer Research Program for Science Teachers. 2006 AGU Fall Meeting December 11, 2006. “ Practice What You Teach ”. - PowerPoint PPT Presentation
Citation preview
Research Experiences For Teachers:Research Experiences For Teachers:The Impacts on Their Students and the The Impacts on Their Students and the
EconomyEconomy
Jay DubnerColumbia University
Summer Research Program for Science Teachers
2006 AGU Fall MeetingDecember 11, 2006
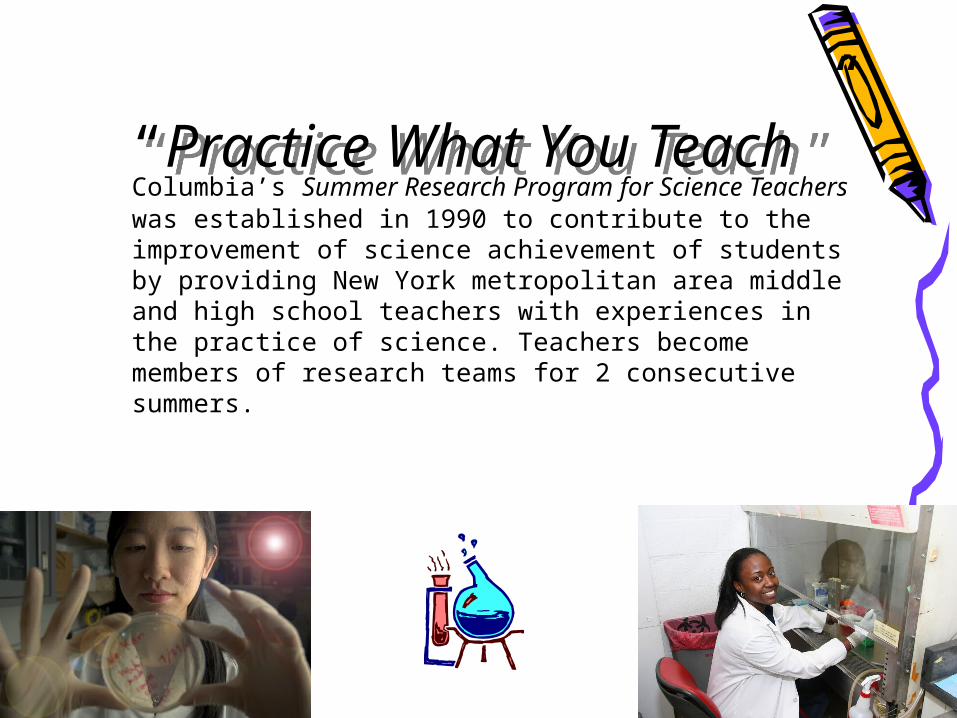
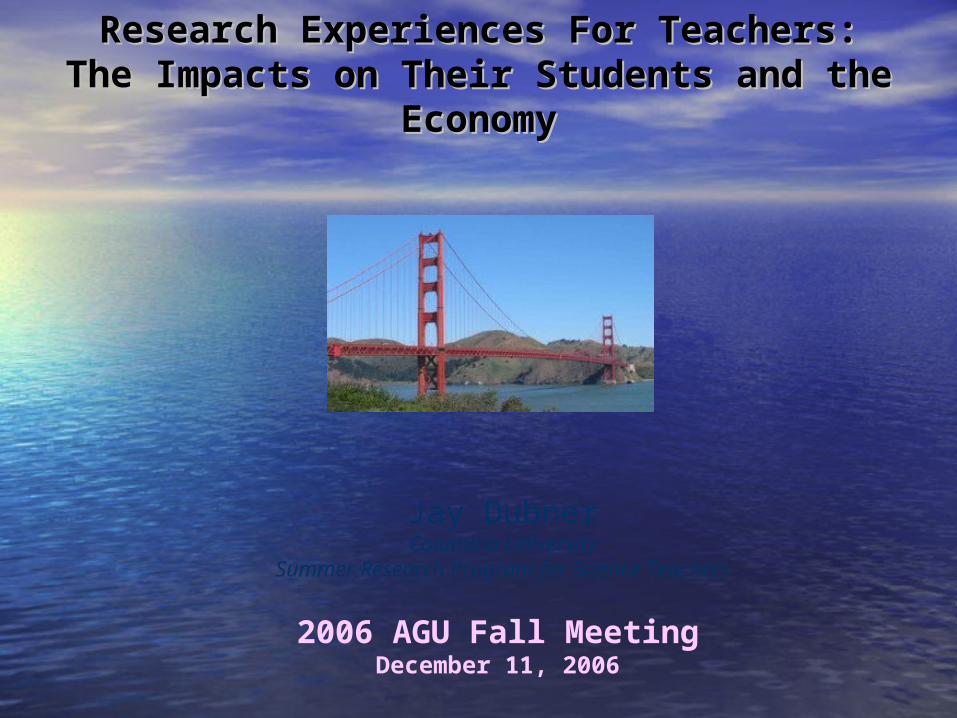
“Practice What You Teach”
“Practice What You Teach”
Columbia’s Summer Research Program for Science Teachers was established in 1990 to contribute to the improvement of science achievement of students by providing New York metropolitan area middle and high school teachers with experiences in the practice of science. Teachers become members of research teams for 2 consecutive summers.

Summer Research Program1990-2006
• 186 middle and high school science teachers + 30 placed at other NYC academic research institutions
• 87% public schools• 60% women• 46% minorities
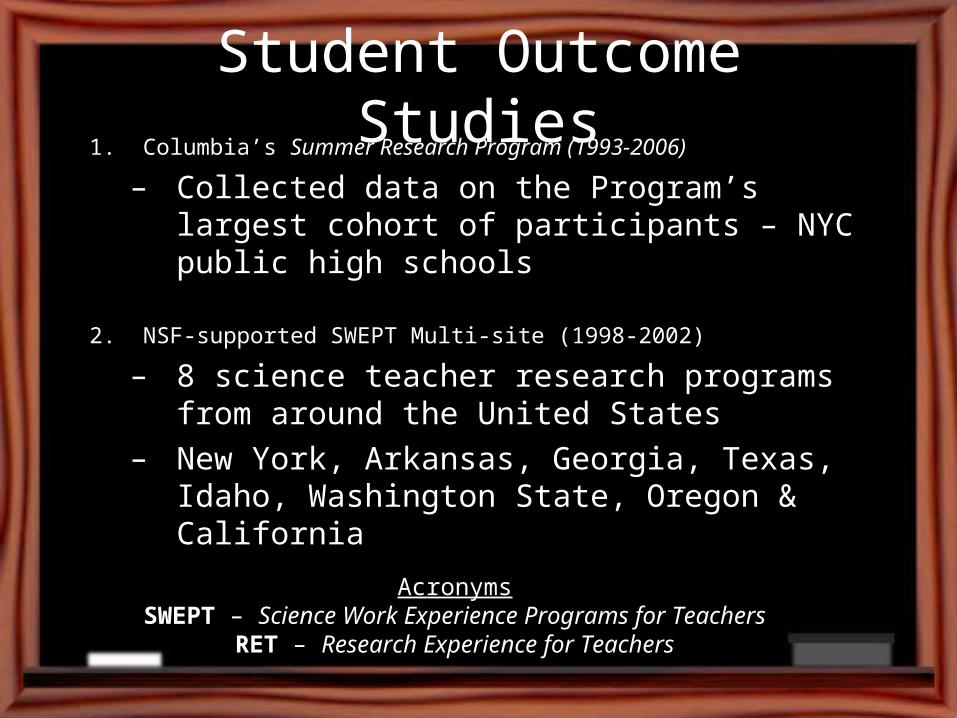
Student Outcome Studies1. Columbia’s Summer Research Program (1993-2006)
– Collected data on the Program’s largest cohort of participants – NYC public high schools
2. NSF-supported SWEPT Multi-site (1998-2002)
– 8 science teacher research programs from around the United States
– New York, Arkansas, Georgia, Texas, Idaho, Washington State, Oregon & California
AcronymsSWEPT – Science Work Experience Programs for Teachers
RET – Research Experience for Teachers
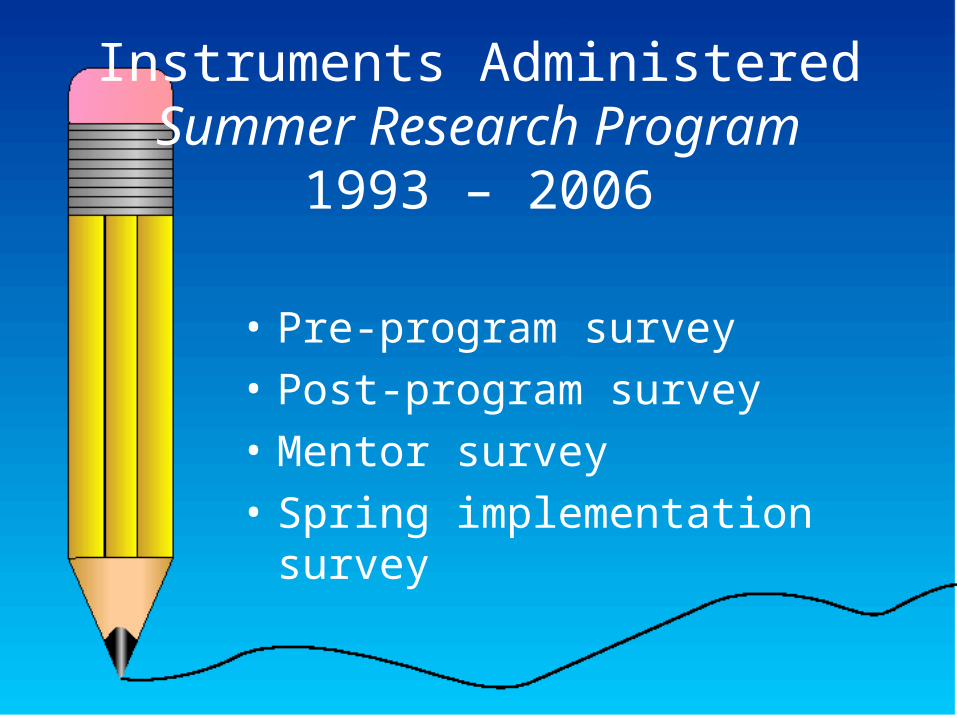
Instruments AdministeredSummer Research Program
1993 – 2006
• Pre-program survey
• Post-program survey
• Mentor survey
• Spring implementation survey
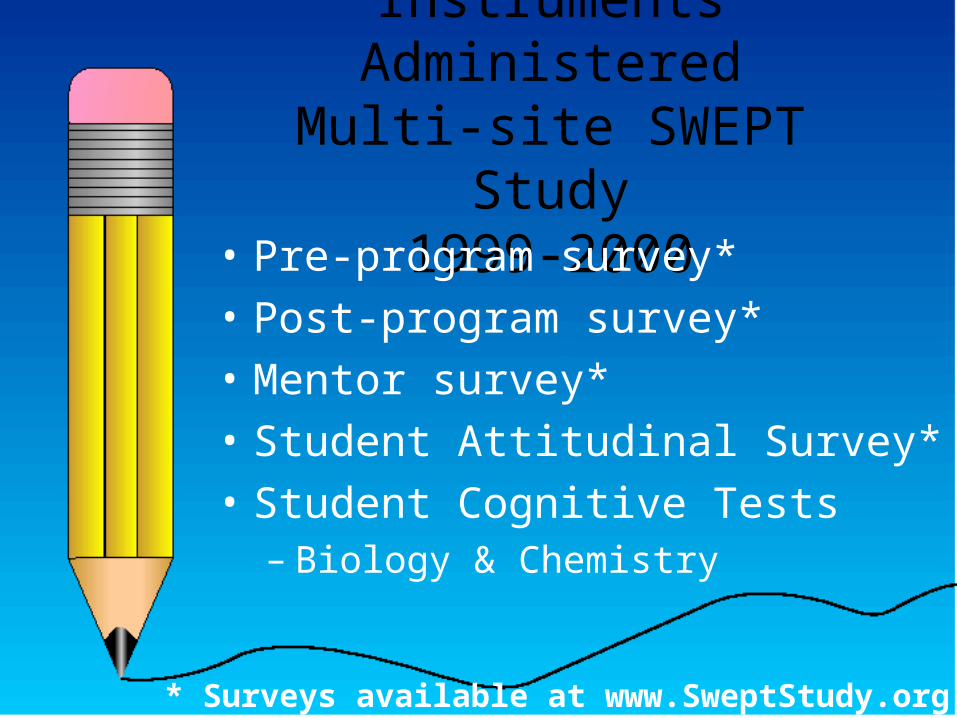
Instruments AdministeredMulti-site SWEPT Study
1999-2000• Pre-program survey*
• Post-program survey*
• Mentor survey*
• Student Attitudinal Survey*
• Student Cognitive Tests– Biology & Chemistry
* Surveys available at www.SweptStudy.org
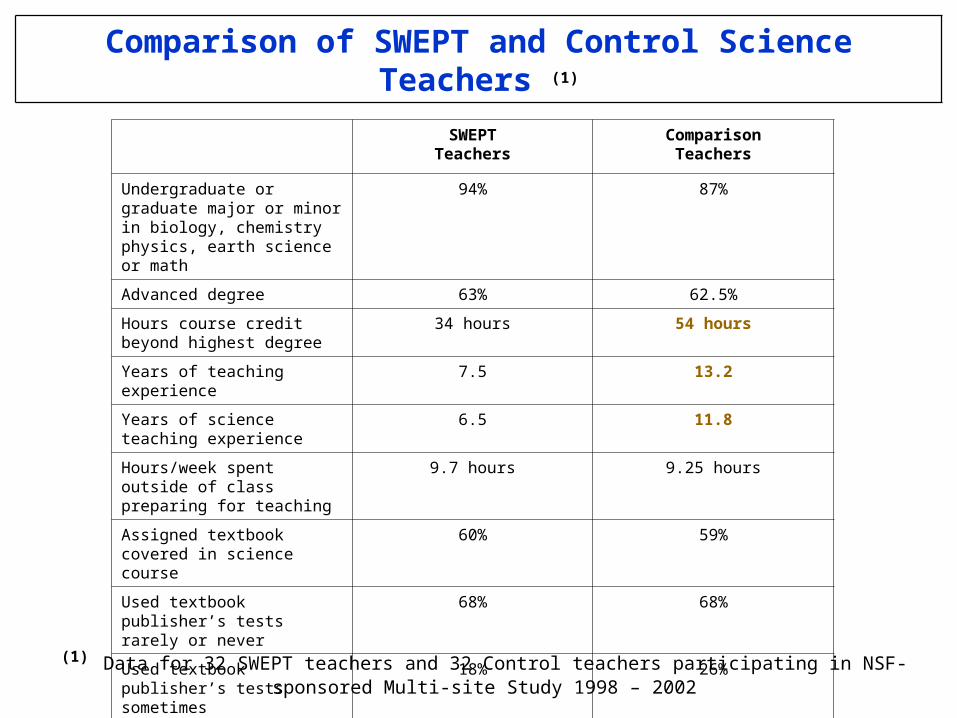
Comparison of SWEPT and Control Science Teachers (1)
(1) Data for 32 SWEPT teachers and 32 Control teachers participating in NSF-sponsored Multi-site Study 1998 – 2002
SWEPTTeachers
ComparisonTeachers
Undergraduate or graduate major or minor in biology, chemistry physics, earth science or math
94% 87%
Advanced degree 63% 62.5%
Hours course credit beyond highest degree
34 hours 54 hours
Years of teaching experience 7.5 13.2
Years of science teaching experience
6.5 11.8
Hours/week spent outside of class preparing for teaching
9.7 hours 9.25 hours
Assigned textbook covered in science course
60% 59%
Used textbook publisher’s tests rarely or never
68% 68%
Used textbook publisher’s tests sometimes
18% 26%
Used textbook publisher’s tests frequently
14% 6%
Findings
Program has engaged teachers intellectually
Provided teachers with new avenues of professional & personal growth
Increased their appreciation for the process of scientific discovery
Enhanced their ability to converse the excitement and vitality of science to their students and fellow educators
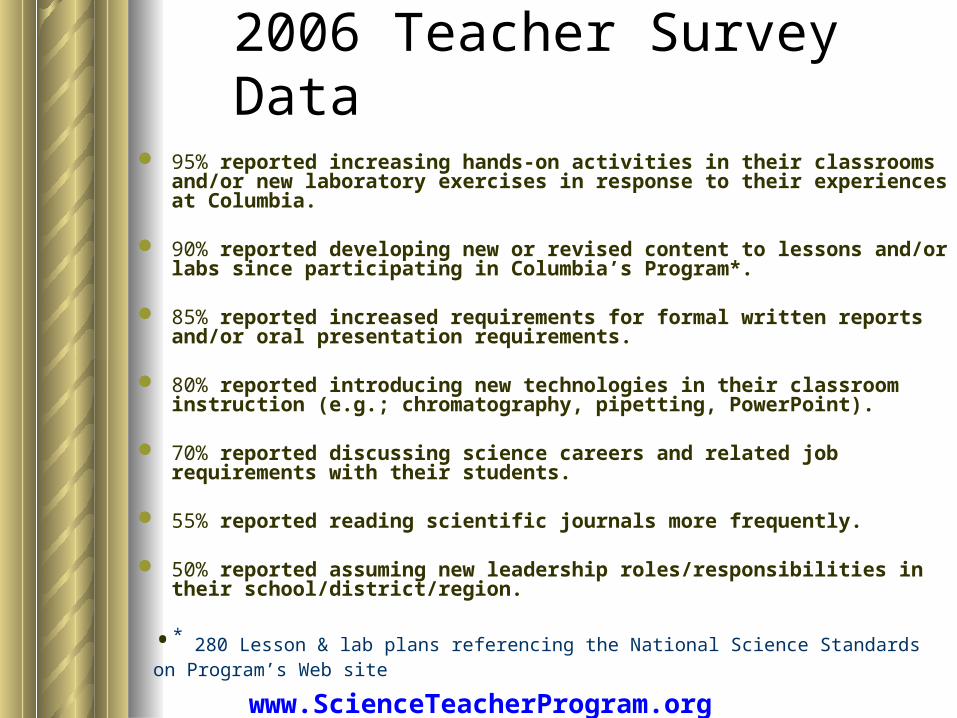
2006 Teacher Survey Data
95% reported increasing hands-on activities in their classrooms and/or new laboratory exercises in response to their experiences at Columbia.
90% reported developing new or revised content to lessons and/or labs since participating in Columbia’s Program*.
85% reported increased requirements for formal written reports and/or oral presentation requirements.
80% reported introducing new technologies in their classroom instruction (e.g.; chromatography, pipetting, PowerPoint).
70% reported discussing science careers and related job requirements with their students.
55% reported reading scientific journals more frequently.
50% reported assuming new leadership roles/responsibilities in their school/district/region.
•* 280 Lesson & lab plans referencing the National Science Standards on Program’s Web site
www.ScienceTeacherProgram.org
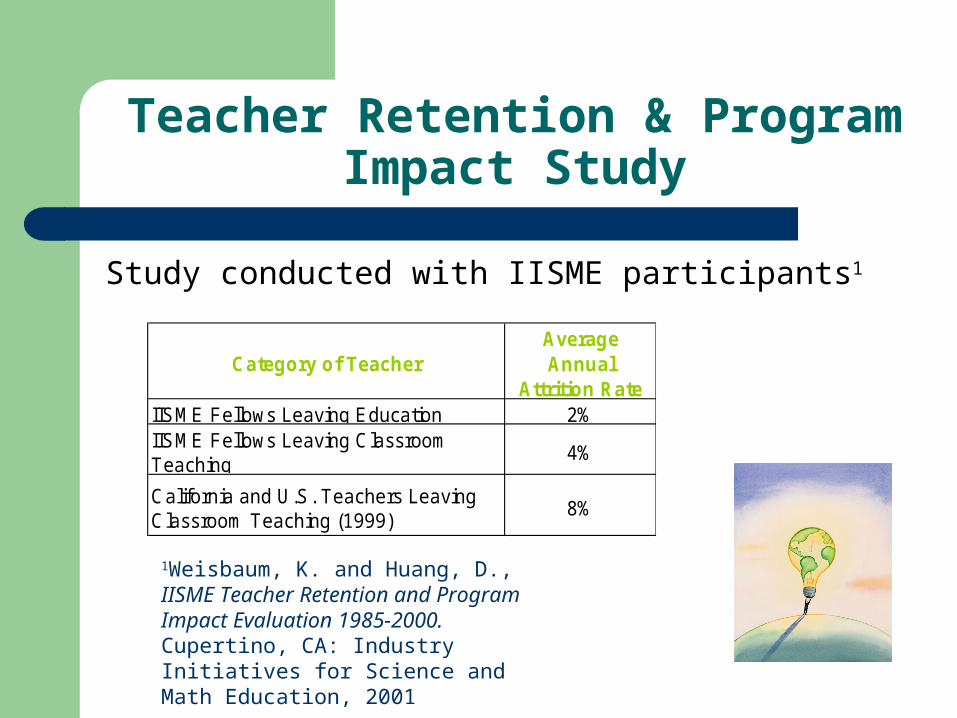
Teacher Retention & Program Impact Study
Study conducted with IISME participants1
1Weisbaum, K. and Huang, D., IISME Teacher Retention and Program Impact Evaluation 1985-2000. Cupertino, CA: Industry Initiatives for Science and Math Education, 2001
Category of TeacherAverage Annual
Attrition RateIISME Fellows Leaving Education 2%IISME Fellows Leaving Classroom Teaching
4%
California and U.S. Teachers Leaving Classroom Teaching (1999)
8%

Research shows that teacher expertise is one of the most important factors in raising student achievement1
A review of 60 studies found that investing in support for teacher expertise was the most cost-effective way to increase student achievement.
Effective professional development programs stimulate teachers to work with one another.
1 Ohme, P. & Rayford, J., Innovative Program Allows Georgia Teachers to Bring Real-World Work
Experiences into the Classroom, The Journal, October 2001
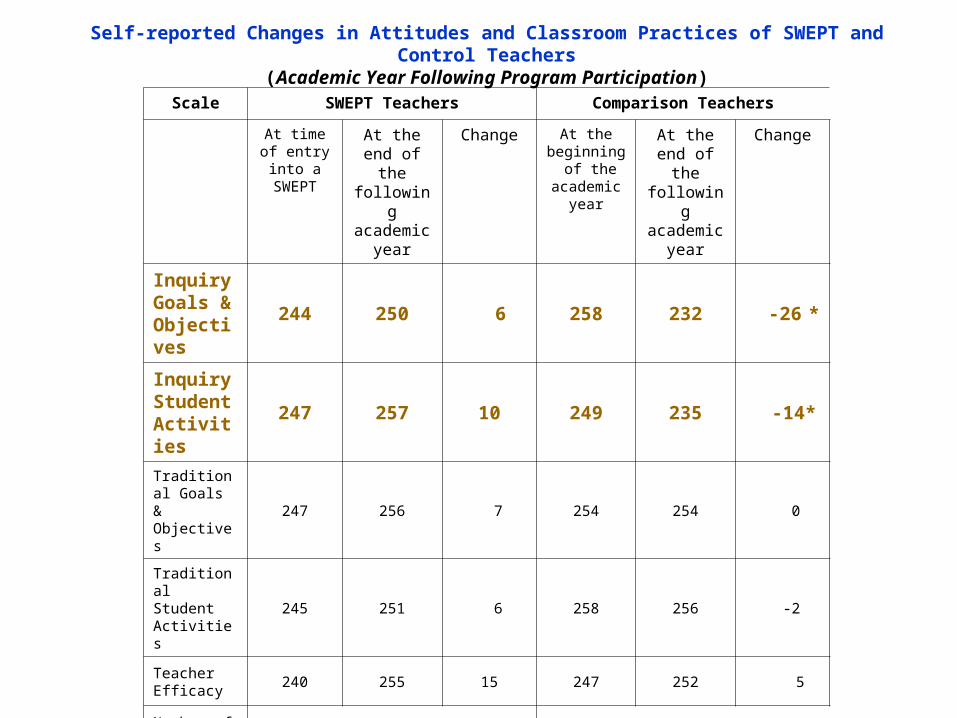
Self-reported Changes in Attitudes and Classroom Practices of SWEPT and Control Teachers(Academic Year Following Program Participation)
Scale SWEPT Teachers Comparison Teachers
At time of entry into a
SWEPT
At the end of the
following academic
year
Change At the beginning of the academic
year
At the end of the
following academic
year
Change
Inquiry Goals & Objectives
244 250 6 258 232 -26 *
Inquiry Student Activities
247 257 10 249 235 -14*
Traditional Goals & Objectives
247 256 7 254 254 0
Traditional Student Activities
245 251 6 258 256 -2
Teacher Efficacy
240 255 15 247 252 5
Number of teachers
58 58
Data obtained from 1999-2000 and 2000-2001 Pre- and Post-teaching Attitudinal Surveys of SWEPT and Comparison Teachers participating in NSF-sponsored Multi-site SWEPT study 1998-2002.
*Difference in the two change scores is significant at the p<0.05 level.

Achievement in Science of students of SWEPT and Control Teachers
(Second Year after SWEPT participation)
SubjectTest scores of students in
classes of SWEPT TeachersTest scores of students in classes
of Control Teachers
Pre-test Post-testPre-Post
Gain Pre-test Post-testPre-Post
Gain
Biology 266(235) 291(235) 25*(235) 263(128) 284(128) 21*(128)
Chemistry 282(122) 310(122) 28*(122) 275(43) 295(43) 20*(43)
* Difference in Pre-Post change scores is significant at the p<0.05 level.
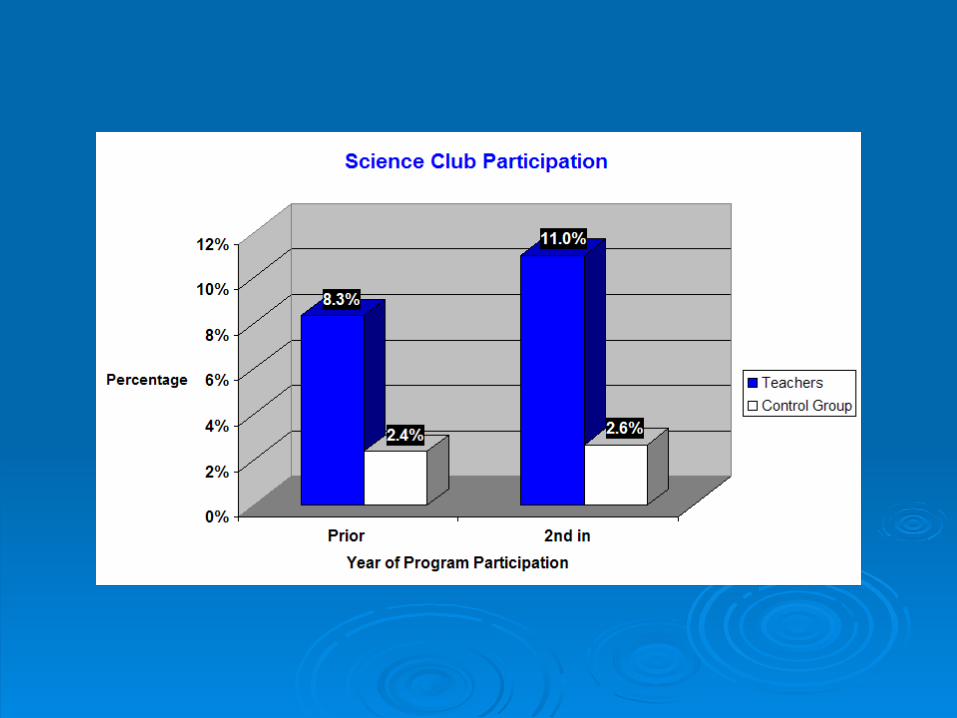
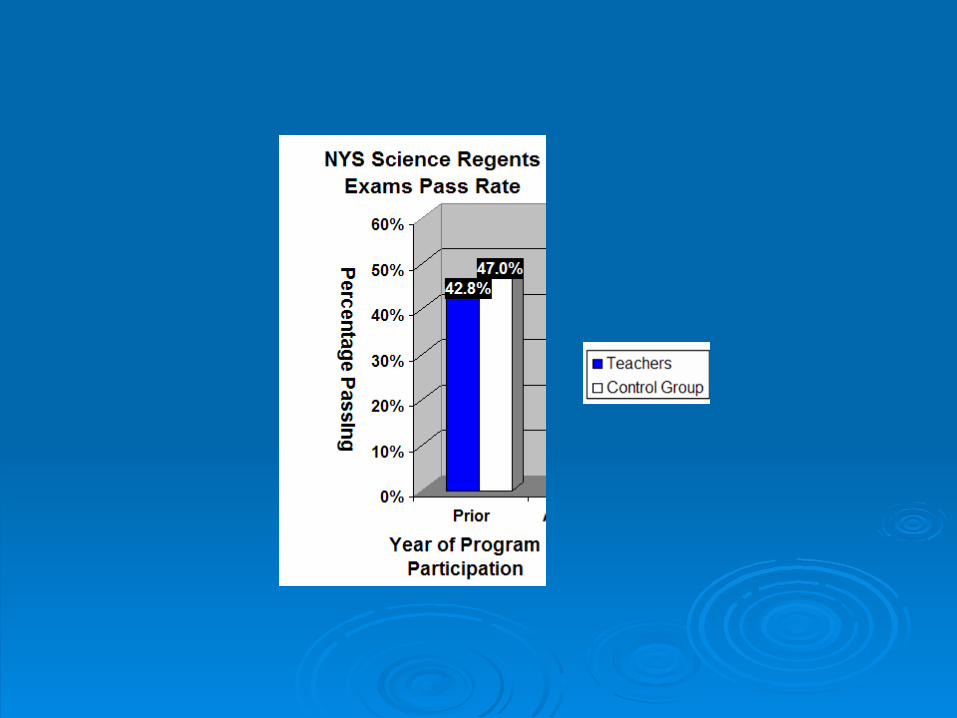
• Columbia’s Summer Research Program has been collecting quantitative student data from NYC public high schools (1993 was first data set)
- Study Group -- Students in science classes of Program teachers (Prior to program participation through completion of two summer program)
- Comparison Group -- Students in science classes of non-participating teachers from the same schools
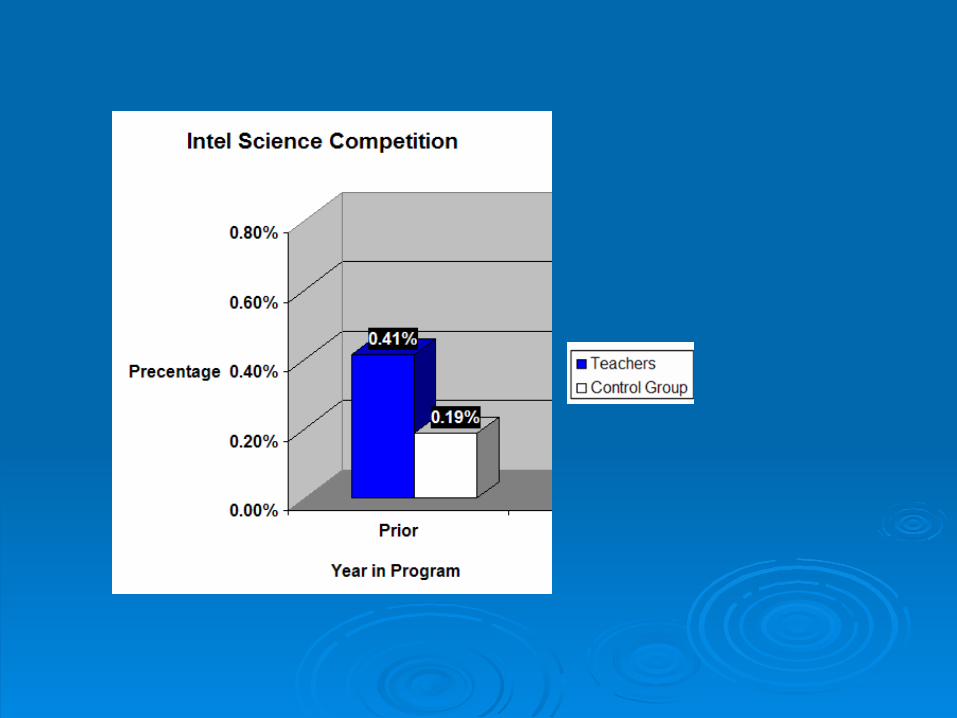
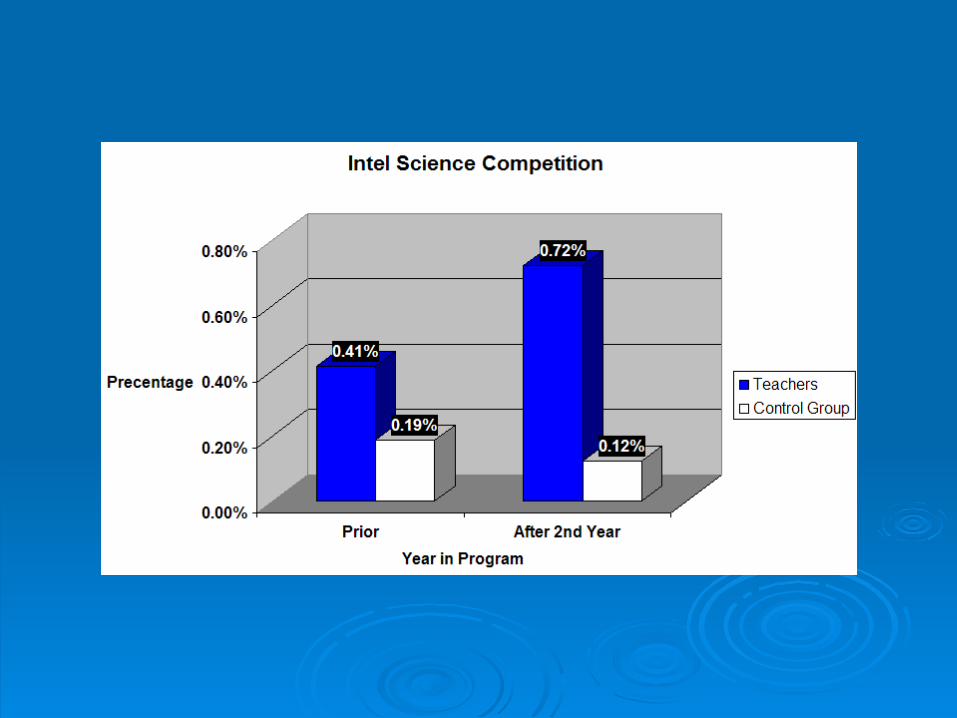

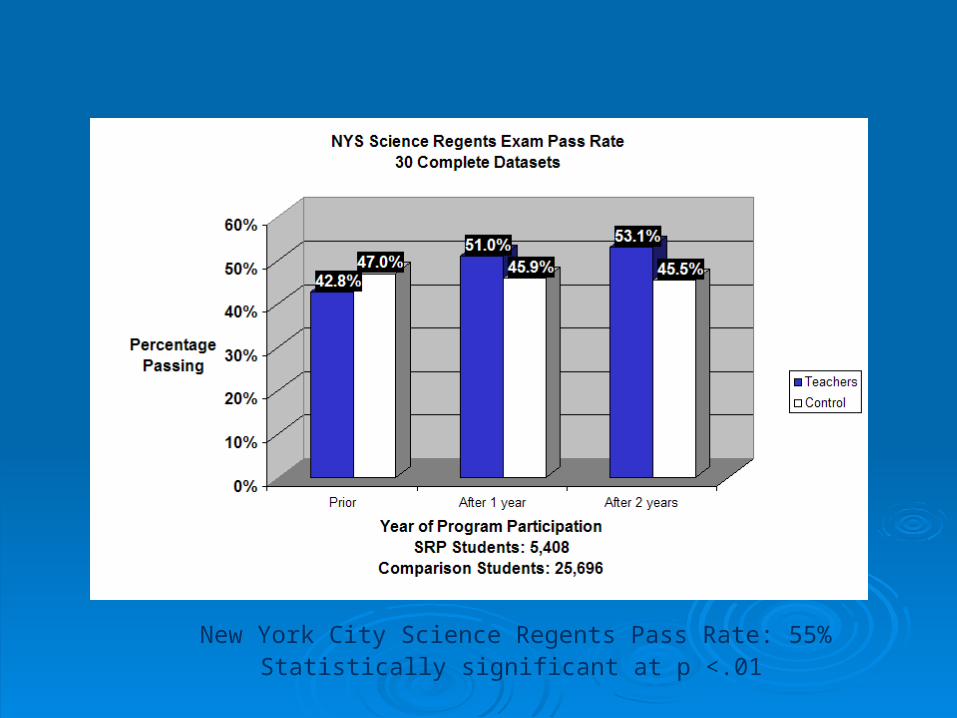
Statistically significant at p <.01
New York City Science Regents Pass Rate: 55%
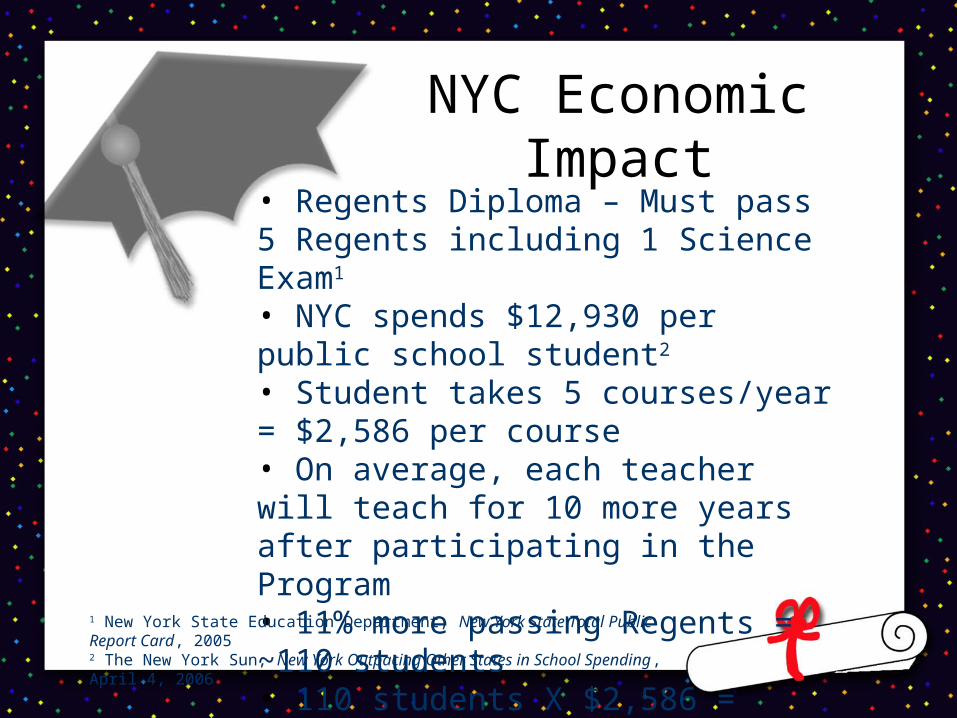
NYC Economic Impact• Regents Diploma – Must pass 5 Regents including 1 Science Exam1
• NYC spends $12,930 per public school student2
• Student takes 5 courses/year = $2,586 per course• On average, each teacher will teach for 10 more years after participating in the Program• 11% more passing Regents = ~110 students• 110 students X $2,586 = $284,460 (11 times the cost to train one teacher)
1 New York State Education Department, New York State Total Public Report Card, 20052 The New York Sun, New York Outpacing Other States in School Spending, April 4, 2006
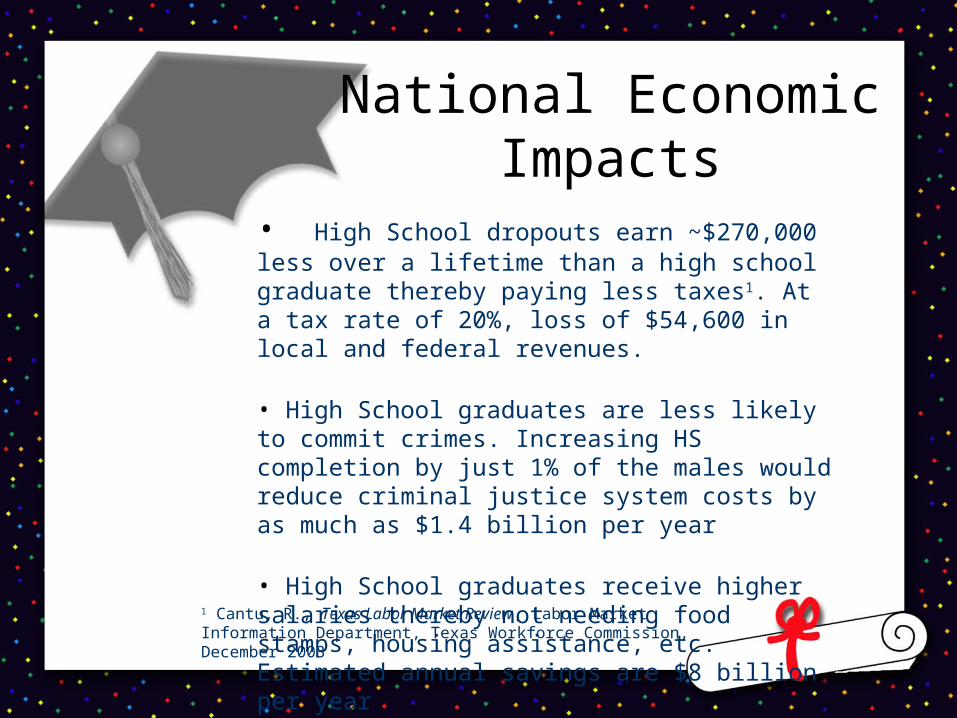
National Economic Impacts
• High School dropouts earn ~$270,000 less over a lifetime than a high school graduate thereby paying less taxes1. At a tax rate of 20%, loss of $54,600 in local and federal revenues.
• High School graduates are less likely to commit crimes. Increasing HS completion by just 1% of the males would reduce criminal justice system costs by as much as $1.4 billion per year
• High School graduates receive higher salaries thereby not needing food stamps, housing assistance, etc. Estimated annual savings are $8 billion per year
1 Cantu, R., Texas Labor Market Review, Labor Market Information Department, Texas Workforce Commission, December 2003
2006 Summer Research Program Funding Sources
• Bristol-Myers Squibb Foundation• Howard Hughes Medical Institute• Mellam Family Foundation• National Institutes of Health• National Science Foundation• New York Times Company Foundation
Columbia University’sColumbia University’sSummer Research Program Summer Research Program
for Science Teachersfor Science Teachers
www.ScienceTeacherProgram.orwww.ScienceTeacherProgram.orgg