Embed Size (px)
Citation preview

Rail Staff Survey 2017
Report on findings
Research & Development November 2017

OFFICIAL
1
OFFICIAL
Contents
1. Executive summary p.2
2. Introduction p.3
3. Methodology p.4
4. Response p.6
5. Demographics p.8
6. Personal security p.13
Personal security p.13
Thematic analysis p.19
7. Rail staff relationships with BTP p.26
8. Communication with BTP p.29
9. Crime-related issues p.35
10. Freight Operating Company (FOC) analysis p.38
11. Comparison with 2016 Rail Staff survey p.41
12. Further analysis p.42
13. Conclusion p.43
Appendix p.45

OFFICIAL
2
OFFICIAL
1. Executive summary
The Rail Staff Survey is an annual survey of rail staff employees who provide British
Transport Police (BTP) and Train and Freight Operating Companies (TOCs and
FOCs) and Network Rail (NWR) with an understanding of the issues affecting the rail
staff community, and what the organisations can do to help improve their personal
security whilst working on the railway. The Rail Staff Survey 2017 ran for just over 11
weeks, from 24 March to 12 June 2017. Respondents could complete the survey
online or by completing a paper copy of the questionnaire and returning it by
Freepost. We received 6,186 valid responses1 from 30 organisations. The largest
number of responses came from rail staff members employed by Transport for
London (TfL), accounting for 13.1 per cent of the total sample (864 responses).
Employees of Govia Thameslink Railway (GTR) and Abellio Greater Anglia returned
857 (13%) and 346 (5.2%) responses respectively. These percentages account for
the percent of responses against the total number of responses received from the
survey, as opposed to the total number of employees working for each TOC.
1 These have been categorised as those who have completed the personal security question. A
further 441 responses were received and have been included in some analysis below.
OFFICIAL
3
OFFICIAL
2. Introduction
Our Research and Development team conducts an annual social research survey2 to
understand the issues affecting the rail staff community and what we can do to help
improve their personal security whilst working on the railway. The survey is produced
in consultation with the British Transport Police Authority (BTPA), participating TOCs
and FOCs3, Network Rail and departments within BTP.
The survey provides an avenue for the rail staff community to provide us and their
employers with feedback about issues that affect their personal security. This helps
those organisations to target efforts to improve day-to-day working experiences for
rail staff. The survey results are used to inform future policing plans and measure our
progress against a strategic objective to increase the confidence rail staff have in
BTP and their personal security whilst working on the railway. The results also help
us to tailor specific action plans to stations and TOCs and FOCs to improve how rail
staff feel about their personal security. Our findings and recommendations are
shared with TOCs and FOCs, Network Rail and other industry partners/4.
This report presents the findings from the Rail Staff Survey 2017.
2 Adjustments are made to the survey each year to facilitate the capture of a range of influential
factors 3 Facilitated through the Rail Delivery Group
4 This group also includes Network Rail respondents

OFFICIAL
4
OFFICIAL
3. Methodology
Our Rail Staff Survey 2017 ran for just over 11 weeks, from 24 March to 12 June
20175. This 11-week period ensured adequate time was allowed for rail staff to take
part. The survey was available to complete online and on paper to be returned via
Freepost. During the survey period, we circulated regular updates within BTP and to
participating TOCs and FOCs.
Rail staff were informed that their answers would be treated anonymously and used
only for the purpose of improving the services we provide. As an incentive, they were
offered the chance to win a high street voucher, worth either £250 or £50, for taking
part. One £250 voucher and five £50 vouchers were available.
Dissemination
As in 2016, the survey was made available to complete and return on paper as well
as online. 20,000 paper questionnaires and accompanying Freepost envelopes, and
3,000 posters were distributed across TOCs and FOCs on request. An additional
20,000 questionnaires and accompanying Freepost envelopes were ordered midway
through the survey period to meet high demand6.
The survey was promoted through a variety of channels, including our website; an
advertisement in Rail Staff magazine; through internal TOC and FOC
communications – including emails, newsletters, briefings, posters in staff rooms and
on notice boards; and visits from our local policing teams.
Survey materials
An image of the survey is on the following page. A copy of the poster can be found in
the appendix.
5 The survey remained open for a further two weeks to allow time for paper surveys to be returned
and input before closing on 26 June 2017 6 In 2016, 15,000 questionnaires and accompanying Freepost envelopes, 15,000 leaflets and 3,000
posters were ordered and distributed throughout the survey period

OFFICIAL
5
OFFICIAL

OFFICIAL
6
OFFICIAL
4. Response
We received 6,186 valid responses7 to our Rail Staff Survey 2017. This is an
increase of 6.1 per cent compared with 2016 and the highest number of responses
we have received since the survey began in 2014.
Train and Freight Operating Companies
The survey was distributed across TOCs and FOCs and Network Rail. We received
responses from employees of 30 companies. The total number of responses from
each organisation is presented in the table below. We received the largest number of
responses from rail staff employed by Transport for London (TfL) - 13.1 per cent of
the total responses. Employees of South West Trains and Govia Thameslink Railway
(GTR) returned 617 (9.3%) and 857 (13%) responses respectively. In some of the
responses, the respondent didn’t declare which TOC or FOC they are employed by,
or the response couldn’t be matched to a TOC or FOC. Again, this percentage is
calculated on the number of responses per TOC/FOC against the total number of
responses, as opposed to percent against TOC/FOC workforce.
7 An additional 441 responses were submitted but only completed up to question 4 and therefore are
not included.

OFFICIAL
7
OFFICIAL
Table 1 The number of responses received by each organisation
Train or Freight Operating Company Number of respondents Percentage
Abellio Greater Anglia 346 5.2% Arriva Rail London 121 1.8% Arriva Train Wales 260 3.9% C2C 108 1.6% Chiltern 97 1.5% Cross Country 291 4.4% DB Cargo 167 2.5% Deutsche Bahn 64 1.0% East Midlands Trains 152 2.3% Eurostar 25 0.4% First Group 8 0.1% First Transpennine Express 158 2.4% Freightliner 69 1.0% GB Railfreight 175 2.6% Govia Thameslink Railway 857 13.0% Grand Central Trains 23 0.3% Great Western Railway 296 4.5% Hull Trains 34 0.5% London Midland 73 1.1% Merseyrail 54 0.8% MTR Crossrail 293 4.4% Network Rail 413 6.2% Northern 186 2.8% ScotRail 262 4.0% South West Trains 617 9.3% Southeastern 192 2.9% Transport for London 864 13.1% Tyne and Wear Metro 4 0.1% Virgin Trains 136 2.1% Virgin Trains East Coast 266 4.0% Total 6,6118 100%
8 6,611 responses could be attributed to their relevant TOC/FOC

OFFICIAL
8
OFFICIAL
5. Demographics
Gender
Of the 5,8259 respondents who provided demographic information, 4,139 identified
as male, 1,488 as female and 12 as transgender. A further seven identified as Other
(non-binary) and 180 selected Prefer not to say.
Age
The majority of respondents are aged between 41 and 50, although responses were
fairly evenly distributed across those aged 26 to 60. Fewer responses were received
from those in the lower and higher age categories.
Table 3 Responses by age10
Age Number of respondents Percentage
Under 17 1 0.01% 17-24 305 5.2% 25-34 1,237 21.2% 35-44 1,320 22.7% 45-54 1,771 30.4% 55-64 907 15.6% 65-74 58 1.0% 75+ 3 0.05% Prefer not to say 223 3.8% Total 5,825 100%
9 5,825 respondents completed the demographic section of the questionnaire
10 Based on a total of 5,825 responses

OFFICIAL
9
OFFICIAL
Ethnicity
The majority of respondents described their ethnicity as White (79.9%). The
remaining 20.1 per cent described their ethnicity as Black (5.3%), Asian (5.1%) and
Mixed (2.3%) or selected Prefer not to say11 (7.4%).
Disability
200 (3.5%) individuals reported that they considered themselves to have a disability.
The majority of respondents – 5,292 (91.3%) – did not consider themselves to have
a disability. A further 304 respondents (5.2%) selected Prefer not to say12.
Sexual orientation
The majority of respondents described their sexual orientation as Heterosexual
(79%). The remaining respondents describe their sexual orientation as Gay/Lesbian
(5.6%), Bisexual (2.1%) and Other (1.5%). 11.8% selected Prefer not to say.13
11
Based on a total of 5,801 responses; 826 individuals did not respond to this question 12
Based on a total of 5,796 responses; 831 individuals did not respond to this question 13
Based on a total of 5,761 responses; 866 individuals did not respond to this question
5.1 5.3 2.3
79.9
7.4
Asian Black Mixed White Prefer not to say

OFFICIAL
10
OFFICIAL
Religion
The majority of respondents described their religion as Christian (42.9%) or not
having a religion (39.5%). 8.4% of respondents selected the Prefer not to say option.
Table 4 Responses by religion
Religion Number of respondents Percentage
Buddhist 31 0.6% Christian 2,491 42.9% Hindu 55 0.9% Jewish 12 0.2% Muslim 211 3.6% No religion 2,296 39.5% Other 208 3.6% Sikh 17 0.3% Prefer not to say
485 8.4%
Total 5,806 100%
Job role
Respondents were asked to select or provide a description of their job role. The
majority of respondents selected Train Guard/Manager (15.5%), followed by
Platform/Train Dispatch (13.2%) and Driver/Driver Manager (8.8%). These are all
frontline roles and so help to highlight the experiences of rail staff who have regular
contact with the public and police.
2.1% 5.6% 1.5%
79.0%
11.8%
Bisexual Gay/Lesbian Other Heterosexual Prefer not to say

OFFICIAL
11
OFFICIAL
Table 5 Responses by job role
Job role Number of respondents Percentage
Train Guard/Manager 911 13.7% Administration/Office Staff 757 11.4% Driver/Driver Manager 720 10.9% Platform/Train Dispatch 548 8.3% Other (please specify) 539 8.1% Gateline 510 7.7% Ticket Office/Travel Advisor 380 5.7% Revenue Protection 333 5.0% Station Manager (including Assistant Manager)
320 4.8%
Operations 223 3.4% Retail Staff 214 3.2% Catering 196 3.0% Network Rail - Network Operations 186 2.8% Engineer/Mechanic 169 2.6% Control Room Staff 141 2.1% Maintenance 140 2.1% Security 89 1.3% Train Presentation 70 1.1% RSAS Accredited Personnel 62 0.9% Shunter 44 0.7% Facilities 31 0.5% Community Ambassador 23 0.3% Network Rail - Network Rail Telecoms 11 0.2% Sub-Contractors 10 0.2% Total 6,627 100%
Other responses
When analysing those who selected the Other option, the majority said they are in a
customer services role (72). A number of respondents said they are involved in
project management and project-based roles or are safety managers.
Length of employment
Approximately a quarter of respondents (23.6%) reported to have worked for their
TOC or FOC for 11 to 20 years. A good response was received from respondents
across all other employment brackets.

OFFICIAL
12
OFFICIAL
Table 6 Responses by length of employment
Length of employment Number of respondents Percentage
Less than one year 797 12% 1-2 years 1,270 19.2% 3-6 years 1,384 20.9% 7-10 years 870 13.1% 11-20 years 1,562 23.6%
21 years or more 744 11.2%
Location
Using the information provided by respondents to the question “In which station,
depot or area of the country are you based?” responses were categorised by
location into our three divisions – B, C and D Division14.
Responses received by BTP division
14
The relevant division was indeterminable or no response was given to the question in 207 cases, therefore percentages are based on a total of 6,420 responses
580 (9%)
2,123 (33.1%)
3,717 (57.9%)

OFFICIAL
13
OFFICIAL
Good Neither Poor Don't know
6. Personal security
Overall, how would you rate your personal security while at work?
Respondents were asked to indicate on a scale how they would rate their personal
security while at work. For the purpose of analysis, positive responses and negative
responses were combined. The majority of respondents – 61.8 per cent – rated their
personal security positively as either Very good or Good. 21.1 per cent rated their
personal security as Neither good or poor and 16.4 per cent rated their personal
security as Very poor or Poor. A further 48 respondents (0.8%) selected Don’t know.
This question has been asked each year since 2014 in order to provide a
comparable rating. In the Rail Staff Survey 2016, 64.9 per cent of respondents rated
their personal security positively as either Very good or Good based on a sample of
5,833 respondents. In 2015, 64.8 per cent of respondents gave a positive rating,
based on a sample of 3,742 respondents. The percentage of respondents rating their
personal security positively has decreased by 3.1 percent since 2016, however the
number of responses has increased every year since the inception of the survey.
3,819 (61.8%)
1,304 (21.1%)
1,015 (16.4%)
48 (0.8%)

OFFICIAL
14
OFFICIAL
Table 7 Personal security percentages for 2015, 2016 and 2017 Rail Staff Surveys
Personal security 2015 2016 2017
Good 64.8% 64.9% 61.8%
Neither good nor poor 21.6% 20.5% 21.1%
Poor 13.3% 14% 16.4%
Don’t know 0.3% 0.6% 0.8%
Personal security by TOC and FOC
Looking at responses to the Personal Security question by TOC/FOC/NWR allows
for a comparative analysis of the ratings, and helps to identify any organisations who
report their personal security particularly positively or negatively. This can assist with
identifying best practice, and any areas for improvement.
Tables 8 and 9 provide a breakdown of responses to the Personal Security question
by TOC/FOC/NWR15 in the 2017 and 2016 surveys. Several organisations are not
included in this analysis due to a low response rate16. Responses from rail staff who
gave Other as a response to the question that asked which company they work for
were also omitted.
More than 70 per cent of respondents from GB Railfreight, MTR Crossrail,
Freightliner, Network Rail and Deutsche Bahn responded positively to the Personal
Security question. DB Cargo, C2C, GWR, London Midland, Virgin Trains East Coast
and Abellio Greater Anglia also achieved above the average positive response of
61.8 per cent. This is broadly similar to findings from the Rail Staff Survey 2015
where many of the FOCs achieved high percentages of employees responding
positively. C2C has seen the biggest increase in respondents rating their personal
security positively – 68.4% in 2017, compared with 60.7% in 2016. Great Western
Railway, Abellio Greater Anglia and Network Rail staff all rated their personal
security above the average position in 2016 and 2017. It may be worth investigating
the practices of TOCs/FOCs whose employees responded particularly positively over
both years to identify examples of best practice.
15
The blue line in the table represents the average, positive response – 61.8% 16
For the purpose of this analysis, low response was defined as fewer than 50 respondents

OFFICIAL
15
OFFICIAL
Table 8 Personal security by TOC/FOC/NWR in 2017
Train and Freight Operating Company
Good Neither Poor Don’t know
Total responses
GB Railfreight 83.9% 13.7% 2.5% - 161 MTR Crossrail 78.7% 10.6% 8.3% 2.3% 216 Freightliner 76.9% 16.9% 6.2% - 65 Network Rail 76.8% 16.0% 7.0% 0.2% 357 Deutsche Bahn 72.2% 16.7% 11.1% - 54 DB Cargo 68.7% 20.4% 10.9% - 147 C2C 68.4% 25.5% 6.1% - 98
Great Western Railway 66.4% 18.5% 13.7% 1.4% 292 London Midland 62.9% 24.3% 12.9% - 70 Virgin Trains East Coast 62.5% 21.7% 15.8% - 240 Abellio Greater Anglia 62.0% 21.8% 16.2% - 321
Arriva Trains Wales 60.6% 22.8% 15.8% 0.8% 241 First Transpennine Express 60.3% 17.9% 21.2% 0.7% 151 Govia Thameslink Railway 60.1% 21.8% 17.2% 0.9% 780 South West Trains 58.8% 23.4% 17.7% 0.2% 560 Arriva Rail London 57.3% 20.9% 21.8% - 110 Chiltern 57.3% 27.1% 10.4% 5.2% 96 Transport for London 56.5% 22.6% 20.5% 0.4% 727
Cross Country 56.2% 21.9% 19.7% 2.2% 274 Virgin Trains 54.7% 25.0% 18.8% 1.6% 128 ScotRail 53.8% 21.1% 24.3% 0.8% 247
Northern 50.0% 27.6% 22.4% 170 East Midlands Trains 49.7% 21.0% 26.6% 2.8% 143 Southeastern 48.6% 28.6% 22.3% 0.6% 175
Table 9 Personal security by TOC/FOC/NWR in 2016
Train and Freight Operating Company
Good Neither Poor Don’t know
Total responses
Freightliner 84.9% 11.3% 3.8% - 106 Chiltern Railways 76.1% 17.9% 6% - 117 London Overground 76% 12% 12% - 50 Network Rail 76% 17.4% 5.8% 0.8% 242 GB Railfreight 71.6% 21.6% 6% 0.9% 116 TfL Rail 70.7% 12% 17.3% - 75
CrossCountry 70.4% 20.4% 8.3% 0.9% 108 South West Trains 70.2% 19.7% 9.9% 0.2% 878 Abellio Greater Anglia (including Stansted Express)
68.8% 14.7% 16.1% 0.4% 224
Great Western Railway 67.3% 19.2% 12.3% 1.2% 407
Southern 63.3% 19.2% 17% 0.5% 973 Great Northern 63.1% 23.8% 11.9% 1.2% 84
OFFICIAL
16
OFFICIAL
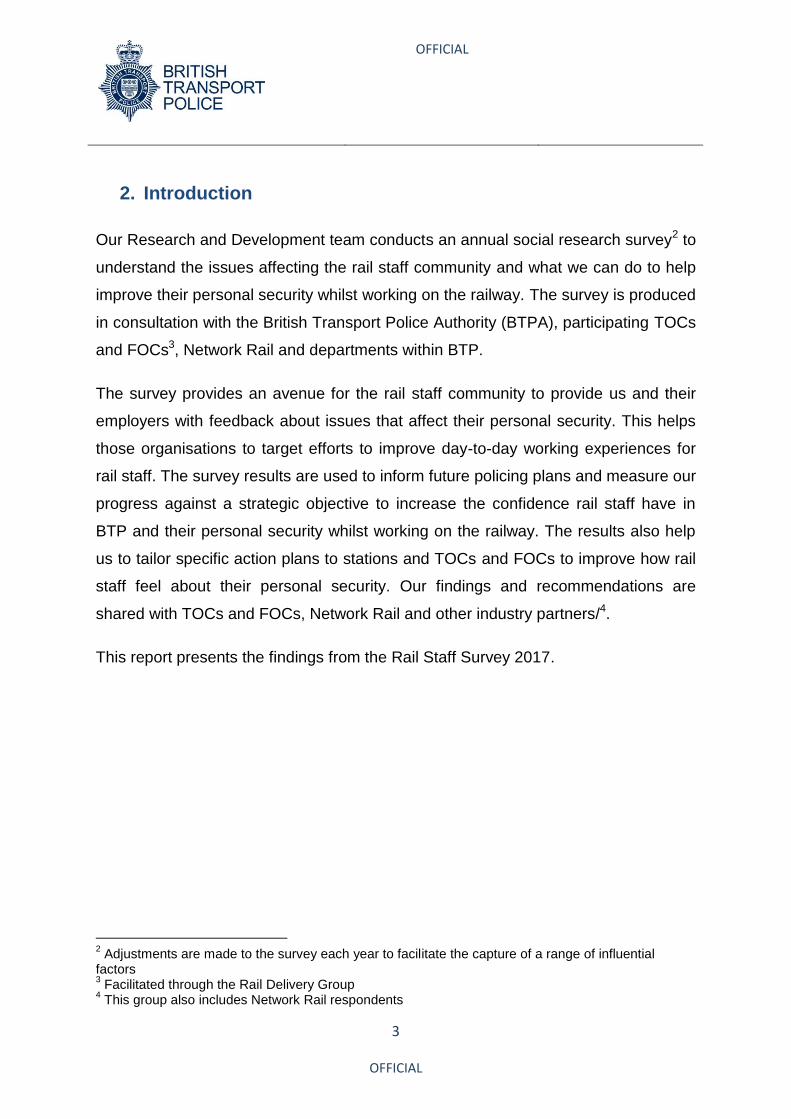
ScotRail 62.6% 20.3% 16.8% 0.3% 286 First TransPennine Express 62.4% 20.2% 16.5% 0.9% 109 Thameslink 62% 26% 9% 3% 100 London Midland 61.6% 26.7% 11.6% - 86 c2c 60.7% 23.1% 14.5% 1.7% 117
East Midlands Trains 60.2% 21.4% 17.5% 1% 103 Virgin Trains East Coast 60.2% 22.2% 16.5% 1.1% 369 Northern 58.8% 24.9% 15.7% 0.6% 357
Merseyrail 58.6% 17.20 22.4% 1.7% 58 Virgin Trains 58.5% 27.1% 14.4% - 118 Transport for London 58.1% 24.6% 16.7% 0.6% 341 Arriva Trains Wales 55.1% 23.2% 20.3% 1.4% 69 Southeastern 46.5% 27.3% 26.2% - 172
Personal security by job role
Identifying job roles in which personal security is reported particularly positively or
negatively helps to target interventions, communication activities and resources. Rail
staff whose roles are public facing tend to report their personal security less
positively. Many of the roles for which the personal security percentage is below the
overall positive response of 61.8 per cent involve a high level of interaction with the
public (for example, train guard/managers, gateline and retail staff). There are,
however, some exceptions. Rail staff in security roles or those who have been
through the Railway Safety Accreditation Scheme (RSAS) reported higher levels of
personal security (73.5% and 71.0% respectively). This suggests that frontline staff
who have received additional training feel more secure at work. Those working in
Operations and Catering show the biggest differences compared with the previous
year’s survey – 67.5% of respondents from Operations rated their personal security
positively this year compared with 78.6% last year, whilst 56.1% of respondents
working in catering rated their personal security positively compared with 66.2% in
last year’s survey.
OFFICIAL
17
OFFICIAL
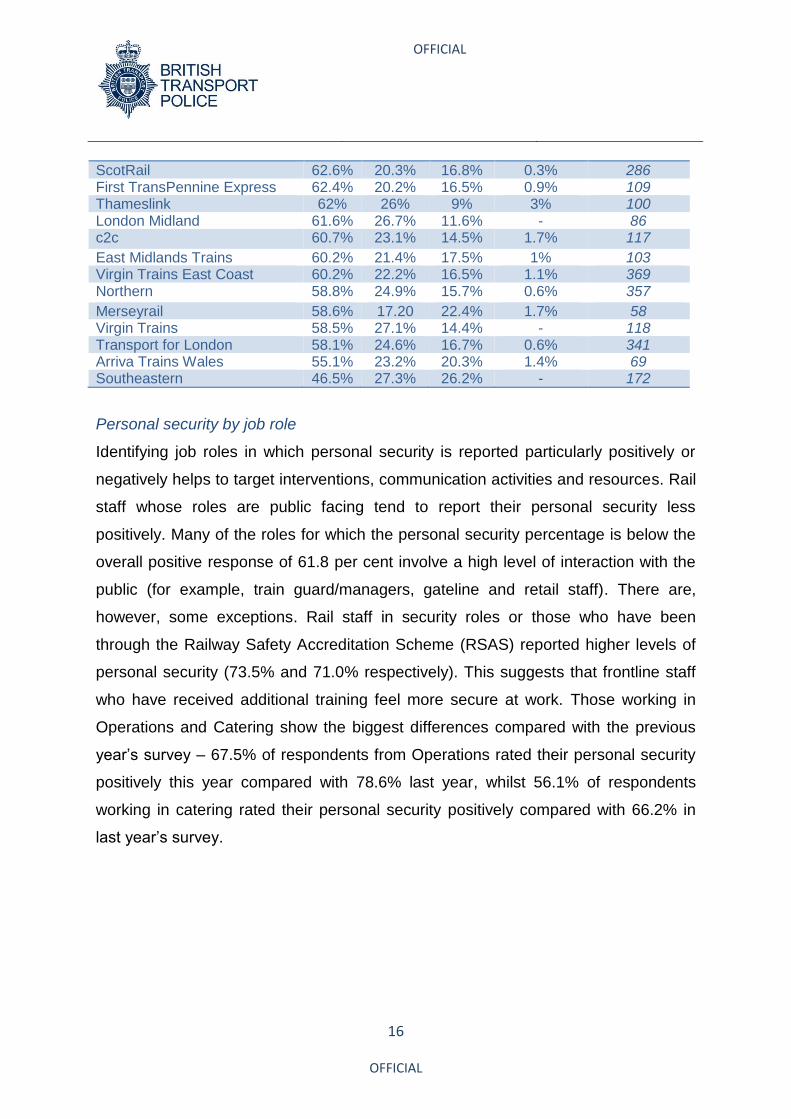
Table 10 Responses to the personal security question by job role
Job role Good Neither Poor Don’t
know
Total
Administration/Office Staff 89.5% 8.3% 2.1% 0.1% 676 Control Room Staff 87.0% 11.5% 1.5% - 131 Facilities 86.2% 10.3% 3.4% - 29 Network Rail - Network Rail Telecoms 80.0% 20.0% - - 10 Network Rail - Network Operations 76.8% 14.3% 8.3% 0.6% 168 Engineer/Mechanic 76.4% 18.1% 4.9% 0.7% 144 Security 73.5% 12.0% 13.3% 1.2% 83 Shunter 72.5% 20.0% 7.5% - 40 RSAS Accredited Personnel 71.0% 12.9% 16.1% - 62 Community Ambassador 70.0% 10.0% 20.0% - 20 Train Presentation 69.2% 15.4% 15.4% - 65 Operations 67.5% 16.3% 15.3% 1.0% 209 Maintenance 66.4% 20.8% 12.0% 0.8% 125
Station Manager (including Assistant Manager)
60.5% 21.6% 18.0% - 306
Ticket Office/Travel Advisor 59.7% 21.9% 17.5% 0.8% 365 Retail Staff 58.0% 27.0% 14.5% 0.5% 200 Driver/Driver Manager 57.8% 26.1% 14.6% 1.5% 678 Catering 56.1% 24.4% 18.9% 0.6% 180 Platform/Train Dispatch 51.0% 27.2% 21.1% 0.8% 522 Revenue Protection 50.9% 24.1% 24.7% 0.3% 320 Sub-Contractors 50.0% 50.0% - - 10 Gateline 46.5% 25.6% 26.6% 1.4% 493 Train Guard/Manager 43.6% 27.3% 28.4% 0.7% 864
Personal security by demographic characteristics
We analysed whether perceptions of personal security varied by demographic
characteristics. With regard to gender, some differences were found in how
respondents rated their personal security as either Very good or Good; with 66.3% of
female respondents rating their personal security positively, compared with 61.3% of
men.
Overall, respondents in lower age brackets responded most positively and – with the
exception of respondents aged 65 to 74 - 67.2% responded positively (in last year’s
survey 81.3% of those aged 66 and over responded positively). The highest

OFFICIAL
18
OFFICIAL
percentage of respondents rating their personal security positively was seen in those
aged between 17 and 24.
When looking further into respondents’ ethnicity and religion and their perceptions of
their personal security, the percentage of respondents rating their personal security
as either Very good or Good is broadly the same.
In terms of respondents’ sexual orientation and their perceptions of their personal
security, there are some differences between those identifying as Bisexual (63.9%),
Gay/Lesbian (59.7%) and Heterosexual (63.8%).
58 per cent of respondents who reported having a disability rated their personal
security positively compared to 63.1 per cent of respondents who didn’t report having
a disability.
Personal security by location
We analysed whether rail staff perceptions of personal security varied across
locations when categorised against our divisions. We found very little difference
between the percentage of positive responses received from respondents in B, C
and D Divisions; 60.8, 63.2 and 62.2 per cent respectively.

OFFICIAL
19
OFFICIAL
What, if anything, could be done to improve your personal security
at work?
Respondents were asked if anything could be done to improve their personal
security. We conducted a thematic analysis on the 3,292 responses we received to
this question to deepen our understanding of the factors that affect perceptions of
personal security.
From the 3,292 responses received, these themes emerged
Policing activity
Crime
Communication
Technology
Environment
Partnership working
Conflict management training
Transport-specific feedback
Policing activity
Respondents identified policing activity and how we deploy our officers as areas for
improvement that would increase their perceptions of their personal security. They
said faster response times, more officers patrolling stations and trains, higher
visibility and presence of BTP police officers, and reducing the practice of lone
working whilst on duty (for rail staff and BTP officers) would lead to improvements in
how they feel about their personal security at work. The issue of lone working for rail
staff is a more TOC focused concern, and necessitates relevant actions from TOC to
alleviate the practice of lone working to increase staff feelings of personal security.
Respondents said there should be more BTP police officers on duty at night and

OFFICIAL
20
OFFICIAL
weekends and when crimes are known to happen more often. They also said that
increased police visibility at smaller stations would improve their perception of their
personal security and act as a deterrent against crime. Alongside police presence
and visibility, respondents said it would improve how they feel about their personal
security if they see BTP police officers travelling on trains and between stations so
as to deter crime whilst travelling as opposed to solely at and around stations.
Respondents said that more BTP police officers available and out patrolling the
stations and trains would have the biggest impact on their perceptions of their
personal security at work. Respondents felt there needed to be more officers on
duty, particularly late at night and weekends.
A number of respondents said that increasing the use of stop and search would help
to improve their perceptions of their personal security at work. This included drugs
and weapons searches, alongside more police patrols.
Increase visibility at outer stations in London area with later patrols
Have a bigger BTP presence on Friday/Saturday evenings and
nights
More officers at stations and more officers available to respond
quicker when incidents occur. Too few officers trying to cover too huge
an area in my opinion
More BTP mobile on trains
More police patrols and drug and weapon searchers

OFFICIAL
21
OFFICIAL
Crime
How we manage criminal behaviour, with particular reference to antisocial behaviour
and fare evasion, was highlighted by respondents as something that affects how
they feel about their personal security at work. They identified concerns about less
serious criminal behaviour, including alcohol use, fare evasion and antisocial
behaviour, and suggested that we should proactively challenge this behaviour and
take tougher action. Respondents also expressed a desire for BTP officers to be on
patrol during events such as football matches and rugby tournaments, as these can
be times when rail staff are less confident about their personal security. Patrolling on
board trains was also discussed as important in providing a visible presence against
criminality during events. A number of respondents suggested enforcing railway
byelaws more stringently as a way of reducing antisocial behaviour.
Communication
Another theme that emerged was the desire for respondents to see more effective
communication from BTP. In particular, they said they want easier ways to contact
us if needed, more engagement activities with staff and visits from local officers, and
better advertisement of BTP and information aimed at deterring people from
criminality. Respondents felt that posters and other material explaining that those
who abuse rail staff will be prosecuted, notices about alcohol not being allowed on
Stop ticketless passengers traveling on the railway who just
want to cause trouble and loiter on railway property
More BTP on risk trains such as football, Fri/Sat nights, rugby etc.
Non-paying youths who cause disruption dealt with properly instead
of being allowed to continue their antisocial behaviour repeatedly
BTP at barriers refusing entry to those too intoxicated

OFFICIAL
22
OFFICIAL
Night Tubes and CCTV being in operation, would reduce instances where criminality
happens.
Respondents said we should provide them with more information about what we are
doing and this could be used in briefings and for internal briefings. They said this
would increase their awareness of BTP and understanding of how we are tackling
crime. They also said it should be easier to contact BTP if needed, through better
checkpoints, having mobile phone numbers for those on duty at their station, and
simpler ways of communicating with and reaching us. This links into section 8 of this
report, which details respondents’ views on their preferred methods of
communication. Email and newsletters were identified as the ideal methods of
communication, and therefore using these to communicate with rail staff may provide
a more efficient and effective way of communicating.
Direct mobile number to officers on duty, to get simple advice about
security issues that do not need a 999 answer
Posters informing abuse will not be tolerated and prosecution sought
Ongoing engagement with staff to ensure awareness More presence of officers, greater
input from BTP for staff briefing/training materials

OFFICIAL
23
OFFICIAL
Technology
An increase in BTP-specific and TOC-controlled technology emerged as a theme
from the free text responses we received. Respondents identified more CCTV and
body-worn video cameras as a means of improving their personal security whilst at
work, and suggested installing knife arches in some locations to reduce knife crime.
Respondents felt that more CCTV on trains and platforms, with better coverage and
improved quality, would act as a deterrent to those committing crime.
Environment
Another emerging theme concerns the environment rail staff work in and
adjustments that could be made to make it feel safer and improve personal security.
For instance, respondents suggested employing more security guards, implementing
greater identification checks on staff working at the stations, enforcing locked doors
and secure areas, and providing staff with personal protection devices, such as
personal attack alarms. An improvement in the fencing and perimeters around some
stations was also discussed.
Knife arches and drug dogs
Body worn cameras are being tested by REOs and we would benefit from wearing them as
well
More CCTV cameras should be installed, there is limited CCTV footage available on the platform areas, and they are not
often patrolled by BTP either
More random ID checks on railway and retail staff at the
station
Could be more security officers
Security at site perimeters is poor and regular trespassing takes place with criminal damage
happening on occasions
All staff to have personal alarms

OFFICIAL
24
OFFICIAL
Partnership working
Respondents said that more collaborative working between us and the industry could
lead to rail staff safety and their working environment being improved. They said
further support and visits from local BTP police officers would be beneficial. They
also said that listening to staff suggestions more and providing further support to
staff would also be beneficial. Respondents felt this could be achieved in a number
of ways: increased police presence to deter crime and provide reassurance; support
when staff are assaulted or verbally abused by passengers; and support during
events and on trains.
Conflict management training
Respondents highlighted the benefits of implementing conflict management training
and personal safety training, which could improve their perceptions of their personal
security at work. They suggested self-defence classes would help, as well as advice
on how they can diffuse situations in the most effective way. They said they would
like to have this training delivered by BTP officers. Alongside this, respondents said
clearer and more concise guidance on legalities and how and when to support our
officers would be helpful.
More BTP train patrols and joint working
Better relationship with BTP neighbourhood team
More support from senior management and BTP
I would like to see some more training on how to deal with security issues. How to react, how can we feed into
helping as best we can the police and emergency services and the public
Guidance on can and can’t do's and understand self defence

OFFICIAL
25
OFFICIAL
Transport-specific feedback
Respondents said they perceived the police presence during Night Tube hours in
London to be low. They said BTP should implement more dry trains on the rail
network, limiting the consumption of alcohol. They suggested that this would reduce
instances of antisocial behaviour, particularly during football matches and other
events.
There was minimal feedback from respondents who work for FOCs, however when
responses could be related to FOCs, respondents said there wasn’t much more that
could be done to improve their personal security at work. Some respondents
suggested they would like more CCTV and lighting in freight yards, and a higher
visible police presence at freight locations.
Better policing on Night Tube Dry trains at certain routes
Hard to say, maybe more lighting and CCTV in the freight yards. More
visible police presence at freight locations

OFFICIAL
26
OFFICIAL
7. Rail staff relationships with BTP
Statements
Respondents were asked whether they agreed or disagreed17 with a series of
statements exploring their relationship with and perceptions of BTP. The majority of
respondents felt we would treat them with respect and would treat staff fairly
regardless of who they are – 84.8 and 82.1 per cent respectively. This suggests that
respondents have a good relationship us and perceive our police officers to be
respectful. However, respondents are less confident that we would be available
when needed whatever the time of day; 34.2 per cent agreed and 38.2 per cent
disagreed with this statement. Respondents are also less certain that we could be
relied on to respond quickly to emergencies on the railway (45.5 per cent agreed
with this statement). This suggests that respondents’ overall perceptions of us are as
a protective organisation that will act in a positive manner when engaging, yet they
are not as confident that we are available to respond when they need us.
17
Options provided: Strongly agree, Agree, Neither agree or disagree, Disagree, Strongly disagree, Not applicable/ Don’t know. These have been combined to produce the results.
84.8 9.2 2.9 3.1
3. If I had contact with a BTP officer they would treat me with respect
45.5 23.3 27.1 4.2
Agree Neither agree or disagree Disagree Not applicable/ Don't know
1. I can rely on BTP to respond quickly to emergencies on the railway
34.2 23.9 38.2 3.7
Agree Neither agree or disagree Disagree Not applicable/ Don't know
2. I feel that BTP are available when needed whatever the time of day

OFFICIAL
27
OFFICIAL
60.8 per cent of respondents agreed that BTP understand the issues that affect staff
at my station/ on my route. A lower percentage agreed that BTP is doing enough to
prevent crime on the railways (39.7%) and that BTP is dealing with the issues that
affect staff at my station/ on my route (40.3%). In response to the statement BTP can
be relied upon to be there when you need them, 39.7 per cent agreed, 24.7 per cent
neither agreed or disagreed, and 32.3 per cent disagreed.
84.8 9.2 2.9 3.1
Agree Neither agree or disagree Disagree Not applicable/ Don't know
3. If I had contact with a BTP officer they would treat me with respect
60.8 21.2 13.1 4.8
Agree Neither agree or disagree Disagree Not applicable/ Don't know
5. I feel that BTP understand the issues that affect staff at my station/ on my route
82.1 11.3 4.1 2.5
Agree Neither agree or disagree Disagree Not applicable/ Don't know
4. I feel that BTP would treat staff fairly regardless of who they are

OFFICIAL
28
OFFICIAL
40.3 31.2 21.1 7.4
7. BTP is dealing with the issues that affect staff at my station/ on my route
40.3 31.2 21.1 7.4
Agree Neither agree or disagree Disagree Not applicable/ Don't know
7. BTP is dealing with the issues that affect staff at my station/ on my route
39.7 31.4 24.9 3.9
Agree Neither agree or disagree Disagree Not applicable/ Don't know
6. I feel that BTP is doing enough to prevent crime on the railways
39.7 24.7 32.3 3.3
Agree Neither agree or disagree Disagree Not applicable/ Don't know
8. I feel that BTP can be relied upon to be there when you need them

OFFICIAL
29
OFFICIAL
8. Communication with BTP
Communications
How do you currently get news and updates from BTP?
Respondents were presented with a list of communication channels, and asked to
identify how they currently receive news and updates from us. Around a third of
respondents (32.7%) suggested they don’t get updates from BTP but would like to.
For those who do receive communications from BTP, my company newsletter (22%)
and my company intranet (23.3%) were the most common communication channels
identified. 15.3% of respondents receive news and updates from BTP via BTP
officers/staff. A further 7.6% suggested they were not interested in updates from
BTP.
Communication channels are a new theme in the
survey this year. Often, the Rail Staff Survey
identifies how we communicate with rail staff and
make stakeholders aware of our priorities,
operations and services, as an area for
improvement. In previous years, rail staff have
highlighted increased communication as a means
of improving personal security, and the majority of
respondents have suggested they are unaware of
our priorities in relation to rail staff. Analysing how
rail staff currently receive updates from BTP, and
whether there are any alternative forms of
communication that could be more efficient, help
stakeholder engagement, personal security and
collaborative work, between BTP and rail staff.

OFFICIAL
30
OFFICIAL
Of the 5.8% of respondents who selected the Other (please specify) option, the
majority suggested email from their management was how they receive
communication from us. A number of respondents also suggested they get their
news and updates about BTP from social media, including Facebook and Twitter.
How would you like to hear news and updates from BTP?
Respondents were asked how they would like to hear news and updates from BTP
and given the option to share free text comments about this. This allowed us to
gather evidence about how we could communicate with and relay information to rail
staff. The top five channels identified by respondents are listed below (a full list of all
channels can be provided on request).
22.0%
5.4%
4.0%
7.6%
23.3%
11.4%
7.0%
15.3%
8.7%
32.7%
5.8%
My companynewsletter
Meetings withBTP
BTP's website I am notinterested inupdates from
BTP
My companyintranet
Police officerson patrol
TV, radio,newspapers,
online
From BTPofficers/staff
BTP's socialmedia
I don't getupdates from
BTP but Iwould like to
Other (pleasespecify)

OFFICIAL
31
OFFICIAL
Newsletter
A number of respondents felt the best way of receiving news and updates from us is
by newsletter. Respondents identified online and paper versions as a valuable
source of information. Respondents suggested information about BTP could be
included in existing company newsletters left in messrooms and on noticeboards
fortnightly or monthly or a BTP-specific one provided with local information and
updates.
Posters
Posters were identified by respondents as a good way of providing news and
updates about BTP. Respondents said they could be distributed through depots,
trains, mess rooms, staff noticeboards and staff pigeon holes. They suggested
existing posters are outdated and should be reviewed and replaced.
Communicating updates and news via email is the channel most identified by
respondents as the preferred method of engagement. Emails can be easily shared
across teams through management and senior staff. Respondents suggested the
frequency of our updates is low and using email as a method of communication
could alleviate this and help provide timely updates. Respondents said localised
updates would be useful and identified email as a good means of distributing an
online newsletter.
‘Newsletter to station with local BTP information’
‘Newsletters are really good, our internal comms team could send an update out,
they do this with GWR’.
‘Posters in mess rooms that are kept up to date could be a good idea. The one at Lancaster is over a year out of date’.
‘Company briefs posters in depot and on train showing success and convictions’

OFFICIAL
32
OFFICIAL
Meetings with BTP
Respondents said regular meetings with us would be positive in helping to
communicate key messages and updates, whilst also building relationships between
rail staff and our police officers. They said this would enable our local police officers
to update staff on local news, and then further more generic newsletters or emails
could be distributed to supplement these updates. Within these meetings,
respondents said it would be useful to hear about crime data, crime reduction
initiatives and how rail staff and BTP can work collaboratively to tackle mutually
agreed ‘topics of concern’.
Social media
Social media was suggested by respondents as a useful means of communicating
updates and news about BTP to a wide-ranging audience. Facebook and Twitter
were the two most commonly suggested social media platforms; however some
respondents also suggested making use of Yammer where it is used by TOCs and
FOCs.
‘An email newsletter from BTP would be good, detailing events, past operations and
staff interviews’.
‘Flash Headlines, brief pointed emails that are relevant to my route’.
‘Meetings to deal with crime locally and have plans in place to deal with them’
‘At regular meetings with at least two staff members present from each role within
the station. Then a monthly newsletter handed out to staff’

OFFICIAL
33
OFFICIAL
Priorities
Are you aware of the current BTP priorities in relation to rail staff?
The majority of respondents – 80.5 per cent – said they are not aware of our
priorities in relation to rail staff. 706 respondents did not respond to this question.
This strongly suggests that better communication between BTP and rail staff should
be considered, especially in relation to communication about our priorities. Joint
communication strategies between BTP and TOCs/FOCs will allow media materials
and online publications to be disseminated appropriately. Local BTP teams need to
continue to liaise with their local TOCs/FOCs, with this being complemented by
supplementary communication materials. The majority of respondents in the 2016
survey (73.1%) also suggested they weren’t aware of BTP priorities.
1,154 (19.5%) 4,767 (80.5%)
57%
80.3%
No Yes
When comparing ratings of personal security
for respondents who are aware of our priorities
and those who are unaware, there is a marked
difference in the number of respondents rating
their personal security positively. For those not
aware of BTP priorities, 57% said their
personal security is either Very good or Good.
For those aware of our priorities, 80.3% said
their personal security is either Very good or
Good. This suggests increasing awareness of
our priorities to rail staff may help to improve
their perceptions of their personal security at
work.

OFFICIAL
34
OFFICIAL
Performance
How good a job do you think British Transport Police is doing at
your station or on your route?
46.7 per cent of respondents said we are doing an Excellent or Good job at their
station or on their route. Just over a third of respondents – 35 per cent – said we are
doing a Fair job. 18.3 per cent said we are doing a Poor or Very poor job at their
station or on their route. Percentages are displayed in the chart below. Compared
with last year’s figures, 50.6% of respondents said BTP were doing an Excellent or
Good job, 34.1% a Fair job and 15.3% a Poor or a Very poor job.
5.5%
12.8%
35%
38.1%
8.6% Excellent
Good
Fair
Poor
Very Poor

OFFICIAL
35
OFFICIAL
7.4
29.4
3.9 4 5 2.6 6.7
11.5
40.2
5.5 14.9
25.1
5.2 13.5
28.8
9. Crime-related issues
Crime-related issues
In your opinion, how much of a problem are the following where
you work?
Respondents were presented with a list of possible crime, disorder and security-
related concerns and asked how much of a problem they considered these to be at
their place of work. The concern that the largest proportion of respondents reported
to be a ‘serious problem’ was fare evasion (40.2%). More than a quarter of
respondents reported alcohol-related disorder, antisocial behaviour and staff
abuse/assault to be serious problems – 28.8, 29.4 and 25.1% respectively.
A proportion of respondents reported these concerns to be a ‘moderate problem’:
antisocial behaviour (39.9%); alcohol-related disorder (35.1%); and fare evasion
(32%). Staff abuse/assault and crime-related disruption were also considered to be a
‘moderate problem’ by 35.2 and 32.3 per cent of respondents respectively. The
graphs below show the percentage of respondents who reported the concerns to be
either a ‘serious’ or ‘moderate’ problem at their place of work.
Serious problem

OFFICIAL
36
OFFICIAL
25.1 25.2
39.9
14.6 15 17.1 9.4
22.1 24.3 32 32.3 35.2
15.8 23.2
35.1
Moderate problem
Serious crime-related issues by division
We analysed responses to identify differences in how rail staff rate serious problems
in crime, disorder and security issues in each of our divisions. Fare evasion was the
issue that saw the highest percentage of respondents from B and C Divisions saying
it is a serious problem (44.9% and 34.1% respectively). In D Division, the issue most
identified by respondents as a serious problem is alcohol-related disorder (34.9%). A
larger proportion of respondents in C (15.6%) and D Divisions (16.1%) said football-
related disorder is a serious problem compared with those in B Division (8.5%). Theft
of personal property and drug dealing and using were identified by a higher
percentage of respondents in B Division than in either C or D Divisions. 7.8% of
respondents in B Division said theft of personal property is a serious issue compared
with 5.2% in C Division and 3.4% in D Division.
The lowest percentage of respondents said sexual offences are a serious problem in
all divisions. 3.3% of respondents in B Division, 1.5% of respondents in C Division
and 1.6% of respondents in D Division said it is a serious problem.

OFFICIAL
37
OFFICIAL
Ratings of crime-related issues by division
1. Fare evasion
2. Alcohol-related disorder
3. Antisocial behaviour
4. Staff abuse/assault
5. Crime-related disruption on
the railway
6. Football-related disorder
7. Drug dealing or using
8. Graffiti
9. Theft of personal property
10. Theft of rail property
11. Criminal damage
12. Robbery
13. Violent crime
14. Hate crime
15. Sexual offences
1. Alcohol-related disorder
2. Antisocial behaviour
3. Fare evasion
4. Staff abuse/assault
5. Football-related disorder
6. Crime-related disruption on the
railway
7. Drug dealing or using
8. Theft of rail property
9. Violent crime
10. Graffiti
11. Criminal damage
12. Theft of personal property
13. Hate crime
14. Robbery
15. Sexual offences
1. Fare evasion
2. Antisocial behaviour
3. Staff abuse/assault
4. Alcohol-related disorder
5. Drug dealing or using
6. Crime-related disruption on
the railway
7. Football-related disorder
8. Graffiti
9. Theft of personal property
10. Criminal damage
11. Violent crime
12. Hate crime
13. Theft of rail property
14. Robbery
15. Sexual offences

OFFICIAL
38
OFFICIAL
10. Freight Operating Company (FOC) analysis
We analysed responses from FOC staff to identify differences in how they feel about
their personal security and priorities for us to focus on.
Personal security
The majority of FOC respondents rate their personal security positively as either
Very good or Good – 76.1%. 16.9% of FOC staff rate their personal security as
Neither good nor poor and 7% as Very poor or Poor. Compared with how
respondents rate their personal security overall (61.8% responded positively), a
higher percentage of FOC respondents are positive about their personal security.
The table below shows a breakdown of FOC respondent’s personal security
responses.
Table 11 FOC staff perceptions of personal security
FOC Good Neither good nor poor Poor Total
DB Cargo 68.7% 20.4% 10.9% 147
Deutsche Bahn 72.2% 16.7% 11.1% 54
Freightliner 76.9% 16.9% 6.2% 65
GB Railfreight 83.9% 13.7% 2.5% 161
Total 76.1% 16.9% 7% 427
Priorities
The majority of respondents from FOCs said they are unaware of our priorities in
relation to rail staff – 86.8%. 90.9% of respondents from DC Cargo said they are
unaware of our priorities. A higher proportion of FOC respondents are unaware of
our priorities compared with the overall response rate, where 80.5% said they are
unaware of our current priorities in relation to rail staff.
Table 12 FOC staff awareness of BTP priorities
FOC Yes No Total
DB Cargo 9.1% 90.9%% 132
Deutsche Bahn 2.1% 97.9% 48
Freightliner 19.7% 80.3% 61
GB Railfreight 17.5% 82.5% 154
Total 13.2% 86.8% 395

OFFICIAL
39
OFFICIAL
13.4 8.8
0.5 5.2 1.6 0.8 2.1 1.6
9.1 10.3 13.8
3.1 7.5 4.1 7
The majority of respondents suggested their company newsletter or company
intranet would be a good way of receiving news and updates from BTP.
Crime-related issues
We analysed FOC staff responses to the question ‘In your opinion, how much of a
problem are the following where you work?’ to identify differences in what they
perceive as a problem compared with the overall responses. A higher percentage of
FOC respondents said Graffiti (13.4%) and Criminal damage (10.3%) are a serious
problem compared with the respondents overall. The graph below shows the
breakdown of the crime–related issues that FOC staff perceive to be a serious
problem.

OFFICIAL
40
OFFICIAL
Performance
How good a job do you think British Transport Police is doing at
your station or on your route?
50.6 per cent of FOC respondents said we are doing an Excellent or Good job at
their station or on their route and 40.8 per cent said we are doing a Fair job. 8.6 per
cent said we are doing a Poor or Very poor job at their station or on their route.
Percentages are displayed in the chart below.
1.3%
7.3%
40.8%
41.5%
9.1% Excellent
Good
Fair
Poor
Very poor
OFFICIAL
41
OFFICIAL
11. Comparison with 2016 Rail Staff Survey
2017 Rail Staff Survey
2016 Rail Staff Survey
The percentage of respondents rating their
personal security positively is 61.8%
The most responses were received from TfL,
Govia Thameslink Railway and South West
Trains.
The job roles with the most respondents are Train
guard/manager and Administration/office staff
The top three crime-related concerns are; fare
evasion, antisocial behaviour and alcohol-
related disorder
19.5% of respondents are aware of our priorities
The main themes emerging from the free text
comments are policing activity, crime,
communication, technology, environment,
partnership working, conflict management
training, stop and search and rail.
46.7% of respondents said we are doing either an
excellent or good job at their station/on route.
The percentage of respondents rating their
personal security positively was 64.9%
The most responses were received from Govia
Thameslink Railway, South West Trains and
Great Western Railway.
The job roles with the most respondents were Train guard/manager and Platform/Train Dispatch
Top three crime related concerns were; fare
evasion, alcohol-related disorder and
antisocial behaviour
26.9% of respondents were aware of our priorities
The main themes emerging from the question, ‘What, if anything, could be done to improve your personal security at work?’ were presence, tools, environment and actions.
50.6% of respondents said we were doing either
an excellent or good job at their station/on route.

OFFICIAL
42
OFFICIAL
12. Further analysis
Further analysis of the Rail Staff Survey data reveals weak positive correlations with
a number of the rail staff statements, crime issues and ‘how good a job do you think
BTP is doing at your station or on your route’. The test used was Kendall’s tau-b; a
statistic used to measure the ordinal association between two measured quantities.
A correlation coefficient between 0 and 0.2 indicates weak relationship; correlation
coefficient between 0.3 and 0.5 indicates a moderate relationship; and a correlation
coefficient between 0.5 and 1 indicates a strong relationship. Correlations are used
to show a measure of the strength and direction of association that exists between
two variables. All the variables tested with respondent’s feelings of personal security
showed weak positive relationships suggesting there are small correlations between
the variables. A high score on each variable represents ‘strongly agree’ and a high
score on the respondents overall satisfaction represents ‘very good’. Therefore a
positive correlation between overall satisfaction and, for example, ‘I feel that BTP are
available when needed whatever the time of day’, (.268; third cell in table 13) can be
interpreted as meaning that many of those who felt that BTP were available when
needed whatever the time of day, also felt ‘very good’ with their overall satisfaction
with BTP. The table below shows the variables tested and their correlations
coefficient with overall feelings of personal security.
Table 13 Variables and their correlation with personal security
Variable Correlation with overall satisfaction
How good a job do you think BTP is doing at your station or on your route?
.275
I can rely on BTP to respond quickly to emergencies on the railway
.231
I feel that BTP are available when needed whatever the time of day
.268
I feel that BTP is doing enough to prevent crime on the railways
.225
BTP is dealing with the issues that affect staff at my station/on my route
.200
I feel that BTP can be relied upon to be there when you need them
.255
ASB .226
Staff abuse/assault .225
OFFICIAL
43
OFFICIAL
13. Conclusions
The Rail Staff Survey 2017 received a total of 6,186 valid responses across 30
Train/Freight Operating Companies and Network Rail. This is an increase of 6.1 per
cent on 2016.
61.8 per cent of respondents rated their personal security as either Very good or
Good. It has been considered that the decrease in rail staff personal security could
be attributable to some of the events happening whilst the survey was live – the
terrorist attacks in Manchester and at London Bridge. These events can create
tension and worry, especially to those working on the rail network. There is little
variation in personal security across BTP divisions.
Respondents were asked whether they agreed or disagreed with a series of nine
statements pertaining to the activities of, and their relationship with BTP. The
majority of respondents felt that BTP would treat them with respect and would treat
staff fairly regardless of who they are – 84.8 and 82.1 per cent respectively.
However, respondents were less confident that BTP would be available when
needed whatever the time of day; 34.2 per cent agreed and 38.2 per cent disagreed
with this statement. Respondents were also less certain that BTP could be relied
upon to respond quickly to emergencies on the railway (45.5 per cent agreed with
this statement). 60.8 per cent of respondents agreed that BTP understand the issues
that affect staff at my station/ on my route. However, a much lower percentage of
respondents agreed that BTP is doing enough to prevent crime on the railways and
that BTP is dealing with the issues that affect staff at my station/ on my route
(39.7%). In response to the statements BTP can be relied upon to be there when you
need them, 39.7 per cent again agreed, 24.7 per cent neither agreed or disagreed,
and 32.3 per cent disagreed.
Respondents were presented with a list of possible crime, disorder and security
related concerns and were asked how much of a problem they considered these
activities to be at their place of work. The issues that the largest proportion of

OFFICIAL
44
OFFICIAL
respondents felt were a ‘serious problem’ at their workplace were fare evasion,
alcohol-related disorder and antisocial behaviour. These were also the issues most
often rated as a ‘moderate problem’, followed by staff assault and crime-related
disruption.
Rail staff employees play a vital role in maintaining the safe operation of the
railways. Many of the findings from the Rail Staff Survey 2017 broadly reflect the
findings from previous years’ surveys, suggesting these are consistently the high
priority areas for rail staff. The thematic analysis conducted on respondents’ freetext
comments to the question regarding their personal security, generated themes which
have surfaced on previous surveys. However in the Rail Staff Survey 2017, several
further themes emerged which may influence our policing plans in future. These
themes were categorised under the following areas: policing activity, crime,
communication, technology, environment, partnership working, conflict management
training and rail.
The feedback gathered through the Rail Staff Survey provides an invaluable insight
into the experiences of rail staff members across the country and helps to identify
where improvements can and should be made. Engaging through this medium helps
to ensure that BTP and TOCs and FOCs have a good understanding of the issues
rail staff members face and the effect these issues have on personal security and
confidence. The findings presented are encouraging and helpful and will be used to
inform policing plans and can be used by TOCs and FOCs to review the feedback
provided and target initiatives.
In order to build on the findings in this report, recommendations need to be driven at
a local and TOC/FOC level using the information to tailor specific actions plans with
the aim of increasing rail staff feelings of security.
Further information or data at a local or organisation-specific level can be provided
on request.

OFFICIAL
45
OFFICIAL
Appendix
Appendix 1 Copy of survey materials: poster
Appendix 2 Full data output (Available on request)
Appendix 1 – Copy of survey materials: poster