Embed Size (px)
Citation preview

RESEARCH ARTICLE
Thermophysical Properties ofLignocellulose: A Cell-Scale Study Down to41KZhe Cheng1, Zaoli Xu1, Lei Zhang2, Xinwei Wang1*
1. Department of Mechanical Engineering, 2010 Black Engineering Building, Iowa State University, Ames, IA,50011, United States of America, 2. Department of Foreign Language, Hubei University of Technology,Wuhan, Hubei, 430065, P. R. China
Abstract
Thermal energy transport is of great importance in lignocellulose pyrolysis for
biofuels. The thermophysical properties of lignocellulose significantly affect the
overall properties of bio-composites and the related thermal transport. In this work,
cell-scale lignocellulose (mono-layer plant cells) is prepared to characterize their
thermal properties from room temperature down to ,40 K. The thermal
conductivities of cell-scale lignocellulose along different directions show a little
anisotropy due to the cell structure anisotropy. It is found that with temperature
going down, the volumetric specific heat of the lignocellulose shows a slower
decreasing trend against temperature than microcrystalline cellulose, and its value
is always higher than that of microcrystalline cellulose. The thermal conductivity of
lignocellulose decreases with temperature from 243 K to 317 K due to increasing
phonon-phonon scatterings. From 41 K to 243 K, the thermal conductivity rises with
temperature and its change mainly depends on the heat capacity’s change.
Introduction
Lignocellulose in nature is the most abundant raw material from wood, grasses,
and agricultural residues [1]. It not only can be used as combustion fuels directly,
also can be converted to various forms of biofuels indirectly through pyrolysis or
hydrolysis [2–5]. Moreover, it has been extensively reported as filler to make
lignocellulose-based biodegradable composites [6, 7] and thermoplastic compo-
sites [8, 9].
Mettler et al. listed ten top fundamental challenges of biomass pyrolysis for
biofuels and a major challenge of them is the lack of accurate knowledge of heat
OPEN ACCESS
Citation: Cheng Z, Xu Z, Zhang L, WangX (2014) Thermophysical Properties ofLignocellulose: A Cell-Scale Study Down to41K. PLoS ONE 9(12): e114821. doi:10.1371/journal.pone.0114821
Editor: Xiao-Dong Wang, North China ElectricPower University, China
Received: June 26, 2014
Accepted: October 19, 2014
Published: December 22, 2014
Copyright: � 2014 Cheng et al. This is an open-access article distributed under the terms of theCreative Commons Attribution License, whichpermits unrestricted use, distribution, and repro-duction in any medium, provided the original authorand source are credited.
Data Availability: The authors confirm that all dataunderlying the findings are fully available withoutrestriction. All relevant data are within the paper.
Funding: Support of this work by Army ResearchOffice (W911NF-12-1-0272), Office of NavalResearch (N000141210603), and National ScienceFoundation (CBET1235852, CMMI1264399) isgratefully acknowledged. X.W. thanks the partialsupport of the ‘‘Eastern Scholar’’ Program ofShanghai, China.
Competing Interests: The authors have declaredthat no competing interests exist.
PLOS ONE | DOI:10.1371/journal.pone.0114821 December 22, 2014 1 / 17
and mass transfer properties (e.g., thermal conductivity, diffusivity) [5]. So the
thermal properties of lignocellulose are in high demand, especially the thermal
properties at the cell scale. This is because microstructure provides more details
and fundamental information about lignocellulose compared with the bulk
material that only provides an overall value of thermophysical properties. Also, for
bio-composites, thermophysical properties are those of the most important
parameters. The thermophysical properties of filled material (lignocellulose)
determine the overall thermal property of the composite together with the matrix
material. Therefore, it is of great importance to study the thermal transport in
lignocellulose at the cell scale. Such information provides the critical knowledge
base for evaluating the overall thermophysical properties of bio-composites.
Due to the importance of this topic, many researchers studied the bulk thermal
properties and their anisotropy of various forms of lignocellulose, including
wood, jute, cotton, sisal and ramie. Specifically, Yapici et al. measured the thermal
conductivity of beech, oak, fir, scots pine and chestnut. They found the thermal
conductivity of them ranged from 0.18 to 0.40 Wm21K21 and the thermal
conductivity parallel to the grain angle was a little larger than that perpendicular
to the grain angle [10]. Gupta et al. reported the thermal conductivity of
softwood, softwood bark and softwood char at 310 K as 0.1 Wm21K21,
0.2 Wm21K21 and 0.1 Wm21K21 respectively [11]. Alsina et al. studied the
thermal conductivity of hybrid lignocellulosic fabrics and obtained the thermal
conductivity of jute/cotton, sisal/cotton and ramie/cotton hybrid fabrics as
0.185 Wm21K21, 0.575 Wm21K21 and 0.555 Wm21K21 when the heat transfer
was parallel to the fabrics and 0.19 Wm21K21, 0.415 Wm21K21, 0.36 Wm21K21
when the heat flux was perpendicular to the fabrics [12]. Stankovic et al. measured
the thermal conductivity of cotton, hemp and Hemp/cotton as 0.026 Wm21K21,
0.022 Wm21K21 and 0.034 Wm21K21. They attributed the low thermal
conductivity to porous structures of these fibers [13]. In Incropera’s book, the
thermal conductivity of cotton is 0.06 Wm21K21 [14]. The variation in thermal
conductivity of cotton is due to sample-to-sample difference.
The thermal conductivity of bulk lignocellulose has been extensively studied.
However, thermal transport in lignocellulose at the cell scale (mono-layer plant
cells) has not been studied before. Even for all other cells, very few measurements
have been conducted on thermal properties at the cellular level due to great
challenges like sample’s small size and difficulty in sample handling and thermal
probing. To our best knowledge, only Park et al. measured the thermal
conductivity of single animal cells based on the three-omega method [15].
This work reports the first effort to characterize the thermal transport in
lignocellulose at the cell scale. To overcome experimental difficulties like small size
and difficult manipulation during thermal transport study, inner epidermis of
onion bulb scale is chosen in this work because it is composed of mono-layer
plant cells [16]. Thermal transport capacity measurement in lignocellulose along
single cells can be achieved by characterizing the thermal conductivity of onion
inner epidermis membrane. Moreover, the thermal transport capacity along
different directions can be evaluated to explore the anisotropic thermal
Cell-Scale Thermal Transport in Lignocellulose
PLOS ONE | DOI:10.1371/journal.pone.0114821 December 22, 2014 2 / 17

conductivity of lignocellulose at the cell scale. Our result provides pioneering
insight into micro/nanoscale scale heat transfer mechanism of biomass pyrolysis
and bio-composite. Moreover, onion inner epidermis membrane has been
extensively reported to use as soft support of crystal grown, biosensors and
enzyme immobilization [17–19]. Temperature change in the soft substrate would
affect these processes significantly. Therefore, it is of great importance to know the
substrate’s thermal properties.
In this work, we use the transient electro-thermal (TET) technique to
characterizing the thermal transport in cell-scale lignocellulose under tempera-
tures ranging from room temperature down to 20 K. Four samples of cell-scale
lignocellulose are prepared from one piece of inner epidermis of onion bulb scale
for various purposes. Two samples with different lengths are studied to evaluate
the samples’ emissivity, which is used to substrate the radiation effect in the
measurement. Another two samples are used to explore the anisotropy of energy
transport capacity along different directions. In addition, a robust method
developed by our lab is employed to determine the Lorenz number of Iridium film
on lignocellulose. This helps subtract the Iridium’s effect on sample’s thermal
diffusivity. Finally, the relation between thermal properties of cell-scale
lignocellulose and temperature are obtained and discussed.
Materials and Methods
Sample preparation
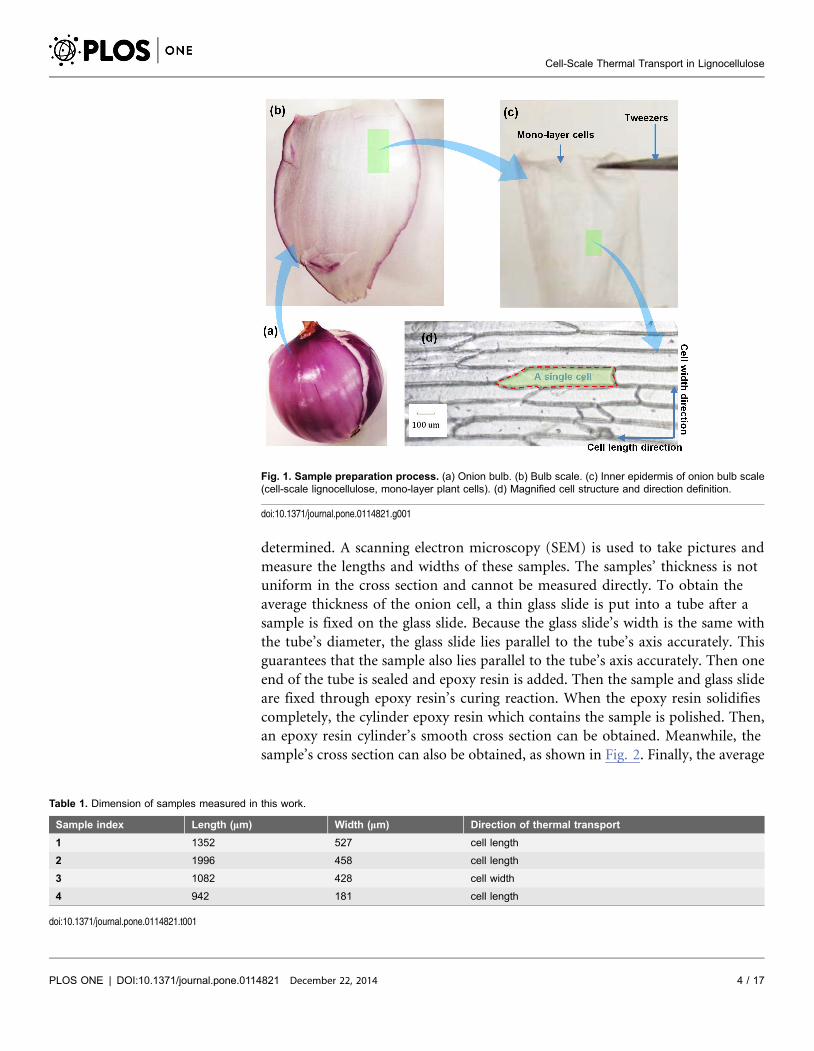
The onion strips used in this work are from inner epidermis of onion (Allium
cepa) bulb scales, which are composed of mono-layer cells. First, a small piece of
onion is torn off from an onion bulb as shown in Fig. 1. Then the membrane from
the inner side from this piece of onion is fixed to a glass slide after peeled off with
tweezers. This keeps the membrane flat when the water in onion cells evaporates
in air. Twenty four hours later, the membrane composed of mono-layer cells is
separated from the glass slide, and then cut into long strips as the to-be-measured
samples with the help of blade and optical microscope.
In this work, we prepare four samples with different lengths and cell directions
for different purposes. Specifically, Sample 1 is a short sample and its measured
energy transfer is along the cell length direction while Sample 2 is a long sample
with the same measured direction. The definition of directions is shown as
Fig. 1(d). In this figure, it is evident that the cells have an oval shape. Sample 3 has
a similar length with Sample 1 but its measured energy transfer is along the cell
width direction. Sample 4 has similar length and measured direction with Sample
1, which is prepared to determine the Lorenz number of Iridium thin film on
onion cells. These samples are prepared from the same small piece of onion
membrane, so they have similar properties. All their dimensions are summarized
in Table 1.
As important parameters in characterizing samples’ thermal diffusivity,
geometries (length, width and average thickness) of these samples need to be
Cell-Scale Thermal Transport in Lignocellulose
PLOS ONE | DOI:10.1371/journal.pone.0114821 December 22, 2014 3 / 17
determined. A scanning electron microscopy (SEM) is used to take pictures and
measure the lengths and widths of these samples. The samples’ thickness is not
uniform in the cross section and cannot be measured directly. To obtain the
average thickness of the onion cell, a thin glass slide is put into a tube after a
sample is fixed on the glass slide. Because the glass slide’s width is the same with
the tube’s diameter, the glass slide lies parallel to the tube’s axis accurately. This
guarantees that the sample also lies parallel to the tube’s axis accurately. Then one
end of the tube is sealed and epoxy resin is added. Then the sample and glass slide
are fixed through epoxy resin’s curing reaction. When the epoxy resin solidifies
completely, the cylinder epoxy resin which contains the sample is polished. Then,
an epoxy resin cylinder’s smooth cross section can be obtained. Meanwhile, the
sample’s cross section can also be obtained, as shown in Fig. 2. Finally, the average
Fig. 1. Sample preparation process. (a) Onion bulb. (b) Bulb scale. (c) Inner epidermis of onion bulb scale(cell-scale lignocellulose, mono-layer plant cells). (d) Magnified cell structure and direction definition.
doi:10.1371/journal.pone.0114821.g001
Table 1. Dimension of samples measured in this work.
Sample index Length (mm) Width (mm) Direction of thermal transport
1 1352 527 cell length
2 1996 458 cell length
3 1082 428 cell width
4 942 181 cell length
doi:10.1371/journal.pone.0114821.t001
Cell-Scale Thermal Transport in Lignocellulose
PLOS ONE | DOI:10.1371/journal.pone.0114821 December 22, 2014 4 / 17

thickness is calculated as 1124 nm. During thickness evaluation, the thicknesses of
different sections along the cross section are measured with SEM.
To carry out TET measurement, samples must be conductive, so the onion cells
are coated with Iridium using a sputtering machine Quorum Q150T S. The
thicknesses of the Iridium films are monitored using a quartz crystal microbalance
during deposition.
Thermal transport characterization
The transient electro-thermal (TET) technique is an effective, accurate, and fast
approach developed in our lab to measure the thermal diffusivity of solid
materials, including one-dimensional conductive, semi-conductive or non-
conductive structures. The measurement accuracy and effectiveness of TET
technique has been fully examined by characterizing both metallic and dielectric
materials. Using the TET technique, Guo et al. measured the thermal diffusivity of
micro-scale polyester fibers [20]. Furthermore, Feng et al. characterized the
thermal diffusivity of thin films constituted of anatase TiO2 nanofibers and free-
Fig. 2. Cross section of cell-scale lignocellulose and the thickness measurement: (a) cross section ofsample. (b–d) magnified figure to show the thickness in different sections.
doi:10.1371/journal.pone.0114821.g002
Cell-Scale Thermal Transport in Lignocellulose
PLOS ONE | DOI:10.1371/journal.pone.0114821 December 22, 2014 5 / 17

standing micrometer-thick Poly (3-hexylthiophene) films [21, 22]. The TET
measurement results showed a good agreement with reference values.
In this work, the TET technique is used for thermal characterization of cell-
scale lignocellulose. A schematic of the TET technique is presented in Fig. 3(a) to
indicate how this technique is used to characterize the thermal transport in one-
dimensional micro/nanostructures. At the beginning, the to-be-measured sample
is suspended between two aluminum electrodes and coated with Iridium film on
the top side of sample to make it electrically conductive. Silver paste is used to
enhance the electrical and thermal contact between the sample and electrodes at
the contact points. Then the sample is placed in a high vacuum chamber to
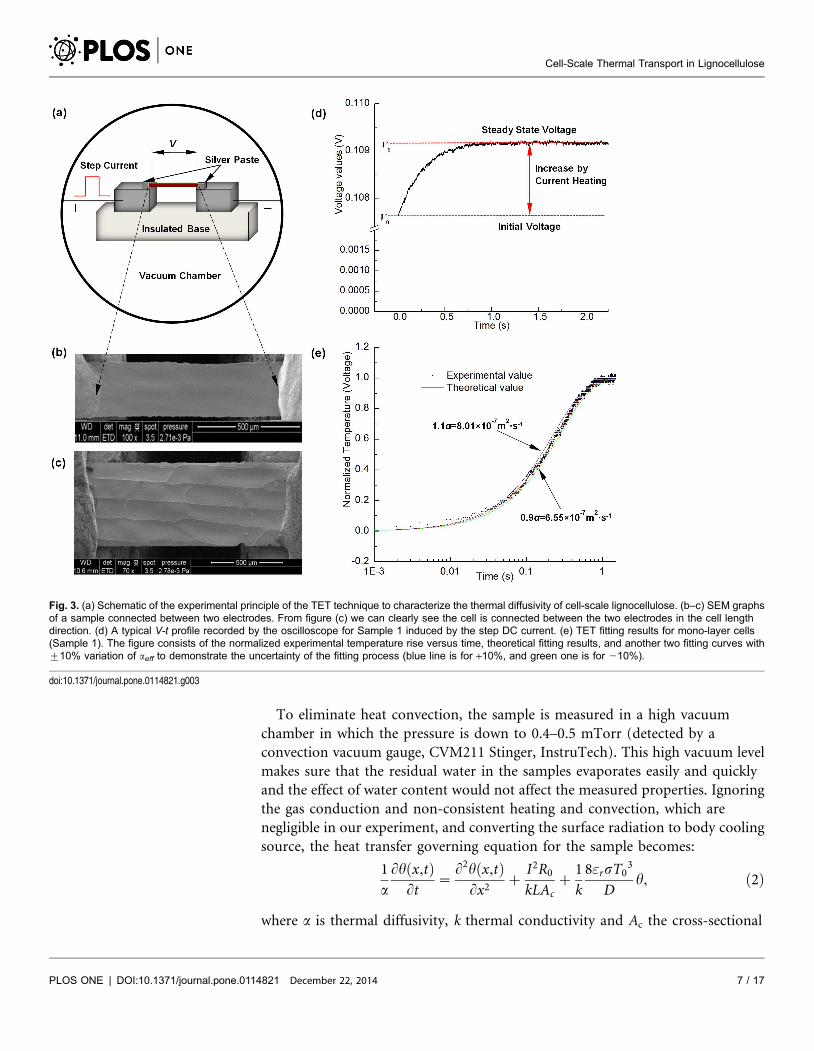
suppress the effect of gas conduction during thermal characterization. Figs. 3(b)
and (c) show the SEM pictures of the mono-layer cell samples connected between
two electrodes. From Fig. 3(c) we can clearly see the cells are aligned in the length
direction between the electrodes while the cell-cell contacts are not clear in
Fig. 3(b). This is because the cell-cell contacts show different appearance on the
two surfaces of mono-layer cells. We can see from Fig. 2(a) that the cell-cell
contacts in the upper side are more protruding than those in the lower one.
Fig. 3(c) is the picture of the upper side surface and Fig. 3(b) is the picture of the
lower side one.
In the experiment, a periodic step DC current is fed through the sample to
generate joule heat. The electrical current level needs to be chosen carefully to
guarantee that the temperature rise of all the TET experiments is moderate while
still be sensible. The temperature evolution of the sample is determined by two
competing processes: one is joule heating by the electrical current, and the other
one is heat conduction along the sample to electrodes. The temperature change of
the sample will induce an electrical resistance change, which leads to an overall
voltage change of the sample. Therefore, the voltage change of the sample can be
used to monitor its temperature evolution. A typical V-t profile recorded by the
oscilloscope for Sample 1 is shown in Fig. 3(d). More details about the TET
technique can be referred to Feng’s work [22].
During TET thermal characterization, the surface radiation effect could be
significant at and above room temperature if the sample has a very large aspect
ratio (L/D, L, D: length and thickness of sample). The heat transfer rate from the
sample surface due to radiation can be expressed as:
Qrad~"rsAs(T4{T0
4)~2"rsWL 4T03hz6T0
2h2z4T0h3zh4� �, ð1Þ
where "r is the effective emissivity of the sample, s55.6761028 Wm22K24 is the
Stefan-Boltzmann constant, As the surface area, W the width, L the length, T the
surface temperature, T0 the ambient temperature (vacuum chamber), and
h~T{T0 is the temperature rise. When T0 is relatively large, hvvT0 then we
have Qrad<8"rsWLT03h. When T0 is small, the surface radiation effect is
negligible, and we can still use Qrad<8"rsWLT03h to estimate the surface
radiation effect.
Cell-Scale Thermal Transport in Lignocellulose
PLOS ONE | DOI:10.1371/journal.pone.0114821 December 22, 2014 6 / 17
To eliminate heat convection, the sample is measured in a high vacuum
chamber in which the pressure is down to 0.4–0.5 mTorr (detected by a
convection vacuum gauge, CVM211 Stinger, InstruTech). This high vacuum level
makes sure that the residual water in the samples evaporates easily and quickly
and the effect of water content would not affect the measured properties. Ignoring
the gas conduction and non-consistent heating and convection, which are
negligible in our experiment, and converting the surface radiation to body cooling
source, the heat transfer governing equation for the sample becomes:
1a
Lh x,tð ÞLt
~L2h x,tð Þ
Lx2z
I2R0
kLAcz
1k
8"rsT03
Dh, ð2Þ
where a is thermal diffusivity, k thermal conductivity and Ac the cross-sectional
Fig. 3. (a) Schematic of the experimental principle of the TET technique to characterize the thermal diffusivity of cell-scale lignocellulose. (b–c) SEM graphsof a sample connected between two electrodes. From figure (c) we can clearly see the cell is connected between the two electrodes in the cell lengthdirection. (d) A typical V-t profile recorded by the oscilloscope for Sample 1 induced by the step DC current. (e) TET fitting results for mono-layer cells(Sample 1). The figure consists of the normalized experimental temperature rise versus time, theoretical fitting results, and another two fitting curves with¡10% variation of aeff to demonstrate the uncertainty of the fitting process (blue line is for +10%, and green one is for 210%).
doi:10.1371/journal.pone.0114821.g003
Cell-Scale Thermal Transport in Lignocellulose
PLOS ONE | DOI:10.1371/journal.pone.0114821 December 22, 2014 7 / 17
area. I is the electrical current passing through the sample and R0 is the sample’s
resistance before heating. q0~I2R=WDL is the electrical heating power per unit
volume and is constant during measurement. Integral of Green’s function [23] is
used to solve the partial differential equation (2) and the average temperature
along the sample can be obtained:
�T~T0zq0L2
1248p4
X?
m~1
1{({1)m
m2
1{ exp { m2{fð Þp2(at=L2)½ �(m2{f )
: ð3Þ
When time goes to infinity, the temperature distribution along the sample will
reach a steady state. The average temperature of the sample in the final steady state
is:
T(t??)~T0zq0L2
12k: ð4Þ
More details regarding the solution are provided in reference [24]. With an
effective thermal diffusivity aeff5a?(1-f), here f is defined as -8"rsT03L2=Dp2k, the
normalized average temperature rise T� is:
T�%48p4
X?
m~1
1{({1)m
m2
1{ exp½{m2p2aeff t=L2�m2
: ð5Þ
The measured voltage change is inherently proportional to the temperature
change of the sample. The normalized temperature rise T�is calculated from
experiment as T�~(Vsample{V0)=(V1{V0), where V0 and V1 are the initial and
final voltages across the sample. In our work, after T� is obtained, different trial
values of aeff are used to calculate the theoretical T�using equation (5) and fit the
experimental result. The value giving the best fit of T� is taken as the effective
thermal diffusivity of the sample. The determined thermal diffusivity still has the
effect of parasitic conduction because the measured sample is coated with a thin
Iridium film. The thermal transport effect caused by the coated layer can be
subtracted using the Wiedemann-Franz law with a negligible uncertainty. The real
thermal diffusivity (areal) of the sample is determined as:
areal~a{LLorenzTLRAc(rcp)
, ð6Þ
where rcp is volume-based specific heat of the sample, which can be obtained
from calibration in our cryogenic system to be discussed later. LLorenz, T, and Ac
are the Lorenz number, sample’s average temperature and cross-sectional area,
respectively. The Lorenz number can be determined from experiment discussed
later. In summary, the real thermal diffusivity of the sample finally is calculated as:
Cell-Scale Thermal Transport in Lignocellulose
PLOS ONE | DOI:10.1371/journal.pone.0114821 December 22, 2014 8 / 17

areal~aeff {1
rcp
8"rsT03
DL2
p2{
LLorenzTLRA(rcp)
, ð7Þ
The thermal conductivity can be readily calculated as kreal5arealrcp.
Results and Discussion
The surface emissivity and Lorenz number of Ir
First of all, we take Sample 1 as an example to demonstrate how the thermal
diffusivity is characterized. This sample is 1352 mm long and 527 mm wide. The
energy transfer direction we measured is along the cell length. The electrical
resistances before and after applying a step current are 44.82 V and 45.49 V, and
the electrical current used in the experiment is 2.4 mA to give a change of voltage
increase at about 1.5%. Fig. 3(d) shows the transient voltage change of raw
experimental data. The normalized temperature rise T� and the fitting result are
shown in Fig. 3(e). Its effective thermal diffusivity is determined as
6.7861027 m2?s21, which includes the effect of radiation and parasitic
conduction. We vary the trial values of a to determine the fitting uncertainty as
shown in Fig. 3(e). When the trial value is changed by 10%, the fit can be seen
deviating from the experimental results substantially. So the uncertainty is
determined as ¡10%.
In order to eliminate the effect of radiation, sample’s surface emissivityris
needed. Experiments on two samples from the same onion piece with different
sizes (Sample 1 and Sample 2) are carried out to determine the surface emissivity
"r, based on kreal~aeff 1rcp{8"rsT0
3
DL1
2
p2{
LLorenzT1L1
R1DW1and
kreal~aeff 2rcp{8"rsT0
3
DL2
2
p2{
LLorenzT2L2
R2DW2, where D is average thickness of onion
cell, subscript 1, 2 refer Sample 1 and Sample 2, respectively. rcp and LLorenz will be
determined using different techniques and mentioned latter. We use the
volumetric specific heat of Sample 1 (1.806106 J?K21 m23) to do the calculation
and the Lorenz number is 6.3461029 W V K22. The length and width of Sample
2 are 1996 mm and 458 mm respectively. During the TET characterization, its
electrical resistance rises from 72.6 V to 73.6 V. The effective thermal diffusivity of
Sample 1 and Sample 2 are 6.7861027 m2?s21 and 9.4361027 m2?s21
respectively. Only kreal and r are unknown in the two equations above. The surface
emissivity is determined as 0.22 by solving the two equations.
To measure metallic film’s Lorenz number, a method involving repeatedly
depositing metallic films is developed in our lab and Sample 4 is used to
determine the Lorenz number of the Iridium film on onion cells. It can be seen
from equation (7) that aeff is proportional to R21. Iridium film layers with
various thicknesses on Sample 4 would have different effective thermal diffusivity
aeff and electrical conductance R21. Thus, a 5 nm-thick iridium film layer is
Cell-Scale Thermal Transport in Lignocellulose
PLOS ONE | DOI:10.1371/journal.pone.0114821 December 22, 2014 9 / 17

deposited repeatedly on Sample 4 for five times. Accordingly, five effective
thermal diffusivity values and five R21 values are obtained. These data can be
fitted into a straight line and its slope is LLorenzTL/A0(rcp)0 (the subscript ‘‘0’’
represents onion mono-layer cells’ parameters). More details can be found in the
reference [25]. The Lorenz number of Iridium film on Sample 4 is determined as
6.3461029 W V K22. This value is much smaller than that of bulk material
(2.4961028 W V K22), which results from many factors, including Iridium film’s
non-uniform nanostructure due to rough cell wall surface and cell-to-cell
contacts, defects and gain boundaries in the metallic film.
Anisotropy of thermal transport
The epidermal cell wall consists of layers of parallel, cellulose micro fibrils and its
structure is like ‘plywood laminates’, which contain micro fibrils orientated in all
directions [26]. The onion epidermis cell wall can be seen as fiber-reinforced
composite materials [27], and onion cellulose fibrils have an overall orientation
parallel with the cell length [16]. Due to anisotropy of onion cells’ strip structure
and cellulose orientation, energy transport along different directions may be
different. Thus, the thermal properties of Sample 1 (energy transport direction is
along the cell length) and Sample 3 (energy transport direction is along the cell
width) are measured at ambient temperature T05290 K and are compared to
study the anisotropic nature. The thermal conductivity of Sample 1 is
0.72 Wm21K21 while that of Sample 3 is 0.81 Wm21K21. This indicates that
thermal transport capacity along the cell width is better than that along the cell
length although this difference is quite small. This is in contrary to most of the
bulk material measured in the literature [10, 12]. This could be due to onion cells’
strip structure. Obviously, energy transport along the cell width has to travel
through more cell-to-cell contacts per unit length than that along the cell length
direction. These cell-to-cell contacts are thicker and more condensed than other
parts of cells, which would promote more energy transport. Therefore, the
thermal conductivity along the cell width direction is larger than that along the
cell length direction. This thermal conductivity difference indicates that energy
transport through these strip cells shows a little bit anisotropy.
Effect of temperature on thermal transport
Sample 2 is used to characterize energy transport in cell-scale lignocellulose from
room temperature down to 20 K in a cryogenic system (CCS-450, JANIS). The
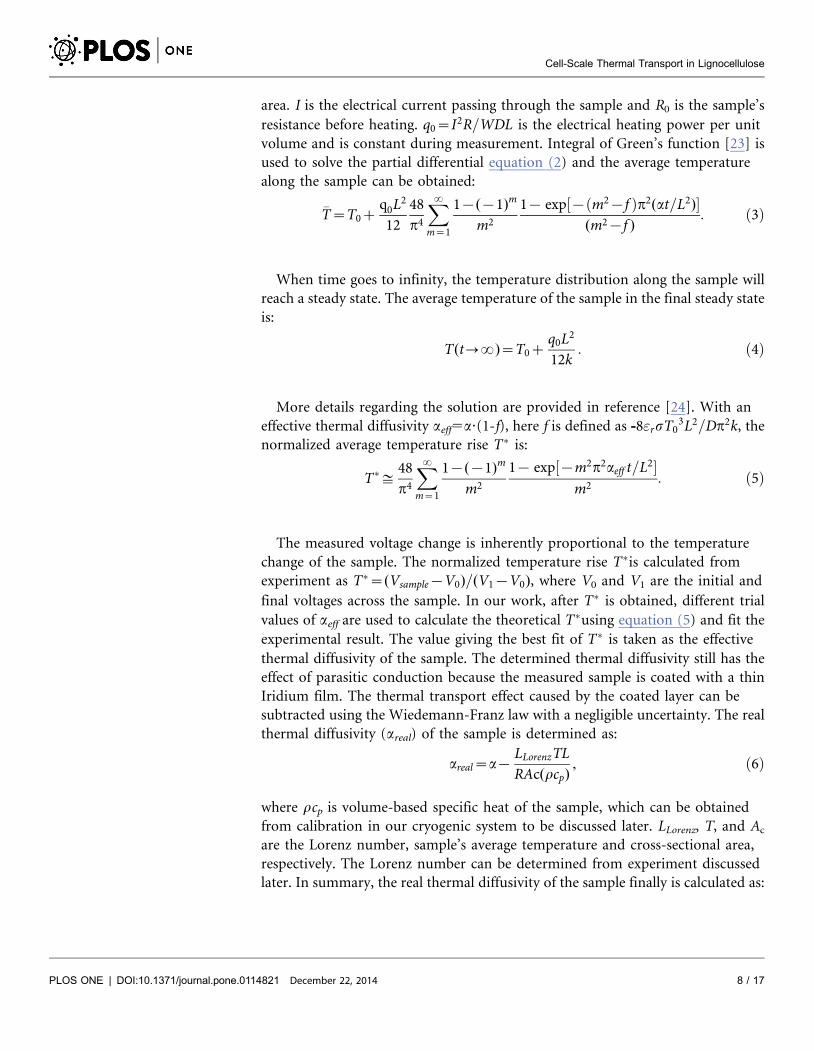
result of temperature dependent electrical resistance and electrical resistivity of
Sample 2 is displayed in Fig. 4. It can be seen that both the electrical resistance
and resistivity decrease from 72.61 V to 60.95 V when the ambient temperature
falls from 290 K to 20 K. A linear approximation is typically used to describe the
relation between electrical resistance and temperature: R~R0(1zg(T{T0)) when
temperature is not too low. Here T0 (290 K) is room temperature, R0 is the
electrical resistance at room temperature T0 and g is the temperature coefficient of
Cell-Scale Thermal Transport in Lignocellulose
PLOS ONE | DOI:10.1371/journal.pone.0114821 December 22, 2014 10 / 17
resistance, determined as 6.1061024 K21 in our work. After we finish the cooling
process, we allow the sample’s temperature slowly rise back to the room
temperature. We found that at room temperature, the electrical resistance
becomes 70.4 V, which is 2.2 V smaller than that before cryogenic experiment.
This is caused by permanent structure change of the sample due to thermal shrink
when the temperature is decreased down to 20 K. We assume this change is linear
with temperature. Accordingly, g is determined as 4.9861024 K21 after
subtracting the effect of sample’s structure change. With knowledge of g, the
temperature rise during our TET characterization can be obtained from electrical
resistance change (DR) as DT5DR/(gR0). The slope of electrical resistivity change
with temperature drresis=dT is determined as 1.47610210 VmK21, which is
smaller than that of bulk Iridium (2.12610210 VmK21). According to
Matthiessen’s Rule, this slope of nanofilm and bulk material should be close. In
our laboratory, Iridium nanofilms on several different substrates have been
measured. This value of Iridium film on milkweed floss fiber is 1.52610210
VmK21 and on glass fiber is 1,1.5 610210 VmK21. Only the values of film on
DNA fiber and silkworm silk are the same as that of bulk Iridium. Further
research is under process in our laboratory to explore the mechanisms of the
resistivity temperature coefficient and the effect of the substrate.
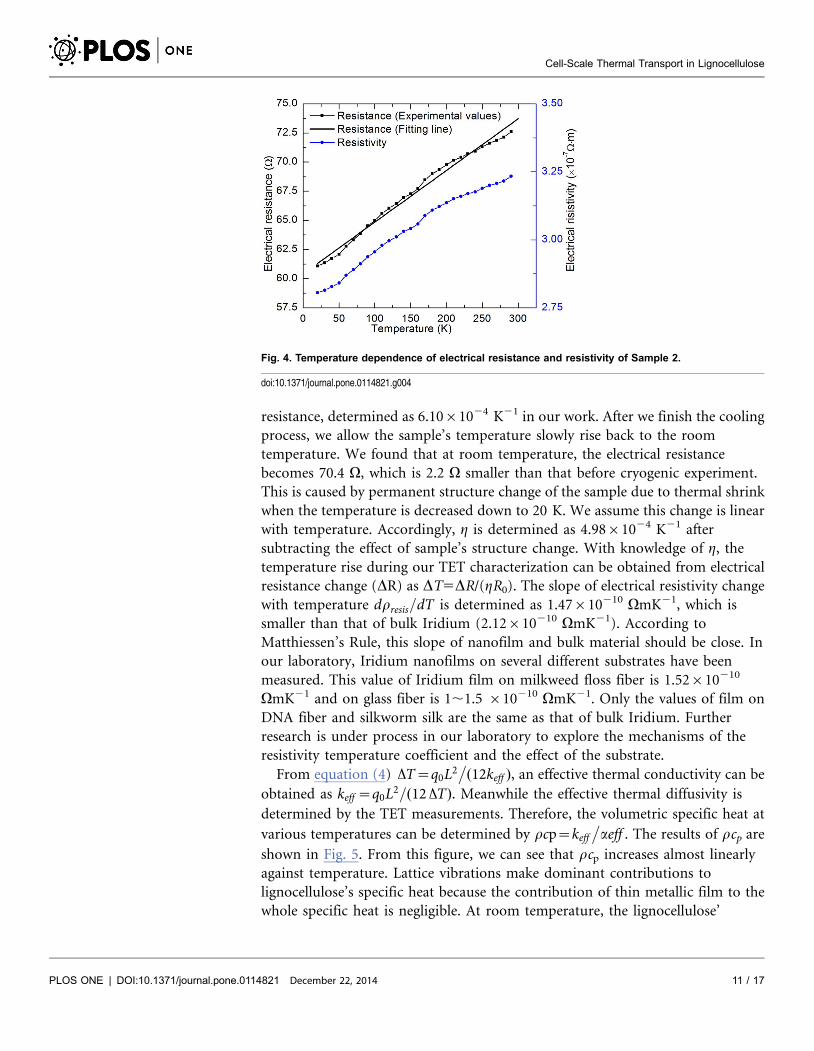
From equation (4) DT~q0L2�
(12keff ), an effective thermal conductivity can be
obtained as keff ~q0L2=(12 DT). Meanwhile the effective thermal diffusivity is
determined by the TET measurements. Therefore, the volumetric specific heat at
various temperatures can be determined by rcp~keff�
aeff . The results of rcp are
shown in Fig. 5. From this figure, we can see that rcp increases almost linearly
against temperature. Lattice vibrations make dominant contributions to
lignocellulose’s specific heat because the contribution of thin metallic film to the
whole specific heat is negligible. At room temperature, the lignocellulose’
Fig. 4. Temperature dependence of electrical resistance and resistivity of Sample 2.
doi:10.1371/journal.pone.0114821.g004
Cell-Scale Thermal Transport in Lignocellulose
PLOS ONE | DOI:10.1371/journal.pone.0114821 December 22, 2014 11 / 17
volumetric specific heat is near the counterpart of microcrystalline cellulose and
this value decreases with temperature. The reason is that short wavelength
phonons are frozen out at low temperature and only long wavelength phonons
contribute to specific heat, resulting in the decreasing specific heat. Meanwhile
density changes little with temperature when compared with heat capacity.
Therefore, the volumetric specific heat decreases with temperature. Blokhin et al.
obtained the relation between heat capacity of plant microcrystalline cellulose and
temperature via experiments [28]. The density of cellulose is 1500 Kg?m23. The
volumetric specific heat is determined and shown in Fig.5 for comparison. Their
heat capacity decreases with temperature linearly and has the same trend with the
results of cell-scale lignocellulose. But when temperature goes lower than room
temperature, the cell-scale lignocellulose’s volumetric specific heat is larger than
that of cellulose microcrystals. This is due to the structure difference of cell-scale
lignocellulose and pure cellulose microcrystals.
The cell-scale lignocellulose (onion cells) is composed of cellulose, hemi-
cellulose and lignin. It contains a large amount of cellulose micro fibrils in onion
epidermis cell walls. [16, 26, 27, 29] The structure of cell-scale lignocellulose is
amorphous according to the x-Ray Diffraction results which will be discussed in
detail later while cellulose fibers in the literature are microcrystalline. It is well
documented that the specific heat can be separated into harmonic and
anharmonic terms and the anharmonic term is volume and explicit temperature
dependent [30, 31]. The volume of amorphous state expands when compared with
that of the crystalline state due to the disordered and irregular structure in the
amorphous state. So the increased volume results in an enhanced anharmonic
contribution to the specific heat. Furthermore, the excessive volume reduces the
interaction energy of atoms, results in weaker interatomic bonding, subsequently
a reduced Debye temperature and enhanced specific heat. Additionally, the
impurities and thermal expansion would also affect the specific heat of the sample.
Fig. 5. Temperature dependence of the cell-scale lignocellulose’s volumetric specific heat.
doi:10.1371/journal.pone.0114821.g005
Cell-Scale Thermal Transport in Lignocellulose
PLOS ONE | DOI:10.1371/journal.pone.0114821 December 22, 2014 12 / 17
The cell-scale lignocellulose is composed of not only cellulose, but also
hemicellulose, pectin and inside materials. So the specific heat of these materials
would affect the overall specific heat. Also, the density used to calculate the
volumetric specific heat of microcrystal cellulose fibers is the one at room
temperature. This value should be a little larger due to thermal shrink when the
temperature goes down, which means that the volumetric specific heat of
microcrystal cellulose fiber should be a little larger. Overall, the higher excess
specific heat results from the greater irregularity and disorder or the higher
impurity contamination in the structure [32, 33].
Alsina et al. studied the volumetric specific heat of hybrid lignocellulosic fabrics
and obtained the volumetric specific heat of jute/cotton, sisal/cotton and ramie/
cotton hybrid fabrics as 1.046106 J?m23K21, 1.136106 J?m23K21,
1.076106 J?m23K21 when the heat flux is parallel to the fabrics [12]. Gupta et al.
measured the specific heat and density of softwood, softwood bark and softwood
chars. The volumetric specific heat which can be determined as the product of
specific heat and density of them is 4.226105 J?m23K21, 6.576105 J?m23K21
and 2.306105 J?m23K21 respectively [11]. These bulk values are much smaller
than those of cell-scale lignocellulose and cellulose microcrystals and it is due to
their porous structure [13].
According to equation (7), the real thermal conductivity of cell-scale
lignocellulose at different temperatures can be determined after subtracting the
effect of Iridium film’s parasitic conduction and radiation. Moreover, to explore
the structure of cell-scale lignocellulose, x-Ray Diffraction (XRD) is used in this
work. The XRD system (Siemens D 500 diffractometer) is equipped with a copper
tube that was operated at 45 kV and 30 mA. The sample was placed on a zero-
background holder (ZBH) for analysis. The zero-background holder was also
scanned without the sample to provide a "blank" diffractogram. The sample was
scanned with two-theta from 3 to 70 degrees using a 0.05 degree step and with a
dwell time of 3 seconds per step. The thermal conductivity results are shown in
Fig. 6 and the XRD results are depicted in the inset, which shows that the cell-
scale lignocellulose is amorphous. It can be seen from the figure that there exists a
peak value: 0.97 Wm21K21 at 243 K. When the temperature is larger than this
value, the cell-scale lignocellulose’s thermal conductivity decreases with increasing
temperature. This is due to phonon-phonon scattering, which is dominant at high
temperatures and is stronger when the temperature goes up. Phonon-phonon
scattering intensifies with increasing temperature, resulting in reduced phonon
mean free path and accordingly reduced thermal conductivity. When temperature
is lower than 243 K, the cell-scale lignocellulose’s thermal conductivity decreases
with decreasing temperature. In this temperature range, defects, impurity and
boundary scattering become the dominant effects which limit phonon mean free
path. In this case, the change of thermal conductivity mainly depends on the
change of sample’s specific heat, while the phonon mean free path (mainly
determined by defects, impurity and boundary scattering) has little change with
temperature. The measured thermal conductivity is that of an amorphous
structure. For crystalline cellulose, the thermal conductivity should be much
Cell-Scale Thermal Transport in Lignocellulose
PLOS ONE | DOI:10.1371/journal.pone.0114821 December 22, 2014 13 / 17

higher. No report is available for the thermal conductivity of crystalline cellulose
for comparison. Crystalline cellulose nanofibers were reported as high thermo-
conductive phase to produce cellulose nanofiber/epoxy resin nanocomposite. An
overall thermal conductivity of the nanocomposite material was achieved over
1 Wm21K21 [34]. It is expected the thermal conductivity of crystalline cellulose
should be much higher than 1 Wm21K21.
The thermal conductivity of cell-scale lignocellulose is 0.73 Wm21K21 at 317 K
while those of hard wood and soft wood are 0.16 Wm21K21 and 0.12 Wm21K21
respectively [14]. The thermal conductivity of wood is much lower than that of
mono-layer cells because wood is of high porosity and full of air. Air has a very
low thermal conductivity (2.6361022 Wm21K21), which reduces the overall
thermal conductivity of wood. The samples used in this work are well-aligned and
solid, which gives a relatively high thermal diffusivity and density, and accordingly
a large thermal conductivity. Sakuratani measured the thermal conductivity of
rice stem as 0.54 Wm21K21 [35], and the thermal conductivity of sisal/cotton
hybrid fabrics is 0.575 Wm21K21 when the heat flux was parallel to the fabrics
[12]. They are close to, but still smaller than the thermal conductivity of cell-scale
lignocellulose. The thermal conductivity of mono-layer cells at 317 K is
0.73 Wm21K21 while the thermal conductivity of water is 0.63 Wm21K21 at this
temperature. When temperature decreases down to 273 K, the thermal
conductivity of mono-layer cells increases to 0.87 Wm21K21 while that of water
decreases to 0.56 Wm21K21 [36]. This may help plant cells keep a relative stable
Fig. 6. Temperature dependence of cell-scale lignocellulose’s thermal conductivity. The inset shows thex-Ray Diffraction results of cell-scale lignocellulose.
doi:10.1371/journal.pone.0114821.g006
Cell-Scale Thermal Transport in Lignocellulose
PLOS ONE | DOI:10.1371/journal.pone.0114821 December 22, 2014 14 / 17

overall thermal conductivity when the environment temperature fluctuates
around room temperature, which can facilitate the stability of live organisms.
Conclusions
This work reported a detailed study of the thermophysical properties of
lignocellulose at the cell scale. Around room temperature, r?cp of the mono-layer
cells is close to that of microcrystalline cellulose. With temperature going down,
r?cp of the mono-layer cells shows a slower decrease against temperature than
microcrystalline cellulose, and is always higher than that of microcrystalline
cellulose. The thermal conductivity of cell-scale lignocellulose decreased with
increasing temperature from 243 K to 317 K due to increasing phonon-phonon
scatterings. From 41 K to 243 K, the thermal conductivity went up with
temperature, mainly due to the change in heat capacity.
Acknowledgments
Support of this work by Army Research Office (W911NF-12-1-0272), Office of
Naval Research (N000141210603), and National Science Foundation
(CBET1235852, CMMI1264399) is gratefully acknowledged. X.W. thanks the
partial support of the ‘‘Eastern Scholar’’ Program of Shanghai, China.
Author ContributionsConceived and designed the experiments: ZC XW. Performed the experiments:
ZC ZX. Analyzed the data: ZC XW ZX. Contributed reagents/materials/analysis
tools: ZC LZ. Wrote the paper: ZC XW.
References
1. Lee J (1997) Biological conversion of lignocellulosic biomass to ethanol. J Biotechnol 56: 1–24.
2. Liang XH, Kozinski JA (2000) Numerical modeling of combustion and pyrolysis of cellulosic biomass inthermogravimetric systems. Fuel 79: 1477–1486.
3. Zabaniotou A, Ioannidou O, Antonakou E, Lappas A (2008) Experimental study of pyrolysis forpotential energy, hydrogen and carbon material production from lignocellulosic biomass. Int J HydrogenEnerg 33: 2433–2444.
4. Sun Y, Cheng JY (2002) Hydrolysis of lignocellulosic materials for ethanol production: a review.Bioresource Technol 83: 1–11.
5. Mettler MS, Vlachos DG, Dauenhauer PJ (2012) Top ten fundamental challenges of biomass pyrolysisfor biofuels. Energ Environ Sci 5: 7797–7809.
6. Singha AS, Thakur VK (2009) Mechanical, Morphological and Thermal Properties of Pine Needle-Reinforced Polymer Composites. Int J Polym Mater 58: 21–31.
7. Averous L, Le Digabel F (2006) Properties of biocomposites based on lignocellulosic fillers. CarbohydPolym 66: 480–493.
8. Le Digabel F, Boquillon N, Dole P, Monties B, Averous L (2004) Properties of thermoplasticcomposites based on wheat-straw lignocellulosic fillers. J Appl Polym Sci 93: 428–436.
Cell-Scale Thermal Transport in Lignocellulose
PLOS ONE | DOI:10.1371/journal.pone.0114821 December 22, 2014 15 / 17

9. Dobircau L, Sreekumar PA, Saiah R, Leblanc N, Terrie C, et al. (2009) Wheat flour thermoplasticmatrix reinforced by waste cotton fibre: Agro-green-composites. Compos Part a-Appl S 40: 329–334.
10. Yapici F, Ozcifci A, Esen R, Kurt S (2011) The Effect of Grain Angle and Species on ThermalConductivity of Some Selected Wood Species. Bioresources 6: 2757–2762.
11. Gupta M, Yang J, Roy C (2003) Specific heat and thermal conductivity of softwood bark and softwoodchar particles. Fuel 82: 919–927.
12. Alsina OLS, de Carvalho LH, Filho FGR, d’Almeida JRM (2005) Thermal properties of hybridlignocellulosic fabric-reinforced polyester matrix composites. Polym Test 24: 81–85.
13. Stankovic SB, Popovic D, Poparic GB (2008) Thermal properties of textile fabrics made of natural andregenerated cellulose fibers. Polym Test 27: 41–48.
14. Incropera FP, Lavine AS, DeWitt DP (2011) Fundamentals of heat and mass transfer. John Wiley &Sons.
15. Park BK, Yi N, Park J, Kim D (2013) Thermal conductivity of single biological cells and relation with cellviability. Appl Phys Lett 102.
16. Suslov D, Verbelen JP, Vissenberg K (2009) Onion epidermis as a new model to study the control ofgrowth anisotropy in higher plants. J Exp Bot 60: 4175–4187.
17. Naik AD, Stappers L, Snauwaert J, Fransaer J, Garcia Y (2010) A Biomembrane Stencil for CrystalGrowth and Soft Lithography of a Thermochromic Molecular Sensor. Small 6: 2842–2846.
18. Wang F, Yao J, Russel M, Chen HL, Chen K, et al. (2010) Development and analytical application of aglucose biosensor based on glucose oxidase/O-(2-hydroxyl)propyl-3-trimethylammonium chitosanchloride nanoparticle-immobilized onion inner epidermis. Biosens Bioelectron 25: 2238–2243.
19. Kumar J, D’Souza SF (2011) Immobilization of microbial cells on inner epidermis of onion bulb scale forbiosensor application. Biosens Bioelectron 26: 4399–4404.
20. Guo JQ, Wang XW, Wang T (2007) Thermal characterization of microscale conductive andnonconductive wires using transient electrothermal technique. J Appl Phys 101.
21. Feng X, Wang X, Chen X, Yue Y (2011) Thermo-physical properties of thin films composed of anataseTiO2 nanofibers. Acta Mater 59: 1934–1944.
22. Feng XH, Wang XW (2011) Thermophysical properties of free-standing micrometer-thick Poly (3-hexylthiophene) films. Thin Solid Films 519: 5700–5705.
23. Beck JV, Cole KD, Haji-Sheikh A, Litkouhi B (1992) Heat conduction using Green’s functions.Washington DC: Hemisphere Publishing Corporation.
24. Liu G, Lin H, Tang X, Bergler K, Wang X (2014) Characterization of Thermal Transport in One-dimensional Solid Materials. Journal of Visualized Experiments 83.
25. Lin H, Xu S, Wang XW, Mei N (2013) Thermal and Electrical Conduction in Ultrathin Metallic Films:7 nm down to Sub-Nanometer Thickness. Small 9: 2585–2594.
26. Kutschera U (2008) The growing outer epidermal wall: Design and physiological role of a compositestructure. Ann Bot-London 101: 615–621.
27. Kerstens S, Decraemer WF, Verbelen JP (2001) Cell walls at the plant surface behave mechanicallylike fiber-reinforced composite materials. Plant Physiol 127: 381–385.
28. Blokhin AV, Voitkevich OV, Kabo GJ, Paulechka YU, Shishonok MV, et al. (2011) ThermodynamicProperties of Plant Biomass Components. Heat Capacity, Combustion Energy, and GasificationEquilibria of Cellulose. J Chem Eng Data 56: 3523–3531.
29. Suslov D, Verbelen JP (2006) Cellulose orientation determines mechanical anisotropy in onionepidermis cell walls. J Exp Bot 57: 2183–2192.
30. Leadbetter AJ, Settatree GR (1969) Anharmonic effects in the thermodynamic properties of solids VI.Germanium: heat capacity between 30 and 500 C and analysis of data. Journal of Physics C: Solid StatePhysics 2.
31. Yokokawa H, Takahashi Y (1979) Analysis of Heat-Capacity of Platinum - Electron-Phonon Effects andAnharmonic Contribution. J Phys Chem Solids 40: 445–448.
Cell-Scale Thermal Transport in Lignocellulose
PLOS ONE | DOI:10.1371/journal.pone.0114821 December 22, 2014 16 / 17
32. Chen HS, Turnbull D (1969) Specific Heat and Heat of Crystallization of Amorphous Germanium. J ApplPhys 40: 4214-&.
33. Wang L, Tan ZC, Meng SH, Druzhinina A, Varushchenko RA, et al. (2001) Heat capacityenhancement and thermodynamic properties of nanostructured amorphous SiO2. J Non-Cryst Solids296: 139–142.
34. Shimazaki Y, Miyazaki Y, Takezawa Y, Nogi M, Abe K, et al. (2007) Excellent thermal conductivity oftransparent cellulose nanofiber/epoxy resin nanocomposites. Biomacromolecules 8: 2976–2978.
35. Sakuratani T (1979) Apparent thermal conductivity of rice stems in relation to transpiration stream.Journal of Agricultural Meteorology (Japan).
36. Ramires MLV, Decastro CAN, Nagasaka Y, Nagashima A, Assael MJ, et al. (1995) StandardReference Data for the Thermal-Conductivity of Water. J Phys Chem Ref Data 24: 1377–1381.
Cell-Scale Thermal Transport in Lignocellulose
PLOS ONE | DOI:10.1371/journal.pone.0114821 December 22, 2014 17 / 17