Embed Size (px)
Citation preview

Hindawi Publishing CorporationISRN GeophysicsVolume 2013, Article ID 382382, 8 pageshttp://dx.doi.org/10.1155/2013/382382
Research ArticleThermomagnetic Features of Crust in Southern Parts of theStructural Provinces of Tocantins and São Francisco, Brazil
Suze Nei P. Guimaraes and Valiya M. Hamza
Observatorio Nacional, Rua General Jose Cristino 77, Rio de Janeiro, CEP 20921-400, RJ, Brazil
Correspondence should be addressed to Valiya M. Hamza; [email protected]
Received 24 January 2013; Accepted 17 February 2013
Academic Editors: G. Casula, Y.-J. Chuo, K. Maamaatuaiahutapu, and F. Monteiro Santos
Copyright © 2013 S. N. P. Guimaraes and V. M. Hamza. This is an open access article distributed under the Creative CommonsAttribution License, which permits unrestricted use, distribution, and reproduction in any medium, provided the original work isproperly cited.
In the present work we report results of a regional scale investigation of the thermal and magnetic characteristics of the crustin the southern sector of the geologic provinces of Tocantins and Sao Francisco, Brazil. Updated compilations of aeromagneticand geothermal data sets were employed for this purpose. Use of such techniques as vertical derivative, analytic signal, andEuler deconvolution in analysis of aeromagnetic data has allowed precise locations of the sources of magnetic anomalies anddetermination of their respective depths. The anomalies in the Tocantins province are considered as arising from variations in themagnetic susceptibilities and remnantmagnetizations of alkalinemagmatic intrusions of the Tertiary period.The lateral dimensionsof the bodies are less than 10 km, and these are found to occur at shallow depths of less than 20 km.On the other hand, the anomaliesin the cratonic areas are related to contrasts in magnetic properties of bodies situated at depths greater than 20 km and have spatialdimensions of more than 50 km. Analysis of geothermal data reveals that the cratonic area is characterized by geothermal gradientsand heat flow values lower when compared with those of the Tocantins province.
1. Introduction
The geotectonic provinces of Sao Francisco and Tocantins areoften considered as the main structural units in the easternpart of the South American platform [1, 2]. Geological andgeophysical studies performed to date have allowed mappingof structural and tectonic features near the surface of thesestructures, but little is known about the vertical distributionsat depths in the crust.
One of the convenient ways of circumventing this diffi-culty is to evaluate aeromagnetic survey data and comparethe results with those of geothermal studies. According toavailable information [3, 4] past attempts to integrate theresults of aeromagnetic surveys were limited to incorporatingstandard corrections of technical operations. It became clearthat a detailed review of aeromagnetic survey data is needed,focusing on the judicious use of corrections (leveling andmicroleveling, eliminating the effects of diurnal variationand the internal field) and use of advanced techniquesof interpretation (vertical derivative, analytic signal, andEuler deconvolution). Also, “suture” techniques need to be
employed in integration of data from several surveys inthis area in obtaining a coherent analysis of the subsurfacegeological significance of the results and its correlations withstructural features. Another parallel objective of this workhas been comparison of maps of the residual anomalies ofmagnetic and the geothermal fields in the area of study asa means of obtaining complementary information on thethermal state of the upper crust in the study area [5].
2. Geological Characteristics of the Study Area
The study area comprises the southern parts of the structuralprovinces of Tocantins and San Francisco, located in theeast-central parts of the South American platform. The mapin Figure 1 illustrates the geological characteristics of thestudy area. Basement rocks of Archean age outcrop mainlyin the southern and southeastern parts. Isolated blocks havealso been identified in the northwestern parts. Most of theremaining area is covered by metamorphic complexes ofProterozoic age. Phanerozoic sediment cover occurs as a set
2 ISRN Geophysics
45∘W
45∘W
50∘W
50∘W
20∘ S 20∘ S
BasementPhanerozoic cover
Proterozoic coverWater bodies
0 87,5 175 350(km)
+ +
!.
!.
!.Belo Horizonte
GoianiaBrasılia
Figure 1: Simplified geological map of the southern Sao Franciscoand Tocantins provinces (modified after IBGE, 2010).
of discontinuous blocks in the east-central parts and also inthe western part of the study area.
The Sao Francisco structural province is a tectonicallystable region, where the main geological structures haveages ranging from Mesoarchean to Paleoproterozoic [6–8].The southern limits of this province are determined by thefold belts of the Brazilian orogeny. The Tocantins structuralprovince is situated in the western segment of the study area.The crustal blocks in this province are composed of granitic-gneissic-granulite compartments (Goias Median Massif) ofArchean to Neoproterozoic age and metasedimentary rocks(Araguaia, Brasilia, and Uruacu belts) of Proterozoic age. Acharacteristic feature of this province is the presence of asignificant number of alkaline magmatic intrusions of theTertiary period. There are also indications of the occurrenceof large number of nonoutcropping intrusions [9].
According to results of seismic studies [10] the thicknessof the upper crust in the region of study area is 40 km in theSao Francisco craton and 32 to 42 km in the Brasılia belt andadjacent areas. In theRibeira belt, located in the southern partof the study area, the crustal thickness is found to be 37 km.
3. Materials and Methods
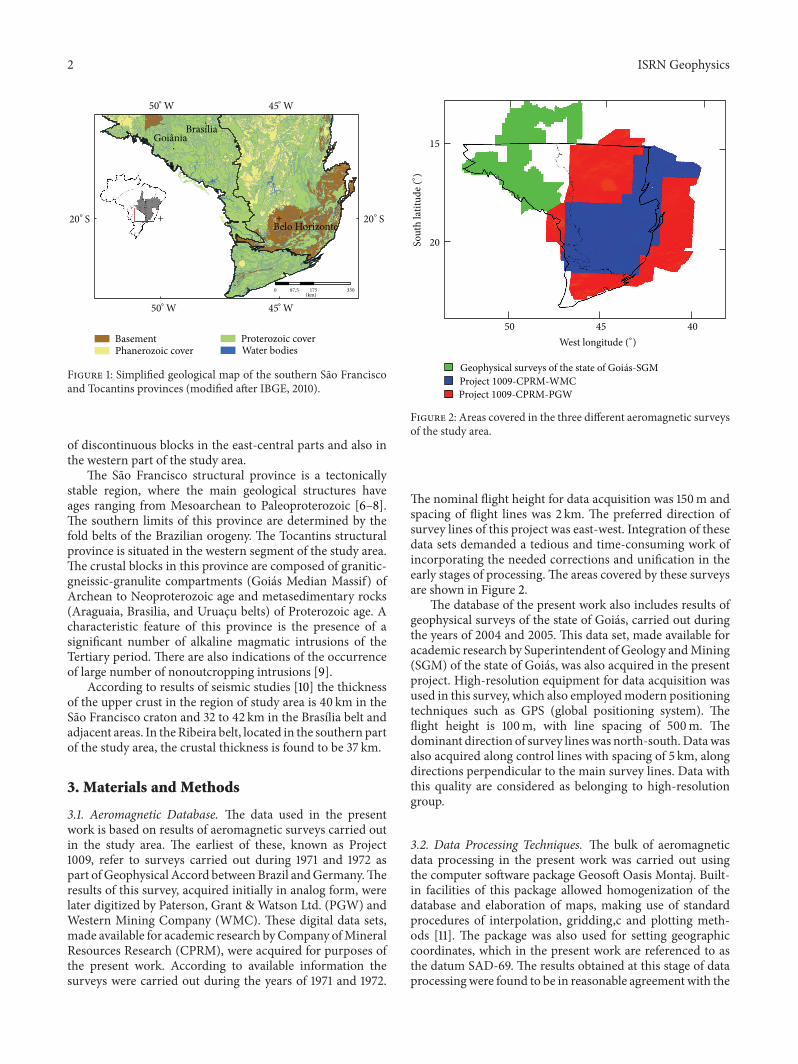
3.1. Aeromagnetic Database. The data used in the presentwork is based on results of aeromagnetic surveys carried outin the study area. The earliest of these, known as Project1009, refer to surveys carried out during 1971 and 1972 aspart of Geophysical Accord betweenBrazil andGermany.Theresults of this survey, acquired initially in analog form, werelater digitized by Paterson, Grant & Watson Ltd. (PGW) andWestern Mining Company (WMC). These digital data sets,made available for academic research byCompany ofMineralResources Research (CPRM), were acquired for purposes ofthe present work. According to available information thesurveys were carried out during the years of 1971 and 1972.
20
15
Sout
h la
titud
e (∘)
50 45 40West longitude (∘)
Geophysical surveys of the state of Goias-SGM
Project 1009-CPRM-PGWProject 1009-CPRM-WMC
Figure 2: Areas covered in the three different aeromagnetic surveysof the study area.
The nominal flight height for data acquisition was 150m andspacing of flight lines was 2 km. The preferred direction ofsurvey lines of this project was east-west. Integration of thesedata sets demanded a tedious and time-consuming work ofincorporating the needed corrections and unification in theearly stages of processing.The areas covered by these surveysare shown in Figure 2.
The database of the present work also includes results ofgeophysical surveys of the state of Goias, carried out duringthe years of 2004 and 2005. This data set, made available foracademic research by Superintendent of Geology andMining(SGM) of the state of Goias, was also acquired in the presentproject. High-resolution equipment for data acquisition wasused in this survey, which also employedmodern positioningtechniques such as GPS (global positioning system). Theflight height is 100m, with line spacing of 500m. Thedominant direction of survey lineswas north-south.Datawasalso acquired along control lines with spacing of 5 km, alongdirections perpendicular to the main survey lines. Data withthis quality are considered as belonging to high-resolutiongroup.
3.2. Data Processing Techniques. The bulk of aeromagneticdata processing in the present work was carried out usingthe computer software package Geosoft Oasis Montaj. Built-in facilities of this package allowed homogenization of thedatabase and elaboration of maps, making use of standardprocedures of interpolation, gridding,c and plotting meth-ods [11]. The package was also used for setting geographiccoordinates, which in the present work are referenced to asthe datum SAD-69. The results obtained at this stage of dataprocessingwere found to be in reasonable agreement with the

ISRN Geophysics 3
20∘
15∘
50∘
45∘
West longitude
Sout
h la
titud
e
−50
−25
0
25
50
(nT)
<−100
>100
Figure 3: Residual magnetic field of the study area.
maps already published by CPRM in 2003 [3] and by SGM in2009 [4].
The next step in data processing has been removal of theInternational Geomagnetic Reference Field (IGRF) from therecords of the total field. This has been an important partof data processing in view of the significant time differencesin data acquisition and the large area extent of the surveys.The main problem with the published models of IGRF is thatit is meant to serve all areas of geomagnetism and, as such,is not specifically tailored to the needs of the explorationcommunity. Hence two different approaches were adopted.In processing data from Project 1009, acquired during thedecade of 1970, we used the algorithm developed by theGeomagnetism Group at the National Observatory (Riode Janeiro, Brazil). This algorithm, which makes use ofhistoric records of magnetic data from permanent stationsand several hundred temporary stations in Brazil, provides abetter representation of local magnetic field. It has often beenconsidered as providing good correlation with low latitudegeomagnetic data. As for the data of the geophysical surveyof Goias, acquired during the period of 2004 to 2005, we usedthe built-in IGRF reference fields, available in the softwarepackage Geosoft Oasis Montaj.
The removal of the field originating in the core of theEarth and the external variations occurring mainly in theionosphere and the sun allows derivation of the field ofcrustal origin.This crustal field was corrected for heading andincorporated into an ensemble of corrected data sets. Filterswere then applied to correct directional trends. In addition,leveling and microleveling corrections were carried out toeliminate distortions of flight lines [12].
3.3. Geothermal Data Base. Current understanding of thethermal field of subsurface layers in the geologic provinces ofBrazil is based mainly on results of heat flow studies, analysisof physical and chemical characteristics of thermal springs,and assessments of geothermal resources, carried out since1970 [13–18]. Parts of this information have been gatheredand organized as a modern database by the GeothermalLaboratory of the National Observatory in Rio de Janeiro.
This database refers to geothermal measurements at 1212localities in the Brazilian territory. According to this compi-lation geothermal measurements have been carried out at 135localities in the study area.
The values of geothermal gradients and heat flow inthis database include those derived from results of directmeasurements as well as indirect estimates. Several methodshave been employed depending on the nature of primarygeothermal data [15, 19]. Among these, we highlight thefollowing.
3.3.1. Conventional: CVL [20]. This is the classical methodin which temperature gradient is calculated by least squarefit to borehole log data, within selected depth ranges. Theuse of this method is best suited for cases where the localrock formations are laterally homogeneous and have constantthermal properties. It is also important that influences ofprocesses (such as drilling disturbances, groundwater flows,local geologic structures, and climate change effects) whichinduce thermal perturbations at the site are absent.
3.3.2. Bottom Hole Temperature: BHT [21]. This methodmakes use of bottom-hole temperatures measured in deep oilwells for determination of apparent geothermal gradients andheat flow.The data are usually corrected for disturbing effectsof drilling activity.
3.3.3. Geochemical Estimates: GCL [22]. The principle ofthis method is based on the argument that abundances ofcertain chemical elements dissolved in thermal waters pro-vide indirect information on the temperatures of geothermalreservoirs.This data along with inferences on subsurface geo-logical structures allows estimates of geothermal gradientsand heat flow at sites of thermal springs.
Hamza and Munoz, 1996 [15], and Gomes and Hamza,2005 [19], have provided detailed information on the useof these methods and assessment of quality and reliabilityof the results obtained. Standard methods are employed ininterpolation and gridding of geothermal data and in derivingmaps of geothermal gradients and heat flow.Amajor problemwith the geothermal database is its relatively low data density,a limitation arising from the well-known practical difficultiesin acquiring field data. Thus geothermal maps are generallyuseful only for identifying regional trends, but lack resolutionneeded for identification of small-scale structures and nearsurface features.
4. Results Obtained
4.1. Residual Magnetic Field. On conclusion of the correctionprocedures of the data sets, described in Section 3.2, tech-niques of suturewere employed in unifying the corrected datasets [23].This technique unites the data sets with a minimumof distortion along their contact boundaries, making smoothinterpolations of trends present in their interior parts. Theresults obtained at this stage were used in deriving the map ofthe residual magnetic field (also called anomalous magneticfield) of the study area, illustrated in Figure 3. Referring to

4 ISRN Geophysics
0
0.010.010.01
0.02
0.030.03
0.040.070.1
AS
(nT/
m)
20∘
15∘
50∘
45∘
West longitude
Sout
h la
titud
e
Figure 4: Analytic signal derived from the crustal magnetic field.Numbers refer to anomalies in the residual field, indicated in themap of Figure 3.
the map of this figure we note that there are considerablevariations in the intensity of the crustal field in the studyarea, with both negative (lower than 100 nT) and positivevalues (higher than 100 nT).Most of the large-scale variationswith sharp changes between positive and negative valuesare associated with geologic structures at relatively shallowdepths. Locations of nine such structures are indicated in themap of Figure 3.
Comparison with the geologymap of Figure 1 reveals thatmost of the large magnitude positive anomalies are situatedin areas of outcrops of basement rocks. A notable exceptionto this trend is the SE-NW belt of anomalies cutting acrossthe Sao Francisco province. This is the preferred directionof many of the structural features in the South Americanplatform. According to geological studies, metamorphic beltsalong this direction are marked by expressions of intensedeformation, crustal accretion, and reworking [24] whichexplain this strong magnetic manifestation. Hence the pos-sibility that a belt of basement rocks occurring beneath thethin cover of Proterozoic rocks contributes to the occurrenceof such anomalies cannot be ruled out. Most of the negativeanomalies are found to occur along parallel belt, cuttingacross the southern part of Tocantins province and northernpart of the Sao Francisco province. Some isolated negativeanomalies also occur in the southeastern parts of the SaoFrancisco province. Additional information on the tectoniccontext of such structures is given in the list of Table 1, whichalso includes maps of the individual anomalies.
4.2. Analytic Signal. Another technique used in interpre-tation of aeromagnetic data is the analytic signal [25–27],which is basically the magnitude of the second derivative inthe three directions of the magnetic field. In practice, theanalytical signal is regarded as the best tool for locating theedges of bodies that have magnetic contrast. When applied tothe residual field magnetic anomaly the responses highlightthe surface boundaries of geological bodies with contrasts in
20∘
15∘
50∘
45∘
West longitude
Sout
h la
titud
e
−40
−15−10
−5
0101520303540<40
(𝜇T/
m)
Figure 5:Map of the vertical derivative of crustalmagnetic field.Theblue lines represent the lineaments inferred from the distribution ofvertical derivatives.
magnetic properties relative to the surrounding rocks. Hsu,2002 [28], suggests use of second and even higher orderderivative to better highlight the bodies. However, higherorders enhance the noise leading to unrealistic solutions,especially when dealing with low quality data sets.
The geographic distribution of analytic signal for the dataof the present work is illustrated in the map of Figure 4. Itis clear that there are substantial variations in the magnitudeof the analytic signal, the maximum value being 0.1 nT/m. Asexpected, most of the variations occur in localities of residualmagnetic anomalies, indicated in the map of Figure 3 andlisted in Table 1. These are considered as indicative of bodieswith contrasts inmagnetic properties and located at relativelyshallow depths. A zone of low values of the analytic signal isfound to occur in the north-central parts of the study area.But its interpretation is difficult in view of the lack of suitabledata in the adjacent area to the west.
4.3. Vertical Derivatives. Following the common practice ininterpretation of aeromagnetic data the technique of spatialderivative (see, e.g., Gunn, 1975 [29]) has been employedin the present work. The objective has been to highlightthe features associated with high frequency variations in theresidual magnetic field and mitigate features associated withlow frequency variations.Themap of vertical derivative of thestudy area is illustrated in Figure 5.
Note that the features in this map appear as linear mag-netic minima, edges, and dislocations in the local field. Someof them appear as ridge-like features in the map of verticalderivatives. The geographic distributions of such ridges arefound to be linear in many cases and following standardpractice have been classified as magnetic lineaments. Themechanisms responsible for the connectivity of magneticlineaments are believed to be the changes in magneticproperties and brittle behavior of the geological formationsfrom the action of local tectonic forces [30, 31].
A total of 67 lineaments were identified. Some of themajor regional lineaments are indicated in the map ofFigure 5. Most of lineaments are found to be predominantly

ISRN Geophysics 5
Table 1: Localities and tectonic context of prominent anomalies of the residual magnetic field. Color codes of residual anomalies are givenin the inset of Figure 3.
Identification Locality Tectonic context Residual anomaly
1 Caldas Novas Tocantins province.Basic intrusion in area with thermal springs.
2 Patrocınio Tocantins province.Alkaline intrusion with remnant magnetism.
3 Pedrinopolis Tocantins province.Intense anomaly in metamorphic fold belt.
4 Araxa Tocantins province.Alkaline intrusion with remnant magnetism.
5 Itabirito Sao Francisco province.Area with extensive iron ore deposits.
6 Pirapora Sao Francisco province.Basic intrusion of the Espinhaco sequence.
7 Santa Fe de Goias Tocantins province.Located in the Magmatic Arc of Goias.
8 Pocos de Caldas Tocantins province.Area with extensive iron ore deposits.

6 ISRN Geophysics
Table 1: Continued.
Identification Locality Tectonic context Residual anomaly
9 Catalao Tocantins province.Alkaline intrusion with remnant magnetism.
20∘
15∘
50∘ 45
∘
West longitude
Sout
h la
titud
e
Dep
ht (k
m)
10
20
25
30
>40
Figure 6: Depth of the anomalous magnetic sources from Eulerdeconvolution results.
in the NE-SW direction, coincident with the preferred direc-tions identified in the geological surveys (e.g., Blum [32]).These are found to cross the two structural provinces ofTocantins and Sao Francisco, which has also been identifiedin geological studies (e.g., Heilbron and Machado [33]).
4.4. Euler Deconvolution. TheEuler deconvolution technique[34] employed in this work has the objective of extractinginformation about the depths of magnetic sources.The resultis independent of the direction and inclination of the mainmagnetic field and the orientation of the magnetic sources.Thus, the method is relatively insensitive to small-scaledistortions of the field. A total magnetic anomaly (𝑇) withoutcorrection of regional values produced by a set of three-dimensional sources satisfies the homogeneous field equationof Euler:
(𝑥 − 𝑥0)𝜕
𝜕𝑥𝑇 + (𝑦 − 𝑦
0)𝜕
𝜕𝑦𝑇 + (𝑧 − 𝑧
0)𝜕
𝜕𝑧𝑇 = −𝜂𝑇, (1)
where 𝑥0, 𝑦0, and 𝑧
0are the initial coordinate positions of the
anomalous source and 𝜂 is the structural index as defined in[34].
Following the practice adopted in the literature the varia-tions in the degree of homogeneity of the field are associatedwith a set of structural indices, which specifies the type ofmagnetic source. According to Thompson [26] a structuralindex of zero represents contact between different types of
rocks, while indices of 0.5 and 1 represent, respectively, linearfeatures such as faults and dykes. Also, the structural indices2 and 3 are indicative of cylindrical and spherical structures,respectively. The success of the method is evaluated in aqualitative way, through accumulation of solutions associatedwith the different indices.
In an attempt tominimize biased interpretations in deter-mining the depths, the following guidelines were adopted inthe use of this technique.
(1) The established limit for uncertainty in the depthvalue, calculated by the Euler equation, is 10%.
(2) Themagnetic anomaliesmodeled are dipolar features,consistent with the current knowledge of deep geo-logical structures. Since the focus of the study is onregional scale variations, we follow the practice ofHsu[28] and use the structural index three in the solutionof Euler equation.
(3) The size of the interpolation window of the programused to calculate the Euler deconvolution is 15 km.According to standard practice this value of windowsize corresponds to sources of 3 to 6 km extension.
The results obtained indicating the depths of sources areillustrated in themap of Figure 6. In the present case, themapderived is based on results of using the krigrid interpolationmethod [23], with a grid spacing of 0.5 degrees (∼55.7 km).The grid-averaged depths of anomalous magnetic sources arein the ranges of 10 to 50 km, as indicated in the color scale ofthis figure.
Note that the depths of bodies in the north-west sectorof the Tocantins province and in the southeastern potionof Sao Francisco craton are in the range 10 to 20 km. Onthe other hand, the depths of bodies in northern parts ofthe Sao Francisco province and in the southern parts of theTocantins province are in the range of 25 to 50 km. Thereare indications that the systematic differences in the depthsof magnetic sources arise from mechanisms related to thethermal regime of the crust.
4.5. Maps of Geothermal Gradients and Heat Flow. Thegeothermal data compiled in the present work has beenemployed in interpolation of values with grid spacing of 0.5degrees (55.7 km). The maps of geothermal gradients andterrestrial heat flow derived from the gridded data sets areillustrated in Figures 7(a) and 7(b). Also indicated in thesemaps are localities of geothermal measurements.
The geothermal gradient map (Figure 7(a)) reveals azone of relatively high values (greater than 18∘C/km) along

ISRN Geophysics 7
20∘
15∘
50∘
45∘
West longitude
Sout
h la
titud
e
12
15
18
21
24
27
30
33
36
Geothermal measurements
(∘C/
km)
(a)
20∘
15∘
Sout
h la
titud
e
50∘
45∘
West longitude
Geothermal measurements
35
40
45
50
55
60
65
70
75
80
(mW
/m2)
(b)
Figure 7: Maps of geothermal gradient (a) and heat flow (b) in the study area.The black dots indicate localities of geothermal measurements.
a narrow belt in the western and extreme southern parts ofthe Tocantins province. On the other hand, the Sao Franciscoprovince is characterized by relatively low thermal gradientsin the range 10 to 18∘C/km. The heat flow map of the studyarea shown in Figure 7(b) reveals features similar to those ofthe geothermal gradient. Thus, heat flow values in excess of50mW/m2 occur along narrow belts in the western parts ofthe Tocantins province, whereas most of the Sao Franciscoprovince is characterized by heat flow values of less than50mW/m2. Comparative analysis of features discernible inFigures 6 and 7 points to an inverse correlation betweenthermal and magnetic characteristics of the study area.Thus, areas of high geothermal gradients and heat flow arecharacterized by sources of magnetic anomalies at relativelyshallow depths and vice versa.
5. Discussion and Conclusions
The present work constitutes a regional scale investigationof the thermal and magnetic characteristics of the crust inthe southern sector of the geologic provinces of Tocantinsand Sao Francisco, Brazil. Use of such techniques as verticalderivative, analytic signal, and Euler deconvolution in analy-sis of aeromagnetic data has allowed a better understandingof the sources of magnetic anomalies and estimates of theirrespective depths. There are indications that anomalies inthe Tocantins province arise from variations in the mag-netic susceptibilities and remnant magnetizations of alkalinemagmatic intrusions of the Tertiary period. The lateraldimensions of the bodies are less than 10 km, and these arefound to occur at shallow depths of less than 20 km. On theother hand, the anomalies in the cratonic areas are relatedto contrasts in magnetic properties of bodies situated atdepths greater than 20 km and have spatial dimensions ofmore than 50 km. Analysis of geothermal data reveals thatthe cratonic area is characterized by geothermal gradients
and heat flow values lower when compared with those ofthe Tocantins province. There are indications of an inversecorrelation between thermal and magnetic characteristics ofthe study area. Thus, areas of high geothermal gradients andheat flow are characterized by sources of magnetic anomaliesat relatively shallow depths and vice versa.
Acknowledgments
The authors thank the Mineral Resources Research Com-pany (CPRM), the National Commission of Nuclear Energy(CNEN), and the Superintendent of Geology and Mining ofGoias (SIC/SGM-GO) for the donation of the geophysicaldata, and the Coordenacao de Aperfeicoamento de Pessoalde Nıvel Superior-CAPES for financial support.
References
[1] F. F. M. de Almeida, “O Craton do Sao Francisco,” RevistaBrasileira De Geociencias, vol. 7, pp. 349–364, 1977.
[2] F. F. M. de Almeida, Y. Hasui, B. B. Brito Neves, and R. A. Fuck,“Brazilian structural provinces: an introduction,” Earth-ScienceReviews, vol. 17, pp. 1–19, 1981.
[3] CPRM-Servico Geologico do Brasil, “Geologia, Tectonica eRecursos Minerais do Brasil: texto, mapas & SIG,” 2003.
[4] SGM-Superintendencia de Geologia eMineracao, “Geologia doEstado de Goias e Distrito Federal,” Goiania, p. 143, 2008.
[5] C. H. Alexandrino and V. M. Hamza, “Estimates of heat flowand heat production and a thermal model of the Sao Franciscocraton,” International Journal of Earth Sciences, vol. 97, no. 2, pp.289–306, 2008.
[6] F. F. Alkmim and S. Marshak, “Transamazonian orogeny in theSouthern Sao Francisco Craton Region, Minas Gerais, Brazil:evidence for Paleoproterozoic collision and collapse in theQuadrilatero Ferrıfero,” Precambrian Research, vol. 90, no. 1-2,pp. 29–58, 1998.

8 ISRN Geophysics
[7] M. A. Santos Pinto, Le Recyclage de la Croute ContinentaleArcheene: Exemple du Bloc du Gaviao—Bahia, Brasil [These dedoctorat], Universite de Rennes I, Franca, 1996.
[8] W. Teixeira, P. Sabate, J. S. F. Barbosa, C. M. Noce, and M.A. Carneiro, “Archean and Paleoproterozoic Tectonic evolutionof the Sao Francisco Craton, Brazil,” in Proceedings of the 31stInternational Geologic Congress, U. G. Cordani, E. J. Milani,A. Thomas Filho, and D. A. Campos, Eds., pp. 101–137, Rio deJaneiro, Brazil, 2000.
[9] M. M. Pimentel and R. A. Fuck, “Neoproterozoic crustalaccretion in central Brazil,” Geology, vol. 20, no. 4, pp. 375–379,1992.
[10] G. S. L. A. de Franca, Estrutura da Crosta no sudeste e centro-oeste do Brasil, usando funcao do receptor Local: Sao Paulo[Ph.D. thesis], Instituto de Astronomia e Geofısica, Universi-dade de Sao Paulo, 2003.
[11] I. C. Briggs, “Machine contouring using minimum curvature,”Geophysics, vol. 39, pp. 38–48, 1974.
[12] B. S. R. Minty, “Simple micro-leveling for aeromagnetic data,”Exploration Geophysics, vol. 22, pp. 591–592, 1991.
[13] V. M. Hamza, S. M. Eston, and R. L. C. Araujo, “Geothermalenergy prospects in Brazil: a preliminary analysis,” Pure andApplied Geophysics, vol. 117, no. 1-2, pp. 180–195, 1978.
[14] V. M. Hamza, S. M. Eston, R. L. C. Araujo, I. Vitorello, andN. Ussami, “Brazilian Geothermal Data Collection-Series I,”Publication no. 1109, Instituto de Pesquisas Tecnologicas doEstado de Sao Paulo, Sao Paulo, Brazil, 1978.
[15] V.M.Hamza andM.Munoz, “Heat flowmapof SouthAmerica,”Geothermics, vol. 25, pp. 599–646, 1996.
[16] S. J. Hurter, Aplicacao dos geotermometros quımicos em aguasde fontes brasileiras na determinacao de fluxo geotermico [M.Sc.thesis], Instituto de Astrononia e Geofısica, Universidade de SaoPaulo, Sao Paulo, Brazil, 1987.
[17] S. J. Hurter, S. M. Eston, and V. M. Hamza, “Brazilian Geother-mal Data Collection Series 2-Thermal Springs,” Publication no.1233, Instituto de Pesquisas Tecnologicas do Estado de SaoPaulo s/a-IPT, 1983.
[18] I. Vitorello, V. M. Hamza, and H. N. Pollack, “Terrestrial heatflow in the Brazilian highlands,” Journal of Geophysical Research,vol. 85, no. 7, pp. 3778–3788, 1980.
[19] A. J. L. Gomes and V. M. Hamza, “Geothermal gradient andheat flow in the state of Rio de Janeiro,” Brazilian Journal ofGeophysics, vol. 23, pp. 325–347, 2005.
[20] A. E. Beck, “Techniques of measuring heat flow on land,” in Ter-restrial Heat Flow, W. H. K. Lee, Ed., Geophysical MonographSeries 8, pp. 24–57, AGU, Washington, DC, USA, 1965.
[21] H. Da Silva Carvalho andV. Vacquier, “Method for determiningterrestrial heat flow in oil fields,” Geophysics, vol. 42, no. 3, pp.584–593, 1977.
[22] C. A. Swanberg and P. Morgan, “The linear relation betweentemperatures based on the silica content of groundwater andregional heat flow: a new heat flow map of the United States,”Pure and Applied Geophysics, vol. 117, no. 1-2, pp. 227–241, 1978.
[23] A. G. Journel and J. C. Huijbrogts, Mining Geostatistics, Aca-demic Press, London, UK, 1978.
[24] I. Endo and R. Machado, “Reavaliacao e novos dadosgeocronologicos (Pb/Pb e K/Ar) da regiao do QuadrilateroFerrıfero e adjacencias,” Geologia USP, vol. 2, no. 1, pp. 23–40,2002.
[25] M. N. Nabighian, “The analytic signal of two dimensionalmagnetic bodies with polygonal cross-section: its properties
and use for automated anomaly interpretation,”Geophysics, vol.37, no. 3, pp. 507–517, 1972.
[26] D. T. Thompson, “EULDPH: a new technique for makingcomputer-assisted depth estimates from magnetic data,” Geo-physics, vol. 47, pp. 31–37, 1982.
[27] R. J. Blakely andR.W. Simpson, “Approximating edges of sourcebodies frommagnetic or gravity anomalies,”Geophysics, vol. 51,no. 7, pp. 1494–1498, 1986.
[28] S. K. Hsu, “Imaging magnetic sources using Euler’s equation,”Geophysical Prospecting, vol. 50, pp. 15–25, 2002.
[29] P. J. Gunn, “Linear transformation of gravity and magneticfields,” Geophysical Prospecting, vol. 23, no. 2, pp. 300–312, 1975.
[30] P. H. O. Costa, A. R. F. Andrade, G. A. Lopes, and S. L.Souza, “Projeto Lagoa Real. Mapeamento Geologico, 1:25.000,”Nuclebras/CBPM, Salvador, Bahia, 1985.
[31] L. S. Osako, Estudo do potencial mineral do deposito uranıferode Lagoa Real, BA, com base em dados geologicos, aerogeofısicose sensoriamento remoto [M.Sc. thesis], Instituto de Geociencias,Universidade Estadual de Campinas, 1999.
[32] M. Blum, Processamento e Interpretacao de Dados de GeofısicaAerea no Brasil Central e sua aplicacao a Geologia Regional ea Prospeccao Mineral [Ph.D. thesis], Instituto de Geociencias,Universidade de Brasılia, 1999.
[33] M. Heilbron and N. Machado, “Timing of terrane accretionin the Neoproterozoic-Eopaleozoic Ribeira Orogen (se Brazil),”Precambrian Research, vol. 125, no. 1-2, pp. 87–112, 2003.
[34] A. B. Reid, J. M. Allsop, H. Granser, A. J. Millett, and I. W.Somerton, “Magnetic interpretation in three dimensions usingEuler deconvolution,” Geophysics, vol. 55, no. 1, pp. 80–91, 1990.

Submit your manuscripts athttp://www.hindawi.com
Hindawi Publishing Corporationhttp://www.hindawi.com Volume 2014
ClimatologyJournal of
EcologyInternational Journal of
Hindawi Publishing Corporationhttp://www.hindawi.com Volume 2014
EarthquakesJournal of
Hindawi Publishing Corporationhttp://www.hindawi.com Volume 2014
Hindawi Publishing Corporationhttp://www.hindawi.com
Applied &EnvironmentalSoil Science
Volume 2014
Mining
Hindawi Publishing Corporationhttp://www.hindawi.com Volume 2014
Journal of
Hindawi Publishing Corporation http://www.hindawi.com Volume 2014
International Journal of
Geophysics
OceanographyInternational Journal of
Hindawi Publishing Corporationhttp://www.hindawi.com Volume 2014
Journal of Computational Environmental SciencesHindawi Publishing Corporationhttp://www.hindawi.com Volume 2014
Journal ofPetroleum Engineering
Hindawi Publishing Corporationhttp://www.hindawi.com Volume 2014
GeochemistryHindawi Publishing Corporationhttp://www.hindawi.com Volume 2014
Journal of
Atmospheric SciencesInternational Journal of
Hindawi Publishing Corporationhttp://www.hindawi.com Volume 2014
OceanographyHindawi Publishing Corporationhttp://www.hindawi.com Volume 2014
Advances in
Hindawi Publishing Corporationhttp://www.hindawi.com Volume 2014
MineralogyInternational Journal of
Hindawi Publishing Corporationhttp://www.hindawi.com Volume 2014
MeteorologyAdvances in
The Scientific World JournalHindawi Publishing Corporation http://www.hindawi.com Volume 2014
Paleontology JournalHindawi Publishing Corporationhttp://www.hindawi.com Volume 2014
ScientificaHindawi Publishing Corporationhttp://www.hindawi.com Volume 2014
Hindawi Publishing Corporationhttp://www.hindawi.com Volume 2014
Geological ResearchJournal of
Hindawi Publishing Corporationhttp://www.hindawi.com Volume 2014
Geology Advances in