Embed Size (px)
Citation preview
Research ArticleTerahertz Absorption Spectroscopy of Benzamide, Acrylamide,Caprolactam, Salicylamide, and Sulfanilamide in the Solid State
Ye Jiang,1 Fengshan Zhou,2 Xiaodong Wen,3 Limin Yang,3 Guozhong Zhao,4 He Wang,4
Haiyan Wang,4 Yanjun Zhai,1 Jinguang Wu,5 Kexin Liu,3 and Jia’er Chen3
1 College of Pharmacy, Liaoning University of Traditional Chinese Medicine, Dalian 116600, China2 School of Materials Science and Technology, China University of Geosciences, Beijing 100083, China3 State Key Laboratory of Nuclear Physics and Technology, Institute of Heavy Ion Physics, School of Physics, Peking University,Beijing 100871, China
4Department of Physics, Capital Normal University, Beijing 100037, China5The State Key Laboratory of Rare Earth Materials Chemistry and Applications, College of Chemistry and Molecular Engineering,Peking University, Beijing 100871, China
Correspondence should be addressed to Fengshan Zhou; [email protected] and Yanjun Zhai; [email protected]
Received 6 September 2013; Accepted 14 December 2013; Published 16 February 2014
Academic Editor: Yizhuang Xu
Copyright © 2014 Ye Jiang et al. This is an open access article distributed under the Creative Commons Attribution License, whichpermits unrestricted use, distribution, and reproduction in any medium, provided the original work is properly cited.
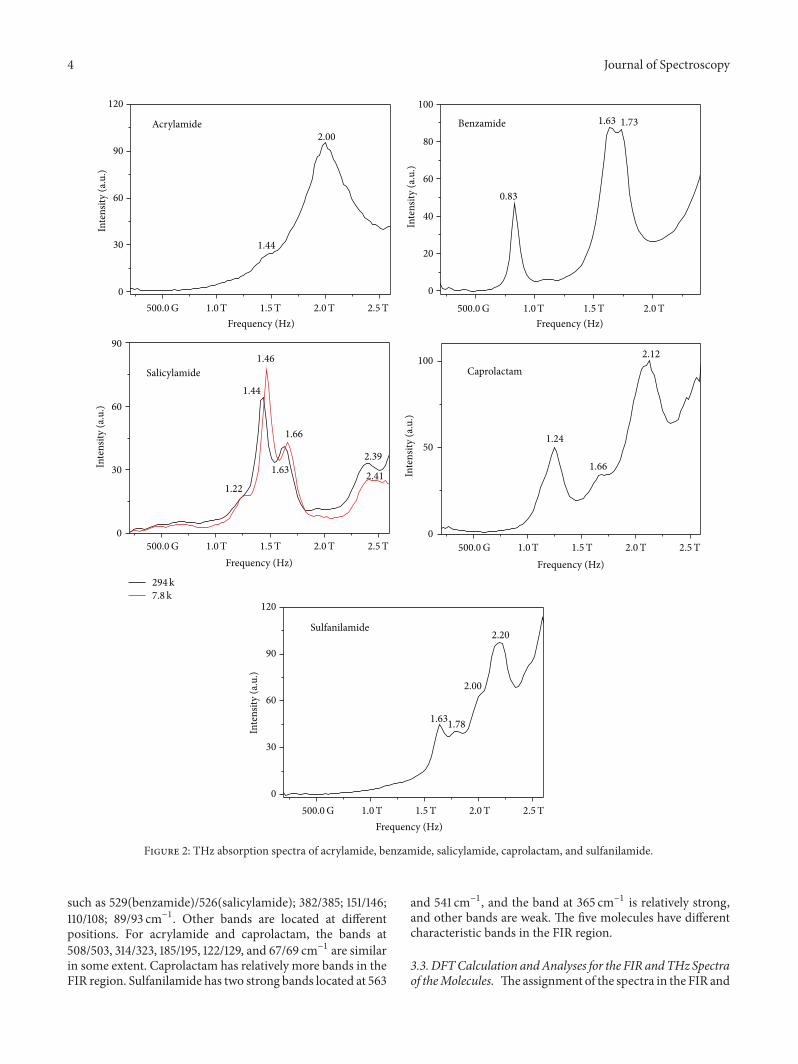
Terahertz (THz) absorption spectra of the similarly structured molecules with amide groups including benzamide, acrylamide,caprolactam, salicylamide, and sulfanilamide in the solid phase at room temperature and 7.8 K for salicylamide are reported andcompared to infrared vibrational spectral calculations using density functional theory. The results of THz absorption spectra showthat the molecules have characteristic bands in the region of 0.2–2.6 THz (∼7–87 cm−1). THz technique can be used to distinguishdifferent molecules with amide groups. In the THz region benzamide has three bands at 0.83, 1.63, and 1.73 THz; the bands arelocated at 1.44 and 2.00 THz for acrylamide; the bands at 1.24, 1.66 and 2.12 THz are observed for caprolactam. The absorptionbands are located at 1.44, 1.63, and 2.39 THz at room temperature, and at 1.22, 1.46, 1.66, and 2.41 THz at low temperature forsalicylamide. The bands at 1.63, 1.78, 2.00, and 2.20 THz appear for sulfanilamide. These bands in the THz region may be related totorsion, rocking, wagging, and other modes of different groups in the molecules.
1. Introduction
Spectroscopy is a powerful technique for measuring, analyz-ing, and identifying various molecules. Frequencies in thefar-infrared (FIR, 650–50 cm−1) and terahertz (THz) (0.1–10 THz, or 3.3–333.6 cm−1) ranges correspond to motionsof the entire molecular structure, involving relatively largemasses and relatively shallow potentials [1, 2]. THz spec-troscopy is being used for a number of important analyticalapplications in such areas as threat detection [3–5] andpharmaceutical characterization [6–8]. Its utility stems fromsolid-state compounds andmolecules containing low-energyvibrations that, taken as a whole in this region, serve asspectral “fingerprints” usable for their detection and charac-terization. THz spectroscopy of condensed-phase biological
samples are investigated ranging from the simple crystallineforms of amino acids, carbohydrates, and polypeptides tothe more complex aqueous forms of small proteins, DNA,and RNA [9–14]. THz hydration studies uncovered thatthe dynamical hydration shell of saccharides consists ofseveral hundred water molecules and up to thousand watermolecules for proteins [15–17]. THz spectroscopy is regardedas the renaissance of far-infrared spectroscopy [18].
Amide groups contribute significantly to the proteinstructure. A variety of techniques such as IR, NMR, Raman,ultrasonic absorption, and UV/Vis spectroscopies have beenused to characterize both the intermolecular and intramolec-ular bonding in amide compounds [19–22]. Salicylamide isa nonsteroidal anti-inflammatory agent with analgesic andantipyretic properties. Its therapeutic action and potential
Hindawi Publishing CorporationJournal of SpectroscopyVolume 2014, Article ID 732802, 9 pageshttp://dx.doi.org/10.1155/2014/732802

2 Journal of Spectroscopy
toxicity are still the subject of research, which makes itnecessary to control its presence in biological fluids [23]. Foracrylamide, it is found that its administration to laboratoryanimals caused tumor formation in various organs, the exactmechanism involved still being unclear [24, 25]. Sulfanil-amides are successfully employed as effective chemother-apeutic agents for the prevention and cure of bacterialinfections in human biological systems. Determination ofmolecules with amide groups is essential in many analyses ofbiological and clinical applications.
Here we have investigated the low-frequency vibrationalmotions of salicylamide, benzamide, acrylamide, caprolac-tam, and sulfanilamide in the solid state by concentratingon the spectral region between 7 and 650 cm−1 where crystallattice vibrations, hydrogen bond bending modes and collec-tive modes, and so forth may occur [26]. The experimentalresults indicate that FIR andTHz time-domain technique canbe effective tools to detect different molecules with amidegroups and the bands in the region may be related to torsion,rocking, wagging, and other modes of different groups of themolecules.
2. Experimental
2.1. Materials. Salicylamide, benzamide, acrylamide, capro-lactam, and sulfanilamide were obtained from commercialsources and used without further purification.
2.2. Physical Measurements. The THz absorption spectrawere recorded on the THz time-domain device of CapitalNormal University of China, based on photoconductiveswitches for generation and electrooptical crystal detectionof the far-infrared light. The experimental apparatus forterahertz transmission measurements has been discussedin detail elsewhere [27]. The preparation of the sampleswas by pressing mixed pellets with polyethylene powder(pure sample for benzamide); the diameter of the samplesis 13mm and the thickness of the samples is about 0.8mm.The detection of THz absorption spectra was carried out atN2
atmosphere to avoid the influence of water vapor. Theresolution of the spectra is 40GHz. The THz frequency-domain spectra were obtained from the corresponding THztime-domain spectra via Fast Fourier Transform. Throughcomparison of THz frequency-domain spectra of the samplesand corresponding references, the THz absorption spectra ofthe samples were obtained. Effective spectrum range is 0.2–2.6 THz, respectively.
The FIR spectra of benzamide, acrylamide, caprolactam,and salicylamide were measured using common used Nujolmull method, because mineral oil has no absorption in thefar-IR region and themethod can protect sample in solid stateagainst wet and avoid distortion of bands or happening ofion exchange. Samples were suspended in the Nujol mull andthenwere daubed on a thin polyethylenewindowand anotherthin polyethylenewindow as background for comparison. Farinfrared spectra in the range of 650–50 cm−1 were taken on aNicolet Magna-IR 750-II Spectrometer at room temperatureand at 8 cm−1 resolution, 128 scans. The optical bench was
purged with dried air.The FIR spectrum of sulfanilamide wasmeasured on a Bruker VERTEX 80v FTIR spectrometer at4 cm−1 resolution and 32 scans.The preparation of the samplewas by pressing mixed pellets with polyethylene powder.
All theoretical calculations were performed with theGaussian 03 software package [28]. Density functional theory(DFT) calculations were used to determine the equilib-rium structures and harmonic vibrational frequencies of themolecules. The B3LYP [29] hybrid density functional wasused with the 6-311++G (3df, 2pd), Gaussian-type basis set[30]. Full geometry optimizations were conducted in eachcase and harmonic frequency analyses performed on theseoptimized structures.
3. Results and Discussion
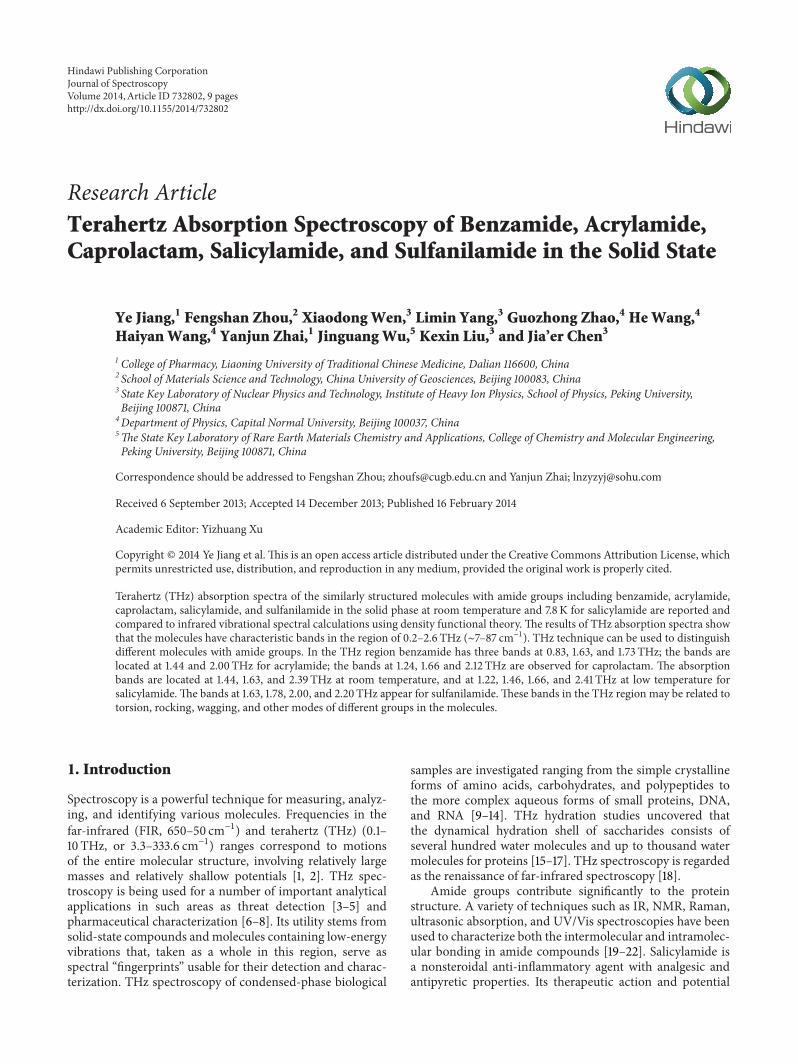
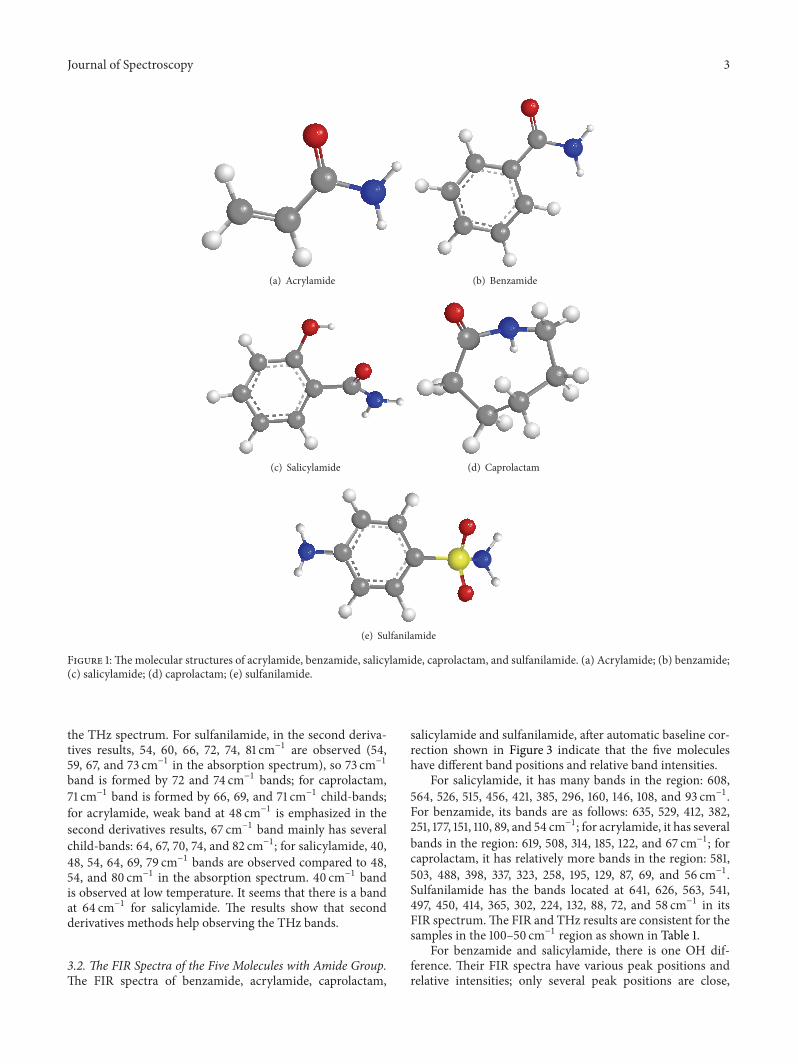
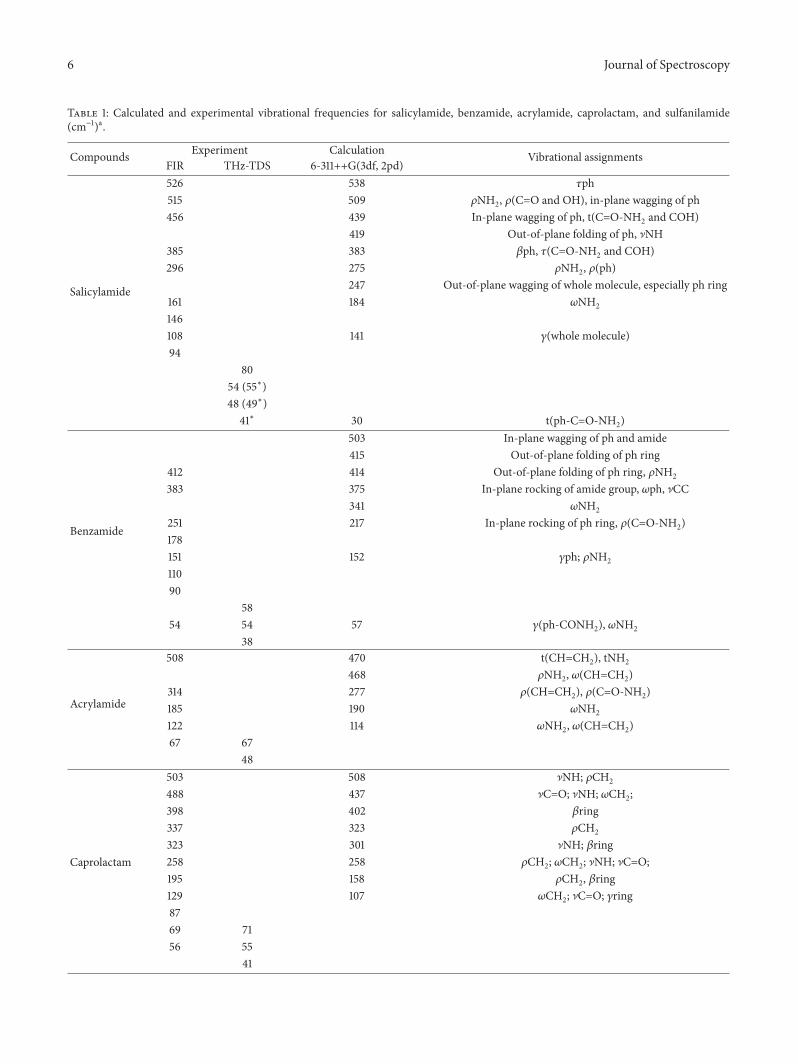
The molecular structures of benzamide, acrylamide, cap-rolactam, salicylamide, and sulfanilamide are shown inFigure 1.The THz and FIR spectra of benzamide, acrylamide,caprolactam, salicylamide, and sulfanilamide are shown inFigures 2 and 3, respectively. The corresponding band posi-tions in the FIR and THz absorption spectra of the samplesand possible assignments are listed in Table 1.
3.1. The THz Absorption Spectra of the Molecules. All of thestructures of benzamide, acrylamide, caprolactam, salicy-lamide and sulfanilamide have amide groups. The differenceof benzamide, and salicylamide is that there is one moreOH group in the structure of salicylamide, and both of thetwo molecules have benzene ring (ph). The THz absorptionspectra of benzamide, acrylamide, caprolactam, salicylamideand sulfanilamide in Figure 2 show that in the THz regionbenzamide has three bands: 0.83, 1.63, and 1.73 THz (38,54, 58 cm−1); acrylamide has two bands located at 1.44 and2.00 THz (48 and 67 cm−1); caprolactam has three bands at1.24, 1.66 and 2.12 THz (41, 55 and 71 cm−1). The absorptionbands of salicylamide are located at 1.44, 1.63, and 2.39 THz(48, 54, 80 cm−1) at room temperature, and its bands haveshifted to 1.46, 1.66, and 2.41 THz (49, 55 and 80 cm−1), and1.22 THz (41 cm−1) band becomes clear at low temperature.For sulfanilamide, the bands are located at 1.63, 1.78, 2.00and 2.20 THz (54, 59, 67, and 73 cm−1). For these molecules,some of the peak positions are similar, for example, 1.63 THzfor benzamide, salicylamide, and sulfanilamide, 1.66 THzfor caprolactam; 1.22 and 1.24 THz for salicylamide andcaprolactam; 2.00 THz for benzamide and sulfanilamide; 1.44and 1.46 THz for caprolactam and salicylamide, respectively.However, most of the bands are different in peak positionsand relative intensities, which show that THz method issensitive to different molecular structures.
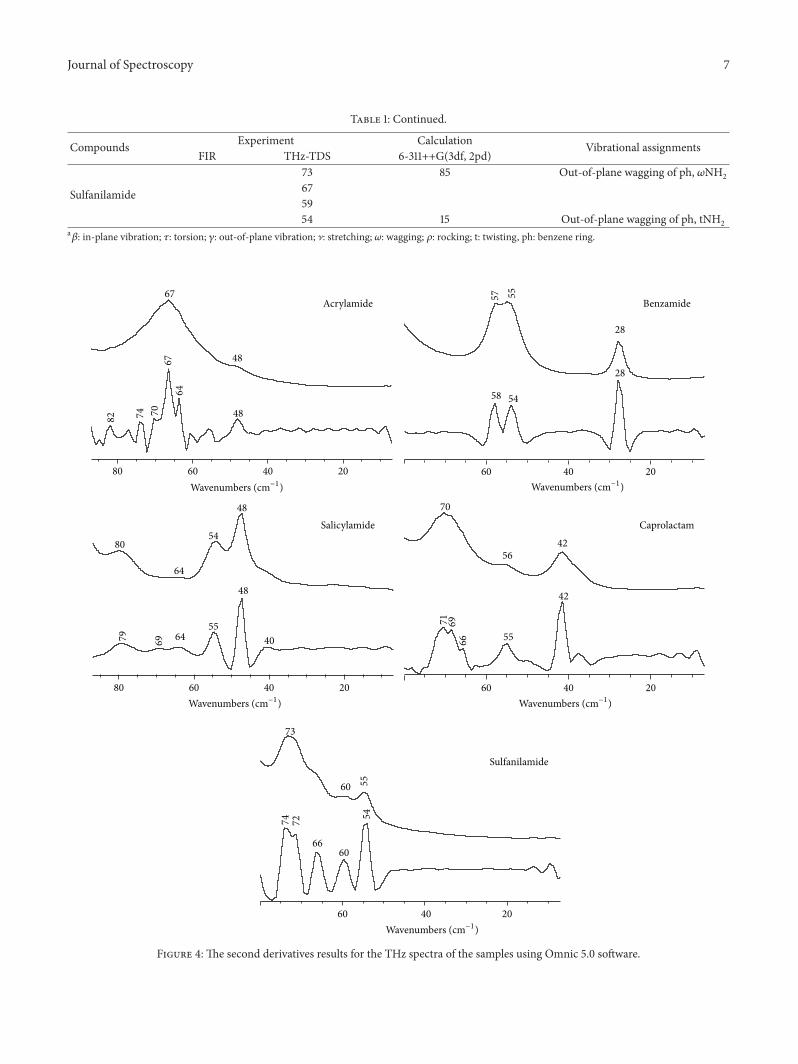
To clarify the bands in the THz region, second derivativeshave been performed using Omnic 5.0 software for the THzspectra of the samples, and the results show that main bandsand some relatively minor bands are observed in the secondderivatives results (shown in Figure 4). The main bands areobserved for each sample, which has a good agreement withthe corresponding THz absorption spectrum. For benza-mide, only three main bands are observed, it is the same as
Journal of Spectroscopy 3
(a) Acrylamide (b) Benzamide
(c) Salicylamide (d) Caprolactam
(e) Sulfanilamide
Figure 1:The molecular structures of acrylamide, benzamide, salicylamide, caprolactam, and sulfanilamide. (a) Acrylamide; (b) benzamide;(c) salicylamide; (d) caprolactam; (e) sulfanilamide.
the THz spectrum. For sulfanilamide, in the second deriva-tives results, 54, 60, 66, 72, 74, 81 cm−1 are observed (54,59, 67, and 73 cm−1 in the absorption spectrum), so 73 cm−1band is formed by 72 and 74 cm−1 bands; for caprolactam,71 cm−1 band is formed by 66, 69, and 71 cm−1 child-bands;for acrylamide, weak band at 48 cm−1 is emphasized in thesecond derivatives results, 67 cm−1 band mainly has severalchild-bands: 64, 67, 70, 74, and 82 cm−1; for salicylamide, 40,48, 54, 64, 69, 79 cm−1 bands are observed compared to 48,54, and 80 cm−1 in the absorption spectrum. 40 cm−1 bandis observed at low temperature. It seems that there is a bandat 64 cm−1 for salicylamide. The results show that secondderivatives methods help observing the THz bands.
3.2. The FIR Spectra of the Five Molecules with Amide Group.The FIR spectra of benzamide, acrylamide, caprolactam,
salicylamide and sulfanilamide, after automatic baseline cor-rection shown in Figure 3 indicate that the five moleculeshave different band positions and relative band intensities.
For salicylamide, it has many bands in the region: 608,564, 526, 515, 456, 421, 385, 296, 160, 146, 108, and 93 cm−1.For benzamide, its bands are as follows: 635, 529, 412, 382,251, 177, 151, 110, 89, and 54 cm−1; for acrylamide, it has severalbands in the region: 619, 508, 314, 185, 122, and 67 cm−1; forcaprolactam, it has relatively more bands in the region: 581,503, 488, 398, 337, 323, 258, 195, 129, 87, 69, and 56 cm−1.Sulfanilamide has the bands located at 641, 626, 563, 541,497, 450, 414, 365, 302, 224, 132, 88, 72, and 58 cm−1 in itsFIR spectrum.The FIR and THz results are consistent for thesamples in the 100–50 cm−1 region as shown in Table 1.
For benzamide and salicylamide, there is one OH dif-ference. Their FIR spectra have various peak positions andrelative intensities; only several peak positions are close,
4 Journal of Spectroscopy
0
30
60
90
120In
tens
ity (a
.u.)
Frequency (Hz)
1.44
2.00Acrylamide
0
20
40
60
80
100
Inte
nsity
(a.u
.)
Frequency (Hz)
0.83
1.63 1.73Benzamide
0
30
60
90
Inte
nsity
(a.u
.)
Frequency (Hz)
1.22
1.44
1.46
1.66
1.632.39
2.41
Salicylamide
0
50
100
Inte
nsity
(a.u
.)
1.24
1.66
2.12Caprolactam
0
30
60
90
120
Inte
nsity
(a.u
.)
Frequency (Hz)
1.631.78
2.00
2.20Sulfanilamide
294k7.8k
500.0G 1.0T 1.5T 2.0T 2.5T
500.0G 1.0T 1.5T 2.0T 2.5T
Frequency (Hz)500.0G 1.0T 1.5T 2.0T 2.5T
500.0G 1.0T 1.5T 2.0T 2.5T
500.0G 1.0T 1.5T 2.0T
Figure 2: THz absorption spectra of acrylamide, benzamide, salicylamide, caprolactam, and sulfanilamide.
such as 529(benzamide)/526(salicylamide); 382/385; 151/146;110/108; 89/93 cm−1. Other bands are located at differentpositions. For acrylamide and caprolactam, the bands at508/503, 314/323, 185/195, 122/129, and 67/69 cm−1 are similarin some extent. Caprolactam has relatively more bands in theFIR region. Sulfanilamide has two strong bands located at 563
and 541 cm−1, and the band at 365 cm−1 is relatively strong,and other bands are weak. The five molecules have differentcharacteristic bands in the FIR region.
3.3. DFTCalculation andAnalyses for the FIR andTHz Spectraof theMolecules. Theassignment of the spectra in the FIR and

Journal of Spectroscopy 5
548911015
117
7
251
382
412529
635 93108
146
160
296
385
421
45651
5
564
608649
200 400 600
Benzamide
Salicylamide
526
67122
185
314508
619
56
6987
129
195258
323
337
398488
503
581
639
587288132
22430236
5
414
45049
7
541
563
626
200 400 600
Acrylamide
Caprolactam
Sulfanilamide
641
Wavenumbers (cm−1) Wavenumbers (cm−1
)
Figure 3: FIR spectra of acrylamide, benzamide, salicylamide, caprolactam, and sulfanilamide in the 650–50 cm−1 region.
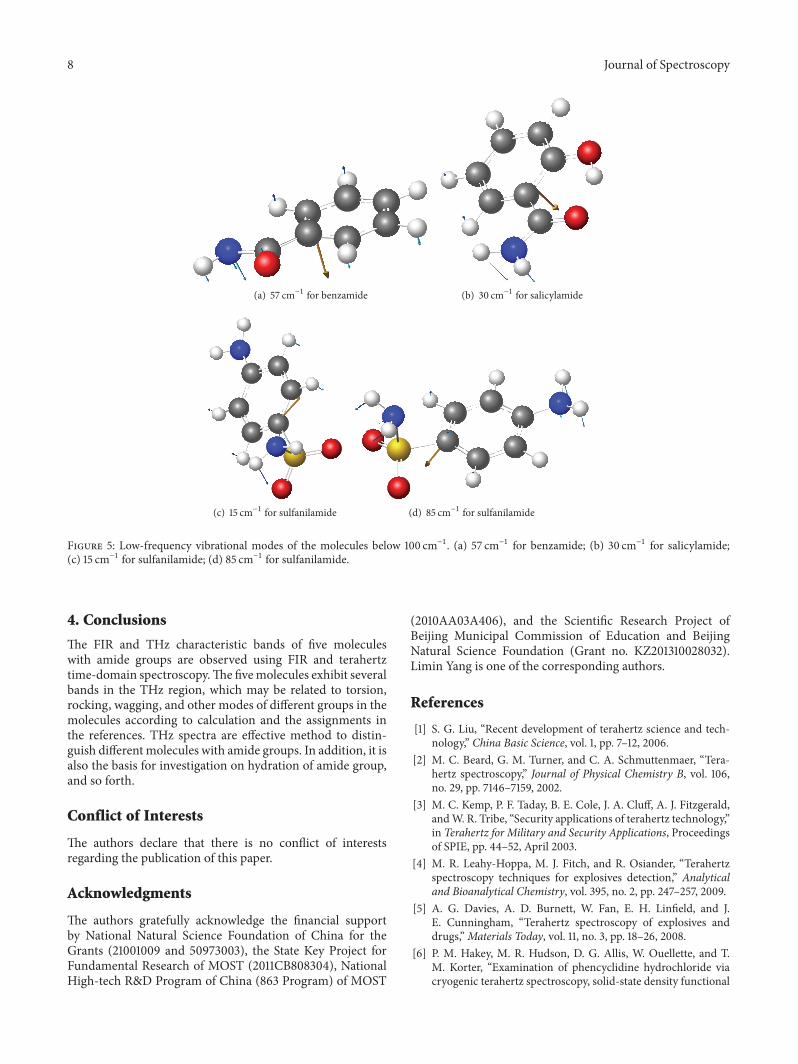
THz region is difficult. Fortunately, there are some calculationresults for benzamide, salicylamide, and sulfanilamide [31–36]. Using similar method shown in the references, based onthe calculated results of RB3LYP/6-311++G (3df, 2pd), andwith the aid of visualization software of Gaussian View 4.1,the observed vibrational modes in the far-infrared and THzregion can be assigned as shown in Table 1. The assignmentis dependent on the result of calculation from molecularstructure and patterns of vibrationalmodes. Some calculationresults for the bands below 100 cm−1 are shown in Figure 5.The calculated band positions are similar to experimentalresults in some extent as the calculations in [31–36], but therelative intensities of the bands compared to experimentalresults are not good as the calculation results for four vitaminmolecules [37].
According to the DFT calculation results (shown inTable 1), the bands in the FIR and THz region mainly consistof movement of whole molecular skeleton. The absorptionbands in the THz region are related to torsion, rocking,wagging, twisting, and other modes of different groups inthe molecules. For example, in the calculation results, themain absorption bands of sulfanilamide below 100 cm−1 arecentered at 15 and 85 cm−1. The 15 cm−1 band correspondsto out-of-plane wagging of ph ring and twisting of NH
2
(theone in S(=O)–NH
2
); 85 cm−1 band is related to out-of-planewagging of ph ring and wagging of two NH
2
; 113 cm−1 bandis related to rocking of NH
2
; 167 cm−1 band is related todeformation of S(=O)–NH
2
and in-plane wagging of ph. Forbenzamide, 554 cm−1 band is assigned to twisting of NH
2
and wagging of ph; 503 cm−1 band is assigned to in-planewagging of ph and amide; 415 cm−1 band is assigned to out-of-plane folding of ph ring; 375 cm−1 band is assigned to in-plane rocking of amide, wagging of ph, and stretching ofCC. 341 cm−1 band is assigned to wagging of NH
2
; 217 cm−1band is assigned to in-plane rocking of the ring, and rockingof C=O–NH
2
; 152 cm−1 band is assigned to out-of-planevibration of ph ring and rocking of NH
2
; 57 cm−1 band
is assigned to out-of-plane vibration of ph–CONH2
andwagging of NH
2
.For salicylamide, 30 cm−1 band is assigned to twisting
of ph–CONH2
; 141 cm−1 band is assigned to out-of-planevibration of whole molecule; 184 cm−1 band is assigned towagging of NH
2
; 247 cm−1 band is assigned to out-of-planewagging of whole molecule, especially ph ring; 275 cm−1
band is assigned to rocking of NH2
, rocking of ph; 383 cm−1band is assigned to in-plane vibration of ph and torsion of(C=O–NH
2
and COH); 419 cm−1 band is assigned to out-of-plane folding of ph and stretching of NH; 439 cm−1 band isassigned to in-plane wagging of ph; twisting of (C=O–NH
2
and COH); 509 cm−1 band is assigned to rocking of NH2
,rocking of (C=O and OH), in-plane wagging of ph, and soforth. For acrylamide, 114 cm−1 band is assigned to waggingof NH
2
and wagging of CH=CH2
; 190 cm−1 band is assignedto wagging of NH
2
; 277 cm−1 band is assigned to rockingof (CH=CH
2
) and rocking of (C=O–NH2
); 468 cm−1 bandis assigned to rocking of NH
2
and wagging of (CH=CH2
);470 cm−1 band is assigned to twisting of (CH=CH
2
) andtwisting of NH
2
; 613 cm−1 band is assigned to twisting ofNH2
and twisting of CH2
, and so forth. For caprolactam,107 cm−1 band is assigned to wagging of CH
2
, stretching ofC=O, and out-of-plane vibration of the ring; 158 cm−1 bandis assigned to rocking of CH
2
and in-plane vibration of thering; 258 cm−1 band is assigned to rocking of CH
2
, waggingof CH
2
, stretching of NH, stretching of C=O, and so forth;301 cm−1 band is assigned to stretching of NH and in-planevibration of the ring; 323 cm−1 band is assigned to rockingof CH
2
; 402 cm−1 band is assigned to in-plane vibration ofthe ring, and so forth. In most of the cases whole moleculeis involved in the vibration modes. The calculation resultsare similar in some extent to the results in [31–37]. Thecalculations in Table 1 are only preliminary results, becauseonly single molecule and in gas phase have been consideredhere, so it is reasonable that the calculation and experimentalresults have some differences.
6 Journal of Spectroscopy
Table 1: Calculated and experimental vibrational frequencies for salicylamide, benzamide, acrylamide, caprolactam, and sulfanilamide(cm−1)a.
Compounds Experiment Calculation Vibrational assignmentsFIR THz-TDS 6-311++G(3df, 2pd)
Salicylamide
526 538 𝜏ph515 509 𝜌NH2, 𝜌(C=O and OH), in-plane wagging of ph456 439 In-plane wagging of ph, t(C=O-NH2 and COH)
419 Out-of-plane folding of ph, ]NH385 383 𝛽ph, 𝜏(C=O-NH2 and COH)296 275 𝜌NH2, 𝜌(ph)
247 Out-of-plane wagging of whole molecule, especially ph ring161 184 𝜔NH2
146108 141 𝛾(whole molecule)94
8054 (55∗)48 (49∗)
41∗ 30 t(ph-C=O-NH2)
Benzamide
503 In-plane wagging of ph and amide415 Out-of-plane folding of ph ring
412 414 Out-of-plane folding of ph ring, 𝜌NH2
383 375 In-plane rocking of amide group, 𝜔ph, ]CC341 𝜔NH2
251 217 In-plane rocking of ph ring, 𝜌(C=O-NH2)178151 152 𝛾ph; 𝜌NH2
11090
5854 54 57 𝛾(ph-CONH2), 𝜔NH2
38
Acrylamide
508 470 t(CH=CH2), tNH2
468 𝜌NH2, 𝜔(CH=CH2)314 277 𝜌(CH=CH2), 𝜌(C=O-NH2)185 190 𝜔NH2
122 114 𝜔NH2, 𝜔(CH=CH2)67 67
48
Caprolactam
503 508 ]NH; 𝜌CH2
488 437 ]C=O; ]NH; 𝜔CH2;398 402 𝛽ring337 323 𝜌CH2
323 301 ]NH; 𝛽ring258 258 𝜌CH2; 𝜔CH2; ]NH; ]C=O;195 158 𝜌CH2, 𝛽ring129 107 𝜔CH2; ]C=O; 𝛾ring8769 7156 55
41
Journal of Spectroscopy 7
Table 1: Continued.
Compounds Experiment Calculation Vibrational assignmentsFIR THz-TDS 6-311++G(3df, 2pd)
Sulfanilamide
73 85 Out-of-plane wagging of ph, 𝜔NH2675954 15 Out-of-plane wagging of ph, tNH2
a𝛽: in-plane vibration; 𝜏: torsion; 𝛾: out-of-plane vibration; ]: stretching; 𝜔: wagging; 𝜌: rocking; t: twisting, ph: benzene ring.
48
6467
707482
Acrylamide67
20 40 60 80
4828
5557
28
5458
Benzamide
20 40 60
48
54
64
80
40
48
556469
Salicylamide
79
20 40 60 80
4256
70
42
55
Caprolactam
666971
20 40 60
5560
Sulfanilamide
54
6066
7274
20 40 60
73
Wavenumbers (cm−1) Wavenumbers (cm−1
)
Wavenumbers (cm−1)Wavenumbers (cm−1
)
Wavenumbers (cm−1)
Figure 4: The second derivatives results for the THz spectra of the samples using Omnic 5.0 software.
8 Journal of Spectroscopy
(a) 57 cm−1 for benzamide (b) 30 cm−1 for salicylamide
(c) 15 cm−1 for sulfanilamide (d) 85 cm−1 for sulfanilamide
Figure 5: Low-frequency vibrational modes of the molecules below 100 cm−1. (a) 57 cm−1 for benzamide; (b) 30 cm−1 for salicylamide;(c) 15 cm−1 for sulfanilamide; (d) 85 cm−1 for sulfanilamide.
4. Conclusions
The FIR and THz characteristic bands of five moleculeswith amide groups are observed using FIR and terahertztime-domain spectroscopy.The fivemolecules exhibit severalbands in the THz region, which may be related to torsion,rocking, wagging, and other modes of different groups in themolecules according to calculation and the assignments inthe references. THz spectra are effective method to distin-guish different molecules with amide groups. In addition, it isalso the basis for investigation on hydration of amide group,and so forth.
Conflict of Interests
The authors declare that there is no conflict of interestsregarding the publication of this paper.
Acknowledgments
The authors gratefully acknowledge the financial supportby National Natural Science Foundation of China for theGrants (21001009 and 50973003), the State Key Project forFundamental Research of MOST (2011CB808304), NationalHigh-tech R&D Program of China (863 Program) of MOST
(2010AA03A406), and the Scientific Research Project ofBeijing Municipal Commission of Education and BeijingNatural Science Foundation (Grant no. KZ201310028032).Limin Yang is one of the corresponding authors.
References
[1] S. G. Liu, “Recent development of terahertz science and tech-nology,” China Basic Science, vol. 1, pp. 7–12, 2006.
[2] M. C. Beard, G. M. Turner, and C. A. Schmuttenmaer, “Tera-hertz spectroscopy,” Journal of Physical Chemistry B, vol. 106,no. 29, pp. 7146–7159, 2002.
[3] M. C. Kemp, P. F. Taday, B. E. Cole, J. A. Cluff, A. J. Fitzgerald,andW. R. Tribe, “Security applications of terahertz technology,”in Terahertz for Military and Security Applications, Proceedingsof SPIE, pp. 44–52, April 2003.
[4] M. R. Leahy-Hoppa, M. J. Fitch, and R. Osiander, “Terahertzspectroscopy techniques for explosives detection,” Analyticaland Bioanalytical Chemistry, vol. 395, no. 2, pp. 247–257, 2009.
[5] A. G. Davies, A. D. Burnett, W. Fan, E. H. Linfield, and J.E. Cunningham, “Terahertz spectroscopy of explosives anddrugs,”Materials Today, vol. 11, no. 3, pp. 18–26, 2008.
[6] P. M. Hakey, M. R. Hudson, D. G. Allis, W. Ouellette, and T.M. Korter, “Examination of phencyclidine hydrochloride viacryogenic terahertz spectroscopy, solid-state density functional
Journal of Spectroscopy 9
theory, and X-ray diffraction,” Journal of Physical Chemistry A,vol. 113, no. 46, pp. 13013–13022, 2009.
[7] C. J. Strachan, T. Rades, D. A. Newnham, K. C. Gordon, M.Pepper, and P. F. Taday, “Using terahertz pulsed spectroscopyto study crystallinity of pharmaceutical materials,” ChemicalPhysics Letters, vol. 390, no. 1–3, pp. 20–24, 2004.
[8] P. F. Taday, I. V. Bradley, D. D. Arnone, and M. Pepper,“Using Terahertz pulse spectroscopy to study the crystallinestructure of a drug: a case study of the polymorphs of ranitidinehydrochloride,” Journal of Pharmaceutical Sciences, vol. 92, no.4, pp. 831–838, 2003.
[9] L. J. Xie, Y. Yao, and Y. B. Ying, “The application of ter-ahertz spectroscopy to protein detection: a review,” AppliedSpectroscopy Reviews, vol. 49, no. 6, pp. 448–461, 2014.
[10] B. Born, H. Weingartner, E. Brundermann, and M. Havenith,“Solvation dynamics of model peptides probed by terahertzspectroscopy. observation of the onset of collective networkmotions,” Journal of the American Chemical Society, vol. 131, no.10, pp. 3752–3755, 2009.
[11] M. V. Tsurkan, N. S. Balbekin, E. A. Sobakinskaya, A. N. Panin,and V. L. Vaks, “Terahertz spectroscopy of DNA,” Optics andSpectroscopy, vol. 114, pp. 894–898, 2013.
[12] T. M. Korter, R. Balu, M. B. Campbell, M. C. Beard, S. K.Gregurick, and E. J. Heilweil, “Terahertz spectroscopy of solidserine and cysteine,” Chemical Physics Letters, vol. 418, no. 1–3,pp. 65–70, 2006.
[13] L. Yang,G. Zhao,W. Li et al., “Low-frequency vibrationalmodesof dl-homocysteic acid and related compounds,” SpectrochimicaActa Part A, vol. 73, no. 5, pp. 884–891, 2009.
[14] L. Yang, H. Sun, S. Weng et al., “Terahertz absorption spectraof some saccharides and their metal complexes,” SpectrochimicaActa Part A, vol. 69, no. 1, pp. 160–166, 2008.
[15] D. F. Plusquellic, K. Siegrist, E. J. Heilweil, and O. Esen-turk, “Applications of terahertz spectroscopy in biosystems,”ChemPhysChem, vol. 8, no. 17, pp. 2412–2431, 2007.
[16] B. Born, S. J. Kim, S. Ebbinghaus, M. Gruebele, and M.Havenith, “The terahertz dance of water with the proteins: theeffect of protein flexibility on the dynamical hydration shell ofubiquitin,” Faraday Discussions, vol. 141, pp. 161–173, 2008.
[17] B. Born and M. Havenith, “Terahertz dance of proteins andsugars with water,” Journal of Infrared, Millimeter, and TerahertzWaves, vol. 30, no. 12, pp. 1245–1254, 2009.
[18] H. H. Mantsch and D. Naumann, “Terahertz spectroscopy: therenaissance of far infrared spectroscopy,” Journal of MolecularStructure, vol. 964, no. 1–3, pp. 1–4, 2010.
[19] N. C. Comelli, N. E. Massa, E. A. Castro, and A. H. Jubert,“Spectroscopy properties of the amide group in valpromide andsome derivatives with antiepileptic activity,” Journal of RamanSpectroscopy, vol. 40, no. 12, pp. 1797–1809, 2009.
[20] K. M. Gough, L. Tzadu, M. Z. Kastyak, A. C. Kuzyk, and R. L.Julian, “Theoretical and experimental considerations for inter-pretation of amide I bands in tissue,” Vibrational Spectroscopy,vol. 53, no. 1, pp. 71–76, 2010.
[21] H. Maekawa and N.-H. Ge, “Comparative study of electro-static models for the amide-I and -II modes: linear and two-dimensional infrared spectra,” Journal of Physical Chemistry B,vol. 114, no. 3, pp. 1434–1446, 2010.
[22] A. S. Kutsenko, R. A. Motiyenko, L. Margules, and J. C.Guillemin, “The extended spectroscopic database for deuter-ated species of formamide up to 1 THz,” Astronomy andAstrophysics, vol. 549, article A128, 4 pages, 2013.
[23] C.-S. Su and Y.-P. Chen, “Recrystallization of salicylamide usinga batch supercritical antisolvent process,” Chemical Engineeringand Technology, vol. 28, no. 10, pp. 1177–1181, 2005.
[24] V. O. Sheftel, Indirect Food Additives and Polymers: Migrationand Toxicology, Lewis, London, UK, 2000.
[25] A. S. R. Duarte, A. M. Amorim Da Costa, and A. M. Amado,“On the conformation of neat acrylamide dimers—a study byab initio calculations and vibrational spectroscopy,” Journal ofMolecular Structure: THEOCHEM, vol. 723, no. 1–3, pp. 63–68,2005.
[26] R. J. Falconer andA. G.Markelz, “Terahertz spectroscopic anal-ysis of peptides and proteins,” Journal of Infrared, Millimeter,and Terahertz Waves, vol. 33, no. 10, pp. 973–988, 2012.
[27] Y. Hu, X.-H.Wang, L.-T. Guo, C.-L. Zhang, H.-B. Liu, and X.-C.Zhang, “Absorption and dispersion of vegetable oil and animalfat in THz range,” Acta Physica Sinica, vol. 54, no. 9, pp. 4124–4128, 2005.
[28] M. J. Frisch, G. W. Trucks, H. B. Schlegel, C. Gonzalez, and J. A.Pople, Gaussian 03, Revision C.02, Gaussian, Inc., Wallingford,Conn, USA, 2004.
[29] P. J. Stephens, F. J. Devlin, C. F. Chabalowski, and M. J. Frisch,“Ab Initio calculation of vibrational absorption and circulardichroism spectra using density functional force fields,” Journalof Physical Chemistry, vol. 98, no. 45, pp. 11623–11627, 1994.
[30] R. Krishnan, J. S. Binkley, R. Seeger, and J. A. Pople, “Self-consistent molecular orbital methods. XX. A basis set forcorrelated wave functions,”The Journal of Chemical Physics, vol.72, no. 1, pp. 650–654, 1980.
[31] J. Palomar, J. L. G. De Paz, and J. Catalan, “Vibrational studyof intramolecular hydrogen bonding in o-hydroxybenzoyl com-pounds,” Chemical Physics, vol. 246, no. 1–3, pp. 167–208, 1999.
[32] N. Sundaraganesan, N. Puviarasan, and S. Mohan, “Vibrationalspectra, assignments and normal coordinate calculation ofacrylamide,” Talanta, vol. 54, no. 2, pp. 233–241, 2001.
[33] H. T. Varghese, C. Y. Panicker, and D. Philip, “Vibrational spec-troscopic studies and ab initio calculations of sulfanilamide,”Spectrochimica Acta Part A, vol. 65, no. 1, pp. 155–158, 2006.
[34] C. Topacli and A. Topacli, “Semi-empirical infrared spectrasimulations of metal complexes of sulfanilamide,” Journal ofMolecular Structure, vol. 654, no. 1–3, pp. 153–159, 2003.
[35] C. Topacli andA. Topacli, “Ab initio calculations and vibrationalstructure of sulfanilamide,” Journal of Molecular Structure, vol.644, no. 1–3, pp. 145–150, 2003.
[36] G. Ogruc Ildiz and S. Akyuz, “Conformational analysis andvibrational study of sulfanilamide,” Vibrational Spectroscopy,vol. 58, pp. 12–18, 2012.
[37] G. Z. Zhao, B. Yu, and C. L. Zhang, “Terahertz spectroscopicinvestigation of four kinds of vitamins,” Journal of AppliedPhysics, vol. 106, Article ID 104702, 5 pages, 2009.

Submit your manuscripts athttp://www.hindawi.com
Hindawi Publishing Corporationhttp://www.hindawi.com Volume 2014
Inorganic ChemistryInternational Journal of
Hindawi Publishing Corporation http://www.hindawi.com Volume 2014
International Journal ofPhotoenergy
Hindawi Publishing Corporationhttp://www.hindawi.com Volume 2014
Carbohydrate Chemistry
International Journal of
Hindawi Publishing Corporationhttp://www.hindawi.com Volume 2014
Journal of
Chemistry
Hindawi Publishing Corporationhttp://www.hindawi.com Volume 2014
Advances in
Physical Chemistry
Hindawi Publishing Corporationhttp://www.hindawi.com
Analytical Methods in Chemistry
Journal of
Volume 2014
Bioinorganic Chemistry and ApplicationsHindawi Publishing Corporationhttp://www.hindawi.com Volume 2014
SpectroscopyInternational Journal of
Hindawi Publishing Corporationhttp://www.hindawi.com Volume 2014
The Scientific World JournalHindawi Publishing Corporation http://www.hindawi.com Volume 2014
Medicinal ChemistryInternational Journal of
Hindawi Publishing Corporationhttp://www.hindawi.com Volume 2014
Chromatography Research International
Hindawi Publishing Corporationhttp://www.hindawi.com Volume 2014
Applied ChemistryJournal of
Hindawi Publishing Corporationhttp://www.hindawi.com Volume 2014
Hindawi Publishing Corporationhttp://www.hindawi.com Volume 2014
Theoretical ChemistryJournal of
Hindawi Publishing Corporationhttp://www.hindawi.com Volume 2014
Journal of
Spectroscopy
Analytical ChemistryInternational Journal of
Hindawi Publishing Corporationhttp://www.hindawi.com Volume 2014
Journal of
Hindawi Publishing Corporationhttp://www.hindawi.com Volume 2014
Quantum Chemistry
Hindawi Publishing Corporationhttp://www.hindawi.com Volume 2014
Organic Chemistry International
ElectrochemistryInternational Journal of
Hindawi Publishing Corporation http://www.hindawi.com Volume 2014
Hindawi Publishing Corporationhttp://www.hindawi.com Volume 2014
CatalystsJournal of