Embed Size (px)
Citation preview
Research ArticleSynthesis of Iron Oxide Nanoparticles Using Isobutanol
Diana Kostyukova and Yong Hee Chung
Department of Chemistry, Hallym University, 1 Hallymdaehak-gil, 24252 Chuncheon, Republic of Korea
Correspondence should be addressed to Yong Hee Chung; [email protected]
Received 22 July 2016; Accepted 14 August 2016
Academic Editor: Bohayra Mortazavi
Copyright © 2016 D. Kostyukova and Y. H. Chung. This is an open access article distributed under the Creative CommonsAttribution License, which permits unrestricted use, distribution, and reproduction in any medium, provided the original work isproperly cited.
Iron oxide nanoparticles were synthesized by precipitation in isobutanol with sodium hydroxide and ammonium hydroxide. Theisobutanol played a role of a surfactant in the synthesis. The nanoparticles were calcined for 100min to 5 hours in the range of 300to 600∘C. The characterization of the samples by FTIR (Fourier-transform infrared) and XRD (X-ray diffraction) confirmed theformation of 𝛾-Fe
2
O3
(maghemite) from Fe3
O4
(magnetite) at calcination at 300∘C.Themorphology and particle size were studiedby SEM (scanning electron microscope). Nanoparticles in the range of 11–22 nm prepared at 0.09M of ferrous chloride exhibitedsuperparamagnetic properties. Nanoparticles synthesized with ferrous chloride and ammonium hydroxide at 75∘C and calcined at530∘C for 2 h were 𝛼-Fe
2
O3
(hematite).
1. Introduction
The synthesis ofmagnetic iron oxide nanoparticles has drawnmuch interest due to the fact that the characteristics ofnanoparticles vary significantly with its procedure. The twomajor chemical formulas of iron oxide nanoparticles areFe3O4as magnetite and Fe
2O3as 𝛾-Fe
2O3(maghemite) and
𝛼-Fe2O3(hematite).Magnetite andmaghemite exhibit super-
paramagnetic properties and high saturation magnetization,leading to their biomedical applications [1–4] such as tumortargeting [5–12] and magnetic resonance imaging [13, 14].
Magnetite and maghemite have been synthesized bycoprecipitation of ferrous/ferric salts [15–17], thermal decom-position of hydrazinated iron(II) oxalate [18], microemulsion[19], and sol-gel syntheses [20], hydrolysis, and pyrosol [21].In the coprecipitation, the size andmorphology of nanoparti-cles vary with synthesis conditions such as iron salts and theirconcentration, surfactants, pH, and temperature [1, 3, 17, 22].Magnetite is transformed to maghemite by calcination in airas 4Fe
3O4+ O2→ 6𝛾-Fe
2O3. Magnetite has a spinel struc-
ture with Fe3+ in all tetrahedral and Fe3+ and Fe2+ in octahe-dral sites, while maghemite has the same structure with cati-onic vacancies in one-third of octahedral sites [3]. Thecationic vacancies of the transformedmaghemite are affectedby its preparation and consequently its magnetic properties
such as saturation magnetization, remanent magnetization,and coercivity can be varied [16, 17, 21, 23]. Superparamag-netic properties have been shown in magnetite, maghemite,and hematite [24], wherewell-defined hematite nanoparticlesof 41 nm showed superparamagnetic properties. Superpara-magnetic nanoparticles with high saturation magnetizationcan be synthesized in air [25, 26].
In the present work magnetic iron nanoparticles wereprepared by precipitation using one iron salt and isobutanol,which was expected to play a role of a surfactant. Ferrouschloride and ferric nitrate were individually used in the syn-thesis process where NaOH andNH
4OHwere used as a base.
The resulting nanoparticles were calcined for 100min to 5 h atvarious temperatures.Their size and phase composition wereexamined byX-ray powder diffraction (XRD),while their sizeand morphology were studied by scanning electron micro-scope (SEM). Their absorption infrared spectra were mea-sured by Fourier-transform infrared spectroscopy (FTIR)andmagnetic propertieswere examined by a vibrating samplemagnetometer (VSM).
2. Experimental
Iron(II) chloride tetrahydrate (≥99.0%, Sigma-Aldrich) pow-der was dissolved in 5mL of distilled water and added with
Hindawi Publishing CorporationJournal of NanomaterialsVolume 2016, Article ID 4982675, 9 pageshttp://dx.doi.org/10.1155/2016/4982675

2 Journal of Nanomaterials
Table 1: Synthesis conditions of the iron oxide samples at 75∘C.
Sample Fe2+ (M) Fe3+ (M) NaOH (M) NH3
in NH4
OH (%) Volume ratio (𝑉iso/𝑉water)Calcination conditions
Temperature (∘C) Time (h)S1 0.09 0.8 10S2 0.09 0.8 10 300 2S3 0.09 0.8 10 500 2S4 0.4 0.8 10S5 0.4 0.8 10 300 2S6∗ 0.09 0.8 10S7∗ 0.09 0.8 10 300 2S8 0.09 0.8 0S9 0.09 ≥28.0 10S10 0.09 ≥28.0 10 530 2S11 0.09 ≥28.0 10 600 5S12 0.1 ≥28.0 4S13 0.1 ≥28.0 4 400 1.7S14 0.1 ≥28.0 4 600 1.7∗The sample was synthesized at 90∘C.
50mL of isobutanol (≥99.0%, Alfa Aesar), leading to twoconcentrations of Fe2+ ions (0.09 and 0.4M). The aqueous-organic mixture was heated to 75∘C, added dropwise for 2 hwith 0.8M NaOH (≥96.0%, Junsei Chemical) or NH
4OH
(≥28.0% NH3, Junsei Chemical) under constant stirring
at 500 rpm to pH = 11-12, and further stirred for 30min.Similarly, iron(III) nitrate enneahydrate (≥98.0%, JunseiChemical) was dissolved in 5mL of distilled water and addedwith 20mL of isobutanol, resulting in 0.1M Fe3+ solution.The resulting solution was heated to 75∘C, added dropwisefor 2 h with NH
4OH (≥28.0% NH
3, Junsei Chemical) under
constant stirring at 500 rpm to pH = 11-12, and further stirredfor 30min. All synthesized iron oxide nanoparticles werewashed thrice with distilled water at 75∘C and dried in anoven at 50∘C.Thedried precursors of iron oxide nanoparticleswere calcined for 2 h at 300, 500, and 530∘C, 100min at 400and 600∘C, and 5 h at 600∘C. Their synthesis and calcinationconditions are given in Table 1.
The phase composition and size of iron oxide nanoparti-cles were deduced from measurements by X-ray diffraction(XRD, PANalytical X’pert PROMPD) with wavelength of CuK𝛼, 1.5405 A at room temperature. The size and morphology
were measured by an ultrahigh resolution scanning electronmicroscope (UHR-SEM, Hitachi S-4800). The absorptionspectra were obtained by Fourier-transform infrared spec-troscopy (FTIR, PerkinElmer Frontier) with a MIR sourceand an optical KBR beam splitter covering the wavelengthrange from 2.5 to 25 𝜇m (wavenumber range from 4000 to400 cm−1).
The magnetic properties of the iron oxide nanoparti-cles were examined by a vibrating sample magnetometer(VSM, LakeShore). The magnetization of the nanoparticleswas measured as a function of magnetic field strength atroom temperature to yield their saturation and remanentmagnetization and coercivity.
3. Results and Discussion
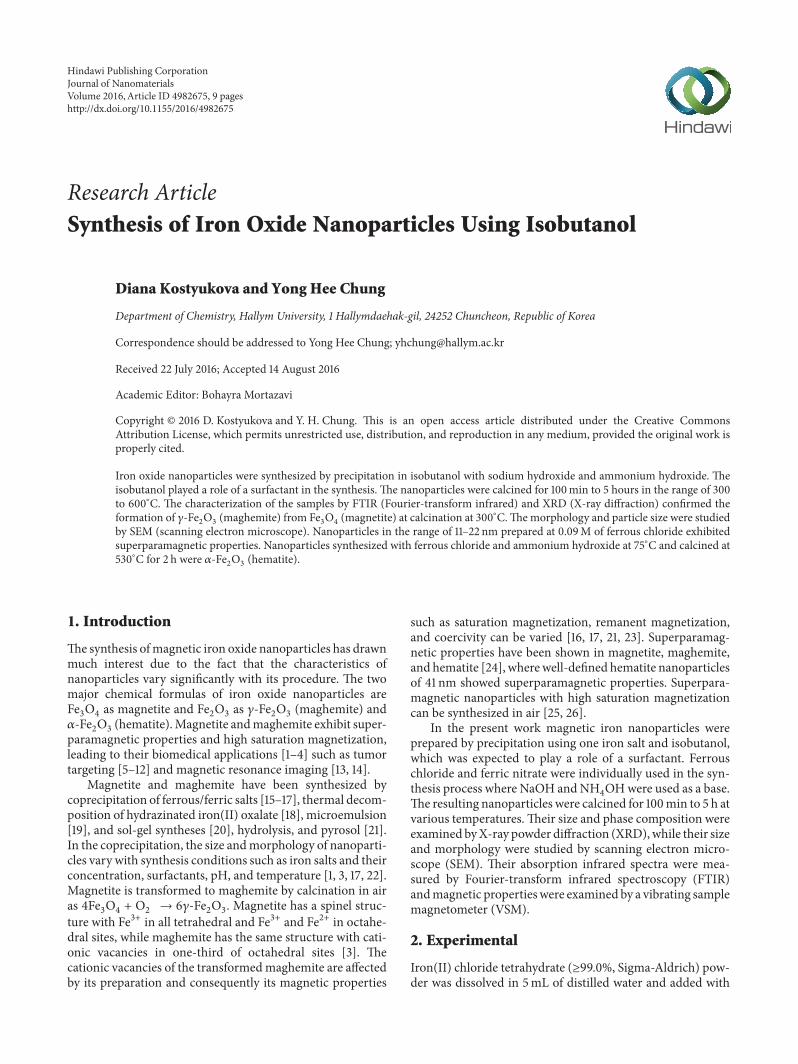
Figure 1 shows the wide-angle X-ray diffraction (XRD)patterns of samples S1, S6, and S5. Three samples weresynthesized with ferrous chloride and NaOH in isobutanol.Samples S1 and S5 were synthesized at 75∘C and S6 at 90∘C.Sample S5 was calcined at 300∘C for 2 h. All the samplesshow salient diffraction peaks at 2𝜃 = 30.2∘, 35.5∘, 43.2∘,53.6∘, 57.1∘, and 62.7∘ which can be indexed to the cubicstructure of magnetite (Fe
3O4) with lattice constants 𝑎 =
8.3750 A, 𝑏 = 8.3750 A, and 𝑐 = 8.3750 A (reference code 01-088-0315). Figure 1(c) suggests that there is no significantphase transformation in the calcination process.
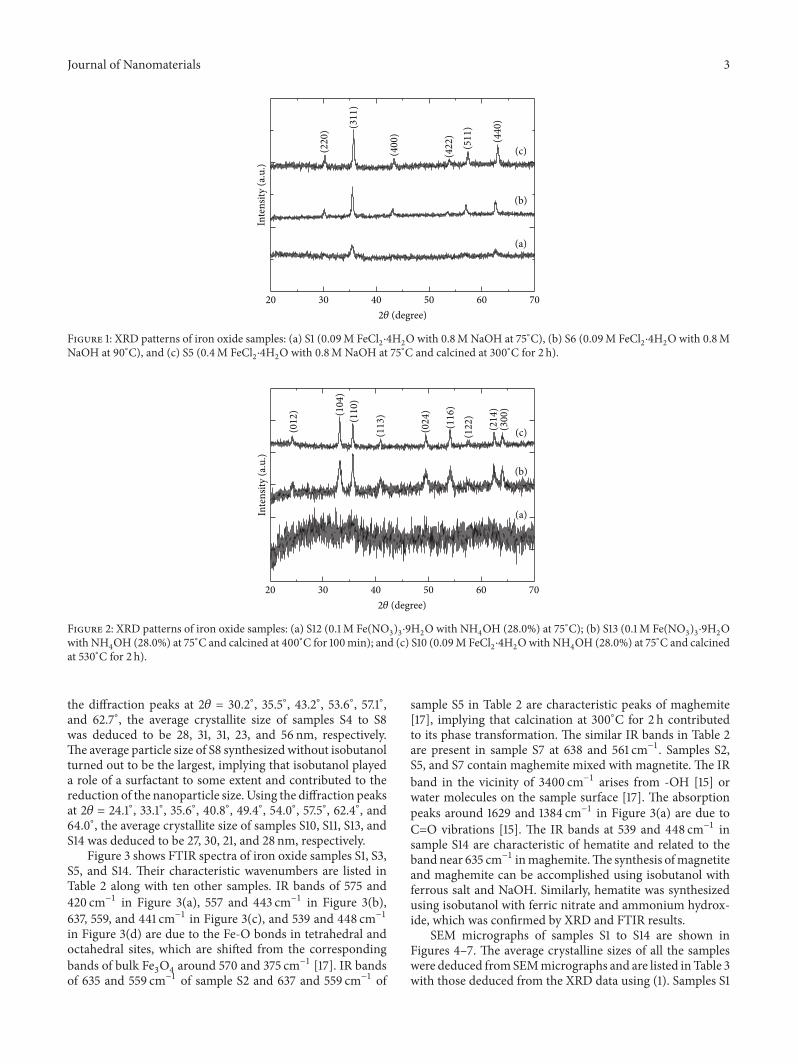
Figure 2 shows the X-ray diffraction (XRD) patternsof samples S12, S13, and S10. The first two samples weresynthesized with ferric nitrate andNH
4OH in isobutanol and
sample S10 with ferrous chloride and NH4OH in isobutanol.
Sample S13 was calcined at 400∘C for 100min and sample S10at 530∘C for 2 h. Figures 2(a) and 2(b) show diffraction peaksat 2𝜃 = 24.1∘, 33.1∘, 35.6∘, 40.8∘, 49.4∘, 54.0∘, 57.5∘, 62.4∘, and64.0∘ which can be indexed to the rhombohedral structureof hematite (𝛼-Fe
2O3) with lattice constants 𝑎 = 5.0370 A,
𝑏 = 5.0370 A, and 𝑐 = 13.7710 A (reference code 01-089-0596).The phase transformation occurred in sample S10 calcined at530∘C for 2 h.
The average particle size was estimated from XRD datausing Scherrer equation [15, 17]:
𝐷 =𝐾𝜆
𝛽 cos 𝜃, (1)
where 𝐷 is the average particle size, 𝐾 the dimensionlessshape factor whose typical value is about 0.9, 𝜆 the X-ray wavelength used in XRD (Cu K
𝛼= 1.5405 A), 𝛽 the
broadening of the observed diffraction line at half themaximum intensity in radians, and 𝜃 the Bragg angle. Using
Journal of Nanomaterials 3
(c)
(b)
(a)
(220
) (311
)
(400
)
(422
)
(511
)
(440
)
Inte
nsity
(a.u
.)
30 40 50 60 7020
2𝜃 (degree)
Figure 1: XRD patterns of iron oxide samples: (a) S1 (0.09M FeCl2
⋅4H2
Owith 0.8M NaOH at 75∘C), (b) S6 (0.09M FeCl2
⋅4H2
Owith 0.8MNaOH at 90∘C), and (c) S5 (0.4M FeCl
2
⋅4H2
O with 0.8M NaOH at 75∘C and calcined at 300∘C for 2 h).
Inte
nsity
(a.u
.)
30 40 50 60 7020
2𝜃 (degree)
(012
) (104
)
(113
)(110
)
(122
)
(214
)
(024
)
(116
)
(300
)
(c)
(b)
(a)
Figure 2: XRD patterns of iron oxide samples: (a) S12 (0.1M Fe(NO3
)3
⋅9H2
O with NH4
OH (28.0%) at 75∘C); (b) S13 (0.1M Fe(NO3
)3
⋅9H2
Owith NH
4
OH (28.0%) at 75∘C and calcined at 400∘C for 100min); and (c) S10 (0.09M FeCl2
⋅4H2
Owith NH4
OH (28.0%) at 75∘C and calcinedat 530∘C for 2 h).
the diffraction peaks at 2𝜃 = 30.2∘, 35.5∘, 43.2∘, 53.6∘, 57.1∘,and 62.7∘, the average crystallite size of samples S4 to S8was deduced to be 28, 31, 31, 23, and 56 nm, respectively.The average particle size of S8 synthesized without isobutanolturned out to be the largest, implying that isobutanol playeda role of a surfactant to some extent and contributed to thereduction of the nanoparticle size. Using the diffraction peaksat 2𝜃 = 24.1∘, 33.1∘, 35.6∘, 40.8∘, 49.4∘, 54.0∘, 57.5∘, 62.4∘, and64.0∘, the average crystallite size of samples S10, S11, S13, andS14 was deduced to be 27, 30, 21, and 28 nm, respectively.
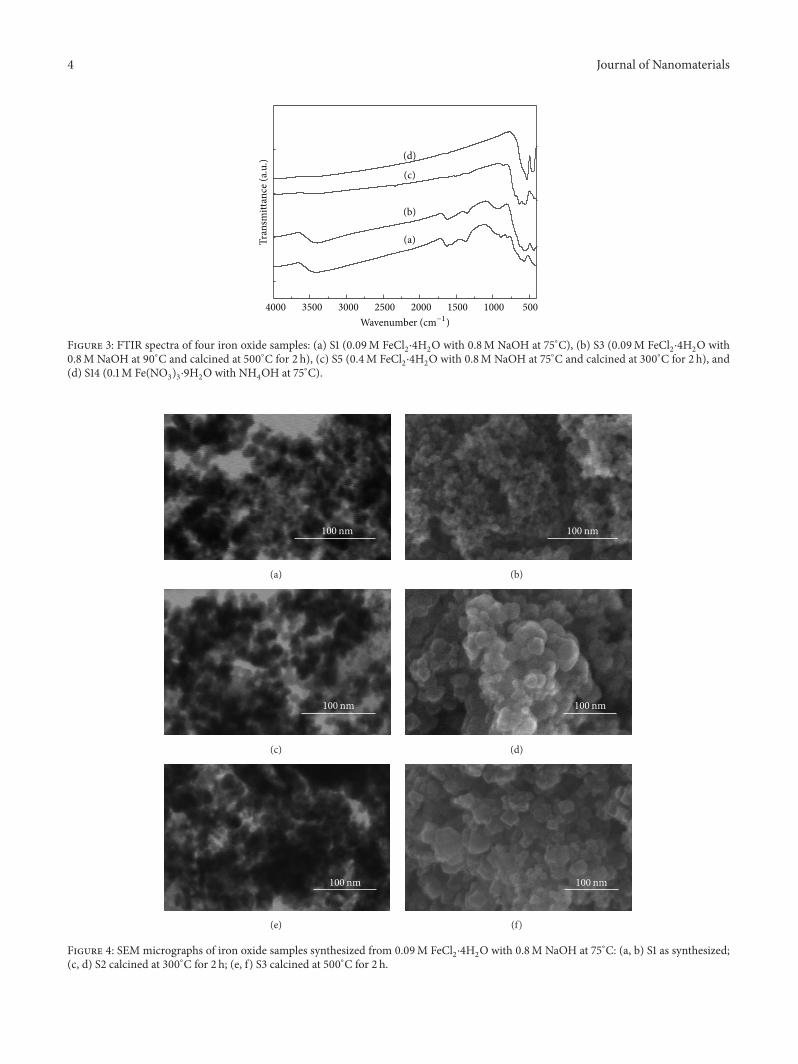
Figure 3 shows FTIR spectra of iron oxide samples S1, S3,S5, and S14. Their characteristic wavenumbers are listed inTable 2 along with ten other samples. IR bands of 575 and420 cm−1 in Figure 3(a), 557 and 443 cm−1 in Figure 3(b),637, 559, and 441 cm−1 in Figure 3(c), and 539 and 448 cm−1in Figure 3(d) are due to the Fe-O bonds in tetrahedral andoctahedral sites, which are shifted from the correspondingbands of bulk Fe
3O4around 570 and 375 cm−1 [17]. IR bands
of 635 and 559 cm−1 of sample S2 and 637 and 559 cm−1 of
sample S5 in Table 2 are characteristic peaks of maghemite[17], implying that calcination at 300∘C for 2 h contributedto its phase transformation. The similar IR bands in Table 2are present in sample S7 at 638 and 561 cm−1. Samples S2,S5, and S7 contain maghemite mixed with magnetite. The IRband in the vicinity of 3400 cm−1 arises from -OH [15] orwater molecules on the sample surface [17]. The absorptionpeaks around 1629 and 1384 cm−1 in Figure 3(a) are due toC=O vibrations [15]. The IR bands at 539 and 448 cm−1 insample S14 are characteristic of hematite and related to theband near 635 cm−1 inmaghemite.The synthesis ofmagnetiteand maghemite can be accomplished using isobutanol withferrous salt and NaOH. Similarly, hematite was synthesizedusing isobutanol with ferric nitrate and ammonium hydrox-ide, which was confirmed by XRD and FTIR results.
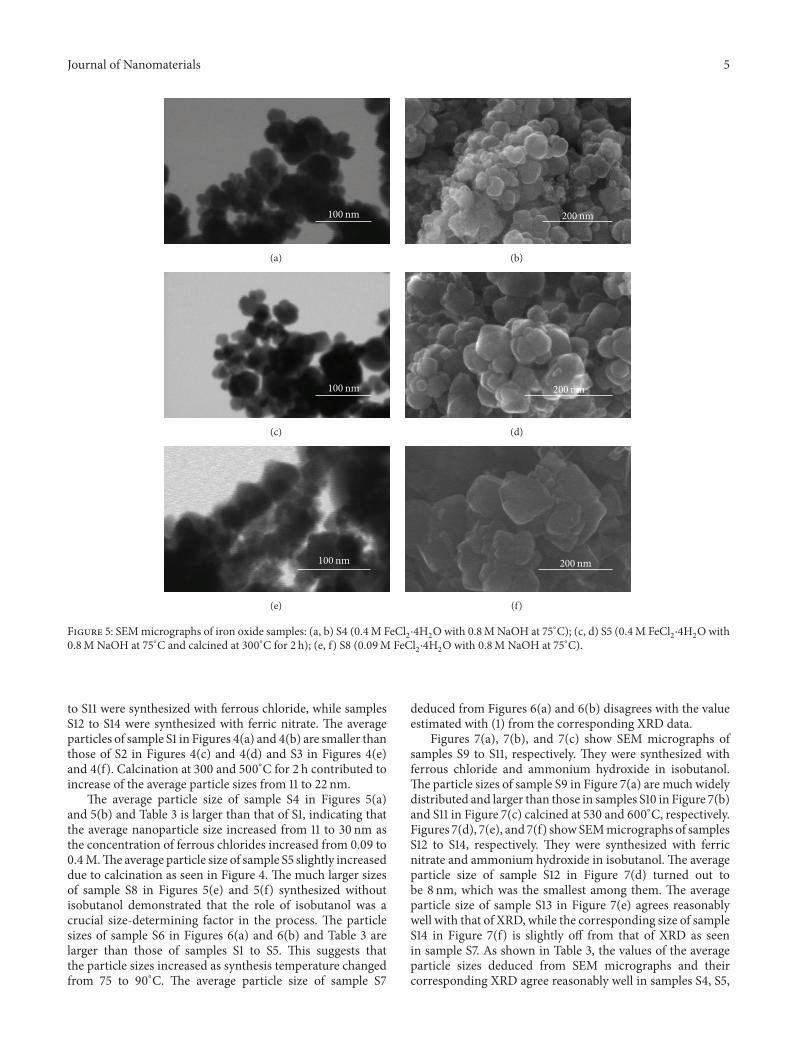
SEM micrographs of samples S1 to S14 are shown inFigures 4–7. The average crystalline sizes of all the sampleswere deduced fromSEMmicrographs and are listed in Table 3with those deduced from the XRD data using (1). Samples S1
4 Journal of Nanomaterials
Tran
smitt
ance
(a.u
.)
Wavenumber (cm−1)5004000 3500 3000 2500 2000 1500 1000
(d)
(b)
(c)
(a)
Figure 3: FTIR spectra of four iron oxide samples: (a) S1 (0.09M FeCl2
⋅4H2
O with 0.8M NaOH at 75∘C), (b) S3 (0.09M FeCl2
⋅4H2
O with0.8M NaOH at 90∘C and calcined at 500∘C for 2 h), (c) S5 (0.4M FeCl
2
⋅4H2
O with 0.8M NaOH at 75∘C and calcined at 300∘C for 2 h), and(d) S14 (0.1M Fe(NO
3
)3
⋅9H2
O with NH4
OH at 75∘C).
100 nm
(a)
100 nm
(b)
100 nm
(c)
100 nm
(d)
100 nm
(e)
100 nm
(f)
Figure 4: SEM micrographs of iron oxide samples synthesized from 0.09M FeCl2
⋅4H2
O with 0.8M NaOH at 75∘C: (a, b) S1 as synthesized;(c, d) S2 calcined at 300∘C for 2 h; (e, f) S3 calcined at 500∘C for 2 h.
Journal of Nanomaterials 5
100 nm
(a)
200 nm
(b)
100 nm
(c)
200 nm
(d)
100 nm
(e)
200 nm
(f)
Figure 5: SEMmicrographs of iron oxide samples: (a, b) S4 (0.4M FeCl2
⋅4H2
Owith 0.8MNaOH at 75∘C); (c, d) S5 (0.4M FeCl2
⋅4H2
Owith0.8M NaOH at 75∘C and calcined at 300∘C for 2 h); (e, f) S8 (0.09M FeCl
2
⋅4H2
O with 0.8M NaOH at 75∘C).
to S11 were synthesized with ferrous chloride, while samplesS12 to S14 were synthesized with ferric nitrate. The averageparticles of sample S1 in Figures 4(a) and 4(b) are smaller thanthose of S2 in Figures 4(c) and 4(d) and S3 in Figures 4(e)and 4(f). Calcination at 300 and 500∘C for 2 h contributed toincrease of the average particle sizes from 11 to 22 nm.
The average particle size of sample S4 in Figures 5(a)and 5(b) and Table 3 is larger than that of S1, indicating thatthe average nanoparticle size increased from 11 to 30 nm asthe concentration of ferrous chlorides increased from 0.09 to0.4M.The average particle size of sample S5 slightly increaseddue to calcination as seen in Figure 4. The much larger sizesof sample S8 in Figures 5(e) and 5(f) synthesized withoutisobutanol demonstrated that the role of isobutanol was acrucial size-determining factor in the process. The particlesizes of sample S6 in Figures 6(a) and 6(b) and Table 3 arelarger than those of samples S1 to S5. This suggests thatthe particle sizes increased as synthesis temperature changedfrom 75 to 90∘C. The average particle size of sample S7
deduced from Figures 6(a) and 6(b) disagrees with the valueestimated with (1) from the corresponding XRD data.
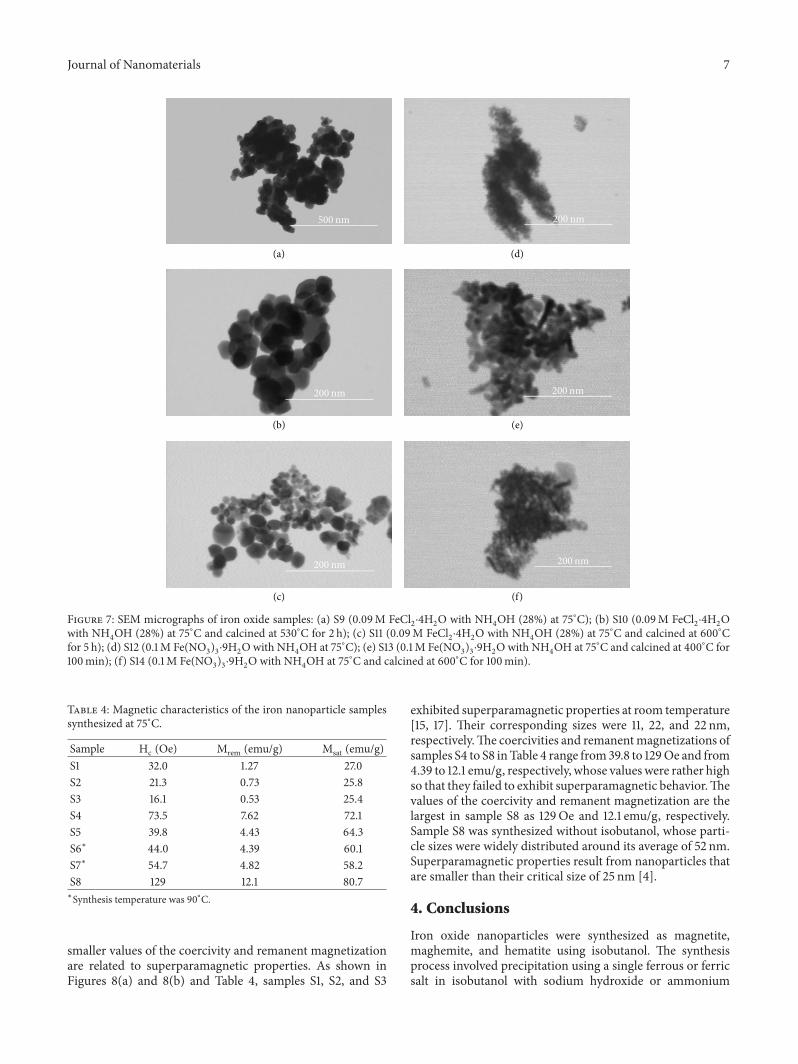
Figures 7(a), 7(b), and 7(c) show SEM micrographs ofsamples S9 to S11, respectively. They were synthesized withferrous chloride and ammonium hydroxide in isobutanol.The particle sizes of sample S9 in Figure 7(a) are much widelydistributed and larger than those in samples S10 in Figure 7(b)and S11 in Figure 7(c) calcined at 530 and 600∘C, respectively.Figures 7(d), 7(e), and 7(f) showSEMmicrographs of samplesS12 to S14, respectively. They were synthesized with ferricnitrate and ammonium hydroxide in isobutanol. The averageparticle size of sample S12 in Figure 7(d) turned out tobe 8 nm, which was the smallest among them. The averageparticle size of sample S13 in Figure 7(e) agrees reasonablywell with that of XRD, while the corresponding size of sampleS14 in Figure 7(f) is slightly off from that of XRD as seenin sample S7. As shown in Table 3, the values of the averageparticle sizes deduced from SEM micrographs and theircorresponding XRD agree reasonably well in samples S4, S5,

6 Journal of Nanomaterials
100 nm
(a)
100 nm
(b)
100 nm
(c)
100 nm
(d)
Figure 6: SEM micrographs of iron oxide samples synthesized with 0.09M FeCl2
⋅4H2
O with 0.8M NaOH at 90∘C: (a, b) S6 as synthesized;(c, d) S7 calcined at 300∘C for 2 h.
Table 2: Major wavenumbers of FTIR spectra for the iron oxidesamples in Table 1.
Sample Wavenumbers (cm−1)S1 419.59, 575.25, 796.76, 888.22, 1383.92, 1629.02, 3401.07S2 443.08, 558.99, 634.88, 933.03, 1357.53, 1626.29, 3401.3S3 443.01, 557.13, 939.86, 1359.04, 1628.4, 3400.44S4 573.97, 1633.71, 3436.08S5 441.05, 559.03, 637.29, 692.38, 3437.23S6∗ 576.89, 892.32, 3463.38S7∗ 441.14, 560.87, 637.5, 870.69, 1384.04, 1631.02, 3433.61S8 575.69, 1384.46, 3465.38S9 416.14, 635.59, 1401.56, 1633.84, 1748.14, 2807.79, 3151.05S10 470.77, 542.93S11 442.4, 540.19S12 447.48, 1384.16, 1489.03, 1630.34, 3392.24 (DI39-1)S13 459.13, 535.07, 1629.59, 3393.51S14 447.58, 538.95∗Synthesis temperature was 90∘C.
S6, S8, S10, S11, and S13, while those in samples S7 and S14disagree to some extent.
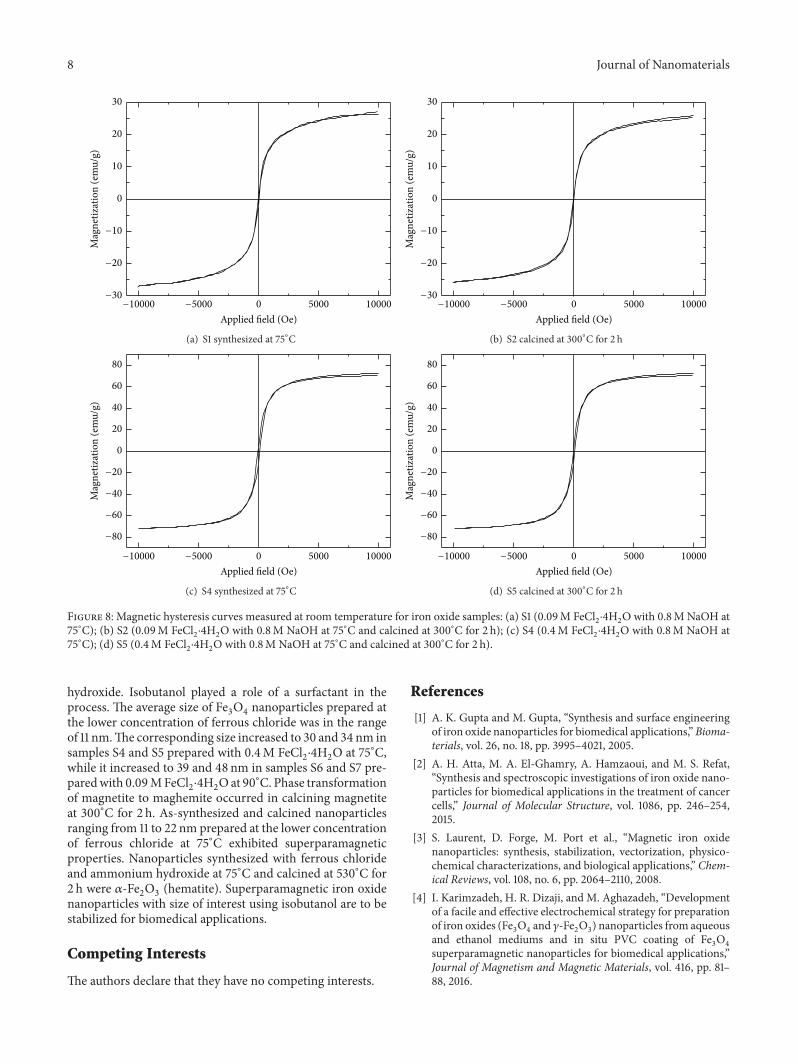
The magnetic hysteresis curves were measured at roomtemperature for samples S1 to S8 and their coercivity, theremanent magnetization and the saturation magnetizationare listed in Table 4, and the magnetic hystereses of samplesS1, S2, S4, and S5 are shown in Figures 8(a), 8(b), 8(c), and8(d), respectively. Samples S1 and S2 were synthesized with
Table 3: Average nanoparticle size for the iron oxide samples fromSEM and XRD.
Sample Average particle size (nm)SEM XRD+
S1 11 ± 4S2 22 ± 5S3 22 ± 9S4 30 ± 13 28.2 ± 4.5S5 34 ± 13 31.2 ± 12.5S6∗ 39 ± 13 31.1 ± 7.5S7∗ 48 ± 12 23.2 ± 7.9S8 52 ± 30 55.8 ± 29.8S9 42 ± 22S10 35 ± 7 27.2 ± 6.5S11 32 ± 14 29.6 ± 4.7S12 8 ± 1S13 16 ± 4 20.7 ± 6.9S14 13 ± 3 28.3 ± 9.8∗Synthesis temperature was 90∘C.+The size was deduced by the Scherrer equation (1).
0.09M FeCl2⋅4H2O, while S4 and S5 were prepared with
0.4M FeCl2⋅4H2O. Samples S2 and S5 were calcined at 300∘C
for 2 h. The saturation magnetization of sample S4 is nearly3 times higher than the corresponding value of sample S1.The coercivity value tends to decrease from 32.0 to 16.1 Oe ascalcination temperature increases to 500∘C, while the rema-nent magnetization decreases from 1.27 to 0.32 emu/g. The
Journal of Nanomaterials 7
500 nm 200 nm
200 nm 200 nm
200 nm
(a) (d)
(b) (e)
(c) (f)
200 nm
Figure 7: SEM micrographs of iron oxide samples: (a) S9 (0.09M FeCl2
⋅4H2
O with NH4
OH (28%) at 75∘C); (b) S10 (0.09M FeCl2
⋅4H2
Owith NH
4
OH (28%) at 75∘C and calcined at 530∘C for 2 h); (c) S11 (0.09M FeCl2
⋅4H2
O with NH4
OH (28%) at 75∘C and calcined at 600∘Cfor 5 h); (d) S12 (0.1M Fe(NO
3
)3
⋅9H2
Owith NH4
OH at 75∘C); (e) S13 (0.1M Fe(NO3
)3
⋅9H2
Owith NH4
OH at 75∘C and calcined at 400∘C for100min); (f) S14 (0.1M Fe(NO
3
)3
⋅9H2
O with NH4
OH at 75∘C and calcined at 600∘C for 100min).
Table 4: Magnetic characteristics of the iron nanoparticle samplessynthesized at 75∘C.
Sample Hc (Oe) Mrem (emu/g) Msat (emu/g)S1 32.0 1.27 27.0S2 21.3 0.73 25.8S3 16.1 0.53 25.4S4 73.5 7.62 72.1S5 39.8 4.43 64.3S6∗ 44.0 4.39 60.1S7∗ 54.7 4.82 58.2S8 129 12.1 80.7∗Synthesis temperature was 90∘C.
smaller values of the coercivity and remanent magnetizationare related to superparamagnetic properties. As shown inFigures 8(a) and 8(b) and Table 4, samples S1, S2, and S3
exhibited superparamagnetic properties at room temperature[15, 17]. Their corresponding sizes were 11, 22, and 22 nm,respectively.The coercivities and remanentmagnetizations ofsamples S4 to S8 inTable 4 range from39.8 to 129Oe and from4.39 to 12.1 emu/g, respectively, whose values were rather highso that they failed to exhibit superparamagnetic behavior.Thevalues of the coercivity and remanent magnetization are thelargest in sample S8 as 129Oe and 12.1 emu/g, respectively.Sample S8 was synthesized without isobutanol, whose parti-cle sizes were widely distributed around its average of 52 nm.Superparamagnetic properties result from nanoparticles thatare smaller than their critical size of 25 nm [4].
4. Conclusions
Iron oxide nanoparticles were synthesized as magnetite,maghemite, and hematite using isobutanol. The synthesisprocess involved precipitation using a single ferrous or ferricsalt in isobutanol with sodium hydroxide or ammonium
8 Journal of Nanomaterials
5000 10000−5000 0−10000
Applied field (Oe)
−30
−20
−10
0
10
20
30M
agne
tizat
ion
(em
u/g)
(a) S1 synthesized at 75∘C
−5000 0 5000 10000−10000
Applied field (Oe)
−30
−20
−10
0
10
20
30
Mag
netiz
atio
n (e
mu/
g)
(b) S2 calcined at 300∘C for 2 h
−80
−60
−40
−20
0
20
40
60
80
Mag
netiz
atio
n (e
mu/
g)
−5000 0 5000 10000−10000
Applied field (Oe)
(c) S4 synthesized at 75∘C
−80
−60
−40
−20
0
20
40
60
80
Mag
netiz
atio
n (e
mu/
g)
−5000 0 5000 10000−10000
Applied field (Oe)
(d) S5 calcined at 300∘C for 2 h
Figure 8: Magnetic hysteresis curves measured at room temperature for iron oxide samples: (a) S1 (0.09M FeCl2
⋅4H2
Owith 0.8M NaOH at75∘C); (b) S2 (0.09M FeCl
2
⋅4H2
O with 0.8M NaOH at 75∘C and calcined at 300∘C for 2 h); (c) S4 (0.4M FeCl2
⋅4H2
O with 0.8M NaOH at75∘C); (d) S5 (0.4M FeCl
2
⋅4H2
O with 0.8M NaOH at 75∘C and calcined at 300∘C for 2 h).
hydroxide. Isobutanol played a role of a surfactant in theprocess. The average size of Fe
3O4nanoparticles prepared at
the lower concentration of ferrous chloride was in the rangeof 11 nm.The corresponding size increased to 30 and 34 nm insamples S4 and S5 prepared with 0.4M FeCl
2⋅4H2O at 75∘C,
while it increased to 39 and 48 nm in samples S6 and S7 pre-paredwith 0.09MFeCl
2⋅4H2Oat 90∘C. Phase transformation
of magnetite to maghemite occurred in calcining magnetiteat 300∘C for 2 h. As-synthesized and calcined nanoparticlesranging from 11 to 22 nm prepared at the lower concentrationof ferrous chloride at 75∘C exhibited superparamagneticproperties. Nanoparticles synthesized with ferrous chlorideand ammonium hydroxide at 75∘C and calcined at 530∘C for2 h were 𝛼-Fe
2O3(hematite). Superparamagnetic iron oxide
nanoparticles with size of interest using isobutanol are to bestabilized for biomedical applications.
Competing Interests
The authors declare that they have no competing interests.
References
[1] A. K. Gupta and M. Gupta, “Synthesis and surface engineeringof iron oxide nanoparticles for biomedical applications,”Bioma-terials, vol. 26, no. 18, pp. 3995–4021, 2005.
[2] A. H. Atta, M. A. El-Ghamry, A. Hamzaoui, and M. S. Refat,“Synthesis and spectroscopic investigations of iron oxide nano-particles for biomedical applications in the treatment of cancercells,” Journal of Molecular Structure, vol. 1086, pp. 246–254,2015.
[3] S. Laurent, D. Forge, M. Port et al., “Magnetic iron oxidenanoparticles: synthesis, stabilization, vectorization, physico-chemical characterizations, and biological applications,” Chem-ical Reviews, vol. 108, no. 6, pp. 2064–2110, 2008.
[4] I. Karimzadeh, H. R. Dizaji, and M. Aghazadeh, “Developmentof a facile and effective electrochemical strategy for preparationof iron oxides (Fe
3
O4
and 𝛾-Fe2
O3
) nanoparticles from aqueousand ethanol mediums and in situ PVC coating of Fe
3
O4
superparamagnetic nanoparticles for biomedical applications,”Journal of Magnetism and Magnetic Materials, vol. 416, pp. 81–88, 2016.

Journal of Nanomaterials 9
[5] E. Augustin, B. Czubek, A. M. Nowicka, A. Kowalczyk, Z.Stojek, and Z. Mazerska, “Improved cytotoxicity and preservedlevel of cell death induced in colon cancer cells by doxorubicinafter its conjugation with iron-oxide magnetic nanoparticles,”Toxicology in Vitro, vol. 33, pp. 45–53, 2016.
[6] P. T. Yin, S. Shah, N. J. Pasquale, O. B. Garbuzenko, T. Minko,and K.-B. Lee, “Stem cell-based gene therapy activated usingmagnetic hyperthermia to enhance the treatment of cancer,”Biomaterials, vol. 81, pp. 46–57, 2016.
[7] Y. Jia, M. Yuan, H. Yuan et al., “Co-encapsulation of magneticFe3
O4
nanoparticles and doxorubicin into biodegradable PLGAnanocarriers for intratumoral drug delivery,” International Jour-nal of Nanomedicine, vol. 7, pp. 1697–1708, 2012.
[8] J. Park, N. R. Kadasala, S. A. Abouelmagd et al., “Polymer-iron oxide composite nanoparticles for EPR-independent drugdelivery,” Biomaterials, vol. 101, pp. 285–295, 2016.
[9] Z. Sun, M. Worden, J. A. Thliveris et al., “Biodistributionof negatively charged iron oxide nanoparticles (IONPs) inmice and enhanced brain delivery using lysophosphatidic acid(LPA),” Nanomedicine: Nanotechnology, Biology and Medicine,vol. 12, no. 7, pp. 1775–1784, 2016.
[10] N. Mallick, M. Anwar, M. Asfer et al., “Chondroitin sulfate-capped super-paramagnetic iron oxide nanoparticles as poten-tial carriers of doxorubicin hydrochloride,” Carbohydrate Poly-mers, vol. 151, pp. 546–556, 2016.
[11] H. Li, K. Yan, Y. Shang et al., “Folate-bovine serum albuminfunctionalized polymeric micelles loaded with superparamag-netic iron oxide nanoparticles for tumor targeting andmagneticresonance imaging,” Acta Biomaterialia, vol. 15, pp. 117–126,2015.
[12] H.Vu-Quang,M.-K. Yoo,H.-J. Jeong et al., “Targeted delivery ofmannan-coated superparamagnetic iron oxide nanoparticles toantigen-presenting cells for magnetic resonance-based diagno-sis of metastatic lymph nodes in vivo,” Acta Biomaterialia, vol.7, no. 11, pp. 3935–3945, 2011.
[13] P. I. P. Soares, C. A. T. Laia, A. Carvalho et al., “Iron oxidenanoparticles stabilized with a bilayer of oleic acid for magnetichyperthermia and MRI applications,” Applied Surface Science,vol. 383, pp. 240–247, 2016.
[14] T. K. Jain, S. P. Foy, B. Erokwu, S.Dimitrijevic, C. A. Flask, andV.Labhasetwar, “Magnetic resonance imaging of multifunctionalpluronic stabilized iron-oxide nanoparticles in tumor-bearingmice,” Biomaterials, vol. 30, no. 35, pp. 6748–6756, 2009.
[15] S. Alibeigi andM. R. Vaezi, “Phase transformation of iron oxidenanoparticles by varying themolar ratio of Fe2+:Fe3+,”ChemicalEngineering and Technology, vol. 31, no. 11, pp. 1591–1596, 2008.
[16] S. Babay, T. Mhiri, and M. Toumi, “Synthesis, structural andspectroscopic characterizations of maghemite 𝛾-Fe
2
O3
pre-pared by one-step coprecipitation route,” Journal of MolecularStructure, vol. 1085, pp. 286–293, 2015.
[17] A. Jafari, S. F. Shayesteh, M. Salouti, and K. Boustani, “Effect ofannealing temperature on magnetic phase transition in Fe
3
O4
nanoparticles,” Journal of Magnetism and Magnetic Materials,vol. 379, pp. 305–312, 2015.
[18] K. S. Rane and V. M. S. Verenkar, “Synthesis of ferrite grade 𝛾-Fe2
O3
,” Bulletin of Materials Science, vol. 24, no. 1, pp. 39–45,2001.
[19] A. B. Chin and I. I. Yaacob, “Synthesis and characterization ofmagnetic iron oxide nanoparticles via w/o microemulsion andMassart’s procedure,” Journal of Materials Processing Technol-ogy, vol. 191, no. 1–3, pp. 235–237, 2007.
[20] K. Woo, H. J. Lee, J.-P. Ahn, and Y. S. Park, “Sol-gel mediatedsynthesis of Fe
2
O3
nanorods,” Advanced Materials, vol. 15, no.20, pp. 1761–1764, 2003.
[21] E. Herrero, M. V. Cabanas, M. Vallet-Regı, J. L. Martınez, and J.M. Gonzalez-Calbet, “Influence of synthesis conditions on the𝛾-Fe2
O3
properties,” Solid State Ionics, vol. 101–103, no. 1, pp.213–219, 1997.
[22] S. K. Sahoo,K.Agarwal, A.K. Singh, B.G. Polke, andK.C. Raha,“Characterization of 𝛾- and 𝛼-Fe
2
O3
nano powders synthesizedby emulsion precipitation-calcination route and rheologicalbehaviour of 𝛼-Fe
2
O3
,” International Journal of Engineering,Science and Technology, vol. 2, no. 8, pp. 118–126, 2010.
[23] K. Woo, J. Hong, S. Choi et al., “Easy synthesis and magneticproperties of iron oxide nanoparticles,” Chemistry of Materials,vol. 16, no. 14, pp. 2814–2818, 2004.
[24] T. P. Raming, A. J. A. Winnubst, C. M. van Kats, and A. P.Philipse, “The synthesis and magnetic properties of nanosizedhematite (𝛼-Fe
2
O3
) particles,” Journal of Colloid and InterfaceScience, vol. 249, no. 2, pp. 346–350, 2002.
[25] O. Karaagac and H. Kockar, “A simple way to obtain highsaturation magnetization for superparamagnetic iron oxidenanoparticles synthesized in air atmosphere: optimization byexperimental design,” Journal ofMagnetism andMagneticMate-rials, vol. 409, pp. 116–123, 2016.
[26] E. Alp and N. Aydogan, “A comparative study: synthesis ofsuperparamagnetic iron oxide nanoparticles in air and N
2
atmosphere,” Colloids and Surfaces A: Physicochemical andEngineering Aspects, 2016.

Submit your manuscripts athttp://www.hindawi.com
ScientificaHindawi Publishing Corporationhttp://www.hindawi.com Volume 2014
CorrosionInternational Journal of
Hindawi Publishing Corporationhttp://www.hindawi.com Volume 2014
Polymer ScienceInternational Journal of
Hindawi Publishing Corporationhttp://www.hindawi.com Volume 2014
Hindawi Publishing Corporationhttp://www.hindawi.com Volume 2014
CeramicsJournal of
Hindawi Publishing Corporationhttp://www.hindawi.com Volume 2014
CompositesJournal of
NanoparticlesJournal of
Hindawi Publishing Corporationhttp://www.hindawi.com Volume 2014
Hindawi Publishing Corporationhttp://www.hindawi.com Volume 2014
International Journal of
Biomaterials
Hindawi Publishing Corporationhttp://www.hindawi.com Volume 2014
NanoscienceJournal of
TextilesHindawi Publishing Corporation http://www.hindawi.com Volume 2014
Journal of
NanotechnologyHindawi Publishing Corporationhttp://www.hindawi.com Volume 2014
Journal of
CrystallographyJournal of
Hindawi Publishing Corporationhttp://www.hindawi.com Volume 2014
The Scientific World JournalHindawi Publishing Corporation http://www.hindawi.com Volume 2014
Hindawi Publishing Corporationhttp://www.hindawi.com Volume 2014
CoatingsJournal of
Advances in
Materials Science and EngineeringHindawi Publishing Corporationhttp://www.hindawi.com Volume 2014
Smart Materials Research
Hindawi Publishing Corporationhttp://www.hindawi.com Volume 2014
Hindawi Publishing Corporationhttp://www.hindawi.com Volume 2014
MetallurgyJournal of
Hindawi Publishing Corporationhttp://www.hindawi.com Volume 2014
BioMed Research International
MaterialsJournal of
Hindawi Publishing Corporationhttp://www.hindawi.com Volume 2014
Nano
materials
Hindawi Publishing Corporationhttp://www.hindawi.com Volume 2014
Journal ofNanomaterials