Embed Size (px)
Citation preview

Research ArticleStudy on the Effectiveness of the Investment Strategy Based ona Classifier with Rules Adapted by Machine Learning
A. WiliNski, A. Bera, W. Nowicki, and P. BBaszyNski
West Pomeranian University of Technology, Zołnierska 49, 71-210 Szczecin, Poland
Correspondence should be addressed to P. Błaszynski; [email protected]
Received 29 September 2013; Accepted 12 December 2013; Published 3 February 2014
Academic Editors: J. Bajo and K. W. Chau
Copyright © 2014 A. Wilinski et al. This is an open access article distributed under the Creative Commons Attribution License,which permits unrestricted use, distribution, and reproduction in any medium, provided the original work is properly cited.
This paper examines two transactional strategies based on the classifier which opens positions using some rules and closes themusing different rules. A rule set contains time-varying parameters that when matched allow making an investment decision.Researches contain the study of variability of these parameters and the relationship between learning period and testing (usingthe learned parameters). The strategies are evaluated based on the time series of cumulative profit achieved in the test periods. Thestudy was conducted on the most popular currency pair EURUSD (Euro-Dollar) sampled with interval of 1 hour. An importantcontribution to the theory of algotrading resulting from presented research is specification of the parameter space (quite large,consisting of 11 parameters) that achieves very good results using cross validation.
1. Introduction
The aim of this work is to verify the hypothesis of patternsextraction possibility from time series, which could be classi-fied as providing better statistic andmore accurate prognosis.Another important objective is confirmation of assumptionthat financial markets time series have a “memory” of patternefficiency in a time period following the time series that wasused in learning period. This approach is consistent withthe classic aim of machine learning shown by Murphy [1],especially to financial markets described by Satchwell [2].Research intention was also to follow reproducibility prin-ciple of other researchers’ studies, as well as by themselves,in other data environments, to make sense of the use ofcomputational intelligence in its reasonable reproducibility[3, 4], in extracting of the regularity from chaos [5, 6].
An investment strategy with a relatively high complexity(measured by the number of factors included in the model)was built, derived from a strategies group called strategy ofsimple rules. In the literature those strategies are consideredto be mainly strategies based on moving averages—theirintersections and derivatives shown, for example, by Brock etal. [7], Cai et al. [8], andmany other authors [9–11]. Of course,the world of algorithms as well as predictionmethods using a
completely different nature, such as regression [12], multipleregression [13, 14], Fourier and wavelet transforms, andmanyothers [15, 16] is plenteous.These methods are used as a basisfor comparison; however the main focus is on mentionedsimple rules.
This paper proposes strategy, which differs by suggestingdifferent behaviors than the ones proposed when usingBollinger’s Band, which has its foundation in a band builtin an unusual way. According to the strategy based on thatband, generally it can be assumed that the trend is horizontaland it is recommended to open position to the center ofthe band, after its cross by the price from the inside. Inproposed strategies, another band that is based onmaxima ofthemaxima andminima of theminima of last several candlesis used.
Considered strategies move away from the principleof opening positions to the center of the band. In onemodification, hereinafter referred to as substrategy, positionopens into the center of the band, whereas in another one,position opens on the outside. By treating the two consideredsubstrategies as an entirety and as strategies that are mutuallyretrieving (although a more appropriate word would becomplementary) it is assumed that, in the selected tradingsection, opening positions in opposite directions, of course
Hindawi Publishing CorporationISRN Artificial IntelligenceVolume 2014, Article ID 451849, 10 pageshttp://dx.doi.org/10.1155/2014/451849

2 ISRN Artificial Intelligence
0 500 1000 1500 2000 2500 3000 3500 4000 4500 5000
1.22
1.24
1.26
1.28
1.3
1.32
1.34
Candles count
Clos
e pric
e
Figure 1: Time series EURUSD 1 h.
not at the same time, can be done intentionally and effectively.During the trading, nature of the market (trend, volatility)may change. The market may be in some periods horizontal,in other trended. It is appropriate to seek all opportunities forprofit. A similar philosophy is applied by several Krutsingercorrespondents [17], who belong to most prominent tradersin USA, who advocate unfounded reversal of the direction ofopening the positions in case of series of failures.
Returning to the issue of complexity of strategy, there areoften opinions that the growing complexity of the predictionmodel is not indicated, because in learning section it leadsto overfitting [1, 8, 14]. This results in a greater error inthe test sections. The problem of selecting the proper ratiobetween learning and testing phase is still unsolved for thenonstationary time series [5, 18]. In this situation the rightapproach seems to be the use of the idea of computationalintelligence [3, 6] which helps to compute adequate length oflearning and testing period.
Therefore in this paper two rather complex strategies(described below) are used, achieving results that are assessedas rewarding. Attention is drawn to the fact that the satis-faction problem belongs to the other sciences and dependson the trader’s individual perception of the relationshipbetween profit and risk, greed and fear [19]. However, theissue of emotions in the trade is not considered here, but onlynoticed because there is the assumption that trading is doneautomatically.
The tests were deliberately performed in a fragment ofthe time series of a heavily diversified course, which containsboth rising and downward trends as well as horizontalelements (Figure 1). This time series consists of 4734 1-hourcandles, of the most important and the most fluent currencypair EURUSD from October 22, 2012.
A choice of parameters essential for defining the rules ofopening and closing positions is crucial to the effectivenessof the strategy. Parametric space presented in this paper is aresult of many trials prior to its final approval.
2. Characteristics of Investment Strategies
The objective of the two strategies considered is to makeinvestment decisions about buying or selling—opening longor short position in the market studied—the currency pairEURUSD. The decision is based on the intersection of thecurrent price and one of two barriers of additional indicator,called the ribbon. The band is made of two values calculatedat the opening of each candle on the basis of historical dataof the market. During the candle, values of the band do notchange; therefore, barriers are creating step functions. In casewhen the current price exceeds any of the barrier values (goesout of the band), a decision to buy or sell is made—the type ofdecision depends on the variant of the considered strategy—decision for substrategy TewiMiC is different than in case ofTewiMiD. Names of the strategies are derived from the nameof the project, in which the research was carried out.
2.1. Definition of the Band. The values of barriers forming aband are calculated using themaximumandminimumvaluesof the last candle (OHLC: Open, High, Low, Close prices). Inthe case of the upper band, it is the maximum of the maximalvalues of the 𝑛 last candles, whereas in the case of the bottomband, it is the minimum of the minimal values of 𝑚 lastcandles:
topBorder = max (𝐻𝑖−𝑛, . . . , 𝐻
𝑖−1) ,
bottomBorder = min (𝐿𝑖−𝑚, . . . , 𝐿
𝑖−1) .
(1)
As mentioned earlier, strategy comes in two versionsthat differ in terms of opening the positions when crossingthe band. These differences result from different investorassumption about currently prevailing market trend. In thefirst case it is believed that the trend has just started andpositions need to be opened in accordance with it. In thesecond case, the play is against the trend.The two consideredvariants, TewiMiC and TewiMiD, are based on excesses ofthe lower limit of the band. TewiMiD implies existence of adownward trend, for which when crossing (down) the lowerlimit of the band, a short position (assuming the price drop)is opened. This is known in the literature and in trading asSell Stop model.
TewiMiC assumes the opposite case; therefore it is neededto open a long position (assuming the price increase). This isBuy Limit model.
2.2. Strategy Parameters. Considered strategies are basedon a objects classification (events that meet the conditionscontained in the set of rules which depend on the value ofcertain parameters). Object—the event—is another candle.Rules are logical sentences like “if the price is greater than theupper barrier of the band” and the parameter is, for example,the upper barrier, which is a variable value.
These parameterswill determinewhether the strategywillearn or lose. Appropriate selection of parameter values istherefore a key optimization issue in the use of the strategy.Considered strategies have 11 parameters, which are subjectof optimization.

ISRN Artificial Intelligence 3
𝑝1 is the number of candles, based on which the cal-culation of the current value of the band barrier ismade; for researched time series, value of𝑝1 generallyranges from 10 to 30;
𝑝2 is the number of steps forward, after which theposition is closed in case when none other closeconditions were met before; this value belongs torange from 3 to 40;
𝑝3 is StopLoss condition; usually it remained in rangefrom 0.002 to 0.017 expressed in values of EURUSD,which in researched period stayed in range from 1.2to 1.4, as can be seen in Figure 1;
𝑝4 is TakeProfit condition, generally ranged from 0.0015to 0.009;
𝑝5 is band buffer, offset from the barrier of the banddefining the actual level of the expected crossing ofthe price, ranged from −0.002 to 0.003;
𝑝6 is maximum number of open positions at the sametime, ranged from 3 to 20;
𝑝7 is the number of candles that determines averagevolume value; generally ranged from 2 to 10;
𝑝8 is maximum value of the difference between thecurrent value of the volume and the average valuecalculated on the basis of 𝑝7 candles back, rangedfrom 150 to 500;
𝑝9 is the number of candles on the cumulative profitcurve, based on which current drawdown is calcu-lated, ranged from 5 to 25;
𝑝10 is the highest acceptable drawdown on the cumulativeyield curve; generally ranged from 0.0021 to 0.008;
𝑝11 is acceptable amount of the cumulative loss for allcurrently open positions, ranged from 0.0005 to0.003.
2.3. Conditions of Opening. As mentioned before, the signalto open the position is the intersection of the current priceof the observed value and some barrier (that results from thecalculated band). Special parameter called the buffer (𝑝5) hasbeen added, causing the offset of barrier from its actual value.Thus, the condition for opening TewiMIC strategy is
if [(price < bottomBorder (𝑝1) − buffor (𝑝5)) ,
(current 𝑝6 < 𝑝6) , (Vol −meanVol (𝑝7) < 𝑝8)]
then open position long,
(2)
where price is current value for EURUSD, bottomBorder(𝑝1) is value of lower band barrier for parameter 𝑝1, hereminimumof last𝑝1minima, buffor (𝑝5) is value of buffer thatmoves said barrier, current 𝑝6 is number of currently openedpositions, Vol is current value of volume (in the candle),
meanVol (𝑝7) is mean of volume of last 𝑝7 candles, and theopening condition for TewiMiD is as follows:
if [(price < bottomBorder (𝑝1) − buffor (𝑝5)) ,
(current 𝑝6 < 𝑝6) , (Vol −meanVol (𝑝7) > 𝑝8)]
then open position short.
(3)
As a result of these conditions, long positions, in sub-strategy TewiMIC, are opened when three conditions aremet simultaneously: crossing the bottom barrier reduced bybuffer by the current price, the number of open positions isless than the limit (which is the optimized parameter𝑝6), andthe difference between the current volume and the average ofthe volume of the last 𝑝7 candle is less than the parameter 𝑝8.
For TewiMiD strategy, analogously, with significant dif-ferences, short positions will be opened and it is advisablethat current volume should be greater than the average. As theresult of conducted research, authors concluded that volume(number of price changes in observed time frame—hereduring one hour) was the most important and most sensitivefactor of decision model.
These conditions can be met in two cases during theperiod of the current considered candle. They can be metimmediately at the opening of the candle; that is, the openingvalue of the current candle is smaller than the barrierbottomBorder reduced by parameter 𝑝5. That condition canbe met within the candle, when the current value of the pricebreaks through the lower barrier.
The result of that is that we have two distinctly differentopening conditions.
2.4. Conditions of Closing. In both substrategies there are7 cases of closing the open positions, which results intheir complexity—both in terms of logic and calculation.This complexity, however, exhausts all the possible surprisesand does not leave any opportunity for the unexpectedmarket behavior. Of course, depending on the values of theparameters, frequency occurrences of closure cases can bevery different.
Firstly the terms for closing the long positions that wereopened by conditions for TewiMiC will be presented.
(1) Opened long position will be closed, if at the close ofthe candle (𝑖+𝑝2) the position remained open, where𝑖 is number of candle, which was opened.
(2) Positionwill be closed if at the opening of the next (𝑖 +𝑘)th, the candle after 𝑖th candle, in which the positionwas opened, the following condition is met:
Price𝑂 (𝑖 + 𝑘) − Price (𝑖) < −SL, (4)
where Price𝑂(𝑖 + 𝑘) is the opening value for (𝑖 + 𝑘)thcandle and SL is StopLoss (level of acceptable risk inone trade) in pips.Then the profit (in this case loss) will be calculated as
Profit = Price𝑂 (𝑖 + 𝑘) − Price (𝑖) . (5)

4 ISRN Artificial Intelligence
(3) Position will be closed if inside the next (𝑖 + 𝑘)th,the candle after 𝑖th candle, in which the position wasopened, the following condition is met:
(Price𝑂 (𝑖 + 𝑘) − Price (𝑖)) > −SL,
(LowPrice (𝑖 + 𝑘) − Price (𝑖)) < −SL.(6)
Then the profit (in this case loss) will be calculated as
Profit = −SL, (7)
where LowPrice(𝑖 +𝑘) is a minimum value of (𝑖 +𝑘)thcandle.
(4) Positionwill be closed if at the opening of the next (𝑖 +𝑘)th, the candle after 𝑖th candle, in which the positionwas opened, the following condition is met:
Price𝑂 (𝑖 + 𝑘) − Price (𝑖) > TP, (8)
where TP is TakeProfit (maximum reward level insingle trade) in pips.Then the profit will be calculated as
Profit = Price𝑂 (𝑖 + 𝑘) − Price (𝑖) . (9)
(5) Position will be closed if inside the next (𝑖 + 𝑘)th,the candle after 𝑖th candle, in which the position wasopened, the following condition is met:
(Price𝑂 (𝑖 + 𝑘) − Price (𝑖)) < TP,
(HighPrice (𝑖 + 𝑘) − Price (𝑖)) > TP.(10)
Then the profit will be calculated as
Profit = TP, (11)
where HighPrice (𝑖 + 𝑘) is the maximum value for (𝑖 +𝑘) candle.
(6) Position will be closed if at the opening of the next (𝑖+𝑘)th, the candle after 𝑖th candle, in which the positionwas opened, the following condition is met:
Price𝑂 (𝑖 + 𝑘) > topBorder (𝑖 + 𝑘) . (12)
Then the profit will be calculated as
Profit = Price𝑂 (𝑖 + 𝑘) − Price (𝑖) . (13)
(7) Position will be closed if inside the next (𝑖 + 𝑘)th—the candle after 𝑖th candle, in which the position wasopened, following condition is met:
Price (𝑖 + 𝑘) > topBorder (𝑖 + 𝑘) . (14)
Then the profit will be calculated as
Profit = topBorder (𝑖 + 𝑘) − Price (𝑖) . (15)
In substrategy TewiMiD conditions will look slightly differ-ent.
(1) Opened short position will be closed if at the close ofthe candle (𝑖 + 𝑝2)th the position remained open.
(2) Positionwill be closed if at the opening of the next (𝑖 +𝑘)th, the candle after 𝑖th candle, in which the positionwas opened, the following condition is met:
Price (𝑖) − Price𝑂 (𝑖 + 𝑘) < −SL. (16)
Then the profit (in this case loss) will be calculated as
Profit = −Price𝑂 (𝑖 + 𝑘) + Price (𝑖) . (17)
(3) Position will be closed if inside the next (𝑖 + 𝑘)th,the candle after 𝑖th candle, in which the position wasopened, the following condition is met:
(−Price𝑂 (𝑖 + 𝑘) + price (𝑖)) > −SL,
(−HighPrice (𝑖 + 𝑘) + Price (𝑖)) < −SL.(18)
Then the profit (in this case loss) will be calculated as
Profit = −SL. (19)
(4) Position will be closed if at the opening of the next (𝑖+𝑘)th, the candle after 𝑖th candle, in which the positionwas opened, the following condition is met:
Price (𝑖) − Price𝑂 (𝑖 + 𝑘) > TP. (20)
Then the profit will be calculated as
Profit = −Price𝑂 (𝑖 + 𝑘) + Price (𝑖) . (21)
(5) Position will be closed if inside the next (𝑖 + 𝑘)th,the candle after 𝑖th candle, in which the position wasopened, the following condition is met:
(−Price𝑂 (𝑖 + 𝑘) + Price (𝑖)) < TP,
(−LowPrice (𝑖 + 𝑘) + Price (𝑖)) > TP.(22)
Then the profit will be calculated as
Profit = TP. (23)
(6) Positionwill be closed if at the opening of the next (𝑖 +𝑘)th, the candle after 𝑖th candle, in which the positionwas opened, the following condition is met:
Price𝑂 (𝑖 + 𝑘) > bottomBorder (𝑖 + 𝑘) . (24)
Then the profit will be calculated as
Profit = −Price𝑂 (𝑖 + 𝑘) + Price (𝑖) . (25)

ISRN Artificial Intelligence 5
(7) Position will be closed when inside the opening of thenext (𝑖 + 𝑘)th, the candle after 𝑖th candle, in which theposition was opened, the following condition is met:
Price (𝑖 + 𝑘) > bottomBorder (𝑖 + 𝑘) . (26)
Then the profit (in this case loss) will be calculated as
Profit = −bottomBorder (𝑖 + 𝑘) + Price (𝑖) . (27)
Additional conditions that are checked with each closing arethe rules containing parameters 𝑝9, 𝑝10, and 𝑝11. Theseparameters are found in the rules limiting the risk of anunacceptable failure. Moreover, the principle stating that inthe case when the opening took place at the beginning of thecandle, it is permissible to keep it open until following candleis opened was used. Because of that, it was possible to avoidambiguity involving the unpredictable sequence of the SL andTP.
3. Strategy Analysis
In both strategies a fixed period of learning is assumed (inthe presented solution, 1000 one-hour candles), followed bya testing period. Data from learning period were used to finda class of patterns which allowed achieving maximum forthe selected criterion, in this study Calmar ratio (which isdefined as a final profit to maximum drawdown ratio) wasselected. The same patterns were then searched during thetest period and the test results were computed for previouslyunused data space. Of course, these results do not haveto already be positive and acceptable and could negativelysurprise investors. During the test the maximum rate of netprofit (with transaction costs) was considered as a measureof the effectiveness of the investment. The authors believethat these two criteria in evaluating the quality of simulationresults are legitimate. In the first phase of the validation, thetraining period is indicated for moderate and prudent riskmanagement. In the test phase (in terms of actual trading)investor is mainly interested in profit.
The main aim of the research was to obtain the mosteffective investment strategies by dynamic selection of testperiod duration. Later in this paper concepts of learningperiod, a fixed-length 1000 candles but with different start intime, were used. Immediately after period of learning therewas a variable-length test period. The authors look for thebest (by the criteria described above) length of the test periodin their research. This most preferred length of the learningperiod can be understood in two ways. This length can bechanged after each learning period adjusted by additionalcurrent information feedback about profits or losses in thetest period. It may also be the average length of the testwindow established on the basis of several recent validations.
Given that the search space is relatively broad andunknown (it is difficult to estimate how specific combinationof parameters would influence strategy’s effectiveness) itis necessary to define its boundaries and then to find acombination of parameters that would maximize strategy’sefficiency. In the first step of the process, a pseudorandom
Learn Test
NowTime
Learn Test
Now
Learn Test
Now
Time
Time
· · ·
Figure 2: Methods of testing carried out to test the variable sizewindow.
strategy is used to find the boundaries of the parameterspace in which may exist the optimal solution. Calmar ratiovalue was used to assess the adequacy of randomly selectedparameter combinations for a given period of learning. Itwould be possible to use an iterative method that wouldtraverse the search space with certain step. However itwould be extremely time consuming method given that thespace is 11-dimensional. In the second stage PSO (ParticleSwarmOptimization) [20] algorithm,which already has beenproved useful in finding optimal strategy parameters [21]and allows to find a satisfying combination of parametersvalues in relatively short time even in broad search spaces,was used. Search space for PSO algorithm has been definedin previous step. The objective function was to maximizingthe Calmar ratio, as it was in the first step. The above tacticwas used for each stage of the learning period and thenchecked “sustainability” of designated sets of parameters fortest periods of different lengths—the basic rate of 100 candlesand the other in the range of 10–400. Figure 2 shows howthe research was conducted. Having historical data for 1000candles, optimal parameters, for said data, have been foundusing approach described above. After the parameters search,tests was performed on the current data. The strategy for thelearned parameters should be used as long as it will bringsatisfactory results on new data. When results were no longergood enough, the next parameters search were performedon next piece of historical data. Thus, the authors aim isto determine the point where those parameters should berecalculated. Additionally, the authors set out to test a newstandard of quality prediction. Now, extending the periodof testing can produce better results, but more slowly orwith local drawdown in comparison to first period, whenthe classifier “remembers” the nature of the market. Thisnew criteria is profit attributable to one candle of the testingperiod.
Figures 3(a) and 3(b) show the cumulative profit for thetest period equal to 100 candles (hours) for the two examinedstrategies.
It may be noted that the two policies, for the test period of100, allow for systematic profit in examined period with onlysmall drawdowns. Profit for the strategy TewiMiC 0.355, forTewiMiDprofit is several times smaller and amounts to 0.094.But second strategy has smaller drawdowns. In addition, itis confirmed with the higher Calmar ratio—12.79—where

6 ISRN Artificial Intelligence
0 500 1000 1500 2000 2500 3000 3500 4000 45000
0.05
0.1
0.15
0.2
0.25
0.3
0.35
0.4
Candles count
Cum
ulat
ive r
etur
n
(a) Substrategy TewiMiC
0 500 1000 1500 2000 2500 3000 3500 4000 45000
0.01
0.02
0.03
0.04
0.05
0.06
0.07
0.08
0.09
0.1
Candles count
Cum
ulat
ive r
etur
n
(b) Substrategy TewiMiD
Figure 3: Charts of the profit for both strategies with fixed test period size—100 candles.
0 100200
300400
10002000
30004000
5000
00.10.20.30.4
Length of test period
Candles count
Cum
ulat
ive
retu
rn
−0.1
(a) Results in 3D
0 50 100 150 200 250 300 350 400 450
0
0.05
0.1
0.15
0.2
0.25
0.3
0.35
0.4
Length of test period
Cum
ulat
ive r
etur
n
−0.05
(b) Final results
Figure 4: Earnings accumulated over time, depending on the length of the test period for TewiMIC.
the result for first of these strategies is 10.22. Accordingto the authors, results are excellent, achieved on testingsections, not on the learning periods. On learning periods,of course, significantly better results were achieved withclassifier matching. It is also clear that asymmetry results forthe two strategies arise from different approaches—the firstone is focused on horizontal trend, the other on a downwardtrend. The results depend on the nature of the market, whichis automatically founded by learning strategies. Perhaps atanother period of time, for other data these results could bedifferent. In addition to the basic performance of the lengthof the test period equal to 100, a number of studies wereconducted on different lengths of the testing period. Theremay be more favorable length of test window than arbitrarilyselected window length of 100 candles.
Results for TewiMiC. Figures 4 and 5 show the results ofthe strategy TewiMiC. First (Figure 4(a)) shows the effect oftest duration on the profit curve in time. To show how long
in the test period optimal results are achieved we plotted2D (twodimensional) chart of final profit for each of theexamined sizes. Figure 4(b) shows that the number of candlesfor achieving high and satisfactory results are attributable to80–120. The window size 100 reflects quite well expected testsection.
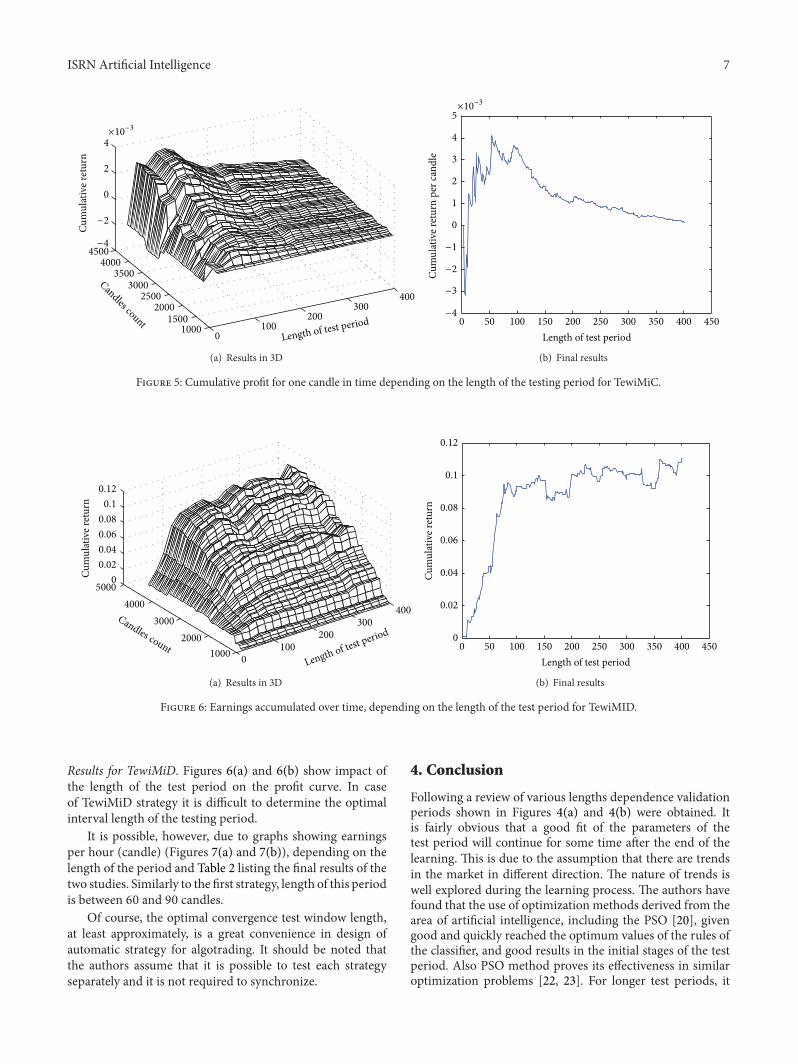
Due to the different lengths of studied test periods, morereliable value used when making the decision is earningsper candle (that shows how much can strategy earn in onehour). This is shown in Figures 5(a) and 5(b). On this basis,Table 1, it can be concluded that the strategy is most effectivefor the testing period length between 60 and 110 hours. Itcan therefore be concluded that the average window of 100candles well “remembers” the learned classifier parameters.Many times in the classification of patterns, it is importantwhether patterns are frequent. Part of the dilemma is solvedby introducing earnings per candle but also in Table 1 acount of opened market positions in the testing periods ispresented.
ISRN Artificial Intelligence 7
0100
200300
400
10001500
20002500
30003500
40004500
0
2
4
Length of test period
Candles count
Cum
ulat
ive r
etur
n
−2
−4
×10−3
(a) Results in 3D
0 50 100 150 200 250 300 350 400 450
0
1
2
3
4
5
Length of test period
Cum
ulat
ive r
etur
n pe
r can
dle
−1
−2
−3
−4
×10−3
(b) Final results
Figure 5: Cumulative profit for one candle in time depending on the length of the testing period for TewiMiC.
0100
200300
400
10002000
30004000
50000
0.020.040.060.08
0.10.12
Length of test periodCandles count
Cum
ulat
ive r
etur
n
(a) Results in 3D
0 50 100 150 200 250 300 350 400 4500
0.02
0.04
0.06
0.08
0.1
0.12
Length of test period
Cum
ulat
ive r
etur
n
(b) Final results
Figure 6: Earnings accumulated over time, depending on the length of the test period for TewiMID.
Results for TewiMiD. Figures 6(a) and 6(b) show impact ofthe length of the test period on the profit curve. In caseof TewiMiD strategy it is difficult to determine the optimalinterval length of the testing period.
It is possible, however, due to graphs showing earningsper hour (candle) (Figures 7(a) and 7(b)), depending on thelength of the period and Table 2 listing the final results of thetwo studies. Similarly to the first strategy, length of this periodis between 60 and 90 candles.
Of course, the optimal convergence test window length,at least approximately, is a great convenience in design ofautomatic strategy for algotrading. It should be noted thatthe authors assume that it is possible to test each strategyseparately and it is not required to synchronize.
4. Conclusion
Following a review of various lengths dependence validationperiods shown in Figures 4(a) and 4(b) were obtained. Itis fairly obvious that a good fit of the parameters of thetest period will continue for some time after the end of thelearning. This is due to the assumption that there are trendsin the market in different direction. The nature of trends iswell explored during the learning process. The authors havefound that the use of optimization methods derived from thearea of artificial intelligence, including the PSO [20], givengood and quickly reached the optimum values of the rules ofthe classifier, and good results in the initial stages of the testperiod. Also PSO method proves its effectiveness in similaroptimization problems [22, 23]. For longer test periods, it

8 ISRN Artificial Intelligence
0100
200300
400 10001500
20002500
30003500
40004500
0
0.5
1
1.5
2
Candles co
unt
Length of test period
Cum
ulat
ive r
etur
n
×10−3
(a) Results in 3D
0 50 100 150 200 250 300 350 400 4500
0.2
0.4
0.6
0.8
1
1.2
1.4
1.6
Length of test period
Cum
ulat
ive r
etur
n pe
r can
dle
×10−3
(b) Final results
Figure 7: Cumulative profit for one candle in time depending on the length of the testing period for TewiMiD.
Table 1: Final profits and Calmar ratio for the selected length of the test period for TewiMiC.
Size Profit Profit per candle Calmar Open positions Percentage (%)30 0.0812 0.0027 2.4182 93 1040 0.0768 0.0019 1.4048 120 9.6850 0.1176 0.0024 2.4069 134 8.6560 0.2318 0.0039 5.3914 153 8.2370 0.2211 0.0032 4.7859 176 8.1180 0.2359 0.0029 5.1063 196 7.990 0.3005 0.0033 8.6589 221 7.92100 0.3548 0.0035 10.221 245 7.9110 0.3294 0.003 9.4905 262 7.68120 0.3172 0.0026 8.6479 283 7.61150 0.2648 0.0018 4.6295 345 7.42200 0.2194 0.0011 2.8244 482 7.77250 0.2091 0.0008 2.2352 574 7.41300 0.1684 0.0006 1.5345 720 7.74350 0.1399 0.0004 1.0402 804 7.41400 0.073 0.0002 0.5074 914 7.37
can indeed get good results; however, the effectiveness ofthe strategy per hour decreases significantly. Obtained resultsallow concluding that the constant average length of thetest window is more efficient and easier to manage thana strategy adaptively changing the length of the period.Strategies properties discovered during the learning periodare effective for a short time—for test data period—goodlengths for both strategies are about 50 to 120 hours at 1000hours of learning time. In the real market it usually meansfrom 2 to 5 days. It can be assumed that the re-learning of theparameters of the strategy should be carried out 1-2 times aweek.This frequency is quite practical even formanual searchof optimal parameters without fully automatic trading.
Presented trading strategies (substrategy TewiMiC andTewiMiD) are complementary, since each variant can developa set of different parameters. Separate sets of parameters
are adapted better to the nature of the market duringoptimization. It allows, for example, trading long positions inthe markets with more frequent upward trends. It should benoted that a further optimizations discovered trends that areshort-term and during one cycle of validation several changesin these trends can occur.These changes could be of differentlengths. Then there is the situation that one of the variantsof the strategy takes into account the length of trends fordeviating significantly from trends indicated by the secondvariant. The two strategy variants are part of an investmentstrategy that allows you to combine the four options oftrading strategies. You can join the strategies presented withthe strategies associated with the opening of long positionsbased on condition (order) Buy Stop and short positions inaccordance with the model Sell Limit. It is possible to addto the current strategies additional sub strategies associated

ISRN Artificial Intelligence 9
Table 2: Final profits and Calmar ratio for the selected length of the test period for TewiMiD.
Size Profit Profit per candle Calmar Open positions Percentage (%)30 0.0249 0.0008 4.2953 47 5.0540 0.0401 0.001 8.012 60 4.8450 0.0443 0.0009 8.868 66 4.2660 0.0636 0.0011 13.25 83 4.4670 0.0771 0.0011 16.0687 95 4.3880 0.0914 0.0011 19.0396 118 4.7690 0.0899 0.001 10.5222 130 4.66100 0.0935 0.0009 12.7934 141 4.55110 0.0921 0.0008 12.6559 150 4.4120 0.0949 0.0008 13.0337 159 4.27130 0.0955 0.0007 13.1243 178 4.42200 0.1011 0.0005 9.464 263 4.24250 0.0965 0.0004 9.0392 328 4.23300 0.1008 0.0003 9.3983 410 4.41350 0.0924 0.0003 7.2935 467 4.3400 0.1105 0.0003 8.1655 558 4.5
with opening long positions (based on condition for Buy Stoporder) and short positions (in accordance with the Sell Limitmodel). Interesting, according to the authors, may also beimproving the combined strategies through the synthesis ofrecommendations. An example of such improvement may becombination of four variants, some of which (e.g., 3) indicatethe need for the purchase, and some (such as 1) the need toconclude the sale of stock—then the number of transactionsthat were made results from accumulating all of the variants(in presented case—2 purchases). This implies a lower cost(e.g., 2 times smaller). Transaction costs for certain decisionstests can be omitted, and this reduction significantly affectsthe efficiency improvement investment strategy. The studiestake into account the transaction costs for the pessimistic(above average costs in popular brokers). In practical terms,the strategy has big potential. With traditional software,trading programs (such as Metatrader) do not have thepossibility of converting simple strategy parameters duringoperation. This implies the need for a hybrid solution, con-sisting, for example, of interprocess communication betweenthe trading software and program developed in universalhigh-level language (e.g., Matlab, C#). Algotarding futurewill very likely be increasingly active domain for expertsin algorithmization and programming and less and less foreconomists and econometricians.
Authors are aware of the fact that the parametric space isbroad and choosing right ones is not a trivial task. It is notobvious that chosen and presented in this paper parametersare the best. There are no obvious sources that would sug-gest which parameters should be considered in investmentstrategies. To determine the parameters utilized in presentedstrategies an iterative computation has been used—afteradding parameter the results were assessed and when theywere acceptable the following parameter was added to thestrategy. Even though selected parameters resulted in highefficiency, it does not mean that one should refrain from
searching for better choice of parameters. Presented resultscan be considered as particularly good and are reproducibleby scrupulous reader. Alternative strategies can be comparedwith presented ones using the same criteria (i.e., Calmarratio). For many years the authors have been improvingfollowing strategy and its implementation in the real market.Current and future research aims to study the influence of thenumber of parameters—expanding or limiting the parameterspace—and adding two additional substrategies based on thesame band as aforementioned.
Conflict of Interests
The authors declare that there is no conflict of interestsregarding the publication of this paper.
Acknowledgment
This work is done within the Project TEWI financed from theInnovative Economy Programme in years 2012 and 2013.
References
[1] K. P. Murphy, Machine Learning: A Probabilistic Perspective,Cambridge, Mass, USA, 2012.
[2] C. Satchwell, Pattern Recognition and Trading Decisions, IrwinTrader’s Edge Series, McGraw-Hill, 2005.
[3] G. Polya, How To Solve It, Garden City, Egypt, 1957.[4] D. L. Donoho, A. Maleki, M. Shahram, I. U. Rahman, and V.
Stodden, “Reproducible research in computational harmonicanalysis,” Computing in Science and Engineering, vol. 11, no. 1,pp. 8–18, 2009.
[5] P. Ball, Critical Mass: How One Thing Leads to Another, FarrarStraus Giroux, 2006.
[6] W. Pedrycz, Computational Intelligence: An Introduction, Com-puter Engineering, Software Programming, CRC Press, 1998.

10 ISRN Artificial Intelligence
[7] W. Brock, J. Lakonishok, and B. LeBaron, “Simple technicaltrading rules and the stochastic properties of stock returns,”Journal of Finance, vol. 47, no. 5, pp. 1731–1764, 1992.
[8] B. M. Cai, C. X. Cai, and K. Keasey, “Market efficiency andreturns to simple technical trading rules: further evidencefrom U.S., U.K., Asian and Chinese stock markets,” Asia-PacificFinancial Markets, vol. 12, no. 1, pp. 45–60, 2005.
[9] R. Gencay, “Linear, non-linear and essential foreign exchangerate prediction with simple technical trading rules,” Journal ofInternational Economics, vol. 47, no. 1, pp. 91–107, 1999.
[10] B. LeBaron, “Technical trading rules and regime shifts in foreignexchange,” Tech. Rep., 1991.
[11] G. G. Tian, H. U. A. Guang Wan, and G. U. O. Mingyuan,“Market efficiency and the returns to simple technical tradingrules: new evidence from U.S. Equity Market and ChineseEquity Markets,” Asia-Pacific Financial Markets, vol. 9, no. 3-4,pp. 241–258, 2002.
[12] A. Muriel, “Short-term predictions in forex trading,” Physica A,vol. 344, no. 1-2, pp. 190–193, 2004.
[13] A. Wilinski, “Prediction models of financial markets based onmultiregression algorithms,” CSJ of Moldova, vol. 19, no. 2, pp.178–188, 2011.
[14] K. Fujimoto and S. Nakabayashi, “Applying GMDH algorithmto extract rules from examples,” Systems Analysis ModellingSimulation, vol. 43, no. 10, pp. 1311–1319, 2003.
[15] R. Raghuraj and S. Lakshminarayanan, “Variable predictivemodels—a new multivariate classification approach for patternrecognition applications,” Pattern Recognition, vol. 42, no. 1, pp.7–16, 2009.
[16] P. Klesk and A. Wilinski, “Market trajectory recognition andtrajectory prediction using Markov models,” inArtificial Intelli-gence and SoftComputing, vol. 6113 of Lecture Notes in ComputerScience, pp. 405–413, 2010.
[17] J. Krutsinger, Trading Systems: Secrets of the Masters, McGraw-Hill, 1997.
[18] A. G. Ivakhnenko, An Inductive Sorting Method for the Forecastof Multidimensional Random Processes and Analog Events withthe Method of Analog Forecast Complexing, Pattern Recognitionand Image Analysis, 1991.
[19] D. Kahneman, P. Slovic, and A. Tversky, Judgment UnderUncertainty: Heuristics and Biases, Cambridge University Press,1982.
[20] J. Kennedy and R. Eberhart, “Particle swarm optimization,”in Proceedings of the IEEE International Conference on NeuralNetworks, vol. 4, pp. 1942–1948, December 1995.
[21] F.Wang, P. Yu, andD. Cheung, “Complex stock trading strategybased on Particle Swarm Optimization,” in Proceedings of theIEEE Conference on Computational Intelligence for FinancialEngineering Economics (CIFEr ’12), pp. 1–6, 2012.
[22] K. W. Chau, “Application of a PSO-based neural network inanalysis of outcomes of construction claims,” Automation inConstruction, vol. 16, no. 5, pp. 642–646, 2007.
[23] J. Zhang and K.-W. Chau, “Multilayer ensemble pruning vianovel multi-sub-swarm particle swarm optimization,” Journalof Universal Computer Science, vol. 15, no. 4, pp. 840–858, 2009.

Submit your manuscripts athttp://www.hindawi.com
Computer Games Technology
International Journal of
Hindawi Publishing Corporationhttp://www.hindawi.com Volume 2014
Hindawi Publishing Corporationhttp://www.hindawi.com Volume 2014
Distributed Sensor Networks
International Journal of
Advances in
FuzzySystems
Hindawi Publishing Corporationhttp://www.hindawi.com
Volume 2014
International Journal of
ReconfigurableComputing
Hindawi Publishing Corporation http://www.hindawi.com Volume 2014
Hindawi Publishing Corporationhttp://www.hindawi.com Volume 2014
Applied Computational Intelligence and Soft Computing
Advances in
Artificial Intelligence
Hindawi Publishing Corporationhttp://www.hindawi.com Volume 2014
Advances inSoftware EngineeringHindawi Publishing Corporationhttp://www.hindawi.com Volume 2014
Hindawi Publishing Corporationhttp://www.hindawi.com Volume 2014
Electrical and Computer Engineering
Journal of
Journal of
Computer Networks and Communications
Hindawi Publishing Corporationhttp://www.hindawi.com Volume 2014
Hindawi Publishing Corporation
http://www.hindawi.com Volume 2014
Advances in
Multimedia
International Journal of
Biomedical Imaging
Hindawi Publishing Corporationhttp://www.hindawi.com Volume 2014
ArtificialNeural Systems
Advances in
Hindawi Publishing Corporationhttp://www.hindawi.com Volume 2014
RoboticsJournal of
Hindawi Publishing Corporationhttp://www.hindawi.com Volume 2014
Hindawi Publishing Corporationhttp://www.hindawi.com Volume 2014
Computational Intelligence and Neuroscience
Industrial EngineeringJournal of
Hindawi Publishing Corporationhttp://www.hindawi.com Volume 2014
Modelling & Simulation in EngineeringHindawi Publishing Corporation http://www.hindawi.com Volume 2014
The Scientific World JournalHindawi Publishing Corporation http://www.hindawi.com Volume 2014
Hindawi Publishing Corporationhttp://www.hindawi.com Volume 2014
Human-ComputerInteraction
Advances in
Computer EngineeringAdvances in
Hindawi Publishing Corporationhttp://www.hindawi.com Volume 2014