Embed Size (px)
Citation preview

Research ArticleStayed-Cable Bridge Damage Detection and Localization Basedon Accelerometer Health Monitoring Measurements
Mosbeh R. Kaloop1,2 and Jong Wan Hu1,3
1Department of Civil and Environmental Engineering, Incheon National University, 12-1 Songdo-dong,Yeonsu-gu, Incheon 406-840, Republic of Korea2Department of Public Works and Civil Engineering, Mansoura University, Mansours 35516, Egypt3Incheon Disaster Prevention Research Center, Incheon National University, 12-1 Songdo-dong, Yeonsu-gu,Incheon 406-840, Republic of Korea
Correspondence should be addressed to Jong Wan Hu; [email protected]
Received 21 January 2015; Revised 15 March 2015; Accepted 17 March 2015
Academic Editor: Jiawei Xiang
Copyright © 2015 M. R. Kaloop and J. W. Hu. This is an open access article distributed under the Creative Commons AttributionLicense, which permits unrestricted use, distribution, and reproduction in any medium, provided the original work is properlycited.
In situ damage detection and localization using real acceleration structural health monitoring technique are the main idea of thisstudy.The statistical and model identification time series, the response spectra, and the power density of the frequency domain areused to detect the behavior of Yonghe cable-stayed bridge during the healthy and damage states. The benchmark problem is usedto detect the damage localization of the bridge during its working time. The assessment of the structural health monitoring anddamage analysis concluded that (1) the kurtosis statistical moment can be used as an indicator for damage especially with increasingits percentage of change as the damage should occur; (2) the percentage of change of the Kernel density probability for the modelidentification error estimation can detect and localize the damage; (3) the simplified spectrum of the acceleration-displacementresponses and frequencies probability changes are good tools for detection and localization of the one-line bridge damage.
1. Introduction
Structural health monitoring (SHM) systems are importantin assessing various forms of bridges, especially long-spanbridges damage detection and safety evaluation. Detectingbridges damage existence and localization, identifying dam-ages, and quantifying their severity are necessary to assessand know previous stages of bridges state. Long-span bridges,like cable-stayed, are often affected by different types of loads[1–3]. The assessment of long-span bridges during workingprocess is amain advantage of SHM, while studying the effectof environmental and traffic loads cannot be controlled ormeasured easily [3, 4]. Li et al. [3] noted that the vibrationapplication damage detection for engineering structures isstrongly affected by some factors, namely, variations in mate-rial properties, environmental variability (such as tempera-ture, wind velocity, and humidity), variability in operationalconditions (such as traffic flow) during measurement, anderrors associated with measured datasets and processing
techniques. However, SHM of bridges with monitoring loadseffects is a good tool to measure and assess the behavior ofbridges. The early damage detection is one of the advantagesof SHM, while the vibration acceleration measurements aresufficient to detect damage and localization [4].
The basic theory for damage detection and localizationdepends on the vibration or oscillation performance responsemeasured of structures. For instance, frequencies changes,damping rates geometric changes, and mode shapes whichrepresent the changes of the dynamic properties occurredwith damage effects [5–7]. Extensive research work wascarried out on the development of nondestructive damageassessment methods and on the translation of changes in themodal characteristics with damage in a structure [4, 5, 8].Review techniques for the damage detection using modelproperties changes can be found in [5]. The output onlyand input-output techniques are almost used to detect thedamage of long-span bridges [4]. For continuous healthmon-itoring study, the output technique is more suitable [4].
Hindawi Publishing CorporationShock and VibrationVolume 2015, Article ID 102680, 11 pageshttp://dx.doi.org/10.1155/2015/102680

2 Shock and Vibration
The stochastic structural response analysis is one of randomnature structural parameters analysis [9], which can classifyglobal response properties.This type of analysis is dependingmainly on the SHM techniques and concerns studying theperformance of structures based on output or measurementsresponses in both static and dynamic states. It is necessaryto employ signal processing and statistical classification toconvert sensor data on the bridge health status into damageinfo for assessment.
The time and frequency domains statistical and identifi-cation approaches are widely used to evaluate the stochasticstructures response [9–11]. For example, Catbas and Aktan[12] proposed the global and local conditions damage indicesfor the assessment of highway bridge. Furthermore, theypresented the linear and nonlinear conditions and damageindices for the global condition assessment of structures. Inaddition, they recommended that the structures monitoringcontinuously can identify the damage and movement assess-ment. Li and Chen [9] introduced and applied the probabilitydensity evaluation method to the dynamic analysis of non-linear behavior of structures with simulation response of tallbuildings, and they found that the probability density func-tions for the dynamic response were irregular and far fromnormal distribution. In addition, Kaloop [13] used the proba-bility density function to evaluate long-span bridges based onglobal positioning monitoring system and he found that thismethod can be used to investigate the static and dynamic per-formance of bridges. Follen et al. [11] proposed nonparamet-ric and parametric statistical conditions to evaluate bridgesin long-term monitoring system. They used the probabilitydensity function of absolute maximum strain of heavy truckevents to evaluate bridges status and concluded that damagecan be predicted by using the nonparametric probability pre-diction method. Moreover, many studies used probability toassess the time domain behavior of structures (e.g., [14–16]).
Moreover, the artificial neural networks are seen as a goodtool that can be used for model identification and damagedetection of different types of structures [1, 3, 4, 14]. Neuralnetworks for pattern recognition and dynamic response fromfinite element simulated data were used for the identificationof damage in suspension bridges [14]. In addition, adaptiveneural networks based on local response of structure wereapplied to detect bridges damage [17]. Arangio and Bontempi[4] combined probability with neural networks to assess thedamage behavior of cable-stayed bridge and used thismethodto study the behavior of Yonghe bridge due to damageeffects. Furthermore, they found that this method can beapplied to detect bridge behavior under damage effects. Leeet al. [18] used a neural networks-based damage detectionmethod; two numerical example analyses on a simple beamand a multigirder bridge are presented to demonstrate theeffectiveness of the used method. The results of their studyconfirmed the applicability of neural networksmethod. Fromthe previous studies, it can be seen that the main basic ofdamage detection and localization is structures parameterschange. Moreover, the nonlinearity soft computing modelidentification techniques have proved to be very efficient.
Novel applications of time series and frequency domainsare presented in this paper for structural health monitoring
and in situ damage detection particularly for problems withlarge measurements data. The objective of the paper is toapply simple techniques that can be used to detect onlinestructural damage. The statistical moments and model iden-tification are used as a simplemethod to detect in situ damageand localization of structures. In addition, the spectrumresponse and power for the acceleration time series measure-ments are suggestedmethods to investigate the damage basedon real SHM data. The probability of the time series modelerrors and frequency is used as new application in this studyto detect the damage.
2. Yonghe Bridge Description, PreviousStudies, and Structural Health Monitoring
The Yonghe bridge is one of the earliest cable-stayed bridgesconstructed inMainlandChina (Figure 1). It connects Tianjinand Hangu cities. The total length of bridge is 510m thatconsists of 260m main span and two side spans of 25.15 and99.85m each and 11m width. The towers heights are 60.5m.More details of bridge construction materials and propertiescan be found in [2, 7]. The bridge is opened to traffic at theend of 1987 and after 19 working years, cracks are observedat the bottom of the midspan girder. The bridge was repairedbetween 2005 and 2007 and reopened for traffic at the endof 2007 [7]. Moreover, to monitor and collect time seriesdata, a SHM system has been established and implementedby the Harbin Institute of Technology Research Center. Theacceleration monitoring system contains fourteen uniaxialaccelerometers permanently installed on the deck of themainspan and the two side spans and one biaxial accelerometerinstalled on the top of one tower (Figure 1); more detailsabout the bridge SHM design and observations can be foundin [2, 3, 7]. In August 2008, two different kinds of damagewere detected during the bridge inspection where the closuresegment at both side spans was seriously cracked. Meanwhilethe piers were damaged by overloading and the bridge expe-rienced partial loss of the vertical supports [3, 4], as shownin Figure 2. Li et al. [19] presented the history and reliabilityindices for the damage. In addition, the results of their studyconfirmed that the first failure mode has little influence onthe total bridge length reliability indices, while the reliabilityindices of segments near midspan point are increased [19].Furthermore, they found that the detachment of the supportschanged the structural system, so the reliability indices ofsegments near the side span decrease dramatically.These seg-ments will be seriously damaged in this failure mode, and theanalysis results agreed well with the practical situation [19].Figure 2 illustrates the practical auxiliary pier detachmentand the damage situation of side span damage. Kaloop and Li[1] studied the effect of environmental and traffic load on thetower static and dynamic movements using global positionmonitoring system measurements. Li et al. [3] presented thetemperature and wind effects on the bridge in both time andfrequency domains for the acceleration measurements.
The data for the reopening condition for the accelerationswere observed on September, 1, 2007. The data for the healthcondition include time histories of the accelerations recorded

Shock and Vibration 3
HanguTianjin
Biaxial Uniaxial
(1), (2) (3), (4) (5), (6) (7), (8) (9), (10) (11), (12) (13), (14)
1, 3, 5, 7, 9, 11, 132, 4, 6, 8, 10, 12, 14UpstreamDownstream
251599852600099852515
Figure 1: Yonghe bridge elevation and accelerations health monitoring system.
(a) (b)
Figure 2: (a) Auxiliary pier detachment and (b) damage situation of segment Tianjin direction.
by the 14 deck sensors that were repeated for 24 hours onJanuary 17, 2008.The sampling frequency of the accelerationsis 100Hz and the accelerometer properties can be foundin [2]. The damage condition includes other measurementsrecorded at the same locations shown on July 31, 2008.Meantime, as has already been stated, some damages havebeen observed. However, the 9th of April and the 7th of June,2008, are the selected dates to estimate the exact time at whichdamage occurred. The dataset again includes registrations of1 hour of the accelerations repeated for the 24 hours at thesame sampling frequency (100Hz). Because the observationnumbers and based on previous studies [1–4, 7], it can be seenthat the maximum affected traffic loads are during 9.00 to18.00. However, we selected one hour (11.00-12.00) for threepositions (1, 2; 7, 8; and 13, 14) to compare the result and assessacceleration monitoring time in this study.
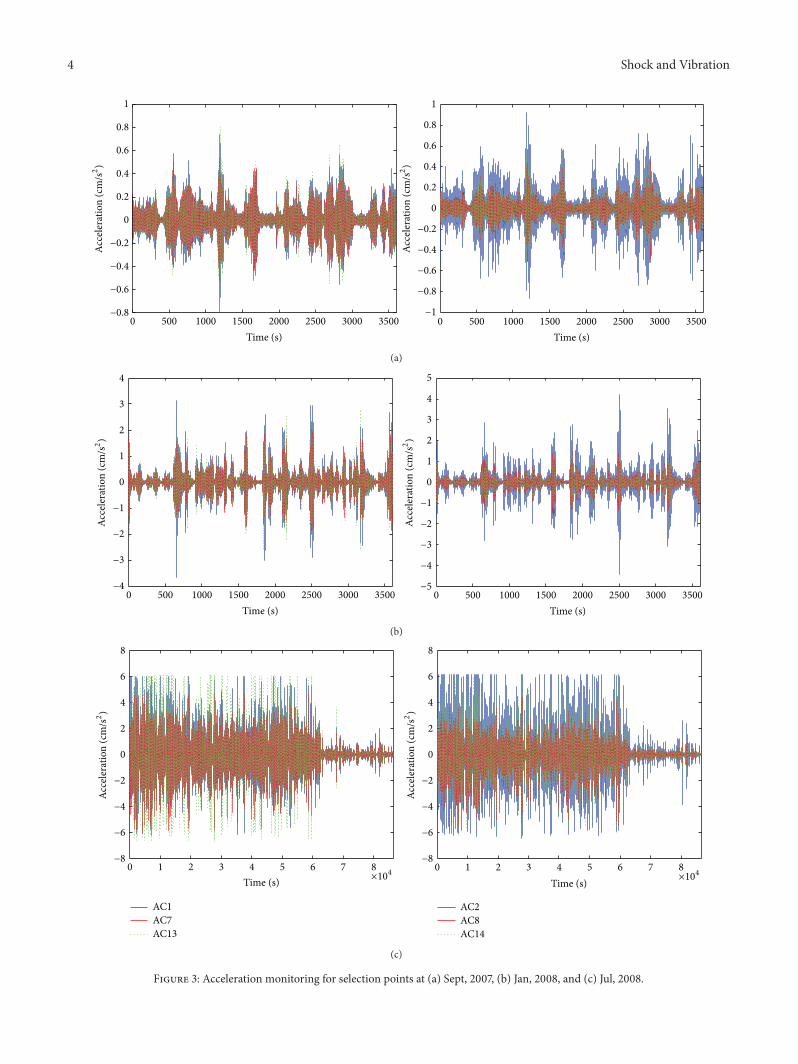
Figure 3 shows the (11.00-12.00) September 2007 (as abase data), January 2008 (as a healthy state) for both sidesof the bridge, and one day (00.00–24.00) monitoring data forthe July 31st, 2008 to show clearly the damage behavior. Theprestatistical acceleration time series monitoring data show
that the amplitude of acceleration is seen smaller at the basetime and increased seriously to damage state. Moreover, thedifference between upstream and downstream accelerationamplitude is shown; it means that the movement, torsion,and damage occurred. Figure 3(c) shows that the amplitudeof acceleration for points 1, 2, 13, and 14 decreased by 80%,while the amplitude acceleration for points 7 and 8 decreasedby 60%. Fortunately, load limitmeasureswere taken promptlyafter the failure occurred [19]. Furthermore, a dramaticallyacceleration amplitude decreased near 18.00 on the 31st ofJuly because the traffic load limit measures are taken at thattime to avoid the collapse of the bridge, and the cracks shownot propagate any more [2]. In addition, it can be seen thatthe acceleration at the midspan point is approximately equalto the side spans acceleration amplitude for the upstreamduring the selected base and healthy states. Also, it can beseen that the midspan acceleration is approximately equal tothe downstream acceleration amplitude during the selectedbase and healthy states. Thus, it means that either the bridgebehavior from its reopening time is not stable or there aresome loads changes that occurred. Moreover, it can be seen
4 Shock and Vibration
−0.8
−0.6
−0.4
−0.2
0
0.2
0.4
0.6
0.8
1
0 500 1000 1500 2000 2500 3000 3500Time (s)
0 500 1000 1500 2000 2500 3000 3500Time (s)
−1
−0.8
−0.6
−0.4
−0.2
0
0.2
0.4
0.6
0.8
1
Acce
lera
tion
(cm
/s2)
Acce
lera
tion
(cm
/s2)
(a)
0 500 1000 1500 2000 2500 3000 3500Time (s)
0 500 1000 1500 2000 2500 3000 3500Time (s)
−4
−3
−2
−1
0
1
2
3
4
−5
−4
−3
−2
−1
0
1
2
3
4
5
Acce
lera
tion
(cm
/s2)
Acce
lera
tion
(cm
/s2)
(b)
0 1 2 3 4 5 6 7 8−8
−6
−4
−2
0
2
4
6
8
Time (s)0 1 2 3 4 5 6 7 8
−8
−6
−4
−2
0
2
4
6
8
Time (s)
AC2AC8AC14
AC1AC7AC13
Acce
lera
tion
(cm
/s2)
Acce
lera
tion
(cm
/s2)
×104
×104
(c)
Figure 3: Acceleration monitoring for selection points at (a) Sept, 2007, (b) Jan, 2008, and (c) Jul, 2008.

Shock and Vibration 5
Table 1: Mean and standard deviation of monitoring selection points (cm/sec2).
Mon. point Sep, 2007 Jan, 2008 Apr, 2008 Jun, 2008 Jul, 2008Mean SD Mean SD Mean SD Mean SD Mean SD
AC1 0.019 0.495 0.015 0.3145 0.018 0.405 0.021 0.799 0.019 0.625AC7 0.074 0.248 0.062 0.143 0.064 0.184 0.067 0.363 0.074 0.313AC13 0.088 0.323 0.086 0.1438 0.078 0.240 0.083 0.516 0.087 0.412AC2 0.127 0.372 0.142 0.249 0.135 0.304 0.134 0.586 0.127 0.469AC8 −0.005 0.353 0.017 0.204 0.007 0.262 −0.0002 0.518 −0.005 0.439AC14 0.072 0.375 0.090 0.231 0.078 0.292 0.074 0.580 0.072 0.472
0
5
10
15
20
25
AC1 AC7 AC13 AC2 AC8 AC14
Kurt
osis
Monitoring point
ku, Sep, 2007ku, Jan, 2008ku, Apr, 2008
ku, Jun, 2008ku, Jul, 2008
(a)
−0.3
−0.2
−0.1
0
0.1
0.2
0.3
0.4
Skew
ness
Monitoring point
sk, Sep, 2007sk, Jan, 2008sk, Apr, 2008
sk, Jun, 2008sk, Jul, 2008
AC1 AC7 AC13 AC2 AC8 AC14
(b)
Figure 4: Monitoring acceleration (a) kurtosis and (b) skewness for selection points.
that the amplitude of the midspan acceleration is lower thanside spans amplitude observation during damage state. How-ever, the suitable benchmark that can be used to detect thebehavior of the bridge is the midspan point. In addition, nextpart will include more discussion for the monitoring points.
3. Methodology Results and Discussions
3.1. Time Series Acceleration Analysis
3.1.1. Statistical Moments Analysis. The first four statisticalmoments (mean, standard deviation, skewness, and kurtosis)are used to define the probability density function motionchange and interface between two surfaces in motion begindamaged [20]. A brief review of the first four moments isshown in the following references [20, 21].
The statistical moments for the acceleration monitoringtime selection (Sept, 2007; Jan, Apr, Jun, and Jul, 2008) at time(11.00-12.00) for the upstream and downstream are shownin Table 1 and Figure 4. From this table, it can be seen thatthe mean and standard deviation for the monitoring pointswith selection time show little changes, while, the standarddeviation is changed with damage\effects. However, theaccelerationmeasurements standard deviation can be used todetect bridge behavior.
From Figure 4, it can be concluded that the relativechange of kurtosis between monitoring times for the mon-itoring points AC1, AC7, and AC13 is 2.5, 12.6, and 11.6%and that for points AC2, AC8, and AC14 is 17.2, 7.5, and36.8% between base and healthy state times, respectively. Inaddition, the change between healthy and damage states is62.7, 56.2, and 60.7% for the AC1, AC7, and AC13, whilefor points AC2, AC8, and AC14 it is 60.7, 52.9, and 64.6%,respectively. However, the two monitoring areas for points(1, 2) and (13, 14) are showing high relative change for thekurtosis.Moreover, the changes values of skewness are shownrandomly and the maximum changes can be seen at points 13and 14. However, from the statisticalmoment results, it can beconcluded that the standard deviation can refer to the damageeffect and kurtosis can be used to detect the damage andlocalization based on relative monitoring data with previousmonitoring time. In addition, it can be seen that the statisticalmoment method is easy in site or online damage detectionand localization.
3.1.2.Model Identification Analysis. The simple general regre-ssion neural network (GRNN) is used in this study. Thismethod is presented in [22]. Figure 5 shows the diagram ofidentification model damage detection. The monitoring time
6 Shock and Vibration
GRNN model identificationseries measuredAcceleration time
at sensor #
Target accelerationSep, 2007, time seriesmeasured at sensor 7
Model test
−
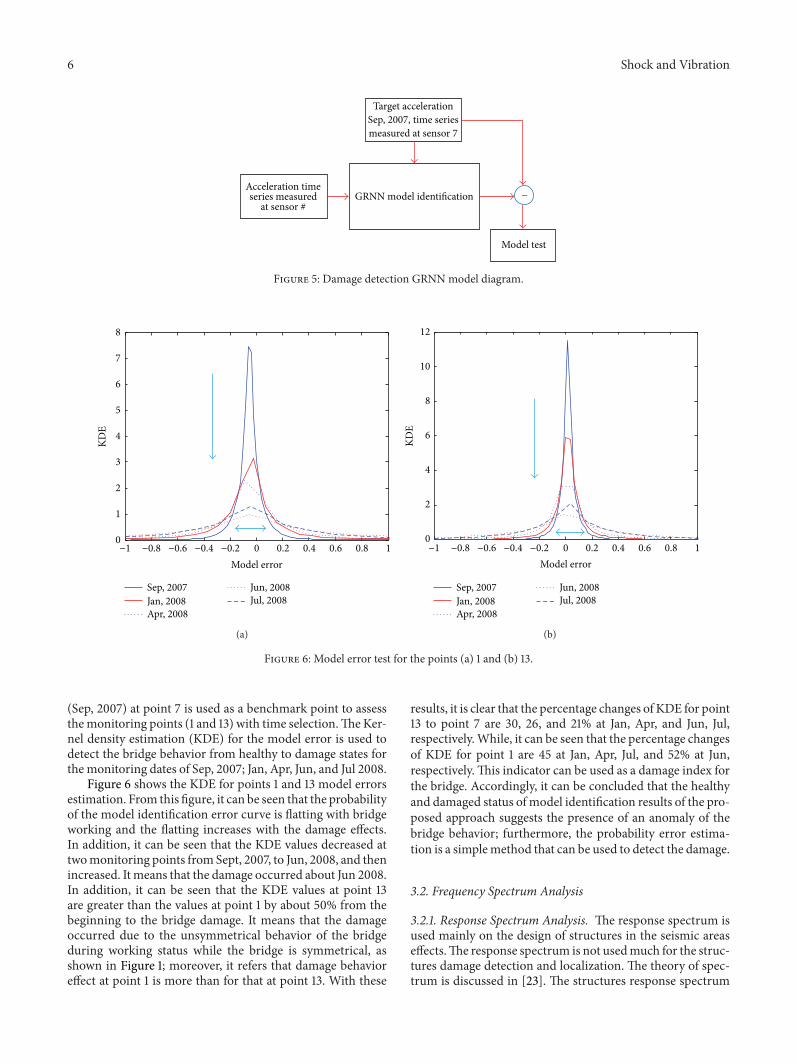
Figure 5: Damage detection GRNNmodel diagram.
−1 −0.8 −0.6 −0.4 −0.2 0 0.2 0.4 0.6 0.8 10
1
2
3
4
5
6
7
8
Model error
KDE
Sep, 2007Jan, 2008Apr, 2008
Jun, 2008Jul, 2008
(a)
−1 −0.8 −0.6 −0.4 −0.2 0 0.2 0.4 0.6 0.8 10
2
4
6
8
10
12
Model error
KDE
Sep, 2007Jan, 2008Apr, 2008
Jun, 2008Jul, 2008
(b)
Figure 6: Model error test for the points (a) 1 and (b) 13.
(Sep, 2007) at point 7 is used as a benchmark point to assessthemonitoring points (1 and 13) with time selection.TheKer-nel density estimation (KDE) for the model error is used todetect the bridge behavior from healthy to damage states forthemonitoring dates of Sep, 2007; Jan, Apr, Jun, and Jul 2008.
Figure 6 shows the KDE for points 1 and 13 model errorsestimation. From this figure, it can be seen that the probabilityof the model identification error curve is flatting with bridgeworking and the flatting increases with the damage effects.In addition, it can be seen that the KDE values decreased attwomonitoring points from Sept, 2007, to Jun, 2008, and thenincreased. It means that the damage occurred about Jun 2008.In addition, it can be seen that the KDE values at point 13are greater than the values at point 1 by about 50% from thebeginning to the bridge damage. It means that the damageoccurred due to the unsymmetrical behavior of the bridgeduring working status while the bridge is symmetrical, asshown in Figure 1; moreover, it refers that damage behavioreffect at point 1 is more than for that at point 13. With these
results, it is clear that the percentage changes of KDE for point13 to point 7 are 30, 26, and 21% at Jan, Apr, and Jun, Jul,respectively.While, it can be seen that the percentage changesof KDE for point 1 are 45 at Jan, Apr, Jul, and 52% at Jun,respectively.This indicator can be used as a damage index forthe bridge. Accordingly, it can be concluded that the healthyand damaged status of model identification results of the pro-posed approach suggests the presence of an anomaly of thebridge behavior; furthermore, the probability error estima-tion is a simplemethod that can be used to detect the damage.
3.2. Frequency Spectrum Analysis
3.2.1. Response Spectrum Analysis. The response spectrum isused mainly on the design of structures in the seismic areaseffects.The response spectrum is not usedmuch for the struc-tures damage detection and localization. The theory of spec-trum is discussed in [23]. The structures response spectrum
Shock and Vibration 7
0 0.5 1 1.5 2 2.5 3 3.5 4 4.5 50
0.5
1
1.5
2
2.5
3
3.5
4
Period (s)
AC7, Sep, 2007AC1, Sep, 2007
AC13, Sep, 2007AC1, Jan, 2008AC7, Jan, 2008
AC13, Jan 2008AC1, Jul, 2008AC7, Jul, 2008AC13, Jul, 2008
×10−3
Sa
(g)
(a) Acceleration spectrum
0 0.5 1 1.5 2 2.5 3 3.5 4 4.5 50
0.2
0.4
0.6
0.8
1
1.2
1.4
Period (s)
Sd
(g)
AC7, Sep, 2007AC1, Sep, 2007
AC13, Sep, 2007AC1, Jan, 2008AC7, Jan, 2008
AC13, Jan 2008AC1, Jul, 2008AC7, Jul, 2008AC13, Jul, 2008
(b) Displacement spectrum
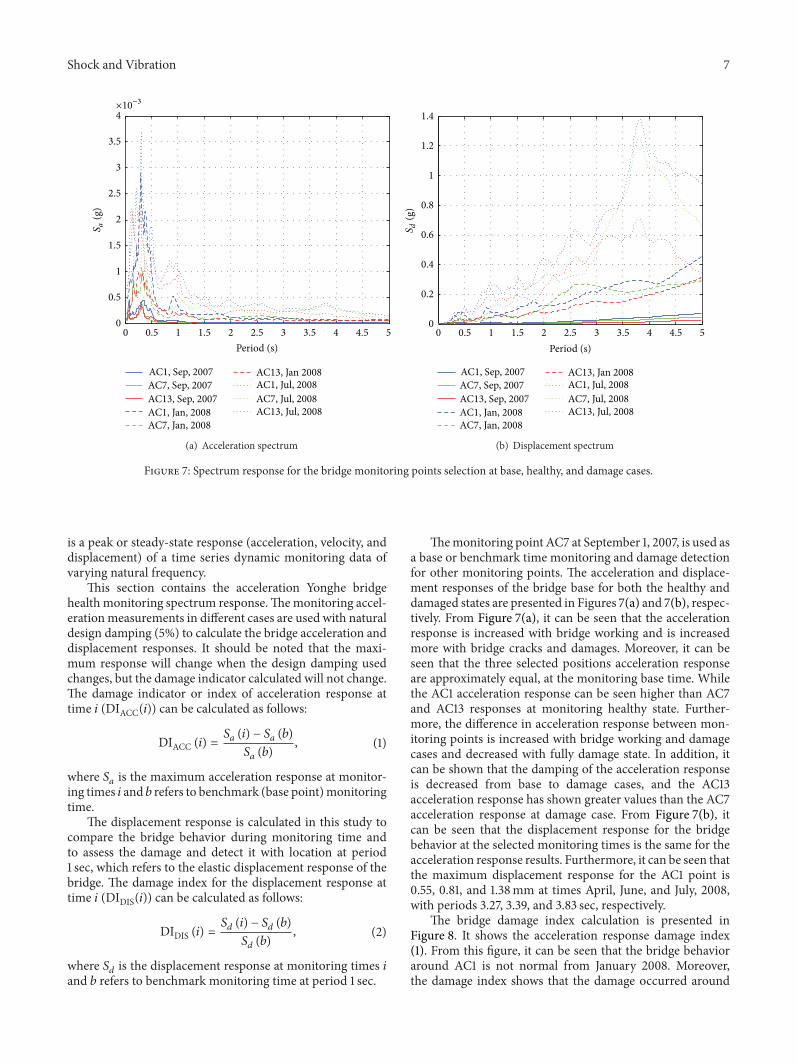
Figure 7: Spectrum response for the bridge monitoring points selection at base, healthy, and damage cases.
is a peak or steady-state response (acceleration, velocity, anddisplacement) of a time series dynamic monitoring data ofvarying natural frequency.
This section contains the acceleration Yonghe bridgehealth monitoring spectrum response.Themonitoring accel-erationmeasurements in different cases are used with naturaldesign damping (5%) to calculate the bridge acceleration anddisplacement responses. It should be noted that the maxi-mum response will change when the design damping usedchanges, but the damage indicator calculated will not change.The damage indicator or index of acceleration response attime 𝑖 (DIACC(𝑖)) can be calculated as follows:
DIACC (𝑖) =𝑆
𝑎(𝑖) − 𝑆
𝑎(𝑏)
𝑆
𝑎(𝑏)
, (1)
where 𝑆𝑎is the maximum acceleration response at monitor-
ing times 𝑖 and 𝑏 refers to benchmark (base point)monitoringtime.
The displacement response is calculated in this study tocompare the bridge behavior during monitoring time andto assess the damage and detect it with location at period1 sec, which refers to the elastic displacement response of thebridge. The damage index for the displacement response attime 𝑖 (DIDIS(𝑖)) can be calculated as follows:
DIDIS (𝑖) =𝑆
𝑑(𝑖) − 𝑆
𝑑(𝑏)
𝑆
𝑑(𝑏)
, (2)
where 𝑆𝑑is the displacement response at monitoring times 𝑖
and 𝑏 refers to benchmark monitoring time at period 1 sec.
Themonitoring point AC7 at September 1, 2007, is used asa base or benchmark time monitoring and damage detectionfor other monitoring points. The acceleration and displace-ment responses of the bridge base for both the healthy anddamaged states are presented in Figures 7(a) and 7(b), respec-tively. From Figure 7(a), it can be seen that the accelerationresponse is increased with bridge working and is increasedmore with bridge cracks and damages. Moreover, it can beseen that the three selected positions acceleration responseare approximately equal, at the monitoring base time. Whilethe AC1 acceleration response can be seen higher than AC7and AC13 responses at monitoring healthy state. Further-more, the difference in acceleration response between mon-itoring points is increased with bridge working and damagecases and decreased with fully damage state. In addition, itcan be shown that the damping of the acceleration responseis decreased from base to damage cases, and the AC13acceleration response has shown greater values than the AC7acceleration response at damage case. From Figure 7(b), itcan be seen that the displacement response for the bridgebehavior at the selected monitoring times is the same for theacceleration response results. Furthermore, it can be seen thatthe maximum displacement response for the AC1 point is0.55, 0.81, and 1.38mm at times April, June, and July, 2008,with periods 3.27, 3.39, and 3.83 sec, respectively.
The bridge damage index calculation is presented inFigure 8. It shows the acceleration response damage index(1). From this figure, it can be seen that the bridge behavioraround AC1 is not normal from January 2008. Moreover,the damage index shows that the damage occurred around

8 Shock and Vibration
0123456789
Sep, 2007 Jan, 2008 Apr, 2008 Jun, 2008 Jul, 2008
Dam
age i
ndex
Monitoring time
AC1AC7AC13
−1
(a) Acceleration response damage index
Sep, 2007 Jan, 2008 Apr, 2008 Jun, 2008 Jul, 2008
Dam
age i
ndex
Monitoring time−1.00E + 01
0.00E + 00
1.00E + 01
2.00E + 01
3.00E + 01
4.00E + 01
5.00E + 01
6.00E + 01
7.00E + 01
(b) Displacement response damage index
Figure 8: Damage index for the monitoring points at base, healthy, and damage cases.
the monitoring point AC1, which coincides with the visualinspection of the bridge state. In addition, it can be seenthat the damage index of both AC1 and AC13 is greaterthan the AC7 damage index; it means that the bridge deckcracks can be detected at points 1 and 13 during June 2008monitoring time. Furthermore, it can be shown that thedamage index is decreased at July, 2008, that occurred dueto fully damage effects. The displacement response damageindex (2) is shown in Figure 8(b). From this figure, it canbe concluded that the displacement response damage indexis more accurate than that calculated from accelerationresponse. Also, the displacement response damage indexrefers that the damage occurred around points 1 and 13 andthese results are confirmed from the visual inspection. Fromthese results, it can be concluded that the acceleration anddisplacement response can be used to detect the damage andlocalization based on selected benchmark time. In addition,the displacement response can be used to detect the bridgegirder cracks. Finally, the damage occurred around points 1and 13 and these results are concluded in [1, 2, 4].
3.2.2. Frequency Probability Analysis. The frequency domainchange is one of the methods that can be used to detectdamage and localization [5–7]. In this section, the probabilityand significant level power spectrum density calculation areused to detect the bridge damage and localization.The powerspectrum methods are introduced in [21]. The time seriesacceleration of SHM data are often evenly spaced; however,there is no problem to use the Lomb-Scargle algorithm inthis study to calculate the significant and probability of thefrequency of the monitored points.
The algorithm evaluates the actual acceleration timeseries data measured at monitoring time (𝑡). Assuming anacceleration time series measurements 𝑦(𝑡) of𝑁 data points,
the Lomb-Scargle normalized periodogram 𝑃𝑥as a function
of angular frequency 𝜔 = 2𝜋𝑓 > 0 is given by [21]
𝑃
𝑥(𝜔) =
1
2𝑆
2(
(∑
𝑗(𝑦
𝑗− 𝑦) cos𝜔(𝑡
𝑗− 𝜏))
2
∑
𝑗cos2𝜔 (𝑡
𝑗− 𝜏)
+
(∑
𝑗(𝑦
𝑗− 𝑦) sin𝜔(𝑡
𝑗− 𝜏))
2
∑
𝑗sin2𝜔 (𝑡
𝑗− 𝜏)
) ,
(3)
where 𝑦 and 𝑆2 are the arithmetic mean and the varianceof the acceleration measurement data. The constant 𝜏 is anoffset that makes 𝑃
𝑥(𝜔) independent of shifting the ti’s by any
constant amount. Scargle [24] showed that this particularchoice of the offset 𝜏 has the consequence that the solutionfor 𝑃𝑥(𝜔) is identical to least-squares fit of sine and cosine
functions to the data series 𝑦(𝑡). The least-squares fit ofharmonic functions to data series in conjunction with spec-tral analysis had previously been investigated by Lomb [25].Scargle [24] showed that the Lomb-Scargle periodogram hasan exponential probability distribution with unit mean. Theprobability that 𝑃
𝑥(𝜔)will be between some positive quantity
𝑧 and 𝑧 + 𝑑𝑧 is exp(−𝑧)𝑑𝑧. If we scan 𝑀 independentfrequencies, the probability of none of them having a largervalue than 𝑧 is (1 − exp(−𝑧))𝑀. We can therefore computethe false alarmprobability of the null hypothesis, for example,the probability that a given peak in the periodogram is notsignificant by
𝑃 (> 𝑍) ≡ 1 − (1 − 𝑒
−𝑍
)
𝑀
.
(4)
Press et al. [26] suggested using theNyquist criterion to deter-mine the number of independent frequencies 𝑀 assumingthat the data were evenly spaced. In this case, the appropriate

Shock and Vibration 9
0 1 2 3 4 5 6 7 8 9 100
20
40
60
80
100
120
Frequency
Pow
er
Sep, 2007Sig. level
Jan, 2008Jul, 2008
(a) Significant frequency
0 1 2 3 4 5 6 7 8 9 100
0.1
0.2
0.3
0.4
0.5
0.6
0.7
0.8
0.9
1
Frequency
Prob
abili
ty
Sep, 2007Jan, 2008Jul, 2008
(b) Probability frequency
Figure 9: Significant and probability frequency changes.
Table 2: Lomb-Scargle frequencies and power spectrum.
Monitoring time AC1 AC7 AC13Freq. (Hz) Max. PSD Freq. (Hz) Max. PSD Freq. (Hz) Max. PSD
Sep, 2007 4.2 35.14 3.16 39.35 4.2 39.65Jan, 2008 3.49 119.7 3.49 47.43 3.92 55.3Apr, 2008 4.19 117.3 3.1 84.07 4.18 88.27Jun, 2008 2.8 181.9 2.4 154.3 3.05 84.57Jul, 2008 3.3 110.3 3.09 101.4 3.29 40.25
value for the number of independent frequencies is𝑀 = 2𝑁,where𝑁 is the length of the time series. More detailed discu-ssions of the Lomb-Scargle method can be found in [24, 26].
Figure 9 shows the significant and probability of thebridge frequency calculation based on Lomb-Scargle methodfor point AC1. Figure 9(a) shows the power spectrum fre-quency distribution and 95% significant frequencies at mon-itoring times. From this figure, it can be seen that the bridgefirst frequency mode is significant at 1.09Hz and 0.29Hzwith the bridge working and damage times, respectively. Thefirst mode bridge frequency is decreased by 56% and 88%due to working and damage affects. Figure 9(b) shows theprobability frequencies of point AC1. From this figure, it canbe seen that the frequencies probability decreased also withmonitoring time. Table 2 presents the calculated maximumpower spectrum density (PSD) and the high PSD frequency.
From Table 2, it can be seen that the maximum powerspectrums and frequencies for the monitored points at thebeginning of the working of the bridge are highly correlated.But with working and healthy status, it shows that theincreased rate for AC1maximumPSD is higher thanAC7 andAC13. In addition, it can be seen that the PSD is increasedwith traffic loads effect and it can be noticed that the PSDs
for point AC1 are still different for the AC7 and AC13 pointsfrom the bridge working state, while, with bridge cracks anddamages, no correlation can be seen between the frequenciesand PSDs value. From the results, it can be concluded thatthis method can be used to detect the bridge damage andlocalization based on significant and probability frequenciesshift and different correlation PSD and frequencies betweenmonitoring points.
4. Conclusions
This study demonstrates that simple and effective damagedetection and localization algorithms based on a pattern clas-sification framework can detect structural changes using thedata that was collected from a real structure.The accelerationobservation of the Yonghe bridge healthmonitoring system isused in this study to represent four methods that can be usedto detect and localize the damage, which are the statisticalmoment, the model identification in time domain, the powerspectrum, and the response spectra in frequency domain.Theconclusions drawn from this study are as follows.
Theprestatistical acceleration time seriesmonitoring datashow that the amplitude of acceleration is seen smaller at

10 Shock and Vibration
base time selection and increases seriously to damage state.Moreover, the difference between upstream and downstreamacceleration amplitude is shown; itmeans that themovement,torsion, and damage occurred. In addition, the standard devi-ation can refer to the damage effect and kurtosis can detectand localize the damage based on relative monitoring datawith benchmark monitoring time. Moreover, this method iseasy in site or online damage detection and localization. Theindicator of Kernel density error changes can be used as adamage index for the bridge damage. Moreover, it can beconcluded that the health and damage status of model identi-fication results proposed approach suggests the presence of ananomaly in the bridge behavior and the probability error esti-mation is a simple method can be used to detect the damage.
The acceleration and displacement response spectra areused to detect and localize the damage based on benchmarktime selection. In addition, the displacement response candetect the cracks behavior for the bridge’s girder. Moreover,the simplified acceleration and displacement damage indica-tors are good tools to estimate and localize the damage. Theprobability Lomb-Scargle algorithm frequency time seriescan detect and localize the damage based on the shift ofsignificant frequencies and maximum PSD with differentcorrelations between monitoring points.
Conflict of Interests
The authors declare that there is no conflict of interestsregarding the publication of this paper.
Acknowledgments
This research was supported by Basic Science Research Pro-gram through the National Research Foundation of Korea(NRF) funded by the Ministry of Science, ICT, and FuturePlanning (Grant no. 2013R1A2A2A01068174).
References
[1] M. R. Kaloop and H. Li, “Multi input-single output modelsidentification of tower bridge movements using GPS monitor-ing system,”Measurement, vol. 47, no. 1, pp. 531–539, 2014.
[2] S. Li, H. Li, Y. Liu, C. Lan, W. Zhou, and J. Ou, “SMC structuralhealth monitoring benchmark problem using monitored datafrom an actual cable-stayed bridge,” Structural Control andHealth Monitoring, vol. 21, no. 2, pp. 156–172, 2014.
[3] H. Li, S. Li, and J. Ou, “Modal identification of bridges undervarying environmental conditions: temperature and windeffects,” Structural Control and Health Monitoring, vol. 17, no. 5,pp. 495–512, 2010.
[4] S. Arangio and F. Bontempi, “Structural health monitoring ofa cable-stayed bridge with Bayesian neural networks,” Structureand Infrastructure Engineering, vol. 11, no. 4, pp. 575–587, 2014.
[5] S. W. Doebling, C. R. Farrar, M. B. Prime, and D. W. Shevitz,“Damage identification and healthmonitoring of structural andmechanical systems from changes in their vibration character-istics: a literature review,” Tech. Rep. LA-13070-MS, 1996.
[6] D. Zonta, Structural damage detection and localization by usingvibrational measurements [Ph.D. thesis], Universitdeglistudi diBologna, Bologna, Italy, 2000.
[7] M. Kaloop, Structural health monitoring through dynamic andgeometric characteristics of bridges extracted from GPS measure-ments [Ph.D. thesis], Harbin Institute of Technology, Harbin,China, 2010.
[8] G. Gillich and Z. Praisach, “Damage-patterns-based methodto locate discontinuities in beams,” in Health Monitoring ofStructural and Biological Systems, vol. 8695 of Proceedings ofSPIE, San Diego, Calif, USA, April 2013.
[9] J. Li and J.-B. Chen, “The probability density evolution methodfor dynamic response analysis of non-linear stochastic struc-tures,” International Journal for Numerical Methods in Engineer-ing, vol. 65, no. 6, pp. 882–903, 2006.
[10] H. Sohn, C. R. Farrar, N. F. Hunter, and K. Worden, “Structuralhealth monitoring using statistical pattern recognition tech-niques,” Journal of Dynamic Systems, Measurement and Control,vol. 123, no. 4, pp. 706–711, 2001.
[11] C. W. Follen, M. Sanayei, B. R. Brenner, and R. M. Vogel,“Statistical bridge signatures,” Journal of Bridge Engineering, vol.19, no. 7, 2014.
[12] F. N. Catbas and A. E. Aktan, “Condition and damage assess-ment: issues and some promising indices,” Journal of StructuralEngineering, vol. 128, no. 8, pp. 1026–1036, 2002.
[13] M. R. Kaloop, “Bridge safety monitoring based-GPS technique:case study Zhujiang Huangpu Bridge,” Smart Structures andSystems, vol. 9, no. 6, pp. 473–487, 2012.
[14] M. Liu, D. M. Frangopol, and S. Kim, “Bridge system perfor-mance assessment from structural health monitoring: a casestudy,” Journal of Structural Engineering, vol. 135, no. 6, pp. 733–742, 2009.
[15] T. Schweckendiek, A. C. W. M. Vrouwenvelder, and E. O.F. Calle, “Updating piping reliability with field performanceobservations,” Structural Safety, vol. 47, pp. 13–23, 2014.
[16] D. Mazurek, “Evaluating damage detection in bridges,” inProceedings of the 9th Conference on Engineering Mechanics,College Station, Tex, USA, 1992.
[17] D. Settineri, “An effective method for the evaluation of thepdf response of dynamic systems subjected to non-stationaryloads,” Engineering Structures, vol. 84, pp. 419–429, 2015.
[18] J. J. Lee, J. W. Lee, J. H. Yi, C. B. Yun, and H. Y. Jung, “Neu-ral networks-based damage detection for bridges consideringerrors in baseline finite element models,” Journal of Sound andVibration, vol. 280, no. 3–5, pp. 555–578, 2005.
[19] H. Li, S. Li, and J. Ou, “Reliability assessment of cable-stayedbridges based on structural health monitoring techniques,”Structure and Infrastructure Engineering:Maintenance,Manage-ment, Life-Cycle Design and Performance, vol. 8, no. 9, pp. 829–845, 2012.
[20] H. R. Martin and F. Honarvar, “Application of statisticalmoments to bearing failure detection,” Applied Acoustics, vol.44, no. 1, pp. 67–77, 1995.
[21] H. Martin, MATLAB Recipes for Earth Sciences, 3rd edition,2010.
[22] E. W. M. Lee and H. F. Lam, “Intelligent-based structuraldamage detectionmodel,”Mechanics of AdvancedMaterials andStructures, vol. 18, no. 8, pp. 590–596, 2011.
[23] C. Rauscher, Fundamentals of Spectrum Analysis, Rohde &Schwarz, 5th edition, 2011.

Shock and Vibration 11
[24] J. D. Scargle, “Studies in astronomical time series analysis. II.Statistical aspects of spectral analysis of unevenly spaced data,”The Astrophysical Journal, vol. 263, p. 835, 1982.
[25] N. R. Lomb, “Least-squares frequency analysis of unequallyspaced data,” Astrophysics and Space Science, vol. 39, no. 2, pp.447–462, 1976.
[26] W. Press, S. Teukolsky, W. Vetterling, and B. Flannery, Numeri-cal Recipes: The Art of Scientific Computing, Cambridge Univer-sity Press, Cambridge, UK, 3rd edition, 2007.

International Journal of
AerospaceEngineeringHindawi Publishing Corporationhttp://www.hindawi.com Volume 2014
RoboticsJournal of
Hindawi Publishing Corporationhttp://www.hindawi.com Volume 2014
Hindawi Publishing Corporationhttp://www.hindawi.com Volume 2014
Active and Passive Electronic Components
Control Scienceand Engineering
Journal of
Hindawi Publishing Corporationhttp://www.hindawi.com Volume 2014
International Journal of
RotatingMachinery
Hindawi Publishing Corporationhttp://www.hindawi.com Volume 2014
Hindawi Publishing Corporation http://www.hindawi.com
Journal ofEngineeringVolume 2014
Submit your manuscripts athttp://www.hindawi.com
VLSI Design
Hindawi Publishing Corporationhttp://www.hindawi.com Volume 2014
Hindawi Publishing Corporationhttp://www.hindawi.com Volume 2014
Shock and Vibration
Hindawi Publishing Corporationhttp://www.hindawi.com Volume 2014
Civil EngineeringAdvances in
Acoustics and VibrationAdvances in
Hindawi Publishing Corporationhttp://www.hindawi.com Volume 2014
Hindawi Publishing Corporationhttp://www.hindawi.com Volume 2014
Electrical and Computer Engineering
Journal of
Advances inOptoElectronics
Hindawi Publishing Corporation http://www.hindawi.com
Volume 2014
The Scientific World JournalHindawi Publishing Corporation http://www.hindawi.com Volume 2014
SensorsJournal of
Hindawi Publishing Corporationhttp://www.hindawi.com Volume 2014
Modelling & Simulation in EngineeringHindawi Publishing Corporation http://www.hindawi.com Volume 2014
Hindawi Publishing Corporationhttp://www.hindawi.com Volume 2014
Chemical EngineeringInternational Journal of Antennas and
Propagation
International Journal of
Hindawi Publishing Corporationhttp://www.hindawi.com Volume 2014
Hindawi Publishing Corporationhttp://www.hindawi.com Volume 2014
Navigation and Observation
International Journal of
Hindawi Publishing Corporationhttp://www.hindawi.com Volume 2014
DistributedSensor Networks
International Journal of


![[TECH]Cable Stayed Bridges](https://img.dokumen.tips/doc/110x75/544cd985b1af9f3a0b8b4c5b/techcable-stayed-bridges.jpg)