Embed Size (px)
Citation preview

Research ArticleStatistical Characteristics of Measured 3-DimensionalMIMO Channel for Outdoor-to-Indoor Scenario in China andNew Zealand
Yawei Yu1 Jianhua Zhang1 Mansoor Shafi2 Min Zhang3 and Jawad Mirza4
1Beijing University of Posts and Telecommunications Beijing 100876 China2Spark New Zealand Wellington 6011 New Zealand3Alcatel-Lucent Swindon SN5 7DJ UK4Victoria University of Wellington Wellington 6012 New Zealand
Correspondence should be addressed to Yawei Yu yywbupteducn
Received 8 October 2015 Revised 15 January 2016 Accepted 8 February 2016
Academic Editor Enrico Del Re
Copyright copy 2016 Yawei Yu et alThis is an open access article distributed under the Creative Commons Attribution License whichpermits unrestricted use distribution and reproduction in any medium provided the original work is properly cited
The 3-dimensional (3D) channel model gives a better understanding of statistical characteristics for practical channels than the2-dimensional (2D) channel model by taking the elevation domain into consideration As different organizations and researchershave agreed to a standard 3D channel model we attempt to measure the 3D channel and determine the parameters of the standardmodel In this paper we present the statistical propagation results of the 3D multiple-input and multiple-output (MIMO) channelmeasurement campaign performed in China and New Zealand (NZ) The measurements are done for an outdoor-to-indoor (O2I)urban scenario The dense indoor terminals at different floors in a building form a typical 3D propagation environment Thekey parameters of the channel are estimated from the measured channel impulse response (CIR) using the spatial-alternatinggeneralized expectation-maximization (SAGE) algorithm Till now there is abundant research performed on the azimuth domainthis paper mainly considers the statistical characteristics of the elevation domain A statistical analysis of 3D MIMO channelresults for both China and NZ measurements is presented for the following parameters power delay profile (PDP) root meansquare (rms) delay spread (DS) elevation angle-of-arrival (EAoA) distribution elevation angle-of-departure (EAoD) distributionelevation angular spread (AS) and cross-polarization discrimination (XPD)
1 Introduction
Themobile traffic is experiencing an explosive growth due tothe flourishing spread of mobile internet and smart phonesIt is predicted that the mobile traffic will grow more than1000 times in the next few years [1] To fulfill this increasingcapacity demand there have been a lot of research activitiesunder the umbrella of 5G mobile communication system[2] Among all of these activities one important topic is the3-dimensional (3D) channel model which in addition tothe azimuth domain also takes the elevation domain intoconsideration thus providing additional degrees of freedomto meet the high capacity demand [3]
Conventional multiple-input and multiple-output (MIMO)technology only utilizes the horizontal plane of the spatial
domain in the spatial signal processing Usually a linearantenna array with vertical polarization or cross-polarizationis deployed in the horizontal plane at both ends of the com-munication link while a fixed downtilting angle is configuredat the antenna array of the base station (BS) Although thesignal propagates through a 3D space the fading channel isstill modeled as 2-dimensional (2D) channel models Withthe advent of the adaptive antenna array the realization of 3DMIMO is more practical Thus an extensive interest has beenmotivated to exploit the elevation domain in 3D MIMOsystem [4]
An early research on the elevation angle can be tracedback to 1979 by Aulin who extended Clarkrsquos scattering modelto 3D space for the first time [5] Since then a growing num-ber of researchers observed and reported the significance of
Hindawi Publishing CorporationChinese Journal of EngineeringVolume 2016 Article ID 1317489 10 pageshttpdxdoiorg10115520161317489
2 Chinese Journal of Engineering
elevation angles in describing the radio signal propagationmore precisely The impact of elevation angle on MIMOcapacity was presented in [6] and vertical sectorization wasdescribed in [7] Simulation results show that 3D MIMOsystem with 32 antenna ports achieves 2sim36 times cellaverage throughput gain compared to the 4G LTE systemof two antenna ports at the BS [8] Further practical fieldmeasurements have validated the superiority of 3D MIMOchannel by harvesting a 27 sim42 capacity gain in UMiscenario [9] which highlights the importance of elevationdomain 3D characteristics including the elevation distribu-tion mean elevation angle (MEA) and elevation angle spread(EAS) are analyzed based on field channel measurements in[10ndash14] The Third Generation Partner Project (3GPP) hasinitiated the discussion on the general 3D channel fadingmodel [15 16] since January 2013 and released the 3DMIMOchannel model [17] in April 2014 World Wireless InitiativeNew Radio + (WINNER+) has also reported 3D channelmeasurements [18] as an extension of the 2D geometry basedstochasticmodel (GBSM)A good survey of 3D channelmod-els is given in [19] Six proposals to the 3GPP based on ourmeasurements and analysis are presented in [20ndash25] Reliableand realistic channel models based on the empirical prop-agation characteristics are critical to fundamental researchand evaluation of the 3D MIMO technique However theunderstanding of 3D MIMO channel is still in its infancyhow to characterize 3D propagation channels especiallythe elevation angle is therefore an important task for 3DMIMO development yet practical measurements of the 3Dfading channel are scarce As the standard organizations andchannel modeling researchers have agreed to a standard 3Dchannel model it is our attempt to measure the channel anddetermine its parameters according to the standard modelthen model researchers can generate the wireless channelimpulse response (CIR) for system simulation studies
In this paper we present efforts to the study of the statis-tical characteristics of the 3D MIMO channel for outdoor-to-indoor (O2I) scenario Using the same measurementequipmentmeasurements are repeated for two locationswithvery diverse surroundings inChina andNZ respectivelyThishelps to compare the similarities and differences between theresults We report on measurements of a 3D MIMO CIR andgive results for the following channel parameters
(i) power delay profile (PDP)
(ii) distribution of the delay spread (DS)
(iii) distributions of elevation angle-of-arrival (EAoA)and elevation angle-of-departure (EAoD)
(iv) distribution of the angle spread (AS) in the elevationdomain
(v) cross-polarization discrimination (XPD)
In Section 2 detailed descriptions for the measurementscenario and data postprocessing will be presented followedby measurement results of key parameters for the 3D MIMOchannel in Section 3 and conclusions in Section 4
2 Measurement Description
21 Measurement Equipment and Scenario Description Mea-surements are done by using the Elektrobit PropsoundSounder described in [26] It consists of three units trans-mitter (Tx) sounder receiver (Rx) sounder and Rx BasebandProcessing Unit (RBPU) through which signals can be trans-mitted received and stored in a time division way respec-tively
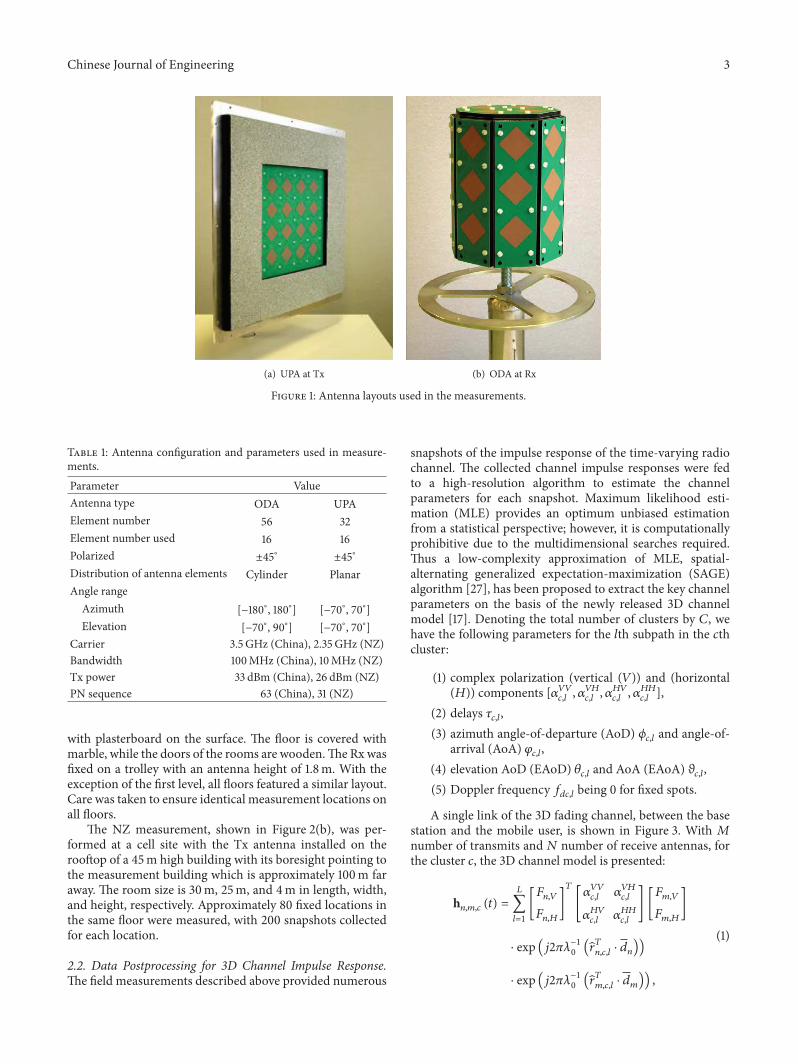
To capture the propagation rays in the 3D environmentefficiently fully dimensional antenna arrays were equipped atboth sides of themeasurement linkThe layout of the antennaarrays at Tx andRx side are illustrated in Figures 1(a) and 1(b)respectively At the Rx dual-polarized omnidirectional array(ODA) consisting of 56 antenna elements with 8 adjacentsides and a top surface was used while a dual-polarizeduniform planar array (UPA) with 32 antenna elements wasutilized as a sector transmit antenna array All array elementsconsisted of microstrip patches with 6 dB beamwidth ofapproximately 110∘ in both the vertical and horizontal planesAll antennas were calibrated in an anechoic chamber Thegain of each antenna element is 6 dBi with an angle resolutionof 2∘This is limited by the sensorsrsquo distribution density in theanechoic chamber for antenna calibration Powers receivedby the densely distributed sensors indicate the antenna powergain in the corresponding direction of the sensors both inazimuth and in elevation domain Angle information forpaths can be extracted by substituting all possible anglevalues inside the antenna calibration file iteratively until thereconstructed signal best fits the actual received one [27]The practical received signal will be deeply affected by theequipmentrsquos performance as it is the convolutional result ofthe measurement equipment impulse response (EIR) andCIR To eliminate the potential influences of equipmentperformance the equipment will be also calibrated with theTx and Rx being connected directly through an ideal RFcable for the EIR file By removing the EIR from the practicalreceived signal the CIR can be extracted Table 1 specifiesthe configuration and angle range of the antenna arraysalong with other measurement parameters The angle rangescapture most of the propagation paths at both ends of thelink where paths with a delay interval larger than the delayresolution can be distinguished
Utilizing both the horizontal and vertical dimensions 3DMIMO is particularly suitable for scenarios with vertical userlocation distributions Transmissions from outdoor BSs tousers located at different floors can be well separated in theirelevation angles
We carried out the field measurements for 3D CIR inBeijing China and Auckland New Zealand for the O2I sce-nario In China measurement the receive antenna array waspositioned at 5 different floors of a 60m high building whilethe transmit antenna was fixed at the top of a nearby 115mhigh building at a distance of 215mThis typical O2I scenariois shown in Figure 2(a) On each floor approximately 20different fixed locations were measured including ones nearthe window (the red star) or along the corridor with 500snapshots collected by the sounder for each location Wallsalong the corridor and between the rooms are made of brick
Chinese Journal of Engineering 3
(a) UPA at Tx (b) ODA at Rx
Figure 1 Antenna layouts used in the measurements
Table 1 Antenna configuration and parameters used in measure-mentsParameter ValueAntenna type ODA UPAElement number 56 32Element number used 16 16Polarized
plusmn45∘ plusmn45∘
Distribution of antenna elements Cylinder PlanarAngle range
Azimuth [minus180∘ 180∘] [minus70∘ 70∘]Elevation [minus70∘ 90∘] [minus70∘ 70∘]
Carrier 35 GHz (China) 235GHz (NZ)Bandwidth 100MHz (China) 10MHz (NZ)Tx power 33 dBm (China) 26 dBm (NZ)PN sequence 63 (China) 31 (NZ)
with plasterboard on the surface The floor is covered withmarble while the doors of the rooms are woodenThe Rx wasfixed on a trolley with an antenna height of 18m With theexception of the first level all floors featured a similar layoutCare was taken to ensure identical measurement locations onall floors
The NZ measurement shown in Figure 2(b) was per-formed at a cell site with the Tx antenna installed on therooftop of a 45m high building with its boresight pointing tothe measurement building which is approximately 100m faraway The room size is 30m 25m and 4m in length widthand height respectively Approximately 80 fixed locations inthe same floor were measured with 200 snapshots collectedfor each location
22 Data Postprocessing for 3D Channel Impulse ResponseThe field measurements described above provided numerous
snapshots of the impulse response of the time-varying radiochannel The collected channel impulse responses were fedto a high-resolution algorithm to estimate the channelparameters for each snapshot Maximum likelihood esti-mation (MLE) provides an optimum unbiased estimationfrom a statistical perspective however it is computationallyprohibitive due to the multidimensional searches requiredThus a low-complexity approximation of MLE spatial-alternating generalized expectation-maximization (SAGE)algorithm [27] has been proposed to extract the key channelparameters on the basis of the newly released 3D channelmodel [17] Denoting the total number of clusters by 119862 wehave the following parameters for the 119897th subpath in the 119888thcluster
(1) complex polarization (vertical (119881)) and (horizontal(119867)) components [120572119881119881
119888119897
120572
119881119867
119888119897
120572
119867119881
119888119897
120572
119867119867
119888119897
](2) delays 120591
119888119897
(3) azimuth angle-of-departure (AoD) 120601119888119897and angle-of-
arrival (AoA) 120593119888119897
(4) elevation AoD (EAoD) 120579119888119897and AoA (EAoA) 120599
119888119897
(5) Doppler frequency 119891
119889119888119897being 0 for fixed spots
A single link of the 3D fading channel between the basestation and the mobile user is shown in Figure 3 With 119872
number of transmits and 119873 number of receive antennas forthe cluster 119888 the 3D channel model is presented
h119899119898119888
(119905) =
119871
sum
119897=1
[
119865
119899119881
119865
119899119867
]
119879
[
120572
119881119881
119888119897
120572
119881119867
119888119897
120572
119867119881
119888119897
120572
119867119867
119888119897
][
119865
119898119881
119865
119898119867
]
sdot exp (1198952120587120582
minus1
0
(
119879
119899119888119897
sdot 119889
119899))
sdot exp (1198952120587120582
minus1
0
(
119879
119898119888119897
sdot 119889
119898))
(1)
4 Chinese Journal of Engineering
Tx
Where Rx array is located
Where Tx array is located
215m
(a) Measurement in China
Measurement pointBoresight of Rx
Boresight of Tx
(b) Measurement in NZ
Figure 2 A view of measurement areas in China (a) and NZ (b)
Mobile userBase station
z
z
x
x
y
rarr
120593cl
120599cl
120591cl
Cluster 1
Cluster c
y
120579cl
120601cl
Figure 3 Generic 3D fading channel model
Chinese Journal of Engineering 5
PDP ChinaExp fading
PDP NZExp fading
minus30
minus25
minus20
minus15
minus10
minus5
0
Nor
mal
ized
pow
er (d
B)
minus25
minus20
minus15
minus10
minus5
0
Nor
mal
ized
pow
er (d
B)
100 200 300 400 5000Excess delay (ns)
500 1000 1500 20000Excess delay (ns)
(a) Average PDP of measurements in China and NZ
200 300 400 500 600100Delay spread (ns)
0
02
04
06
08
1
CDF
Delay spread China Delay spread NZlog sim N (255 030)log sim N (194 014)
(b) RMS delay spread in China and NZ
Figure 4 PDP and delay spread in China and NZ
where 119871 is the total number of subpaths 1205820is the wavelength
of the carrier frequency 119899 = 1 sdot sdot sdot 119873 and 119898 = 1 sdot sdot sdot119872 119889119898
and 119889
119899are the 3D location vectors for Tx and Rx antennas
respectively 119898119888119897
and
119899119888119897denote the spherical unit vectors
at transmitter and receiver elements respectively For the 119897thsubpath in the 119888th cluster
119898119888119897is calculated by
119898119888119897=
[
[
[
[
sin (120579
119888119897) cos (120601
119888119897)
sin (120579
119888119897) sin (120601
119888119897)
cos (120579119888119897)
]
]
]
]
(2)
A similar expression is used to obtain spherical unitvector
119899119888119897for Rx by substituting angles 120599
119888119897and 120593
119888119897into (2)
Besides 119865119898119881
and 119865
119898119867are transmit antenna field patterns
for the vertical and horizontal polarizations respectivelyMeanwhile 119865
119899119881and 119865
119899119867are antenna field patterns for the
vertical and horizontal polarizations on the Rx side
3 Results of Measurements
The distribution results along with the 3GPP reference valueare summarized in Table 2 the previous extracted parame-ters both for China and for NZ measurements are fed backto a further statistical characteristic analysis including delayspread angle distribution and XPD
31 Power Delay Profile and Delay Spread Power delayprofiles (PDP) for both China and NZ measurements arepresented for an intuitive glance over multipaths dynamicpower range and power fadingwith delays and so forthWitha bandwidth of being 100MHz for China and 10MHz forNZ measurement the delay resolution is 10 ns and 100 nsrespectively Based on the CIR exactly the averaged PDPover all snapshots is shown in Figure 4(a) The peak valueof the PDP has been normalized to 0 dB As a result of
Table 2 MIMO channel model parameters
Parameters China NZ 3GPP [17]RMS delay 120591 spread log
10
(s)120583
minus706 minus645 minus662120590
014 030 032Elevation AoD 120579 spread log
10
(degrees)120583
128 113 mdash120590
022 028 mdashElevation AoA 120599 spread log
10
(degrees)120583
139 156 101120590
031 024 043Azimuth AoD 120601 spread log
10
(degrees)120583
109 125 125120590
014 016 042Azimuth AoA 120593 spread log
10
(degrees)120583
176 192 176120590
010 011 016Cross-polarization discrimination (XPD)
XPD = 10log10
(
1003816
1003816
1003816
1003816
1003816
1003816
1003816
1003816
1003816
1003816
1003816
120572
119881119881
+ 120572
119867119867
120572
119867119881
+ 120572
119881119867
1003816
1003816
1003816
1003816
1003816
1003816
1003816
1003816
1003816
1003816
1003816
2
)(dB)
12058345 52 9
12059064 91 11
Delay distribution EXPAzimuth AoA and AoD distribution GaussianElevation AoA and AoD distribution Laplacian
the complicated practical scattering environment there existthree peaks both for China and for NZ measurements thenthe PDP comes to a flat fading gradually The noise floorwhich may result from the system thermal noise and channel
6 Chinese Journal of Engineering
NLoS pathsLoS path
minus05minus15 1505minus1 0 1
EAoA (rad)
minus15
minus1
minus05
0
05
1
15
EAoD
(rad
)
(a) EAoA versus EAoD at Floor 1
LoS path
NLoS paths
minus05minus15 1505minus1 0 1
EAoA (rad)
minus15
minus1
minus05
0
05
1
15
EAoD
(rad
)
(b) EAoA vversus EAoD at Floor 3
minus4minus2
02
4
minus2minus1
01
Azimuth AOA (rad)Azimuth AOD (rad)
Exce
ss d
elay
(120583s)
0
05
1
15
(c) 2D clustering example
Azimuth AOA (rad)Azimuth AOD (rad)
minus4minus2
02
4
minus2minus1
01
Exce
ss d
elay
(120583s)
0
05
1
15
(d) 3D clustering example
Figure 5 EAoA and EAoD dispersion and 2D versus 3D clustering for the snapshot near the window (red star) in China measurement
background noise is calculated as the mean power of therelatively flat fading part of the PDP curve The dynamicrange between the peak power and bottom noise is 25 dB forChina measurement and 20 dB for NZ measurement whichis 5 dB smaller because of a longer propagation distance thusthe peak value experienced a deeper fading Power of MPCsafter the reference delay of the strongest power decays rapidlyin an exponential formation which is the same with theconventional 2D PDP fading distribution [28] thus signalpropagation in 3D environment has no obvious impact on thePDP
For each snapshot we also calculate the delay spread andpresent the cumulative distribution function (CDF) of all rmsDS in Figure 4(b) for both China and NZ measurementsThere is an obvious lognormal distribution with relatedmean values and standard deviations presented in Table 2Compared to China measurement the DS in NZ is muchlarger because the room size of Rx is much larger in NZmeasurement with all spots fixed in a wild area in the samefloor
32 EAoA and EAoD Dispersion and Clustering The EAoAand EAoD dispersion at different floors are presented forChinameasurement Taking the 1st and 3rd floor for examplethe dispersions of EAoA-EAoD for the snapshot near thewindow (red star in Figure 2(a)) are shown inFigures 5(a) and
Table 3 Cluster number increase from 2D to 3D
Floor 1st 2nd 3rd 5th 7thCluNum 2D 102 84 93 95 122CluNum 3D 152 125 134 154 174
5(b) respectively Points in the same color are divided into thesame cluster while the size represents the path powerThere isa briefmarker of the LoS path which comes throughwindowsdirectly while the NLoS path might be reflected by concretewalls Given a height of 14m at Txwhich is slightly lower thanRx at the 3rd floor the EAoD of the LoS path being slightlybigger than 0 degree can be expected as shown in Figure 5(b)
Asmultipath components (MPCs) are dispersive for both1st and 3rd floor in the 3D environment an interesting ques-tion arises whether the cluster number will change comparedto that in 2D channel To identify clusters [29] for the samesnapshot near the window for the 3rd floor a comparativeresult of the estimated MPCs for China measurements ispresented in Figures 5(c) and 5(d) Cluster number increasesfrom 7 to 9 the main cluster in blue for 2D case divides into2 subclusters for 3D case An averaged cluster number for allsnapshots on each floor is also presented inTable 3 the clusterincrease from 2D to 3D indicates that a more specific channelpropagation characteristic can be observed in a 3D vision
Chinese Journal of Engineering 7
minus20 minus10 0 10 20 30minus30
EAoD (deg)
0
01
02
03
0
01
02
minus20 minus10 0 10 20 30minus30
EAoA (deg)
EAoD ChinaLaplacian (120583 = 0 b = 15)
EAoA China Laplacian (120583 = 0 b = 16)
(a) EAoD and EAoA distribution in China measurement
minus20 minus10minus30 10 20 300EAoA (deg)
EAoD NZLaplacian (120583 = 3 b = 21)
EAoA NZLaplacian (120583 = 0 b = 56)
0
002
004
006
008
0
005
01
015
02
minus10 200 10 30minus30 minus20
EAoD (deg)
(b) EAoD and EAoA distribution in NZ measurement
ESD China
ESA China
ESD NZ
ESA NZ
0
02
04
06
08
1
CDF
20 30 40 5010Angle spread (deg)
log sim N (156 024)
log sim N (113 028)
log sim N (139 031)
log sim N (128 022)
(c) EASD and EASA CDFs in NZ
Figure 6 EAoA and EAoD distributions and angular spread
33 EAoA and EAoD Distributions and Angular Spread Thedistribution of EAoD and EAoA for China and NZ measure-ments is shown in Figures 6(a) and 6(b) respectively Withthe EAoD and EAoA of the strongest path both being shiftedto zero degrees for all measured spots figures show that
the angle in China measurement exhibits a well Laplacian fitas presented by
119891 (119909) =
1
radic2120590
exp(minus
radic2
120590
1003816
1003816
1003816
1003816
119909 minus 120583
1003816
1003816
1003816
1003816
) (3)
8 Chinese Journal of Engineering
XPD China
0
001
002
003
004
005
006
007
20100 30 40minus20 minus10minus30
XPD in China (dB)
10 log sim N (45 64)
(a) PDF of XPD in China
XPD NZ
0
001
002
003
004
005
200 40 60minus20minus40
XPD in NZ (dB)
10 log sim N (52 91)
(b) PDF of XPD in NZ
Figure 7 XPD measurements for China and NZ
where120583 and120590
2 are themean value and variance of the Laplacedistribution respectively However this is not the case for NZresult A possible reason for this is the lack of sample datafor only one floor measurement In addition to the elevationpower spectrummentioned above rms angle spread providesanother perspective for a further understanding of 3DMIMOchannel For each snapshot the angular spread in the ele-vation domain can be calculated Taking all the subpaths inthe 119888th cluster for example the angular spread of EAoD isgiven by
120590AS =
radic
sum
119871
119897=1
(120579
119888119897minus [sum
119871
119897=1
120579
119888119897119875
119888119897sum
119871
119897=1
119875
119888119897])
2
119875
119888119897
sum
119871
119897=1
119875
119888119897
(4)
where the power of the 119897th subpath in the 119888th cluster can becalculated as the sum of squares of the polarization coeffi-cients given by
119875
119888119897=
1003816
1003816
1003816
1003816
1003816
120572
119881119881
119888119897
1003816
1003816
1003816
1003816
1003816
2
+
1003816
1003816
1003816
1003816
1003816
120572
119881119867
119888119897
1003816
1003816
1003816
1003816
1003816
2
+
1003816
1003816
1003816
1003816
1003816
120572
119867119881
119888119897
1003816
1003816
1003816
1003816
1003816
2
+
1003816
1003816
1003816
1003816
1003816
120572
119867119867
119888119897
1003816
1003816
1003816
1003816
1003816
2
(5)
The CDF of elevation angular spread for AoD (EASD)and AoA (EASA) is shown in Figure 6(c) for both Chinaand NZ measurements Similar to 3GPP [17] a lognormaldistribution fits well with this angular spread with the meanand standard deviation presented in Table 2 As we can seeEASD is smaller than EASA due to an additional channelpropagation and scattering for transmitted signals Besidesthe AS of elevation angles are correspondingly smaller thanthat of azimuth angles both for departure and for arrivalsides It is reasonable that vertical scatters are not so richcompared to the azimuth plane What is more the ESA inNZ is larger than that of China while the ESD is smaller thiscan be explained by a much larger room size with complexscatters on theRx side inNZmeasurementMeanwhile onTx
Table 4 Angular spread for different floors in China measurement
Floor EASD (∘) EASA (∘) AASD (∘) AASA (∘)1st 208 274 204 4552nd 206 209 125 4223rd 195 223 193 4335th 208 221 180 4097th 260 283 179 431
side so long the propagation distance is that only paths in aspecific EoDcanbe received inNZmeasurement which leadsto a concentrated ESD A more specific angular spread fordifferent floors inChinameasurement is presented in Table 4
34 XPD Distribution As XPD is being defined in Table 2its distribution is shown in Figure 7 for both China and NZmeasurements Similar to 3GPP a normal distribution fitsXPD well for all fixed spots In NZ result the range of XPDis wider than that of China as the room size on Rx side in NZis much larger which will result in a more complex depo-larization in 3D propagation As XPD is closely related tothe environment the mean value of XPD for different floorsvaries in China measurement being 33 51 53 38 and 31for the 1st 2nd 3rd 5th and 7th floor respectively To benoted the Tx is as much high as Rx on the 3rd floor a higherdistance in elevation domain will contribute to a bettervertical depolarization
4 Conclusion
In this paper we studied the statistical characteristics of3D channel impulse response and presented comparativeresults for measurements performed in China and NZ Wehave focused our study on the elevation domain as these
Chinese Journal of Engineering 9
measurements are rare Simulation results show that the PDPin 3D propagation fades exponentially both in China andin NZ measurements The cluster can be further resolvedwhen the elevation domain is taken into consideration Alognormal distribution fits well with the AS while the ESAin NZ is larger than that of China due to a larger scatteringroom size in NZ measurement Because of a more disperseddistribution of measured locations in the elevation domainthe XPD in China is smaller than that of NZ and the XPDvaries with the height difference between Tx and Rx andso forth All these results of the elevation domain providea better understanding of 3D channel and contribute to3D MIMO system design including 3D antenna arrays forfuture 5G where the elevation domain cannot be ignoredTherefore these measurements are a precursor to 5G systemscapability studies
Conflict of Interests
The authors declare that there is no conflict of interestsregarding the publication of this paper
Acknowledgments
The China measurements are supported in part by the 863Program of China under Grant no 2015AA01A703 and byNational Science and Technology Major Project of the Min-istry of Science and Technology (project name is ldquoIMT-2002Candidate Band Analysis and Evaluationrdquo) with 2015ZX-03002008 and by National Science and Technology MajorProject of the Ministry of Science and Technology (projectname is ldquoWireless mobile spectrum research and verificationforWRC15rdquo) with 2014ZX03003013-004 and by National Sci-ence andTechnologyMajor Project of theMinistry of ScienceandTechnology (project name is ldquoResearch andDevelopmentof MIMO Channel Emulatorrdquo) with 2013ZX03001020-002and by Huawei Company for Massive MIMO study
References
[1] Cisco ldquoCisco visual networking index globalmobile data trafficforecast update 2013ndash2018rdquo Cisco White Paper Cisco 2014
[2] J G Andrews S Buzzi W Choi et al ldquoWhat will 5G berdquo IEEEJournal on Selected Areas in Communications vol 32 no 6 pp1065ndash1082 2014
[3] X Cheng B Yu L Yang et al ldquoCommunicating in the realworld 3D MIMOrdquo IEEE Wireless Communications vol 21 no4 pp 136ndash144 2014
[4] M Shafi M Zhang A L Moustakas et al ldquoPolarized MIMOchannels in 3-D models measurements and mutual informa-tionrdquo IEEE Journal on Selected Areas in Communications vol24 no 3 pp 514ndash526 2006
[5] T Aulin ldquoA modified model for the fading signal at a mobileradio channelrdquo IEEE Transactions on Vehicular Technology vol28 no 3 pp 182ndash203 1979
[6] M Shafi M Zhang P J Smith A L Moustakas and A FMolisch ldquoThe impact of elevation angle on MIMO capacityrdquo inProceedings of the IEEE International Conference on Communi-cations (ICC rsquo06) pp 4155ndash4160 Istanbul Turkey July 2006
[7] O N C Yilmaz S Hamalainen and J Hamalainen ldquoSystemlevel analysis of vertical sectorization for 3GPP LTErdquo in Pro-ceedings of the 6th International Symposium on Wireless Com-munication Systems (ISWCS rsquo09) pp 453ndash457 IEEE TuscanyItaly September 2009
[8] Y-H Nam B L Ng K Sayana et al ldquoFull-dimension MIMO(FD-MIMO) for next generation cellular technologyrdquo IEEECommunications Magazine vol 51 no 6 pp 172ndash179 2013
[9] C Pan and J Zhang ldquoExperimental investigation of elevationangles and impacts on channel capacity in urban microcellrdquoin Proceedings of the International Conference on ComputingNetworking and Communications (ICNC rsquo15) pp 11ndash15 IEEEGarden Grove Calif USA Feburary 2015
[10] K Kalliola H Laitinen L I Vaskelainen and P VainikainenldquoReal-time 3-D spatial-temporal dual-polarized measurementof wideband radio channel atmobile stationrdquo IEEETransactionson Instrumentation and Measurement vol 49 no 2 pp 439ndash448 2000
[11] K Kalliola K SulonenH LaitinenO Kivekas J Krogerus andP Vainikainen ldquoAngular power distribution and mean effectivegain of mobile antenna in different propagation environmentsrdquoIEEE Transactions on Vehicular Technology vol 51 no 5 pp823ndash838 2002
[12] K Kalliola H Laitinen P Vainikainen M Toeltsch J Laurilaand E Bonek ldquo3-D double-directional radio channel character-ization for urbanmacrocellular applicationsrdquo IEEETransactionsonAntennas and Propagation vol 51 no 11 pp 3122ndash3133 2003
[13] J Medbo M Riback H Asplund and J-E Berg ldquoMimo chan-nel characteristics in a small macrocell measured at 525GHzand 200MHz bandwidthrdquo in Proceedings of the IEEE 62ndVehicular Technology Conference (VTC-Fall rsquo05) vol 1 pp 372ndash376 IEEE May 2005
[14] L Materum J-I Takada I Ida and Y Oishi ldquoMobile stationspatio-temporal multipath clustering of an estimated widebandMIMO double-directional channel of a small urban 45GHzmacrocellrdquo EURASIP Journal on Wireless Communications andNetworking vol 2009 Article ID 804021 p 9 2009
[15] Z Zhong X Yin X Li and X Li ldquoExtension of ITU IMT-Achannel models for elevation domains and line-of-sight scenar-iosrdquo httparxivorgabs13012518
[16] M Jiang M Hosseinian M-I Lee and J Stern-Berkowitzldquo3D channel model extensions and characteristics study forfuture wireless systemsrdquo in Proceedings of the IEEE 24th AnnualInternational Symposium on Personal Indoor and Mobile RadioCommunications (PIMRC rsquo13) pp 41ndash46 IEEE London UKSeptember 2013
[17] 3GPP TR 36873 V2 ldquoStudy on 3D channel model for LTE(release 12)rdquo Tech Rep 2014
[18] J Meinila P Kyosti L Hentila et al ldquoD53 WINNER+ finalchannel models V1rdquo in Proceedings of the Wireless WorldInitiative New Radio 2010
[19] J Zhang C Pan F Pei G Liu and X Cheng ldquoThree-dimensional fading channel models a survey of elevation angleresearchrdquo IEEE Communications Magazine vol 52 no 6 pp218ndash226 2014
[20] R1-132543 ldquoUma channel measurements results on elevationrelated parametersrdquo 3GPP TSG-RAN WG1 73 CMCC CATTFukuoka Japan 2013
[21] R1-133525 ldquoUMi channel measurement results on elevationrelated parametersrdquo in Proceedings of the 3GPP TSG-RANWG174 CMCC CATT Barcelona Spain August 2013
10 Chinese Journal of Engineering
[22] R1-132544 ldquoO2i channel measurements results on elevationrelated parametersrdquo 3GPP TSG-RAN WG1 74 CMCC CATTBarcelona Spain 2013
[23] R1-134222 ldquoProposals for fast fading channel modelling for 3DUMirdquo 3GPP TSG-RAN WG1 74bis Alcatel-Lucent ShanghaiBell Alcatel-Lucent China Unicom Guangzhou China 2013
[24] R1-134221 ldquoProposals for fast fading channel modelling for3D UMardquo in Proceedings of the 3GPP TSG-RAN WG1 74bisAlcatel-Lucent Shanghai Bell Alcatel-Lucent China UnicomGuangzhou China October 2013
[25] R1-134795 ldquoProposals for fast fading channel modelling for 3DUMi O2Irdquo in Proceedings of the 3GPP TSG-RAN WG1 74bisAlcatel-Lucent Shanghai Bell Alcatel-Lucent China UnicomGuangzhou China October 2013
[26] J Zhang ldquoReview of wideband MIMO channel measurementand modeling for IMT-Advanced systemsrdquo Chinese ScienceBulletin vol 57 no 19 pp 2387ndash2400 2012
[27] B H Fleury M Tschudin R Heddergott D Dahlhaus andK I Pedersen ldquoChannel parameter estimation in mobile radioenvironments using the SAGE algorithmrdquo IEEE Journal onSelected Areas in Communications vol 17 no 3 pp 434ndash4501999
[28] M Series ldquoGuidelines for evaluation of radio interface tech-nologies for IMT-Advancedrdquo Report ITU 2135-1 2009
[29] N Czink P Cera J Salo E Bonek J-P Nuutinen and J YlitaloldquoA framework for automatic clustering of parametric MIMOchannel data including path powersrdquo in Proceedings of the IEEE64th Vehicular Technology Conference (VTC-Fall rsquo06) pp 1ndash5Montreal Canada September 2006
International Journal of
AerospaceEngineeringHindawi Publishing Corporationhttpwwwhindawicom Volume 2014
RoboticsJournal of
Hindawi Publishing Corporationhttpwwwhindawicom Volume 2014
Hindawi Publishing Corporationhttpwwwhindawicom Volume 2014
Active and Passive Electronic Components
Control Scienceand Engineering
Journal of
Hindawi Publishing Corporationhttpwwwhindawicom Volume 2014
International Journal of
RotatingMachinery
Hindawi Publishing Corporationhttpwwwhindawicom Volume 2014
Hindawi Publishing Corporation httpwwwhindawicom
Journal ofEngineeringVolume 2014
Submit your manuscripts athttpwwwhindawicom
VLSI Design
Hindawi Publishing Corporationhttpwwwhindawicom Volume 2014
Hindawi Publishing Corporationhttpwwwhindawicom Volume 2014
Shock and Vibration
Hindawi Publishing Corporationhttpwwwhindawicom Volume 2014
Civil EngineeringAdvances in
Acoustics and VibrationAdvances in
Hindawi Publishing Corporationhttpwwwhindawicom Volume 2014
Hindawi Publishing Corporationhttpwwwhindawicom Volume 2014
Electrical and Computer Engineering
Journal of
Advances inOptoElectronics
Hindawi Publishing Corporation httpwwwhindawicom
Volume 2014
The Scientific World JournalHindawi Publishing Corporation httpwwwhindawicom Volume 2014
SensorsJournal of
Hindawi Publishing Corporationhttpwwwhindawicom Volume 2014
Modelling amp Simulation in EngineeringHindawi Publishing Corporation httpwwwhindawicom Volume 2014
Hindawi Publishing Corporationhttpwwwhindawicom Volume 2014
Chemical EngineeringInternational Journal of Antennas and
Propagation
International Journal of
Hindawi Publishing Corporationhttpwwwhindawicom Volume 2014
Hindawi Publishing Corporationhttpwwwhindawicom Volume 2014
Navigation and Observation
International Journal of
Hindawi Publishing Corporationhttpwwwhindawicom Volume 2014
DistributedSensor Networks
International Journal of

2 Chinese Journal of Engineering
elevation angles in describing the radio signal propagationmore precisely The impact of elevation angle on MIMOcapacity was presented in [6] and vertical sectorization wasdescribed in [7] Simulation results show that 3D MIMOsystem with 32 antenna ports achieves 2sim36 times cellaverage throughput gain compared to the 4G LTE systemof two antenna ports at the BS [8] Further practical fieldmeasurements have validated the superiority of 3D MIMOchannel by harvesting a 27 sim42 capacity gain in UMiscenario [9] which highlights the importance of elevationdomain 3D characteristics including the elevation distribu-tion mean elevation angle (MEA) and elevation angle spread(EAS) are analyzed based on field channel measurements in[10ndash14] The Third Generation Partner Project (3GPP) hasinitiated the discussion on the general 3D channel fadingmodel [15 16] since January 2013 and released the 3DMIMOchannel model [17] in April 2014 World Wireless InitiativeNew Radio + (WINNER+) has also reported 3D channelmeasurements [18] as an extension of the 2D geometry basedstochasticmodel (GBSM)A good survey of 3D channelmod-els is given in [19] Six proposals to the 3GPP based on ourmeasurements and analysis are presented in [20ndash25] Reliableand realistic channel models based on the empirical prop-agation characteristics are critical to fundamental researchand evaluation of the 3D MIMO technique However theunderstanding of 3D MIMO channel is still in its infancyhow to characterize 3D propagation channels especiallythe elevation angle is therefore an important task for 3DMIMO development yet practical measurements of the 3Dfading channel are scarce As the standard organizations andchannel modeling researchers have agreed to a standard 3Dchannel model it is our attempt to measure the channel anddetermine its parameters according to the standard modelthen model researchers can generate the wireless channelimpulse response (CIR) for system simulation studies
In this paper we present efforts to the study of the statis-tical characteristics of the 3D MIMO channel for outdoor-to-indoor (O2I) scenario Using the same measurementequipmentmeasurements are repeated for two locationswithvery diverse surroundings inChina andNZ respectivelyThishelps to compare the similarities and differences between theresults We report on measurements of a 3D MIMO CIR andgive results for the following channel parameters
(i) power delay profile (PDP)
(ii) distribution of the delay spread (DS)
(iii) distributions of elevation angle-of-arrival (EAoA)and elevation angle-of-departure (EAoD)
(iv) distribution of the angle spread (AS) in the elevationdomain
(v) cross-polarization discrimination (XPD)
In Section 2 detailed descriptions for the measurementscenario and data postprocessing will be presented followedby measurement results of key parameters for the 3D MIMOchannel in Section 3 and conclusions in Section 4
2 Measurement Description
21 Measurement Equipment and Scenario Description Mea-surements are done by using the Elektrobit PropsoundSounder described in [26] It consists of three units trans-mitter (Tx) sounder receiver (Rx) sounder and Rx BasebandProcessing Unit (RBPU) through which signals can be trans-mitted received and stored in a time division way respec-tively
To capture the propagation rays in the 3D environmentefficiently fully dimensional antenna arrays were equipped atboth sides of themeasurement linkThe layout of the antennaarrays at Tx andRx side are illustrated in Figures 1(a) and 1(b)respectively At the Rx dual-polarized omnidirectional array(ODA) consisting of 56 antenna elements with 8 adjacentsides and a top surface was used while a dual-polarizeduniform planar array (UPA) with 32 antenna elements wasutilized as a sector transmit antenna array All array elementsconsisted of microstrip patches with 6 dB beamwidth ofapproximately 110∘ in both the vertical and horizontal planesAll antennas were calibrated in an anechoic chamber Thegain of each antenna element is 6 dBi with an angle resolutionof 2∘This is limited by the sensorsrsquo distribution density in theanechoic chamber for antenna calibration Powers receivedby the densely distributed sensors indicate the antenna powergain in the corresponding direction of the sensors both inazimuth and in elevation domain Angle information forpaths can be extracted by substituting all possible anglevalues inside the antenna calibration file iteratively until thereconstructed signal best fits the actual received one [27]The practical received signal will be deeply affected by theequipmentrsquos performance as it is the convolutional result ofthe measurement equipment impulse response (EIR) andCIR To eliminate the potential influences of equipmentperformance the equipment will be also calibrated with theTx and Rx being connected directly through an ideal RFcable for the EIR file By removing the EIR from the practicalreceived signal the CIR can be extracted Table 1 specifiesthe configuration and angle range of the antenna arraysalong with other measurement parameters The angle rangescapture most of the propagation paths at both ends of thelink where paths with a delay interval larger than the delayresolution can be distinguished
Utilizing both the horizontal and vertical dimensions 3DMIMO is particularly suitable for scenarios with vertical userlocation distributions Transmissions from outdoor BSs tousers located at different floors can be well separated in theirelevation angles
We carried out the field measurements for 3D CIR inBeijing China and Auckland New Zealand for the O2I sce-nario In China measurement the receive antenna array waspositioned at 5 different floors of a 60m high building whilethe transmit antenna was fixed at the top of a nearby 115mhigh building at a distance of 215mThis typical O2I scenariois shown in Figure 2(a) On each floor approximately 20different fixed locations were measured including ones nearthe window (the red star) or along the corridor with 500snapshots collected by the sounder for each location Wallsalong the corridor and between the rooms are made of brick
Chinese Journal of Engineering 3
(a) UPA at Tx (b) ODA at Rx
Figure 1 Antenna layouts used in the measurements
Table 1 Antenna configuration and parameters used in measure-mentsParameter ValueAntenna type ODA UPAElement number 56 32Element number used 16 16Polarized
plusmn45∘ plusmn45∘
Distribution of antenna elements Cylinder PlanarAngle range
Azimuth [minus180∘ 180∘] [minus70∘ 70∘]Elevation [minus70∘ 90∘] [minus70∘ 70∘]
Carrier 35 GHz (China) 235GHz (NZ)Bandwidth 100MHz (China) 10MHz (NZ)Tx power 33 dBm (China) 26 dBm (NZ)PN sequence 63 (China) 31 (NZ)
with plasterboard on the surface The floor is covered withmarble while the doors of the rooms are woodenThe Rx wasfixed on a trolley with an antenna height of 18m With theexception of the first level all floors featured a similar layoutCare was taken to ensure identical measurement locations onall floors
The NZ measurement shown in Figure 2(b) was per-formed at a cell site with the Tx antenna installed on therooftop of a 45m high building with its boresight pointing tothe measurement building which is approximately 100m faraway The room size is 30m 25m and 4m in length widthand height respectively Approximately 80 fixed locations inthe same floor were measured with 200 snapshots collectedfor each location
22 Data Postprocessing for 3D Channel Impulse ResponseThe field measurements described above provided numerous
snapshots of the impulse response of the time-varying radiochannel The collected channel impulse responses were fedto a high-resolution algorithm to estimate the channelparameters for each snapshot Maximum likelihood esti-mation (MLE) provides an optimum unbiased estimationfrom a statistical perspective however it is computationallyprohibitive due to the multidimensional searches requiredThus a low-complexity approximation of MLE spatial-alternating generalized expectation-maximization (SAGE)algorithm [27] has been proposed to extract the key channelparameters on the basis of the newly released 3D channelmodel [17] Denoting the total number of clusters by 119862 wehave the following parameters for the 119897th subpath in the 119888thcluster
(1) complex polarization (vertical (119881)) and (horizontal(119867)) components [120572119881119881
119888119897
120572
119881119867
119888119897
120572
119867119881
119888119897
120572
119867119867
119888119897
](2) delays 120591
119888119897
(3) azimuth angle-of-departure (AoD) 120601119888119897and angle-of-
arrival (AoA) 120593119888119897
(4) elevation AoD (EAoD) 120579119888119897and AoA (EAoA) 120599
119888119897
(5) Doppler frequency 119891
119889119888119897being 0 for fixed spots
A single link of the 3D fading channel between the basestation and the mobile user is shown in Figure 3 With 119872
number of transmits and 119873 number of receive antennas forthe cluster 119888 the 3D channel model is presented
h119899119898119888
(119905) =
119871
sum
119897=1
[
119865
119899119881
119865
119899119867
]
119879
[
120572
119881119881
119888119897
120572
119881119867
119888119897
120572
119867119881
119888119897
120572
119867119867
119888119897
][
119865
119898119881
119865
119898119867
]
sdot exp (1198952120587120582
minus1
0
(
119879
119899119888119897
sdot 119889
119899))
sdot exp (1198952120587120582
minus1
0
(
119879
119898119888119897
sdot 119889
119898))
(1)
4 Chinese Journal of Engineering
Tx
Where Rx array is located
Where Tx array is located
215m
(a) Measurement in China
Measurement pointBoresight of Rx
Boresight of Tx
(b) Measurement in NZ
Figure 2 A view of measurement areas in China (a) and NZ (b)
Mobile userBase station
z
z
x
x
y
rarr
120593cl
120599cl
120591cl
Cluster 1
Cluster c
y
120579cl
120601cl
Figure 3 Generic 3D fading channel model
Chinese Journal of Engineering 5
PDP ChinaExp fading
PDP NZExp fading
minus30
minus25
minus20
minus15
minus10
minus5
0
Nor
mal
ized
pow
er (d
B)
minus25
minus20
minus15
minus10
minus5
0
Nor
mal
ized
pow
er (d
B)
100 200 300 400 5000Excess delay (ns)
500 1000 1500 20000Excess delay (ns)
(a) Average PDP of measurements in China and NZ
200 300 400 500 600100Delay spread (ns)
0
02
04
06
08
1
CDF
Delay spread China Delay spread NZlog sim N (255 030)log sim N (194 014)
(b) RMS delay spread in China and NZ
Figure 4 PDP and delay spread in China and NZ
where 119871 is the total number of subpaths 1205820is the wavelength
of the carrier frequency 119899 = 1 sdot sdot sdot 119873 and 119898 = 1 sdot sdot sdot119872 119889119898
and 119889
119899are the 3D location vectors for Tx and Rx antennas
respectively 119898119888119897
and
119899119888119897denote the spherical unit vectors
at transmitter and receiver elements respectively For the 119897thsubpath in the 119888th cluster
119898119888119897is calculated by
119898119888119897=
[
[
[
[
sin (120579
119888119897) cos (120601
119888119897)
sin (120579
119888119897) sin (120601
119888119897)
cos (120579119888119897)
]
]
]
]
(2)
A similar expression is used to obtain spherical unitvector
119899119888119897for Rx by substituting angles 120599
119888119897and 120593
119888119897into (2)
Besides 119865119898119881
and 119865
119898119867are transmit antenna field patterns
for the vertical and horizontal polarizations respectivelyMeanwhile 119865
119899119881and 119865
119899119867are antenna field patterns for the
vertical and horizontal polarizations on the Rx side
3 Results of Measurements
The distribution results along with the 3GPP reference valueare summarized in Table 2 the previous extracted parame-ters both for China and for NZ measurements are fed backto a further statistical characteristic analysis including delayspread angle distribution and XPD
31 Power Delay Profile and Delay Spread Power delayprofiles (PDP) for both China and NZ measurements arepresented for an intuitive glance over multipaths dynamicpower range and power fadingwith delays and so forthWitha bandwidth of being 100MHz for China and 10MHz forNZ measurement the delay resolution is 10 ns and 100 nsrespectively Based on the CIR exactly the averaged PDPover all snapshots is shown in Figure 4(a) The peak valueof the PDP has been normalized to 0 dB As a result of
Table 2 MIMO channel model parameters
Parameters China NZ 3GPP [17]RMS delay 120591 spread log
10
(s)120583
minus706 minus645 minus662120590
014 030 032Elevation AoD 120579 spread log
10
(degrees)120583
128 113 mdash120590
022 028 mdashElevation AoA 120599 spread log
10
(degrees)120583
139 156 101120590
031 024 043Azimuth AoD 120601 spread log
10
(degrees)120583
109 125 125120590
014 016 042Azimuth AoA 120593 spread log
10
(degrees)120583
176 192 176120590
010 011 016Cross-polarization discrimination (XPD)
XPD = 10log10
(
1003816
1003816
1003816
1003816
1003816
1003816
1003816
1003816
1003816
1003816
1003816
120572
119881119881
+ 120572
119867119867
120572
119867119881
+ 120572
119881119867
1003816
1003816
1003816
1003816
1003816
1003816
1003816
1003816
1003816
1003816
1003816
2
)(dB)
12058345 52 9
12059064 91 11
Delay distribution EXPAzimuth AoA and AoD distribution GaussianElevation AoA and AoD distribution Laplacian
the complicated practical scattering environment there existthree peaks both for China and for NZ measurements thenthe PDP comes to a flat fading gradually The noise floorwhich may result from the system thermal noise and channel
6 Chinese Journal of Engineering
NLoS pathsLoS path
minus05minus15 1505minus1 0 1
EAoA (rad)
minus15
minus1
minus05
0
05
1
15
EAoD
(rad
)
(a) EAoA versus EAoD at Floor 1
LoS path
NLoS paths
minus05minus15 1505minus1 0 1
EAoA (rad)
minus15
minus1
minus05
0
05
1
15
EAoD
(rad
)
(b) EAoA vversus EAoD at Floor 3
minus4minus2
02
4
minus2minus1
01
Azimuth AOA (rad)Azimuth AOD (rad)
Exce
ss d
elay
(120583s)
0
05
1
15
(c) 2D clustering example
Azimuth AOA (rad)Azimuth AOD (rad)
minus4minus2
02
4
minus2minus1
01
Exce
ss d
elay
(120583s)
0
05
1
15
(d) 3D clustering example
Figure 5 EAoA and EAoD dispersion and 2D versus 3D clustering for the snapshot near the window (red star) in China measurement
background noise is calculated as the mean power of therelatively flat fading part of the PDP curve The dynamicrange between the peak power and bottom noise is 25 dB forChina measurement and 20 dB for NZ measurement whichis 5 dB smaller because of a longer propagation distance thusthe peak value experienced a deeper fading Power of MPCsafter the reference delay of the strongest power decays rapidlyin an exponential formation which is the same with theconventional 2D PDP fading distribution [28] thus signalpropagation in 3D environment has no obvious impact on thePDP
For each snapshot we also calculate the delay spread andpresent the cumulative distribution function (CDF) of all rmsDS in Figure 4(b) for both China and NZ measurementsThere is an obvious lognormal distribution with relatedmean values and standard deviations presented in Table 2Compared to China measurement the DS in NZ is muchlarger because the room size of Rx is much larger in NZmeasurement with all spots fixed in a wild area in the samefloor
32 EAoA and EAoD Dispersion and Clustering The EAoAand EAoD dispersion at different floors are presented forChinameasurement Taking the 1st and 3rd floor for examplethe dispersions of EAoA-EAoD for the snapshot near thewindow (red star in Figure 2(a)) are shown inFigures 5(a) and
Table 3 Cluster number increase from 2D to 3D
Floor 1st 2nd 3rd 5th 7thCluNum 2D 102 84 93 95 122CluNum 3D 152 125 134 154 174
5(b) respectively Points in the same color are divided into thesame cluster while the size represents the path powerThere isa briefmarker of the LoS path which comes throughwindowsdirectly while the NLoS path might be reflected by concretewalls Given a height of 14m at Txwhich is slightly lower thanRx at the 3rd floor the EAoD of the LoS path being slightlybigger than 0 degree can be expected as shown in Figure 5(b)
Asmultipath components (MPCs) are dispersive for both1st and 3rd floor in the 3D environment an interesting ques-tion arises whether the cluster number will change comparedto that in 2D channel To identify clusters [29] for the samesnapshot near the window for the 3rd floor a comparativeresult of the estimated MPCs for China measurements ispresented in Figures 5(c) and 5(d) Cluster number increasesfrom 7 to 9 the main cluster in blue for 2D case divides into2 subclusters for 3D case An averaged cluster number for allsnapshots on each floor is also presented inTable 3 the clusterincrease from 2D to 3D indicates that a more specific channelpropagation characteristic can be observed in a 3D vision
Chinese Journal of Engineering 7
minus20 minus10 0 10 20 30minus30
EAoD (deg)
0
01
02
03
0
01
02
minus20 minus10 0 10 20 30minus30
EAoA (deg)
EAoD ChinaLaplacian (120583 = 0 b = 15)
EAoA China Laplacian (120583 = 0 b = 16)
(a) EAoD and EAoA distribution in China measurement
minus20 minus10minus30 10 20 300EAoA (deg)
EAoD NZLaplacian (120583 = 3 b = 21)
EAoA NZLaplacian (120583 = 0 b = 56)
0
002
004
006
008
0
005
01
015
02
minus10 200 10 30minus30 minus20
EAoD (deg)
(b) EAoD and EAoA distribution in NZ measurement
ESD China
ESA China
ESD NZ
ESA NZ
0
02
04
06
08
1
CDF
20 30 40 5010Angle spread (deg)
log sim N (156 024)
log sim N (113 028)
log sim N (139 031)
log sim N (128 022)
(c) EASD and EASA CDFs in NZ
Figure 6 EAoA and EAoD distributions and angular spread
33 EAoA and EAoD Distributions and Angular Spread Thedistribution of EAoD and EAoA for China and NZ measure-ments is shown in Figures 6(a) and 6(b) respectively Withthe EAoD and EAoA of the strongest path both being shiftedto zero degrees for all measured spots figures show that
the angle in China measurement exhibits a well Laplacian fitas presented by
119891 (119909) =
1
radic2120590
exp(minus
radic2
120590
1003816
1003816
1003816
1003816
119909 minus 120583
1003816
1003816
1003816
1003816
) (3)
8 Chinese Journal of Engineering
XPD China
0
001
002
003
004
005
006
007
20100 30 40minus20 minus10minus30
XPD in China (dB)
10 log sim N (45 64)
(a) PDF of XPD in China
XPD NZ
0
001
002
003
004
005
200 40 60minus20minus40
XPD in NZ (dB)
10 log sim N (52 91)
(b) PDF of XPD in NZ
Figure 7 XPD measurements for China and NZ
where120583 and120590
2 are themean value and variance of the Laplacedistribution respectively However this is not the case for NZresult A possible reason for this is the lack of sample datafor only one floor measurement In addition to the elevationpower spectrummentioned above rms angle spread providesanother perspective for a further understanding of 3DMIMOchannel For each snapshot the angular spread in the ele-vation domain can be calculated Taking all the subpaths inthe 119888th cluster for example the angular spread of EAoD isgiven by
120590AS =
radic
sum
119871
119897=1
(120579
119888119897minus [sum
119871
119897=1
120579
119888119897119875
119888119897sum
119871
119897=1
119875
119888119897])
2
119875
119888119897
sum
119871
119897=1
119875
119888119897
(4)
where the power of the 119897th subpath in the 119888th cluster can becalculated as the sum of squares of the polarization coeffi-cients given by
119875
119888119897=
1003816
1003816
1003816
1003816
1003816
120572
119881119881
119888119897
1003816
1003816
1003816
1003816
1003816
2
+
1003816
1003816
1003816
1003816
1003816
120572
119881119867
119888119897
1003816
1003816
1003816
1003816
1003816
2
+
1003816
1003816
1003816
1003816
1003816
120572
119867119881
119888119897
1003816
1003816
1003816
1003816
1003816
2
+
1003816
1003816
1003816
1003816
1003816
120572
119867119867
119888119897
1003816
1003816
1003816
1003816
1003816
2
(5)
The CDF of elevation angular spread for AoD (EASD)and AoA (EASA) is shown in Figure 6(c) for both Chinaand NZ measurements Similar to 3GPP [17] a lognormaldistribution fits well with this angular spread with the meanand standard deviation presented in Table 2 As we can seeEASD is smaller than EASA due to an additional channelpropagation and scattering for transmitted signals Besidesthe AS of elevation angles are correspondingly smaller thanthat of azimuth angles both for departure and for arrivalsides It is reasonable that vertical scatters are not so richcompared to the azimuth plane What is more the ESA inNZ is larger than that of China while the ESD is smaller thiscan be explained by a much larger room size with complexscatters on theRx side inNZmeasurementMeanwhile onTx
Table 4 Angular spread for different floors in China measurement
Floor EASD (∘) EASA (∘) AASD (∘) AASA (∘)1st 208 274 204 4552nd 206 209 125 4223rd 195 223 193 4335th 208 221 180 4097th 260 283 179 431
side so long the propagation distance is that only paths in aspecific EoDcanbe received inNZmeasurement which leadsto a concentrated ESD A more specific angular spread fordifferent floors inChinameasurement is presented in Table 4
34 XPD Distribution As XPD is being defined in Table 2its distribution is shown in Figure 7 for both China and NZmeasurements Similar to 3GPP a normal distribution fitsXPD well for all fixed spots In NZ result the range of XPDis wider than that of China as the room size on Rx side in NZis much larger which will result in a more complex depo-larization in 3D propagation As XPD is closely related tothe environment the mean value of XPD for different floorsvaries in China measurement being 33 51 53 38 and 31for the 1st 2nd 3rd 5th and 7th floor respectively To benoted the Tx is as much high as Rx on the 3rd floor a higherdistance in elevation domain will contribute to a bettervertical depolarization
4 Conclusion
In this paper we studied the statistical characteristics of3D channel impulse response and presented comparativeresults for measurements performed in China and NZ Wehave focused our study on the elevation domain as these
Chinese Journal of Engineering 9
measurements are rare Simulation results show that the PDPin 3D propagation fades exponentially both in China andin NZ measurements The cluster can be further resolvedwhen the elevation domain is taken into consideration Alognormal distribution fits well with the AS while the ESAin NZ is larger than that of China due to a larger scatteringroom size in NZ measurement Because of a more disperseddistribution of measured locations in the elevation domainthe XPD in China is smaller than that of NZ and the XPDvaries with the height difference between Tx and Rx andso forth All these results of the elevation domain providea better understanding of 3D channel and contribute to3D MIMO system design including 3D antenna arrays forfuture 5G where the elevation domain cannot be ignoredTherefore these measurements are a precursor to 5G systemscapability studies
Conflict of Interests
The authors declare that there is no conflict of interestsregarding the publication of this paper
Acknowledgments
The China measurements are supported in part by the 863Program of China under Grant no 2015AA01A703 and byNational Science and Technology Major Project of the Min-istry of Science and Technology (project name is ldquoIMT-2002Candidate Band Analysis and Evaluationrdquo) with 2015ZX-03002008 and by National Science and Technology MajorProject of the Ministry of Science and Technology (projectname is ldquoWireless mobile spectrum research and verificationforWRC15rdquo) with 2014ZX03003013-004 and by National Sci-ence andTechnologyMajor Project of theMinistry of ScienceandTechnology (project name is ldquoResearch andDevelopmentof MIMO Channel Emulatorrdquo) with 2013ZX03001020-002and by Huawei Company for Massive MIMO study
References
[1] Cisco ldquoCisco visual networking index globalmobile data trafficforecast update 2013ndash2018rdquo Cisco White Paper Cisco 2014
[2] J G Andrews S Buzzi W Choi et al ldquoWhat will 5G berdquo IEEEJournal on Selected Areas in Communications vol 32 no 6 pp1065ndash1082 2014
[3] X Cheng B Yu L Yang et al ldquoCommunicating in the realworld 3D MIMOrdquo IEEE Wireless Communications vol 21 no4 pp 136ndash144 2014
[4] M Shafi M Zhang A L Moustakas et al ldquoPolarized MIMOchannels in 3-D models measurements and mutual informa-tionrdquo IEEE Journal on Selected Areas in Communications vol24 no 3 pp 514ndash526 2006
[5] T Aulin ldquoA modified model for the fading signal at a mobileradio channelrdquo IEEE Transactions on Vehicular Technology vol28 no 3 pp 182ndash203 1979
[6] M Shafi M Zhang P J Smith A L Moustakas and A FMolisch ldquoThe impact of elevation angle on MIMO capacityrdquo inProceedings of the IEEE International Conference on Communi-cations (ICC rsquo06) pp 4155ndash4160 Istanbul Turkey July 2006
[7] O N C Yilmaz S Hamalainen and J Hamalainen ldquoSystemlevel analysis of vertical sectorization for 3GPP LTErdquo in Pro-ceedings of the 6th International Symposium on Wireless Com-munication Systems (ISWCS rsquo09) pp 453ndash457 IEEE TuscanyItaly September 2009
[8] Y-H Nam B L Ng K Sayana et al ldquoFull-dimension MIMO(FD-MIMO) for next generation cellular technologyrdquo IEEECommunications Magazine vol 51 no 6 pp 172ndash179 2013
[9] C Pan and J Zhang ldquoExperimental investigation of elevationangles and impacts on channel capacity in urban microcellrdquoin Proceedings of the International Conference on ComputingNetworking and Communications (ICNC rsquo15) pp 11ndash15 IEEEGarden Grove Calif USA Feburary 2015
[10] K Kalliola H Laitinen L I Vaskelainen and P VainikainenldquoReal-time 3-D spatial-temporal dual-polarized measurementof wideband radio channel atmobile stationrdquo IEEETransactionson Instrumentation and Measurement vol 49 no 2 pp 439ndash448 2000
[11] K Kalliola K SulonenH LaitinenO Kivekas J Krogerus andP Vainikainen ldquoAngular power distribution and mean effectivegain of mobile antenna in different propagation environmentsrdquoIEEE Transactions on Vehicular Technology vol 51 no 5 pp823ndash838 2002
[12] K Kalliola H Laitinen P Vainikainen M Toeltsch J Laurilaand E Bonek ldquo3-D double-directional radio channel character-ization for urbanmacrocellular applicationsrdquo IEEETransactionsonAntennas and Propagation vol 51 no 11 pp 3122ndash3133 2003
[13] J Medbo M Riback H Asplund and J-E Berg ldquoMimo chan-nel characteristics in a small macrocell measured at 525GHzand 200MHz bandwidthrdquo in Proceedings of the IEEE 62ndVehicular Technology Conference (VTC-Fall rsquo05) vol 1 pp 372ndash376 IEEE May 2005
[14] L Materum J-I Takada I Ida and Y Oishi ldquoMobile stationspatio-temporal multipath clustering of an estimated widebandMIMO double-directional channel of a small urban 45GHzmacrocellrdquo EURASIP Journal on Wireless Communications andNetworking vol 2009 Article ID 804021 p 9 2009
[15] Z Zhong X Yin X Li and X Li ldquoExtension of ITU IMT-Achannel models for elevation domains and line-of-sight scenar-iosrdquo httparxivorgabs13012518
[16] M Jiang M Hosseinian M-I Lee and J Stern-Berkowitzldquo3D channel model extensions and characteristics study forfuture wireless systemsrdquo in Proceedings of the IEEE 24th AnnualInternational Symposium on Personal Indoor and Mobile RadioCommunications (PIMRC rsquo13) pp 41ndash46 IEEE London UKSeptember 2013
[17] 3GPP TR 36873 V2 ldquoStudy on 3D channel model for LTE(release 12)rdquo Tech Rep 2014
[18] J Meinila P Kyosti L Hentila et al ldquoD53 WINNER+ finalchannel models V1rdquo in Proceedings of the Wireless WorldInitiative New Radio 2010
[19] J Zhang C Pan F Pei G Liu and X Cheng ldquoThree-dimensional fading channel models a survey of elevation angleresearchrdquo IEEE Communications Magazine vol 52 no 6 pp218ndash226 2014
[20] R1-132543 ldquoUma channel measurements results on elevationrelated parametersrdquo 3GPP TSG-RAN WG1 73 CMCC CATTFukuoka Japan 2013
[21] R1-133525 ldquoUMi channel measurement results on elevationrelated parametersrdquo in Proceedings of the 3GPP TSG-RANWG174 CMCC CATT Barcelona Spain August 2013
10 Chinese Journal of Engineering
[22] R1-132544 ldquoO2i channel measurements results on elevationrelated parametersrdquo 3GPP TSG-RAN WG1 74 CMCC CATTBarcelona Spain 2013
[23] R1-134222 ldquoProposals for fast fading channel modelling for 3DUMirdquo 3GPP TSG-RAN WG1 74bis Alcatel-Lucent ShanghaiBell Alcatel-Lucent China Unicom Guangzhou China 2013
[24] R1-134221 ldquoProposals for fast fading channel modelling for3D UMardquo in Proceedings of the 3GPP TSG-RAN WG1 74bisAlcatel-Lucent Shanghai Bell Alcatel-Lucent China UnicomGuangzhou China October 2013
[25] R1-134795 ldquoProposals for fast fading channel modelling for 3DUMi O2Irdquo in Proceedings of the 3GPP TSG-RAN WG1 74bisAlcatel-Lucent Shanghai Bell Alcatel-Lucent China UnicomGuangzhou China October 2013
[26] J Zhang ldquoReview of wideband MIMO channel measurementand modeling for IMT-Advanced systemsrdquo Chinese ScienceBulletin vol 57 no 19 pp 2387ndash2400 2012
[27] B H Fleury M Tschudin R Heddergott D Dahlhaus andK I Pedersen ldquoChannel parameter estimation in mobile radioenvironments using the SAGE algorithmrdquo IEEE Journal onSelected Areas in Communications vol 17 no 3 pp 434ndash4501999
[28] M Series ldquoGuidelines for evaluation of radio interface tech-nologies for IMT-Advancedrdquo Report ITU 2135-1 2009
[29] N Czink P Cera J Salo E Bonek J-P Nuutinen and J YlitaloldquoA framework for automatic clustering of parametric MIMOchannel data including path powersrdquo in Proceedings of the IEEE64th Vehicular Technology Conference (VTC-Fall rsquo06) pp 1ndash5Montreal Canada September 2006
International Journal of
AerospaceEngineeringHindawi Publishing Corporationhttpwwwhindawicom Volume 2014
RoboticsJournal of
Hindawi Publishing Corporationhttpwwwhindawicom Volume 2014
Hindawi Publishing Corporationhttpwwwhindawicom Volume 2014
Active and Passive Electronic Components
Control Scienceand Engineering
Journal of
Hindawi Publishing Corporationhttpwwwhindawicom Volume 2014
International Journal of
RotatingMachinery
Hindawi Publishing Corporationhttpwwwhindawicom Volume 2014
Hindawi Publishing Corporation httpwwwhindawicom
Journal ofEngineeringVolume 2014
Submit your manuscripts athttpwwwhindawicom
VLSI Design
Hindawi Publishing Corporationhttpwwwhindawicom Volume 2014
Hindawi Publishing Corporationhttpwwwhindawicom Volume 2014
Shock and Vibration
Hindawi Publishing Corporationhttpwwwhindawicom Volume 2014
Civil EngineeringAdvances in
Acoustics and VibrationAdvances in
Hindawi Publishing Corporationhttpwwwhindawicom Volume 2014
Hindawi Publishing Corporationhttpwwwhindawicom Volume 2014
Electrical and Computer Engineering
Journal of
Advances inOptoElectronics
Hindawi Publishing Corporation httpwwwhindawicom
Volume 2014
The Scientific World JournalHindawi Publishing Corporation httpwwwhindawicom Volume 2014
SensorsJournal of
Hindawi Publishing Corporationhttpwwwhindawicom Volume 2014
Modelling amp Simulation in EngineeringHindawi Publishing Corporation httpwwwhindawicom Volume 2014
Hindawi Publishing Corporationhttpwwwhindawicom Volume 2014
Chemical EngineeringInternational Journal of Antennas and
Propagation
International Journal of
Hindawi Publishing Corporationhttpwwwhindawicom Volume 2014
Hindawi Publishing Corporationhttpwwwhindawicom Volume 2014
Navigation and Observation
International Journal of
Hindawi Publishing Corporationhttpwwwhindawicom Volume 2014
DistributedSensor Networks
International Journal of
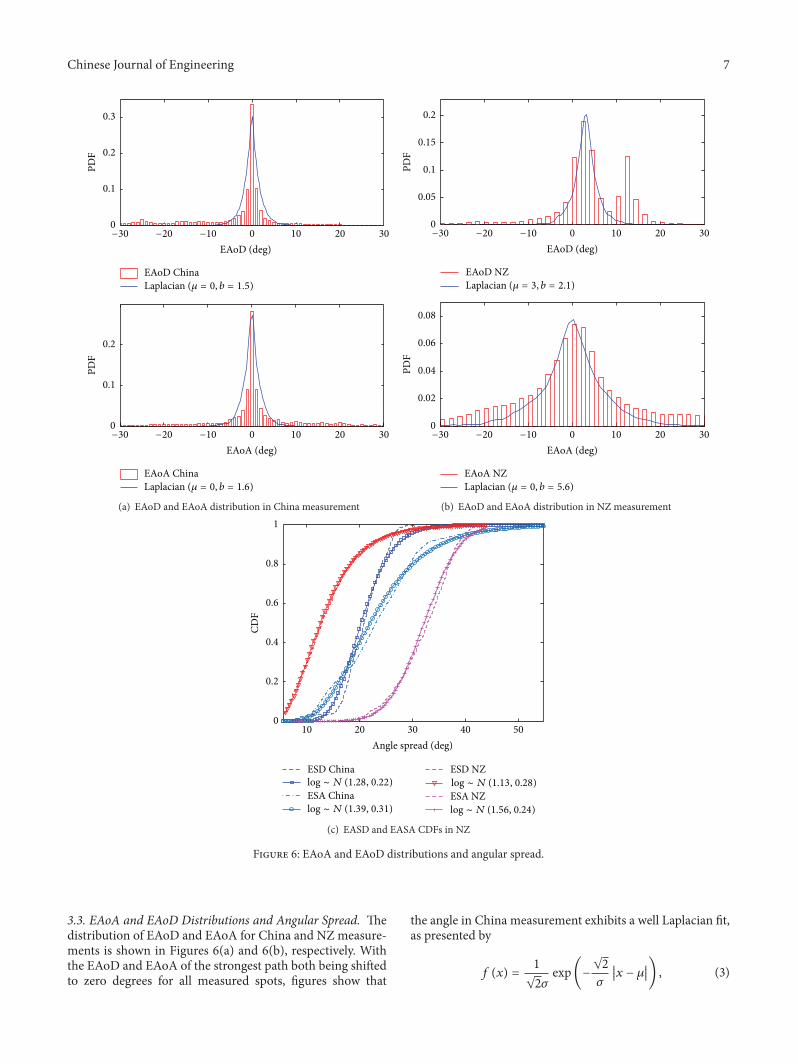

International Journal of
AerospaceEngineeringHindawi Publishing Corporationhttpwwwhindawicom Volume 2014
RoboticsJournal of
Hindawi Publishing Corporationhttpwwwhindawicom Volume 2014
Hindawi Publishing Corporationhttpwwwhindawicom Volume 2014
Active and Passive Electronic Components
Control Scienceand Engineering
Journal of
Hindawi Publishing Corporationhttpwwwhindawicom Volume 2014
International Journal of
RotatingMachinery
Hindawi Publishing Corporationhttpwwwhindawicom Volume 2014
Hindawi Publishing Corporation httpwwwhindawicom
Journal ofEngineeringVolume 2014
Submit your manuscripts athttpwwwhindawicom
VLSI Design
Hindawi Publishing Corporationhttpwwwhindawicom Volume 2014
Hindawi Publishing Corporationhttpwwwhindawicom Volume 2014
Shock and Vibration
Hindawi Publishing Corporationhttpwwwhindawicom Volume 2014
Civil EngineeringAdvances in
Acoustics and VibrationAdvances in
Hindawi Publishing Corporationhttpwwwhindawicom Volume 2014
Hindawi Publishing Corporationhttpwwwhindawicom Volume 2014
Electrical and Computer Engineering
Journal of
Advances inOptoElectronics
Hindawi Publishing Corporation httpwwwhindawicom
Volume 2014
The Scientific World JournalHindawi Publishing Corporation httpwwwhindawicom Volume 2014
SensorsJournal of
Hindawi Publishing Corporationhttpwwwhindawicom Volume 2014
Modelling amp Simulation in EngineeringHindawi Publishing Corporation httpwwwhindawicom Volume 2014
Hindawi Publishing Corporationhttpwwwhindawicom Volume 2014
Chemical EngineeringInternational Journal of Antennas and
Propagation
International Journal of
Hindawi Publishing Corporationhttpwwwhindawicom Volume 2014
Hindawi Publishing Corporationhttpwwwhindawicom Volume 2014
Navigation and Observation
International Journal of
Hindawi Publishing Corporationhttpwwwhindawicom Volume 2014
DistributedSensor Networks
International Journal of