Embed Size (px)
Citation preview
Research ArticleMeasuring Visual Function Using the MultiQuity System:Comparison with an Established Device
Patrycja Smolarek-Kasprzak,1 John M. Nolan,1,2,3 Stephen Beatty,1,2 Jessica Dennison,1
Kwadwo Owusu Akuffo,1 Robert Kuchling,4 Jim Stack,1 and Graham O’Regan4
1Macular Pigment Research Group, Department of Chemical & Life Sciences, Waterford Institute of Technology, Waterford, Ireland2Institute of Vision Research, Whitfield Clinic, Waterford, Ireland3Macular Pigment Research Group, Vision Research Centre, Carriganore House, Waterford Institute of Technology, West Campus,Carriganore, Waterford, Ireland4Sightrisk Ltd., Carriganore House, Waterford Institute of Technology, West Campus, Carriganore, Waterford, Ireland
Correspondence should be addressed to John M. Nolan; [email protected]
Received 5 September 2014; Accepted 15 November 2014; Published 16 December 2014
Academic Editor: Paolo Fogagnolo
Copyright © 2014 Patrycja Smolarek-Kasprzak et al. This is an open access article distributed under the Creative CommonsAttribution License, which permits unrestricted use, distribution, and reproduction in any medium, provided the original work isproperly cited.
Purpose. To compare measures of visual acuity (VA) and contrast sensitivity (CS) from theThompson Xpert 2000 and MultiQuity(MiQ) devices. Methods. Corrected distance VA (CDVA) and CS were measured in the right eye of 73 subjects, on an establishedsystem (Thompson Xpert) and a novel system (MiQ 720). Regression was used to convert MiQ scores into the Thompson scale.Agreement between the converted MiQ and Thompson scores was investigated using standard agreement indices. Test-retestvariability for both devices was also investigated, for a separate sample of 24 subjects. Results. For CDVA, agreement was strongbetween the MiQ and Thomson devices (accuracy = 0.993, precision = 0.889, CCC = 0.883). For CS, agreement was also strong(accuracy = 0.996, precision = 0.911, CCC = 0.907). Agreement was unaffected by demographic variables or by presence/absenceof ocular pathology. Test-retest agreement indices for both devices were excellent: in the range 0.88–0.96 for CDVA and in therange 0.90–0.98 for CS. Conclusion. MiQ measurements exhibit strong agreement with corresponding Thomson measurements,and test-retest results are good for both devices. Agreement between the two devices is unaffected by age or ocular pathology.
1. Introduction
The visual world is made up of high-definition (HD) envi-ronments. In the 21st century, everyday lives are becomingincreasingly dependent on HD visual function, not just foractivities such asmobility [1], reading performance [2],motorvehicle driving [3], and facial recognition [4], but also forour interactions with and accuracy in performing tasks usingHD display screen technologies [5]. Navigation throughthis HD era requires good visual acuity, and the ability todetect objects at low contrast is also becoming increasinglyimportant for these activities of daily living. However, despitethe advances in visual display technologies, there has beena lag in innovation in terms of how visual function canbe reliably and accurately assessed in this more visuallydemanding world, and there is a question as to whether
the traditional techniques are appropriate for the real worldof today.
For visual acuity (VA), the Snellen chart was first intro-duced in 1862 by Herman Snellen and the logMAR chart in1976 [6]. However, a major limitation of VA measurementtechniques is that they measure minimum angle of visualresolution using high-contrast targets only, whereas the realworld is made up of objects across a range of spatial fre-quencies and contrast. It has been demonstrated that contrastsensitivity (CS) is more closely related to levels of disabilityand health-related quality of life related to vision in patientswith ocular disease [7–9] and as such has been recommendedfor use in the clinical setting, particularly in low vision clinics[10], and also in the detection and monitoring of eye diseasessuch as glaucoma [11], cataract [12], diabetic retinopathy [13],
Hindawi Publishing CorporationJournal of OphthalmologyVolume 2014, Article ID 180317, 7 pageshttp://dx.doi.org/10.1155/2014/180317

2 Journal of Ophthalmology
and optic neuritis [14], as well as in the postoperativeassessment of patients having undergone laser refractiveprocedures [15]. However, and in spite of these observa-tions, CS is still not widely measured in the clinical setting[16], possibly reflecting difficulties in incorporating thesemeasures into a busy clinical practice and a lack of apprecia-tion of its value amongst eye care professionals.
Measures of CS can be classified as periodic pattern (sine-grating) [17] and letter-based (nonperiodic) [18] techniques.The letter-based Pelli-Robson CS chart represents a popularmethod of measuring CS [19]. However, the Pelli-Robsonchart does have several limitations, and these are attributableto it being comprised of eight spatial frequencies (eachfrequency consisting of two triplets) and because it can provedifficult to ensure uniform illumination across the chart [20].The MARS letter CS chart represents a redesign of the Pelli-Robson chart, and this uses the same technique, but with amore convenient hand-held (23 × 36 cm) chart and a contrastrange from 0.04 to 1.92 log units [21]. Studies looking at theagreement of the MARS chart with the Pelli-Robson chartshow variable results. Subjects with poorer CS have beenfound to score better on the MARS chart than on Pelli-Robson testing and to exhibit better repeatability of readings[22, 23]. Exceptions were subjects with normal vision, whohave been reported to exhibit subtly better repeatability withthe Pelli-Robson chart [22]. Number-based charts have alsobeen developed and their validity has also been assessed [24],but they are still not widely used.
In more recent times, there has been an attempt to shiftaway from the traditional and somewhat coarser and cum-bersome systems, in favour of computer-based applications toassess visual function.TheThompsonTest Chart Pro 2000CStest displays optotypes on a computer monitor and is similarto the Pelli-Robson test in the method it employs.
To our knowledge, there have been no published concor-dance studies between measures of visual function recordedon older LCD (liquid crystal display) and systems using thesemore recently introduced screen technologies.
We live in aHDworld, and yetmost eye care professionalsrestrict measures of visual function to systems that areinsufficiently sensitive to represent a reflection of everydayvisual demands and satisfaction. The MultiQuity (MiQ) testchart system (Sightrisk Ltd., Waterford, Ireland) represents asuite of measures of visual function that has been developedfor use on both HD PDA (high definition portable digitalassistant) and television-basedmonitor platforms. It has beendesigned to be used in everyday clinical practice, and itsfunctions include measures of the following psychophysicalparameters: VA and CS. The MiQ VA Test Suite has over720 letter size increments, thereby offering advantages overtraditional systems, not just in terms of avoiding crowdingphenomena but also in terms of sensitivity. The high degreeof acuity refinement also provides for improved sensitivity atthe end point of refraction because the patient is closer to thethreshold of letter recognition.
The aim of this study is to assess concordance betweenthe measures of VA and CS recorded on the novel MiQtest chart versus the Thompson Test Chart 2000 Xpert. TheThompson Test Chart 2000 Xpert was chosen as it is the only
computer-based system to have been compared with MARSand Pelli-Robson tests [20].
2. Methods
2.1. Setting and Subjects. This study was conducted at theVision Research Centre, Waterford Institute of Technology,Waterford, Ireland. For themain analysis, a total of 73 subjectswere recruited into the study. Inclusion criteria included anysubjects older than 18 years who were willing to participatein the study. There were no exclusion criteria for subjectsrecruited into this study. Subjects were recruited by word ofmouth, social media, and existing subject databases at theMacular Pigment Research Group (MPRG); we specificallyincluded some subjects with age-related macular degenera-tion (AMD) and cataract (see Section 2.6). Ethical approvalwas granted from the local Waterford South East (of Ireland)Region Ethics Committee prior to the study commencing.
In all cases, the right eye was used as the study eye.Subjects wore an occlusive eye patch over the nontested (left)eye. Testing was performed by a single researcher (JessicaDennison). The room lights were on for all tests. In orderto avoid bias with respect to the test conducted first, subjectswere randomized to either the MiQ orThompson Test ChartXpert 2000 at the beginning of the study. An additional 24subjects were recruited for test-retest assessment.The secondtest for the test-retest assessment was performed the next dayfor the purpose of this analysis.
2.2. Acuity Testing (Thomson). The method for assess-ing Thompson VA has been described in another study[20]. A computer-generated LogMAR test chart was used(Thomson Test Chart 2000 Xpert displayed on an HPmonitor LV916AA2211 (resolution 1920 × 1080, luminance250 cd/m2, dynamic contrast ratio 3,000,000 : 1)), whichexceeds the minimum Thomson specifications (ThompsonSoftware Solutions, Hertfordshire, UK). Corrected distanceVA (CDVA) was measured at a viewing distance of 4m(direct). The Sloan Early Treatment Diabetic RetinopathyStudy (ETDRS) letterset was used for this test.Thepatient wasinstructed to read the line of letters, starting with the largestsize and continuing downwards until a line was reachedwhich was incompletely or incorrectly read.The letters of theline were randomized three times using the testing software’srandomization function and an average of three scores wastaken. CDVA was recorded as visual acuity rating (VAR).
2.3. Acuity (MiQ 720). CDVA was also measured using theMiQ 720 (part of the MiQ test Suite), a computerized testchart. The test is remotely controlled by the researcher usingan Apple iPad. The iPad display is mirrored on a HD LEDscreen or monitor.
In this study, an LG TV was used (HD LED, resolution1920 × 1080, contrast ratio 9,000,000, luminance 250 cd/m2).The viewing distance used was 4.05m direct. A dedicatedletterset and font type are used for this test, comprising theletters C, O, U, V, X, and Z. This letterset is designed to min-imize the well-known problems associated with interletter

Journal of Ophthalmology 3
Figure 1: An example of the algorithmically generated letter tripletfor testing VA. VA: visual acuity.
recognition for both acuity and contrast testing [25–27]. Theuse of a three-letter display provides further control over theinterletter recognition variability by reducing the size of theletter pool, whilst still enabling randomized letter generation.
Three randomized letters are presented using a com-puterized repetitive refinement algorithm. The first displaycomprises the very largest and the very smallest of theavailable letters within the test and an intermediate size. Thesmallest letter correctly read aloud by the subject is selectedby the examiner, by tapping the appropriate letter on the iPaddisplay, and the next algorithmically generated letter tripletis displayed. An example is shown in Figure 1. The process isrepeated until the termination line is reached and a results’page is displayed.
The algorithm is designed not only to considerably speedup the journey to the end point but also to equally speed upand increase the sensitivity of the testing procedure. This isenabled by allowing refinement at any level of the algorithm,as there will always be letters displayed above, below, andclose to acuity threshold. As the repetitive refinement algo-rithm is self-refining, no repeat testing or averaging of resultsis necessary, and results are immediately displayed withoutany requirement for the complex and slow adjustment of theresult inherent in the logMAR scoring system.
Results are generated in MiQ units (across a range from0 to 100 in steps of one decimal place). The results’ page alsodisplays the mathematical conversion to VAR, logMAR, andSnellen.
2.4. Contrast Sensitivity (Thomson). Letter CS was assessedusing the computerized LogMAR ETDRS test chart contrasttest (Test Chart 2000 Xpert; Thomson Software Solutions).The Sloan ETDRS letterset was displayed at the 6/24 (Snellen)size (approximating to 6 cycles per degree cpd) and subjectswere asked to read the letters aloud whilst fixating on thechart at a viewing distance of 4m (direct). The lettersetwas randomized during the test at each change of contrast.The percentage contrast of the letters was decreased to 0.15logCS steps until the lowest contrast value for which subjectssaw at least three letters was reached. Each letter has anominal logCS value of 0.03. Missed and incorrectly readletters at any contrast level were noted. The resultant logCSvalue for the subject was calculated by adding any extraletter(s) and/or subtractingmissed letters from the best logCSvalue corresponding to the lowest percentage contrast. Thisprotocol is the Pelli-Robson scoring system.
Figure 2: An example of the algorithmically generated letter tripletfor testing CS. CS: contrast sensitivity.
2.5. Contrast Sensitivity (MiQ). The MiQ Contrast 256 testwas performed on the LG TV described above. The viewingdistance used was 4.05m direct. A dedicated letterset andfont type are used for this test, comprising the letters A, C,E, H, N, R, S, and Z. Three randomized letters are presentedusing a computerized repetitive refinement algorithm. Theletters are displayed in negative contrast (light on dark) tominimize glare effects.The first display presents the first letterat the highest contrast of the available contrasts within the test(approximately 0.1 logCS), the third letter at a contrast belowthe threshold of visibility, and the second letter (central) at anintermediate contrast.
The lowest contrast letter correctly read aloud by the sub-ject is selected by the researcher who taps on the iPad display,and the next algorithmically generated letter triplet is dis-played (Figure 2). The process is repeated until the end pointis reached.
The contrast result is displayed in MiQ contrast units.Results are also displayed in the mathematical conversion tologCS and Weber contrast.
2.6. Statistical Methods. Statistical analyses were conductedusing SPSS 19.0 (SPSS, Inc., Chicago, Ilinois, USA) and thestatistical programming language R (R Foundation for Statis-tical Computing).
It is evident from previous studies that a sample of size50 often has acceptable power properties for this type ofagreement study [28, 29]. However, we increased the samplesize to 73 in our study and deliberately included subjects withconditions such as AMD (12 subjects) and cataract (8 sub-jects) in order to ensure a wide range of VA and CS scores forcomparison purposes. Volunteers for this study were notscreened for other ocular pathologies.
Due to the different scales of measurement from thetwo devices, ordinary least squares regression (OLS) wasused to convert CS scores from the MiQ scale into theThomson logCS scale. Agreement between these convertedlogCS estimates and actual Thomson logCS was then inves-tigated using standard agreement indices: accuracy coeffi-cient, precision coefficient, and the concordance correlationcoefficient (CCC); these indices are presented and explainedin the appendix below. The regression transformation, tothe Thompson scale, makes the means of the two variablesequal, and the accuracy component of agreement is affectedby this, but we still elected to use the CCC (of whichthe accuracy coefficient is a component) because we regard

4 Journal of Ophthalmology
Table 1: Agreement indices for measurement of CDVA and CS byThomson and MiQ devices.
Measure CCC Precision AccuracyCDVA 0.883 (0.83) 0.889 (0.84) 0.993 (0.97)CS 0.907 (0.87) 0.911 (0.87) 0.996 (0.98)CCC: concordance correlation coefficient; CDVA: corrected distance visualacuity; CS: contrast sensitivity; MiQ: MultiQuity.For each coefficient, the 95% lower confidence limit is shown in brackets(based on 𝑛 = 73 subjects).
it as the best single measure of agreement. The paired 𝑡-test for bias (often applied in agreement studies) becomesredundant, however, because the means are guaranteed to beequal. Lower confidence limits for concordance, precision,and accuracy coefficients were obtained fromR code suppliedwith Lin et al. [28]. The possible effect on agreement of age,gender, AMD, and cataract was investigated, using a generallinear model. Agreement was also investigated graphically;here, we preferred to use an ordinary scatterplot of the twovariables being compared (with line 𝑦 = 𝑥 super-imposed)rather than the more usual Bland-Altman plots with limits ofagreement displayed. In our experience, these simpler plotsare more effective in visually assessing agreement, becausethey are easier to understand and also because they graphi-cally depict what is being measured by the CCC.
We recruited a separate sample of 24 volunteers (withoutscreening for ocular pathologies) for purposes of test-reteststatistical analysis. The same statistical and graphical meth-ods were applied to investigate agreement betweenThomsonand MiQ devices and to investigate test-retest variability ofeach device. In test-retest analyses, however, each device iscompared with itself, and there is no need to transform fromthe MiQ scale to theThompson scale.
3. Results
Study subjects (𝑛 = 73) ranged in age from 21 to 80 years,and mean (±st. deviation) was 46.6 (±17.3) years. Forty-fivesubjects (61.6%) were males.
3.1. Agreement between Devices: CDVA. Agreement wasstrong between the two devices for CDVA. After conversionof MiQ VAR scores to Thomson VAR scores, via regression,we obtained the precision, accuracy, and concordance indicesreported in Table 1. The scatterplot of Thomson VAR andMiQ estimate ofThomsonVAR are presented in Figure 3.Theline of equality (𝑦 = 𝑥) has been overlaid on the plot, andthe closeness of the scatter of points to this line, through thewhole range ofVARvalues, demonstrates strong concordancebetween the two devices.
3.2. Agreement between Devices: CS. Agreement was strongbetween the two devices for CS. After conversion of MiQscores to Thomson logCS scores, via regression, we obtainedthe precision, accuracy, and concordance indices reported inTable 1. The scatterplot of Thomson logCS and MiQ estimateof Thomson logCS are presented in Figure 4. The line of
60.00
70.00
80.00
90.00
100.00
110.00
120.00
60.00 70.00 80.00 90.00 100.00 110.00 120.00
VAR (MultiQuity)
VAR
(Thom
son)
VAR: visual acuity rating.
Figure 3: Agreement between visual acuity rating from the Thom-son device and estimated visual acuity rating from the MiQ device.VAR: visual acuity rating.
CS: contrast sensitivity.
0.00 0.50 1.00 1.50 2.00
0.00
0.50
1.00
1.50
2.00
2.50
logC
S (Th
omso
n)
logCS (MultiQuity)
Figure 4: Agreement between log contrast sensitivity from theThomson device and estimated logCS from the MiQ device. CS:contrast sensitivity.
equality (𝑦 = 𝑥) has been overlaid on the plot, and thecloseness of the scatter of points to this line, through thewhole range of logCS values, demonstrates strong concor-dance between the two devices.
3.3. Effect on Agreement of Disability orDemographic Variables
3.3.1. CS. Agreement of CS scores from the two devices wasunassociated with any of these study variables: age; sex; AMDstatus; cataract status (general linear model, 𝑃 > 0.05 for all).
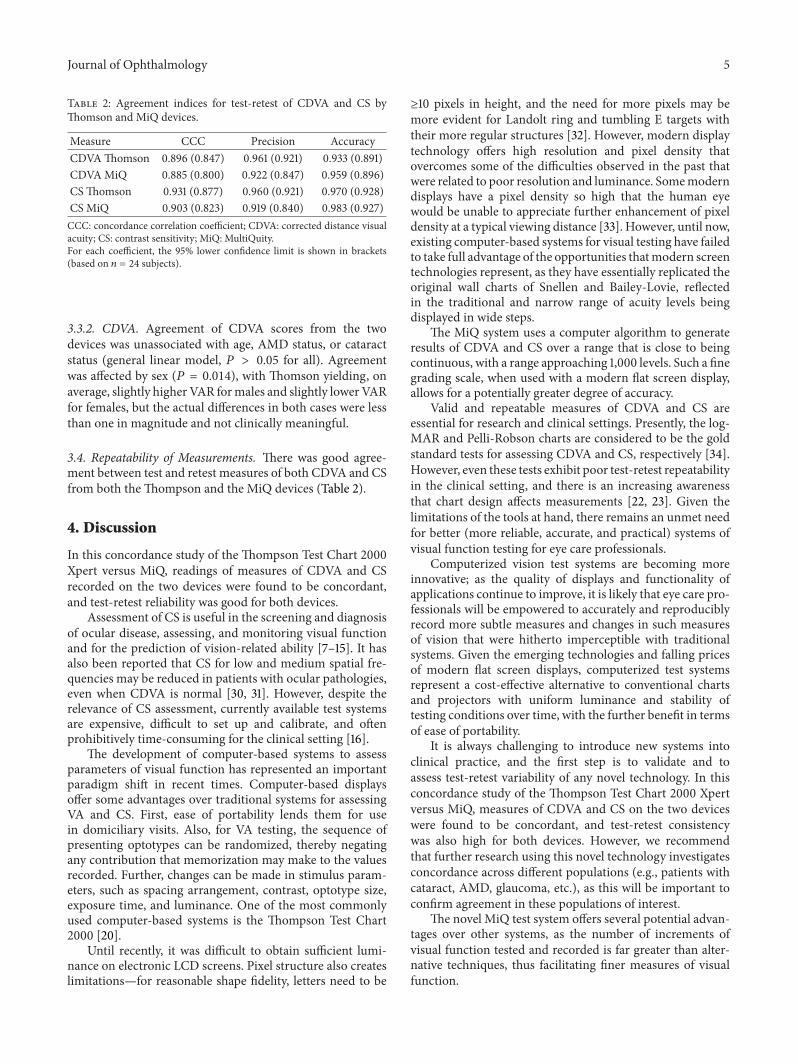
Journal of Ophthalmology 5
Table 2: Agreement indices for test-retest of CDVA and CS byThomson and MiQ devices.
Measure CCC Precision AccuracyCDVAThomson 0.896 (0.847) 0.961 (0.921) 0.933 (0.891)CDVAMiQ 0.885 (0.800) 0.922 (0.847) 0.959 (0.896)CSThomson 0.931 (0.877) 0.960 (0.921) 0.970 (0.928)CS MiQ 0.903 (0.823) 0.919 (0.840) 0.983 (0.927)CCC: concordance correlation coefficient; CDVA: corrected distance visualacuity; CS: contrast sensitivity; MiQ: MultiQuity.For each coefficient, the 95% lower confidence limit is shown in brackets(based on 𝑛 = 24 subjects).
3.3.2. CDVA. Agreement of CDVA scores from the twodevices was unassociated with age, AMD status, or cataractstatus (general linear model, 𝑃 > 0.05 for all). Agreementwas affected by sex (𝑃 = 0.014), with Thomson yielding, onaverage, slightly higher VAR formales and slightly lower VARfor females, but the actual differences in both cases were lessthan one in magnitude and not clinically meaningful.
3.4. Repeatability of Measurements. There was good agree-ment between test and retest measures of both CDVA and CSfrom both theThompson and the MiQ devices (Table 2).
4. Discussion
In this concordance study of the Thompson Test Chart 2000Xpert versus MiQ, readings of measures of CDVA and CSrecorded on the two devices were found to be concordant,and test-retest reliability was good for both devices.
Assessment of CS is useful in the screening and diagnosisof ocular disease, assessing, and monitoring visual functionand for the prediction of vision-related ability [7–15]. It hasalso been reported that CS for low and medium spatial fre-quencies may be reduced in patients with ocular pathologies,even when CDVA is normal [30, 31]. However, despite therelevance of CS assessment, currently available test systemsare expensive, difficult to set up and calibrate, and oftenprohibitively time-consuming for the clinical setting [16].
The development of computer-based systems to assessparameters of visual function has represented an importantparadigm shift in recent times. Computer-based displaysoffer some advantages over traditional systems for assessingVA and CS. First, ease of portability lends them for usein domiciliary visits. Also, for VA testing, the sequence ofpresenting optotypes can be randomized, thereby negatingany contribution that memorization may make to the valuesrecorded. Further, changes can be made in stimulus param-eters, such as spacing arrangement, contrast, optotype size,exposure time, and luminance. One of the most commonlyused computer-based systems is the Thompson Test Chart2000 [20].
Until recently, it was difficult to obtain sufficient lumi-nance on electronic LCD screens. Pixel structure also createslimitations—for reasonable shape fidelity, letters need to be
≥10 pixels in height, and the need for more pixels may bemore evident for Landolt ring and tumbling E targets withtheir more regular structures [32]. However, modern displaytechnology offers high resolution and pixel density thatovercomes some of the difficulties observed in the past thatwere related to poor resolution and luminance. Somemoderndisplays have a pixel density so high that the human eyewould be unable to appreciate further enhancement of pixeldensity at a typical viewing distance [33]. However, until now,existing computer-based systems for visual testing have failedto take full advantage of the opportunities thatmodern screentechnologies represent, as they have essentially replicated theoriginal wall charts of Snellen and Bailey-Lovie, reflectedin the traditional and narrow range of acuity levels beingdisplayed in wide steps.
The MiQ system uses a computer algorithm to generateresults of CDVA and CS over a range that is close to beingcontinuous, with a range approaching 1,000 levels. Such a finegrading scale, when used with a modern flat screen display,allows for a potentially greater degree of accuracy.
Valid and repeatable measures of CDVA and CS areessential for research and clinical settings. Presently, the log-MAR and Pelli-Robson charts are considered to be the goldstandard tests for assessing CDVA and CS, respectively [34].However, even these tests exhibit poor test-retest repeatabilityin the clinical setting, and there is an increasing awarenessthat chart design affects measurements [22, 23]. Given thelimitations of the tools at hand, there remains an unmet needfor better (more reliable, accurate, and practical) systems ofvisual function testing for eye care professionals.
Computerized vision test systems are becoming moreinnovative; as the quality of displays and functionality ofapplications continue to improve, it is likely that eye care pro-fessionals will be empowered to accurately and reproduciblyrecord more subtle measures and changes in such measuresof vision that were hitherto imperceptible with traditionalsystems. Given the emerging technologies and falling pricesof modern flat screen displays, computerized test systemsrepresent a cost-effective alternative to conventional chartsand projectors with uniform luminance and stability oftesting conditions over time, with the further benefit in termsof ease of portability.
It is always challenging to introduce new systems intoclinical practice, and the first step is to validate and toassess test-retest variability of any novel technology. In thisconcordance study of the Thompson Test Chart 2000 Xpertversus MiQ, measures of CDVA and CS on the two deviceswere found to be concordant, and test-retest consistencywas also high for both devices. However, we recommendthat further research using this novel technology investigatesconcordance across different populations (e.g., patients withcataract, AMD, glaucoma, etc.), as this will be important toconfirm agreement in these populations of interest.
The novel MiQ test system offers several potential advan-tages over other systems, as the number of increments ofvisual function tested and recorded is far greater than alter-native techniques, thus facilitating finer measures of visualfunction.

6 Journal of Ophthalmology
Notes
Current displays are vastly better than previously available;however, they still have limitations. HD LEDs have higherluminance and a lower contrast range than plasma displays(which are currently unavailable other than on expensive andvery large TV screens).The higher luminosity of LED screensnecessitates the need for close control over calibration.This isa direct consequence of theWeber-Fechner law, which is alsothe explanation for the poor results obtained when using theold CRT displays.
Appendix
Notation is as follows: variables 𝑋 and 𝑌, means Mean(𝑋)and Mean(𝑌), standard deviations SD(𝑋) and SD(𝑌), andcovariance Cov(𝑋, 𝑌). Consider
(1)Precision = Cov (𝑋, 𝑌)SD (𝑋) ∗ SD (𝑌)
. (A.1)
Precision is the ordinary Pearson correlation coefficient andmeasures the degree of scatter in the (𝑋, 𝑌) plot around thebest-fitting regression line. Consider
(2)Accuracy = 2
𝑤 + 1/𝑤 + V2, (A.2)
where 𝑤 = SD(𝑋)/SD(𝑌) and V = (Mean(𝑋) − Mean(𝑌))/√SD(𝑋) ∗ SD(𝑌).
Accuracy will be close to 1 if the two means are closein value and the two standard deviations are close in value.Consider
(3)Concordance = Precision ∗ Accuracy. (A.3)
Concordance will be close to one if precision and accuracyare both close to 1.
Abbreviations
HD: High definitionHD LED: The current state-of-the-art monitor displayLED: Light emitting diodeMiQ: MultiQuity.
Conflict of Interests
JohnM.Nolan, Stephen Beatty, GrahamO’Regan, andRobertKuchling are Directors of Sightrisk Ltd., the developingcompany of the MultiQuity tests described herein.
Acknowledgments
The authors would like to thank Professor James Loughmanfrom Dublin Institute of Technology for advice provided onthe study and testing procedure. Funding for this study wasprovided by Sightrisk Ltd., Waterford, Ireland.
References
[1] K. A. Turano, A. T. Broman, K. Bandeen-Roche, B. Munoz, G.S. Rubin, and S. K. West, “Association of visual field loss andmobility performance in older adults: salisbury eye evaluationstudy,” Optometry & Vision Science, vol. 81, no. 5, pp. 298–307,2004.
[2] S. J. Leat and G. C.Woo, “The validity of current clinical tests ofcontrast sensitivity and their ability to predict reading speed inlow vision,” Eye, vol. 11, part 6, pp. 893–899, 1997.
[3] J. M. Wood, “Age and visual impairment decrease drivingperformance as measured on a closed-road circuit,” HumanFactors, vol. 44, no. 3, pp. 482–494, 2002.
[4] S. K. West, G. S. Rubin, A. T. Broman, B. Munoz, K. Bandeen-Roche, and K. Turano, “How does visual impairment affect per-formance on tasks of everyday life? The SEE project,” Archivesof Ophthalmology, vol. 120, no. 6, pp. 774–780, 2002.
[5] I. U. Scott,W. J. Feuer, and J. A. Jacko, “Impact of visual functionon computer task accuracy and reaction time in a cohortof patients with age-related macular degeneration,” AmericanJournal of Ophthalmology, vol. 133, no. 3, pp. 350–357, 2002.
[6] L.-A. Lim,N.A. Frost, R. J. Powell, and P.Hewson, “Comparisonof the ETDRS logMAR, “compact reduced logMar” and Snellencharts in routine clinical practice,” Eye, vol. 24, no. 4, pp. 673–677, 2010.
[7] C. Owsley, “Contrast sensitivity,”Acta Ophthalmologica Scandi-navica, vol. 73, pp. 111–115, 1995.
[8] S. Datta, A. J. E. Foss, M. J. Grainge et al., “The importanceof acuity, stereopsis, and contrast sensitivity for health-relatedquality of life in elderly women with cataracts,” InvestigativeOphthalmology & Visual Science, vol. 49, no. 1, pp. 1–6, 2008.
[9] N. Bansback, C. Czoski-Murray, J. Carlton et al., “Determinantsof health related quality of life and health state utility inpatients with age related macular degeneration: the associationof contrast sensitivity and visual acuity,”Quality of Life Research,vol. 16, no. 3, pp. 533–543, 2007.
[10] M. D. Crossland, “The role of contrast sensitivity in patientswith low vision,”Optometry in Practice, vol. 5, pp. 105–114, 2004.
[11] A. S. Hawkins, J. P. Szlyk, Z. Ardickas, K. R. Alexander, and J.T. Wilensky, “Comparison of contrast sensitivity, visual acuity,and Humphrey visual field testing in patients with glaucoma,”Journal of Glaucoma, vol. 12, no. 2, pp. 134–138, 2003.
[12] D. B. Elliott and M. A. Hurst, “Simple clinical techniquesto evaluate visual function in patients with early cataract,”Optometry and Vision Science, vol. 67, no. 11, pp. 822–825, 1990.
[13] E. P. Stavrou and J.M.Wood, “Letter contrast sensitivity changesin early diabetic retinopathy,”Clinical and Experimental Optom-etry, vol. 86, no. 3, pp. 152–156, 2003.
[14] J. D. Trobe, R. W. Beck, P. S. Moke, and P. A. Cleary, “Contrastsensitivity and other vision tests in the optic neuritis treatmenttrial,” American Journal of Ophthalmology, vol. 121, no. 5, pp.547–553, 1996.
[15] M. S. Shaheen, T. H. Massoud, H. Ezzeldin, and M. A. Khalifa,“Four-year visual, refractive, and contrast sensitivity outcomesafter wavefront-guided myopic LASIK using an advancedexcimer laser platform,” Journal of Refractive Surgery, vol. 29,no. 12, pp. 816–822, 2013.
[16] K. Latham, “Who uses contrast sensitivity in optometric prac-tice?” Ophthalmic & Physiological Optics, vol. 18, pp. S2–S13,1998.

Journal of Ophthalmology 7
[17] A. P. Ginsburg, “A new contrast sensitivity vision test chart,”American Journal of Optometry & Physiological Optics, vol. 61,no. 6, pp. 403–407, 1984.
[18] J. H. Verbaken and A.W. Johnston, “Population norms for edgecontrast sensitivity,” The American Journal of Optometry andPhysiological Optics, vol. 63, no. 9, pp. 724–732, 1986.
[19] D. G. Pelli, J. G. Robson, and A. J. Wilkins, “The design of aletter chart for measuring contrast sensitivity,” Clinical VisionSciences, vol. 2, no. 3, pp. 187–199, 1988.
[20] K. Thayaparan, M. D. Crossland, and G. S. Rubin, “Clinicalassessment of two new contrast sensitivity charts,” BritishJournal of Ophthalmology, vol. 91, no. 6, pp. 749–752, 2007.
[21] A. Arditi, “Improving the design of the letter contrast sensitivitytest,” Investigative Ophthalmology & Visual Science, vol. 46, no.6, pp. 2225–2229, 2005.
[22] B. E. Dougherty, R. E. Flom, and M. A. Bullimore, “Anevaluation of themars letter contrast sensitivity test,”Optometryand Vision Science, vol. 82, no. 11, pp. 970–975, 2005.
[23] S. A. Haymes, K. F. Roberts, A. F. Cruess et al., “The lettercontrast sensitivity test: clinical evaluation of a new design,”Investigative Ophthalmology and Visual Science, vol. 47, no. 6,pp. 2739–2745, 2006.
[24] B. Khambhiphant, W. Tulvatana, and M. Busayarat, “The newnumbers contrast sensitivity chart for contrast sensitivity mea-surement,” Journal of Optometry, vol. 4, no. 4, pp. 128–133, 2011.
[25] K. R. Alexander, W. Xie, and D. J. Derlacki, “Visual acuity andcontrast sensitivity for individual Sloan letters,”Vision Research,vol. 37, no. 6, pp. 813–819, 1997.
[26] D. B. Elliott, D. Whitaker, and L. Bonette, “Differences in thelegibility of letters at contrast threshold using the Pelli-Robsonchart,” Ophthalmic and Physiological Optics, vol. 10, no. 4, pp.323–326, 1990.
[27] A. Colenbrander, “Measuring vision and vision loss,” inDuanesClinical Ophthalmology, vol. 5, 2001.
[28] L. Lin, A. S. Hedayat, andW.Wu, Statistical Tools for MeasuringAgreement, Springer, 2012.
[29] J. L. Dennison, J. Stack, S. Beatty, and J.M.Nolan, “Concordanceof macular pigment measurements obtained using customizedheterochromatic flicker photometry, dual-wavelength autofluo-rescence, and single-wavelength reflectance,” Experimental EyeResearch, vol. 116, pp. 190–198, 2013.
[30] K. Neelam, J. Nolan, U. Chakravarthy, and S. Beatty, “Psy-chophysical function in age-related maculopathy,” Survey ofOphthalmology, vol. 54, no. 2, pp. 167–210, 2009.
[31] R. A. Mitchell, “Contrast sensitivity in elderly subjects with adiagnosed ocular disease,” Optometry & Vision Science, vol. 70,no. 2, pp. 102–106, 1993.
[32] A. J. Jackson and I. L. Bailey, “Visual acuity,” Optometry inPractice, vol. 5, pp. 53–70, 2004.
[33] E. Hermann, iPhone 4 Retina Display: Better Than the HumanEye, 2010, http://boysoftech.com/iPhone 4 Retina Diplay.pdf.
[34] S. Plainis, P. Tzatzala, Y. Orphanos, and M. K. Tsilimbaris, “Amodified ETDRS visual acuity chart for European-wide use,”Optometry and Vision Science, vol. 84, no. 7, pp. 647–653, 2007.

Submit your manuscripts athttp://www.hindawi.com
Stem CellsInternational
Hindawi Publishing Corporationhttp://www.hindawi.com Volume 2014
Hindawi Publishing Corporationhttp://www.hindawi.com Volume 2014
MEDIATORSINFLAMMATION
of
Hindawi Publishing Corporationhttp://www.hindawi.com Volume 2014
Behavioural Neurology
EndocrinologyInternational Journal of
Hindawi Publishing Corporationhttp://www.hindawi.com Volume 2014
Hindawi Publishing Corporationhttp://www.hindawi.com Volume 2014
Disease Markers
Hindawi Publishing Corporationhttp://www.hindawi.com Volume 2014
BioMed Research International
OncologyJournal of
Hindawi Publishing Corporationhttp://www.hindawi.com Volume 2014
Hindawi Publishing Corporationhttp://www.hindawi.com Volume 2014
Oxidative Medicine and Cellular Longevity
Hindawi Publishing Corporationhttp://www.hindawi.com Volume 2014
PPAR Research
The Scientific World JournalHindawi Publishing Corporation http://www.hindawi.com Volume 2014
Immunology ResearchHindawi Publishing Corporationhttp://www.hindawi.com Volume 2014
Journal of
ObesityJournal of
Hindawi Publishing Corporationhttp://www.hindawi.com Volume 2014
Hindawi Publishing Corporationhttp://www.hindawi.com Volume 2014
Computational and Mathematical Methods in Medicine
OphthalmologyJournal of
Hindawi Publishing Corporationhttp://www.hindawi.com Volume 2014
Diabetes ResearchJournal of
Hindawi Publishing Corporationhttp://www.hindawi.com Volume 2014
Hindawi Publishing Corporationhttp://www.hindawi.com Volume 2014
Research and TreatmentAIDS
Hindawi Publishing Corporationhttp://www.hindawi.com Volume 2014
Gastroenterology Research and Practice
Hindawi Publishing Corporationhttp://www.hindawi.com Volume 2014
Parkinson’s Disease
Evidence-Based Complementary and Alternative Medicine
Volume 2014Hindawi Publishing Corporationhttp://www.hindawi.com