Embed Size (px)
Citation preview

Research ArticleMagnetic Biofilm Carriers: The Use of Novel Magnetic FoamGlass Particles in Anaerobic Digestion of Sugar Beet Silage
Patrice Ramm,1 Carsten Jost,1 Elisabeth Neitmann,2 Ulrich Sohling,2 Oliver Menhorn,3
Karl Weinberger,3 Jan Mumme,1 and Bernd Linke1
1 Leibniz Institute for Agricultural Engineering Potsdam-Bornim, Max-Eyth-Allee 100, 14469 Potsdam, Germany2 Clariant Produkte (Deutschland) GmbH, Ostenrieder Sta𝛽e 15, 85368 Moosburg, Germany3Dennert Poraver GmbH, Gewerbegebiet Ost, 92353 Postbauer-Heng, Germany
Correspondence should be addressed to Patrice Ramm; [email protected]
Received 30 September 2013; Revised 10 January 2014; Accepted 13 January 2014; Published 24 February 2014
Academic Editor: Yoon Y. Lee
Copyright © 2014 Patrice Ramm et al. This is an open access article distributed under the Creative Commons Attribution License,which permits unrestricted use, distribution, and reproduction in any medium, provided the original work is properly cited.
The use of recently developed magnetic foam glass particles for immobilization of microbial biomass was tested. The effect of theparticles was illustrated at the production of biogas from sugar beet silage as the sole substrate. Lab-scale fermentation experimentswere conducted using a mesophilic completely stirred tank reactor and a magnetic separator. Microscopic analysis revealed biofilmcoverage of 50–60%on the surface of the particles within 110 days. It was possible to recover 76.3% of the particles from fermentationeffluent by means of a separation procedure based on magnetic forces. Comparing a particle charged reactor with a control reactorshowed a small performance gain. The methane rate was increased from 1.18 ± 0.09 to 1.25 ± 0.06 L L−1 d−1 and the methane yieldwas increased from 0.302 ± 0.029 to 0.318 ± 0.022 L g−1 (volatile solids) at an organic loading rate of 3.93 ± 0.22 g L−1 d−1 (volatilesolids). Maximum methane rates of 1.42 L L−1 d−1 at an organic loading rate of 4.60 g (volatile solids) L−1 d−1 (reactor includingmagnetic particles) and 1.34 L L−1 d−1 at 3.73 g L−1 d−1 (control reactor) were achieved. Based on the results, it can be concludedthat the use of magnetic particles could be an attractive option for the optimization of biogas production.
1. Introduction
Bioenergy, including the production of biogas, is currentlythe largest renewable energy source. In 2008, biomass pro-vided about 10% (50.3 EJ/yr) of the global primary energysupply.The potential deployment levels of biomass for energyby 2050 could be in the range of 100 to 300 EJ and 80 to 90%reduction of greenhouse gas compared to the use of fossilenergy is possible [1].
Research and development including more sustainablefeedstock and conversion technologies, increased conversionefficiency, and overall chain optimization are necessary toexploit this potential [1].
In the field of biogas production, a lot of different tech-nologies were developed, depending on the characteristics ofthe input materials. For the anaerobic digestion of slurries,energy crops, or the organic fraction of municipal solidwaste, the completely stirred tank reactor (CSTR) representsa proven and widely spread technology [2].
One limiting factor in anaerobic digestion is the con-centration of microbial biomass inside the reactor. This isin particular relevant for low-solids substrates such as sugarbeet silage which lead to short retention time [3]. Becauseof slow growth [4], especially the concentration of Archaearesponsible for methane production is small [3].
In order to increase the microbial biomass, differentimmobilization techniques can be applied [5]. These tech-niques can consist of additional technical installations outsidethe reactor, for example, sedimentation tanks or membranefiltration, or the use of special types of reactors, for exam-ple, upflow anaerobic sludge blanket (UASB) reactors andexpanded granular sludge blanket (EGSB) reactors, anaerobicfilters (AF), or fluidized-bed-reactors (FBR). These tech-niques often show certain disadvantages, or they are limitedto a small range of substrates. The membrane filtrationmethod shows the risk of blockage due to biofouling [6],besides the effect that anaerobic microorganisms are exposedto higher stress levels during the process of filtration [7].
Hindawi Publishing CorporationJournal of Renewable EnergyVolume 2014, Article ID 208718, 10 pageshttp://dx.doi.org/10.1155/2014/208718

2 Journal of Renewable Energy
A sedimentation tank has specific space requirements [8].Fixed biofilm techniques, AF or FBR, are used commonlyfor substrates showing very low solids contents, for example,waste water [9]. The range of substrates treatable in EGSBand UASB reactors is limited, because the formation ofcell aggregates inside these reactors is connected to certainconditions such as hydrodynamics [5].
A relatively new approach for the immobilization ofbiomass in bioreactors is the application ofmagnetic particlesserving as carriers for biofilm. This technique could providesome advantages to other techniques, as it is expected to becompatible with a broad range of substrates and applicable tocommon reactors such as the proven and versatile CSTR.Theapplication of this technique is possible if the fermentationliquor’s viscosity is not too high; further, the liquor may notcontain long fibers or similar disturbing solids.
Hellman et al. [10] investigated the magnetic immobiliza-tion of biomass. Among three differentmaterials, that is, iron,magnetite, and polystyrene,magnetite particles (approximatesize 50 𝜇m) were found to be the most promising carrier.Themagnetite particles showed an extensive colonization, withpreferential adhesion of hydrogenotrophic Methanobacteri-ales. However, an increased methanogenic performance ofwastewater sludge digestion was not observed. The authorsassume that the magnetic particles had improved the condi-tions for syntrophic acetogenesis andmethanogenesis.These,however, were not the rate-limiting steps in the anaerobicdigestion of wastewater sludge, but hydrolysis.
Similar studies with faster hydrolysable substrates are notknown.
Aim of this study was to determine the feasibility ofnovel magnetic foam glass particles (MFGPs) for the immo-bilization of microbial biomass in a CSTR. Sugar beet silagewas chosen as an easily hydrolysable substrate for anaerobicdigestion by means of the CSTR.
The individual objectives were (1) to investigate thetechnical feasibility of a CSTR charged with MFGPs, (2)to observe the formation of biofilm on the surfaces of theMFGPs, (3) to determine the effects ofMFGPs on the processbehavior, and (4) to evaluate performance parameters of aMFGP-charged CSTR fed with sugar beet silage as the solesubstrate.
2. Materials and Methods
2.1. Magnetic Foam Glass Particles (MFGPs). Several studieshave shown that porous glass is a good carrier for biofilms[11–13].
The particles used in this study were recently devel-oped by the companies Clariant Produkte (Deutschland)GmbH (Moosburg, Germany) and Dennert Poraver GmbH(Postbauer-Heng, Germany) in collaboration with the Leib-niz Institute for Agricultural Engineering Potsdam-Bornime.V. (Potsdam, Germany).The particles were made of foamedsoda-lime silicate glass with a porous surface. Magnetic ironpowder, Bayoxide E AB 21 (LANXESS Deutschland GmbH,Krefeld, Germany), was melt into the foam glass duringthe manufacturing process to attain magnetisable particles.
Bayoxide E AB 21 is a pigment and coloring agent and itincludes 97.5% Fe
2
O3
and 50 ppm heavy metals (Cu, Pb,Hg, and Cd). In addition to the iron powder, recycled glass,binding and expansion agents, and water were added to theproduction process. An expansion of the particles during thedrying process leads to a fine-pored surface. Table 1 containsdata describing the MFGPs used.
For reasons of simplicity, the particles are calledmagneticparticles. Indeed, the particles are not permanentlymagnetic,as the process cannot work with particles which aggregateto permanent lumps. Magnetisable particles is the moreappropriate designation for the particles. Only in a strongmagnetic field, the used particles become magnetic. As soonas the magnetic field is removed, the particles lose theirmagnetism.
As the used particles are still at the development stage,reasonable statements according to the costs of the usedmagnetic particles are not possible at this point.
2.2. Feedstock and Nutrient Supplements. The sole substrateused in these experiments was sugar beet silage (Beta vulgarissubsp. vulgaris). The beets were harvested in the region ofBarsinghausen/Groß Munzel, Germany, in 2009, chopped,mashed, and ensiled.
Two different charges of this sugar beet silage wereobtained and stored immediately before starting the periodsof the experiment, start-up, and regular operation. Charge1 was ensilaged for 22 weeks and then stored in a 1000 Lintermediate bulk container without cooling. As the sugarbeet silage of charge 1 showed signs of degradation, it wasdiscarded and charge 2 was obtained before starting theregular operation period. Charge 2 was ensilaged for 8 weeksand then stored at 4∘C in airtight 60 L plastic barrels to avoidpremature aging of the substrate.The storage method appliedto charge 2 caused a much higher stability of the silage.Specific data of the sugar beet silage is shown in Table 2. Thepresented valueswere averaged over thewhole correspondingexperimental period, 125 days of start-up and 93 days ofregular operation.
The potential biogas and methane yields of the sugar beetsilage were determined by conducting a fermentation testaccording to the guideline “VDI-Richtlinie 4630” [14]. Basedon two repetitions, the biogas and methane potentials were0.831±0.029m3 biogas per kg volatile solids (VS), respectively0.407 ± 0.022m3 methane per kg VS at charge 1 and 0.763 ±0.001m3 biogas per kg VS, respectively 0.327 ± 0.003m3methane per kg VS at charge 2. Weiland [2] reported sugarbeet biogas yields of 0.730 to 0.770m3 (kgVS)−1. In the guideto biogas [15] values of 0.580 to 0.676m3 biogas per kg VSand 0.314 to 0.367m3 methane per kg VS are stated as biogasand methane potentials for sugar beet. According to that, thedetermined yield is in the range of expectations.
Different sugar beet silage can affect the methanogenicperformance significantly [16]. Further, the different methodof storage of the used substrate charges caused differences inquality, as shown in Table 2. To avoid interference betweenthe influence of the MFGPs and the effects caused by

Journal of Renewable Energy 3
Table 1: Specification of the magnetic foam glass particles.
Parameter Value Analytical system
Particle diameter range (mm) 0.1–0.3 Mastersizer 2000 and Scirocco 2000 (MalvernInstruments, Worcestershire, UK)
Mean pore diameter (nm) 72.37
Pascal 440 (Thermo Electron Corporation, Waltham,USA)
Total porosity (—) 0.57Bulk density (kgm−3) 0.88 × 10³
Apparent density (kgm−3) 2.05 × 10³
Total cumulative volume (m3 kg−1) 6.50 × 10⁻⁴
Total specific surface area (m2 kg−1) 3.51 × 10⁴
BET surface area (m2 kg−1) 9.64 × 10² ASAP 2020 (Micromeritics, Aachen, Germany)Magnetic volume susceptibility (—) 5.25 × 10⁻³ FMA 5000 (FORGENTA, Berlin, Germany)Zeta potential (mV) in 1mM TRIS-buffersolution −60.3 Zetasizer 3000 HSA (Malvern Instruments,
Worcestershire, UK)
Table 2: Chemical analysis of the sugar beet silage.
Parameter Charge 1 Charge 2pH (—) 3.41 ± 0.10 3.36 ± 0.06Conductivity (mS cm−1) 3.14 ± 3.10 1.35 ± 0.97TS105
∘C (% FM) 18.09 ± 0.92 19.05 ± 0.40VS550
∘C (% TS) 69.77 ± 4.72 79.16 ± 0.57Acetic acid (g (kg FM)−1) 10.77 ± 4.60 8.16 ± 0.58Propionic acid (g (kg FM)−1) 0.62 ± 0.47 0.15 ± 0.04Sum of VFA C2–C6 (g (kg FM)−1) 11.89 ± 5.41 8.40 ± 0.69Ethanol (g (kg FM)−1) 19.30 ± 8.78 8.40 ± 0.59Propanol (g (kg FM)−1) 1.14 ± 0.34 1.20 ± 0.35Lactic acid (g (kg FM)−1) 24.95 ± 6.08 20.61 ± 1.42NH4-N (g (kg FM)−1) 0.067 ± 0.006 0.075 ± 0.012NKjel (g (kg FM)−1) 1.359 ± 0.028 1.442 ± 0.125Sugar content (g (kg FM)−1) 37.95 ± 9.07 44.91 ± 4.05COD (g (kg FM)−1) 136.52 ± 15.91 167.51 ± 3.61
the change of substrate on the methanogenic performance,the reactors were shut down before regular operation.
The higher stability reached charge 2 while storing shouldminimize the possibility that variance in the methanogenicperformance of the reactors is caused by the quality of thesubstrate. As both fermenters were always fed with sugar beetsilage of the same charge and the same age, an influenceon the performance of the fermenters is unlikely, too. Inaddition, only the values of the regular operation period withits optimized setup are used for evaluation.
According to Weiland [2], the C/N ratio should be in therange between 15 and 30. Since the used sugar beet silagehad a C/N ratio of 44.4 ± 6.2 (determined only at charge2), the addition of N was necessary. The optimum growthconditions for Methanosaeta concilii, which is the mostammonia-sensitive methanogen, are in the range of 250–1100mg ammoniumnitrogen (NH
4
-N) per liter fermentationliquor [16]. Accordingly, the concentration of NH
4
-N insidethe reactors was adjusted to 500mg NH
4
-N L−1. Therefore,
a 1 : 1 mixture of ammonium bicarbonate (NH4
HCO3
) andammonium carbamate (NH
4
COONH2
) (Roth, Karlsruhe,Germany) dissolved in tap water was used.The given volumeand the NH
4
-N concentration of the solution depended onthe corresponding NH
4
-N values of the sugar beet silage.Thetotal solids (TS) content of the total feeding was set to 5%fresh mass (FM) by adjusting the volume of the ammoniumcarbonate solution, total feeding being defined as the sumof sugar beet silage and ammonium carbonate solution. Theconcentration of NH
4
-N of the total feeding was set to 1 g L−1by varying the concentration of NH
4
-N of the ammoniumcarbonate solution.
To ensure a sufficient supply of trace elements, a traceelement solution was prepared according to the recipe DSMZ144 provided by Deutsche Sammlung von Mikroorganismenund Zellkulturen but in a 5-fold concentration. The solutionwas fed in a ratio of 0.01mL per g VS (fed sugar beet silage)as recommended by Abdoun and Weiland [17].
2.3. Experimental Setup. For testing the magnetic immobi-lization technique, corresponding setup was used consistingof two identical CSTRs, one of which was used for referencepurposes. The setup of the used CSTR system is shown inFigure 1.
The reactors were made of acrylic glass, had a workingvolume of 50 L, and were equipped with a heating jacket anda stirrer for homogenization of the fermentation liquor.Threeoutlets in different heights of 2.3 cm, 15.8 cm, and 32.5 cmabove the reactor bottom were used to remove fermentationliquor.
Feeding and stirring were automatically operated by anelectronic control program. This program facilitated contin-uous feeding. Different algorithms of stirring were tested.Effluent was released continuously from the midlevel outletby means of an overflow pipe.
The organic loading rate (OLR) was related to the cor-rected VS content VScorr. VScorr was defined as the sum of VS,volatile fatty acids (VFA), lactic acid, and alcohols.
The magnetic immobilization reactor (MR) was chargedwith the magnetic particles and equipped with a magnetic

4 Journal of Renewable Energy
MpH,Temp.
SubstrateBiogas Controlling
program
Sample Effluent
RecoveredMFGPs
Magnetic separator
CSTR
Figure 1: CSTR reactor system; components in cursive letteringwere only used at the reactor including magnetic immobilization(MR).
separator (Figure 1). The initial concentration of MFGPsinside the reactor was set to 1% w/w. The magnetic separatorwas a common Liquimag LM9-E-050-7 by S + S Separationand Sorting Technology GmbH (Schonberg, Germany), atool widely used in food processing to protect products frommetallic contamination.The second reactor was employed ascontrol reactor (CR). The CR served as reference, did notcontain any MFGPs, and was not equipped with a magneticseparator.
2.4. Reactor Start-Up and Operation. Besides the magnetictechnique, both reactors were operated identically. The sub-strate sugar beet silage (charge 1 while start-up and charge2 in regular operation) was digested continuously underanaerobic and mesophilic conditions. The temperature waskept at 41∘C since Demirel and Scherer achieved successfuldigestion of sugar beet silage at a temperature between 41 and42∘C [16].
For the start-up, both reactors were inoculated with col-lected fermentation effluent fromother experimental reactorsoperated undermesophilic conditions at the Leibniz Institutefor Agricultural Engineering Potsdam-Bornim. During thefirst 35 days of operation, the organic loading rate wasincreased from 1.0 to 4.0 gVScorr L
−1 d−1. The level of 4.0 wasthen kept for 40 days. Consecutively, from days 75 to 125,the OLR was lowered to 1.0 gVScorr L
−1 d−1 using steps of1.0 gVScorr L
−1 d−1. During the start-up, only trace elementswere added to the feed.TheMFGPs were introduced into theMR on day 15. A stable biofilm should develop on the surfacesof the MFGPs during the start-up.
After the start-up, the OLR of the reactors was increasedin steps of approximately 0.5 from 1.0 to 4.6 gVScorr L
−1 d−1until the digestion process reached its limit of capacity atthe control reactor. During regular operation, both the trace
element solution and the ammoniumcarbonate solutionwerefed to CSTRs. The trace element solution was mixed intothe beet silage, whereas the ammonium solution was feddirectly to the reactors. Adding the ammonium carbonatesolution at the beginning of the regular operation caused areduction of the hydraulic retention time (HRT) from 79 to31 days (OLR 1.5 gVS
𝑐𝑜𝑟𝑟
L−1 d−1). The added volume of theammonium carbonate solution depended on the OLR andwas raised from 1000 to 2800 g d−1 during the experiment. Inthe end of the experiment, aHRTof 11 dayswas reached (OLR4.6 gVS
𝑐𝑜𝑟𝑟
L−1 d−1).Beginning at day 197, silicone antifoaming emulsion
(Roth, Karlsruhe) with a concentration of 0.06 g (L reactorvolume)−1 was added to both reactors in intervals of 3 to 9days.
The MFGP-containing effluent liquor of the MR wascontinuously flushed through the magnetic separator. Theused separator had to be operated manually. In order torecover the separated MFGPs, the insert of the separatorwas removed. The magnetic rods were removed from theinsert and the MFGPs were flushed with MFGP-clearedeffluent liquor. Finally, the separated particles were returnedto the MR. This recovery procedure was executed onceevery day. The addition of the ammonium solution duringregular operation caused an increase of the effluent liquorthat had to be separated from MFGPs. It was not possible toreduce the interval of recovering due to the time demandingprocess of manual operation. Instead, the effluent leaving theseparator was stored for posttreatment every day during theregular operation period. The posttreatment was conductedby moving the magnetic insert of the separator through thestored effluent several times until nomore recovery ofMFGPswas visible.
2.5. Analytical Methods. The performance and stability ofthe reactors was monitored by daily detection of pH (pHcombined electrode Xerolyt HA 405-DXK-58/425, MettlerToledo) and biogas production (multi-chamber rotor gasmeter TG 05, Ritter Apparatebau GmbH & Co. KG). Thecompounds of the produced biogas were analyzed daily bygas analyzer SSM 6000 (Pronova Analysentechnik GmbH& Co. KG). To obtain the volumetric methane rate, thedaily methane production was related to the effective reactorvolume.Themethane yield was related to the total amount offed volatile solids VS
𝑐𝑜𝑟𝑟
(the sum of VS, VFA, lactic acid, andalcohols) in accordance with the calculation of the OLR.
The fermentation liquor of both reactors was sampledonce a week. Concentrations for NH
4
-N, nitrogen (NKjel),C2
–C6
VFA, and lactic acid were determined, employing thefollowing methods:
NH4
-N: conversion into NH3
by steam distillationand back-titration according to VDLUFAMethoden-buch volume 3, chapter 4.8.2 [18];NKjel: method by Kjeldahl according to DIN EN25663: 1933-11;C2
–C6
VFA: gas chromatographic analysis, GC 8360Carlo Erba (Fisons Instruments), column DB-FFAP

Journal of Renewable Energy 5
(length 30m, diameter 0.53mm, film thickness0.25 𝜇m), and flame ionization detector;lactic acid: high-performance liquid chromatography,DIONEX ULTIMATE 3000 (Thermo Scientific, Sun-nyvale, USA), column Eurokat H (length 300mm,diameter 8mm, film thickness 10 𝜇m) and detectorSHODEX RI-101 (Showa Denko, Tokyo, Japan).
The ratio of volatile organic acids to total inorganic car-bon (VOA/TIC) of the fermentation liquor was determinedby titration with 0.05 molar sulphuric acid according to theNordmann method [19].
With respect to the MR, the magnetic volume sus-ceptibility (𝑋
𝑉
) of the reactor effluent was determined inintervals of 2 to 21 days using a Forgenta magnetic analyserFMA 5000 (FORGENTA Forschungstechnik—und Gerate-Entwicklung, Berlin, Germany). In order to determine themagnetic separation efficiency, the reactor effluent was mea-sured before and after passing the magnetic separator. Relat-ing the values of magnetic susceptibility to the concentrationof MFGPs inside the reactor effluent (𝑐MFGP) was facilitatedby means of a calibration function
𝑋𝑉
= 2.1539 ∗ 10−7 ∗ 𝑐MFGP − 2.725 ∗ 10−9,
𝑅2 = 0.9965.(1)
The calibration function was determined by adding definedamounts of MFGPs to MFGP-free effluent taken out of theCR and measuring the magnetic susceptibility.
The development of biofilm formation on the MFGPsand the structure of these biofilms were monitored by meansof phase-contrast and fluorescence microscopy. Microscopicanalysis was conducted in intervals of approximately 4 weeksbeginning at day 40 of the experimental period.
Fluorescence of the presentmicroorganismswas obtainedby staining nucleic acids with the green fluorescent dye SYTO13 (excitation 450–490 nm) and stimulating the autofluores-cence of methanogenic Archaea by UV-light at an excitationof 359–371 nm. Autofluorescence appears, if coenzyme F
420
,a coenzyme involved in redox reactions in methanogenicmicroorganisms [20], is present and points to the activity ofthese organisms.
The microscopic analyses were conducted under exclu-sion of air by means of the gas Protectan (Tetenal, Norder-stedt, Germany). For each microscopic analysis, the MFGPsincluded in 4mL of sampled fermentation liquor were sep-arated manually by means of small magnet and washed 7times in 15mL of 0.01MNa-Hepes buffer with pH 7.5 (Sigma-Aldrich, St. Louis, USA). After washing, the MFGPs werestained with SYTO 13 (Molecular Probes, Oregon, USA) andincubated for 10minutes. A 500𝜇Mstock solution of SYTO 13and dimethylsulfoxide (Sigma-Aldrich, St. Louis, USA) wasused in final concentrations of 1 to 10𝜇M, depending on theintensity of the biofilm formation. After staining, the MFGPswere transferred into aMicroLife-slide (GlaswarenfabrikKarlHecht, Sondheim in der Rhon, Germany). The used slideshad chamber depths of 0.25–2.0mm. Finally the microscopicanalysis was conducted by using a Zeiss Axiostar plus FL,
the objectives Zeiss EC “Plan-Neofluar” 5x/0.16 Ph1 (𝑎 =18.5mm), Zeiss EC “Plan-Neofluar” 20x/0.5 Ph2 (𝑎 =2.0mm) and Zeiss LD “Plan-Neofluoar” 63x 0.75 Korr Ph2with extra long operating distance (𝐷 = 0–1.5, 𝑎 = 2.2mmat 𝐷 = 0 and 𝑎 = 1.2mm at 𝐷 = 1.5), Zeiss AxioCam MRc5,and the program Carl Zeiss AxioVision 4.8 (Carl Zeiss, Jena,Germany).
3. Results and Discussion
3.1. Technical Aspects of the Magnetic Immobilization Tech-nique. Prior to the fermentation experiments, the separator’sremoval efficiency was tested using untreated MFGPs andxanthan in water solutions (mass ratio 1 : 400 and 1 : 1000) asartificial fermentation liquor.The viscosity of the used liquorswas determined by means of a rheometer MC1/RM300(Parr, Illinois, USA) and the cylinder system Z10. It wasobserved, that the 1 : 1000 solution had a similar viscosity asthe fermentation liquor, whereas the viscosity of the 1 : 400solution showed values twice as high than the viscosity of thefermentation liquor.
These experiments were presented in Thomas [21] andthe major results are listed below. At a MFGP concentrationof 1% and a flow rate through the magnetic separator of1.8m3 h−1, the recovery rates were 26.7% (1 : 400 solution),50.6% (1 : 1000 solution), and 72.8% (tapwater). By increasingthe number of separation cycles from one to five and ten, therecovery improved to 44.1% and 53.9% (1 : 400 solution) andto 96.7% and 99.1% (tap water).
The viscosity of the liquor was found to be a strong influ-ence on the recovery. To achieve a satisfactory performanceof the magnetic separation of the used particles, the values ofthe liquor’s viscosity should not exceed the values measuredat the 1 : 1000 xanthan-water solution. As the used liquorswere non-Newtonian fluids, their viscosity is characterizedby values of the dynamic viscosity at different shear velocities.At the 1 : 1000 xanthan-water solution values of 0.024 Pa s (at20 s−1), 0.016 Pa s (at 50 s−1), 0.019 Pa s (at 100 s−1), 0.022 Pa s(at 200 s−1), and 0.038 Pa s (at 300 s−1) were measured for thedynamic viscosity.
Based on these results, the magnetic separation efficiencywas regarded as being sufficient for the purpose of the presentwork.
Looking at the fermentation experiments, magnetic sus-ceptibility measurement revealed that the reactor’s effluentliquor, which was continuously fed to the magnetic separatorby means of an overflow pipe, contained only 0.36 ± 0.24%w/w (start-up) and 0.08±0.02%w/w (regular operation fromday 126 to day 218) of MFGPs. This gap between the initialset point of 1% w/w was found to be mainly caused by strongsedimentation effects inside the reactor. Sedimentation likelyinterfered with the formation and metabolism of MFGP-bound biofilms. By the end of the experiment, effluent wassampled directly from the lower, the middle and the upperoutlet (the outlets were placed 2.3, 15.8 and 32.5 cm abovereactor bottom)while stirring at 10 rpm.The effluents showedMFGP concentrations of 0.15, 0.10 and 0.10% w/w (lower,middle and upper outlet; values from single measurement).
6 Journal of Renewable Energy
A period of 10 minutes without stirring caused a remarkablegradient. Effluent liquor from the lowest outlet showed aconcentration of 0.80%, whereas liquor from the middle andupper outlet had only 0.25 and 0.17% of MFGPs.
MFGPs were lost during operation of the MR. Using themagnetic separator’s feed concentration as basis, the singlestage separation efficiency was 89.5 ± 11.3% (start-up) and39.1 ± 10.7% (regular operation). By means of a manualsecond stage separation, the recovery was increased to 76.3%(single measurement value) during regular operation. Theloss of MFGPs accumulated to 59% during the conductedexperiment.
Formation of foam up to a height of 7.5 cm above theliquid level inside theCR required an adjustment of stirring atday 168; theMR showed no formation of foam. Removing thefoam was possible by resetting stirring from intervals of 180 sat a rotational speed of 25min−1 divided by breaks of 300 s topermanent stirring at a rotation speed of 10min−1. Stirringwas reset at both reactors. Formation of foam increasedduring further operation up to heights of 15 cm (CR) and2.5 cm (MR) above the liquid level despite the stirring. Usingantifoaming emulsion beginning at day 198 successfullyprevented the formation of foam.
Based on these observations, it can be concluded thatboth spatial distribution and magnetic separation of theMFGPs need further optimization.
The particles showed a strong tendency for sedimentationon the bottom of the reactor. Stirring caused accumulation ofparticles in the center of the reactor volume. A homogenousdistribution of particles inside the reactor volume was hardto reach because of these effects. If a more homogenousdistribution is aspired, the density of the MFGPs has to beadjusted. On the other hand, it was possible to keep theparticles in certain areas of the reactor by using these effects.To keep particles at areas that are distant to the reactor outlet,could offer an interesting option to improve the MFGPsretention and to reduce the size of the magnetic separator.
The achieved recovery grades of magnetic separationsusing the magnetic separator Liquimag LM9-E-050-7 werenot high enough to prevent high losses of MFGPs duringthe conducted experiment because the losses cumulate withevery following separation. Reducing these losses is possi-ble by increasing the efficiency of the magnetic separationprocedure. The magnetic force that is acting on a magneticparticle inside a magnetic field is linearly correlated with themagnetic volume susceptibility and the volume of the particle[22]. According to that, the performance of the magneticseparation procedure could be improved by adapting theproperties of the used MFGPs. The use of another magneticseparator that is better suited for the intended purposethan the used common separator could also increase theseparation efficiency. In addition, lost particles should besubstituted during the operation of the reactor.
3.2. Biofilm Formation. TheMFGPs inside theMR promotedthe growth of a distinctive biofilm. Microscopic analyses onday 110 (start-up phase) showed average biofilm coverage ofthe MFGP surface of 50–60%. Colonization was found tostart at protected areas such as cracks and holes.
Later, on day 170, average coverage increased up to 90%and an intensely covered MFGP is shown in Figure 2. Themicroorganisms were embedded in a slime matrix with athickness of up to 42𝜇m. Extensive colonization was verifiedbymeans of SYTO 13. Furthermore, UV excitation confirmedthe presence of methanogenic cofactor F
420
at multiple loca-tions of each particle. This, consequently, provides evidenceto the hypothesized growth of methanogenic biofilms onmagnetic foam glass particles.
The duration of approximately 3 to 4 months requiredfor effective coverage of the particles is within the rangedetermined in other studies. According to a literature reviewby Escudie et al. [23] on anaerobic biofilm reactors, thestart-up period for extensive biofilm formation usually variesbetween 2 and 9 months.
The general growth [24] and the microbial community[25] of biofilm on carriers are depending on physicochemicalsurface properties of the carriers.
Total adhesion free energy between a microorganismand a surface [26], the surface charge [27], hydrophobic-ity [28], total surface energy, and surface roughness [25]were determined as important factors in the adhesion ofmicroorganisms. Porosity was found to be one of the mostimportant influencing factors of biofilm formation [24]. Silvaet al. [29] showed that shape and mean pore diameter areimportant factors, impacting the adherence of biomass ondifferent support materials (polyurethane foam, vegetal car-bon, low-density polyethylene, and alumina-based ceramics).Increased biomass adherence was observed especially at highmean pore diameter (543 𝜇m). An irregular shape (vegetalcarbon pellet) seems to be advantageous.
The carriers used in this study showed a homogenousspherical shape, total porosity of 0.57, a negative surfacecharge (a zeta potential of −60.3mV), and a mean porediameter of 72 nm. There may be considerable potential forfurther improvement of the magnetic carriers used in thisstudy. Variation of the physicochemical properties of the usedMFGPs could accelerate the formation of biofilm on theirsurface. The evaluation of suitable modification of the usedMFGPs will be the objective of further studies.
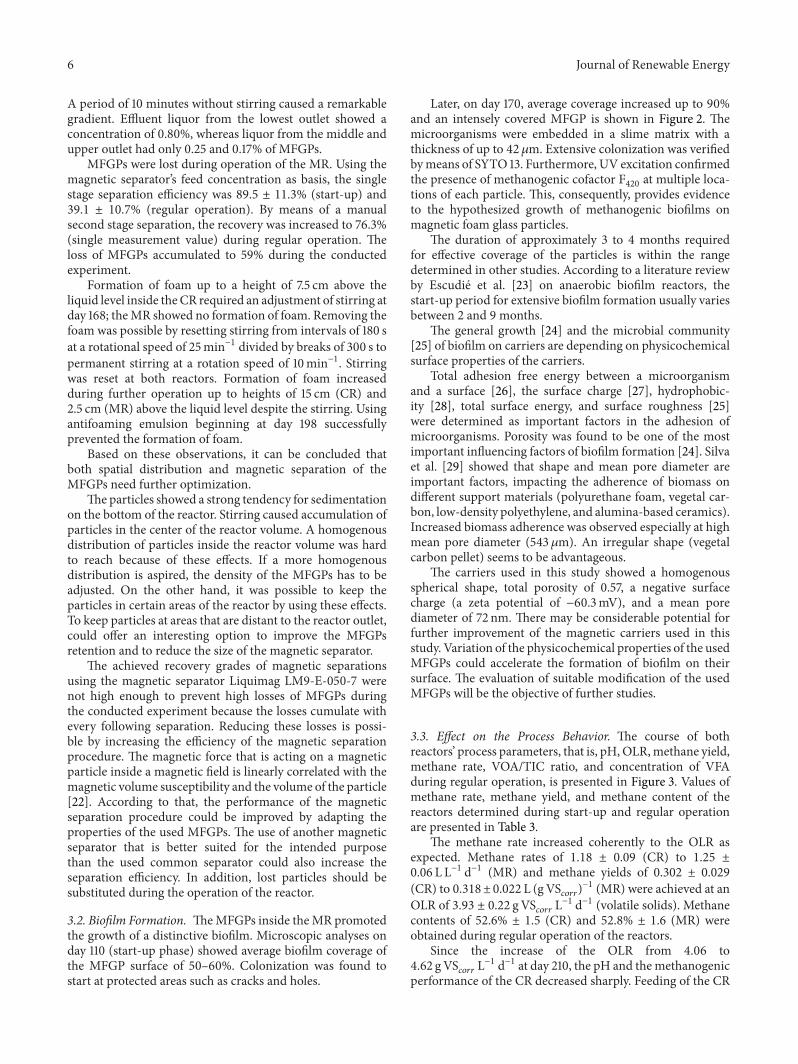
3.3. Effect on the Process Behavior. The course of bothreactors’ process parameters, that is, pH,OLR,methane yield,methane rate, VOA/TIC ratio, and concentration of VFAduring regular operation, is presented in Figure 3. Values ofmethane rate, methane yield, and methane content of thereactors determined during start-up and regular operationare presented in Table 3.
The methane rate increased coherently to the OLR asexpected. Methane rates of 1.18 ± 0.09 (CR) to 1.25 ±0.06 L L−1 d−1 (MR) and methane yields of 0.302 ± 0.029(CR) to 0.318±0.022 L (gVS
𝑐𝑜𝑟𝑟
)−1 (MR) were achieved at anOLR of 3.93 ± 0.22 gVS
𝑐𝑜𝑟𝑟
L−1 d−1 (volatile solids). Methanecontents of 52.6% ± 1.5 (CR) and 52.8% ± 1.6 (MR) wereobtained during regular operation of the reactors.
Since the increase of the OLR from 4.06 to4.62 gVS
𝑐𝑜𝑟𝑟
L−1 d−1 at day 210, the pH and themethanogenicperformance of the CR decreased sharply. Feeding of the CR

Journal of Renewable Energy 7
50𝜇m
(a)
50𝜇m
(b)
50𝜇m
(c)
Figure 2: An intensely covered MFGP; sample taken at day 170-phase contrast (a) and fluorescence microscopy (SYTO 13 (b) andautofluorescence (c)), 63-fold objective magnification; (micrograph: Clariant).
Time (d)120 140 160 180 200 220
pH(—
)
7.2
7.0
6.8
6.6
6.4
6.2
6.0
pH (MR)pH (CR)
OLR (MR)OLR (CR)
12
10
8
6
4
2
0 OLR
(gVS
corr
L−1d−
1)
(a)
0.3
02
0.1
0.0 0.0
CH4
yiel
d y
(L(g
VSco
rr)−
1)
y (MR)y (CR)
r (MR)r (CR)
2.5
2.0
1.5
1.0
0.5
CH4
rate
r (L
CH4
L-1d−
1)
Time (d)120 140 160 180 200 220
(b)
−1.0
−0.5
0.0
0.0
0.5
1.0
2.0
3.0
4.0
VOA/TIC (MR)VOA/TIC (CR)
VFA (MR)VFA (CR)
VOA
/TIC
(—)
VFA
(g(k
gFM
)-1)
Time (d)120 140 160 180 200 220
(c)
Figure 3: pH and organic loading rate (a), methane yield andmethane production rate (b), VOA/TIC ratio and concentration of volatile fattyacids (c) of methanogenic reactors with (MR) and without (CR) magnetic foam glass particles.
Table 3: Methane rate, methane yield, and methane content of methanogenic reactors with (MR) and without (CR) magnetic foam glassparticles during periods of constant OLR and HRT.
Reactor days (—) HRT (d) OLR (gVScorr L−1 d−1) Methane rate (L L−1 d−1) Methane yield (L (gVScorr)
−1) Methane content (%)MR CR MR CR MR CR
35–75 (start-up) 40 4.15 ± 0.18 1.63 ± 0.16 1.60 ± 0.18 0.393 ± 0.037 0.385 ± 0.045 56.3 ± 1.0 55.9 ± 1.5125–137 32 1.51 ± 0.04 0.49 ± 0.04 0.47 ± 0.04 0.324 ± 0.025 0.310 ± 0.024 53.5 ± 1.9 52.8 ± 1.2138–151 23 2.02 ± 0.10 0.65 ± 0.05 0.64 ± 0.04 0.322 ± 0.020 0.316 ± 0.011 53.2 ± 2.1 53.1 ± 2.0152–159 18 2.54 ± 0.00 0.83 ± 0.03 0.81 ± 0.03 0.328 ± 0.012 0.321 ± 0.013 52.8 ± 0.8 52.7 ± 0.9160–187 15 3.07 ± 0.17 0.97 ± 0.05 0.95 ± 0.08 0.318 ± 0.023 0.310 ± 0.020 52.5 ± 1.6 52.2 ± 1.1188–199 14 3.38 ± 0.12 1.11 ± 0.06 1.10 ± 0.05 0.328 ± 0.010 0.327 ± 0.023 52.9 ± 0.4 53.0 ± 1.0200–208 12 3.93 ± 0.22 1.25 ± 0.06 1.18 ± 0.09 0.318 ± 0.022 0.302 ± 0.029 53.8 ± 0.4 53.0 ± 1.1209–218/211 11 4.60 ± 0.07 1.35 ± 0.05 1.08 ± 0.07 0.295 ± 0.011 0.239 ± 0.017 51.3 ± 0.9 48.7 ± 1.2

8 Journal of Renewable Energy
was stopped at day 212, when values of pH below 6.5 weremeasured. While pH and consequently the methanogenicperformance of the CR declined, the process remained stableat the MR. The pH of the reactor content from the MRasymptotically approached a lower limit, about 6.8.
The development of VOA/TIC ratio and concentrationof VFA were different at CR and MR. Until the beginningoverload of the CR at day 210, it showed an average VOA/TICratio of 0.20 ± 0.14; the average concentration of VFA wasabout 0.35±0.40 g (L FM)−1.The corresponding values of theMR, 0.10 ± 0.06 (VOA/TIC ratio) and 0.18 ± 0.24 g (L FM)−1(concentration of VFA), were approximately half as high.Since the raise of the OLR at day 210, the VOA/TIC ratio andthe concentration of VFA increased at both reactors. By theend of the digestion experiment, VOA/TIC ratios and VFAconcentrations of 0.70 and 1.12 g (L FM)−1, respectively, 0.95and 2.81 g (L FM)−1 were reached at CR and MR.
TheVOA/TIC ratio represents a fast control of the processstability [2]. TIC represents the alkalinity of the fermenter.For a stable anaerobic digestion of sugar beet, the value of TICshould be 4000 to 6000mg CaCO
3
L−1 [16]. During regularoperation, the TIC remained stable at both reactors, values of4226.34 ± 501.36 and 4126.86 ± 547.69mg CaCO
3
L−1 weremeasured at MR and CR, respectively.
The increase of theVOA/TIC ratio in the end of the diges-tion experiment was caused by the increasing concentrationof VOA in the fermentation liquor. Values of VOA/TICover 0.3 indicate that the process may be inhibited dueto hyperacidity in the digester [30]. The observed stabilityof the methanogenic process at the MR in spite of highvalues of VOA/TIC does not follow this conclusion. Thismay be regarded as a successful protection of methanogenicmicroorganisms living inside the biofilm formed on theMFGPs.
The concentrations of NH4
-N and NKjel of the fermenta-tion liquor were similar at both reactors. During the regularoperation period of the reactors concentrations of 0.48 ±0.18 and 0.46 ± 0.17 g L−1 were determined for NH
4
-N at MRand CR, repectively. NKjel showed values of 1.32 ± 0.24 and1.21±0.19 g L−1 atMR andCR, repectively.The adjustment ofthe concentration of NH
4
-N inside the reactors to the targetvalue of 0.5 g L−1 could be realized successfully by addingammonium carbonate.
Positive effects of the MFGPs on the process stability canbe conducted from the presented data. Process performanceand pH levels showed less fluctuation in comparison to thecontrol reactor. The loading limit of the control reactor wasreached at OLR of 4.62 gVScorr L
−1 d−1 (at day 210). Thecapability and pH of the control reactor heavily decreased atthat point, as stabilization of the methanogenic process couldbe excluded virtually. In contrast, the fermenter containingMFGPs was able to recover after a short period of adaptationand further operation at OLR 4.62 g VScorr L−1 d−1 waspossible.
3.4. Maximum Process Performance. Maximum methanerates of 1.34 L L−1 d−1 at OLR 3.73 gVScorr L
−1 d−1 and1.42 L L−1 d−1 at OLR 4.60 gVScorr L
−1 d−1 were achieved
by CR and MR, respectively. The methane yields fluc-tuated closely around 0.300 L (gVScorr)
−1; maximum val-ues of 0.372 L (gVScorr)
−1 at OLR 3.00 gVScorr L−1 d−1 and
0.358 L (gVScorr)−1 atOLR 3.73 gVScorr L
−1 d−1 were obtainedat CR and MR, respectively.
The achieved maximum performance is comparable tothe results of other studies using beet silage as sole sub-strate. Demirel and Scherer [16] achieved a methane rateof 1.80 L L−1 d−1, a biogas rate of 2.86 L L−1 d−1, a methaneyield of 0.454 L (gVS)−1, a biogas yield of 0.720 L (gVS)−1and a methane content of 63% at the digestion of sugar beetsilage at OLR 3.968 gVS L−1 d−1 and HRT 25 d. The highermethanogenic performance in comparison to the results ofthis study may be attributed to the characteristics of thedigested sugar beet silage. At Demirel and Scherer [16], thereactor process performance was affected significantly bythe use of two different charges of sugar beet silage (bothobtained from the same area in Soltau, Germany). Specificgas production rates of 0.490 L (gVS)−1 d−1 (first charge) and0.720 L (gVS)−1 d−1 (second charge), and volumetric gas pro-duction rates of 1.74 L L−1 d−1 (first charge) and 2.86 L L−1 d−1(second charge) were obtained at OLR 3.560 gVS L−1 d−1 and3.968 gVS L−1 d−1, respectively.
The use of different particles to enhance the performanceof anaerobic digestion processes was investigated in severalstudies.
At particles serving as adsorbent substrate can accu-mulate, these areas of adsorption provide a more favorablegrowth environment for the bacterial substrate system [31].Twofold enhancement in total gas production with 17%enriched methane content was achieved with the additionof 4 g L−1 of silica gel in anaerobic digestion of a mixtureof cheese whey, poultry waste, and cattle dung [31]. Theaddition of 5% commercial charcoal powder to cow dung ona dry weight basis resulted in an increase of gas productionby 17% and 34.7% in batch and semicontinuous fermenters,respectively [32].The increase in methanogenic performancecan be attributed to enhanced microbial activity in thedigester, contributed by growth of bacteria on the surfaceof the particles [32]. Removing slowly biodegradable organicmaterials [32] and serving as source of nutrient [33] have tobe considered as side effects when adsorbents are used.
Compared to these results, the effect of the particles testedin this study was small. The addition of 1% w/w magneticcarriers to a CSTR caused a 6% increase of the maximummethane rate.
The magnetic carriers and the magnetic separation tech-nique used in this study still contain a high potential fordevelopment, as stated before in Sections 3.1 and 3.2. Hence itcan be assumed that a further increase of the methanogenicperformance by magnetic retention of biomass using MFGPsis possible.The improvement of themagnetic carriers and themagnetic separation technique is subject of further studies.
4. Conclusions
Theporous surface of the testedmagnetic foam glass particlesturned out to be suitable for settlement of methanogenic

Journal of Renewable Energy 9
microorganisms. 50 to 60% of the surfaces were covered bya biofilm within 110 days. The magnetic properties of thetested particles enabled retention of the particles inside thereactor by means of magnetic forces. The attainable recoverygrade of the used magnetic separation technique was about76.3% during regular operation of the reactor. Within thetotal experimental period of 218 days, the losses of MFGPsaccumulated to 59%.
The observed effect on the methanogenic performance ofa CSTR was small. Stabilization of the methanogenic processcaused an increase of the maximum methane rate from 1.34to 1.42 L L−1 d−1. The value of the organic loading rate whenthe maximum methane rate was reached was shifted from3.73 to 4.60 g L−1 d−1. During the experimental period, thereactor including particles always showed a slightly higherperformance, but this difference was within the scatter of theexperimental values.
According to the achieved retention of methanogenicmicroorganisms inside the reactor, the use of magneticparticles can be considered as a promising technique toenhance the methanogenic performance of common CSTRs.The small effect on the reactor performance is probably due toa low initial particle concentration of 1%w/w and the losses ofparticles during the operation of the reactor. Besides, the usedmagnetic particles include a high potential for optimizationregarding surface properties, shape, size, andmagnetizability.Utilization of this potential could cause a more considerableeffect on the methanogenic performance.
Abbreviations
AF: Anaerobic filterATB: Leibniz Institute for Agricultural
Engineering Potsdam-BornimC2
–C6
: Short-chain volatile fatty acids𝑐MFGP: Concentration of MFGPs inside
the reactor effluentCOD: Chemical oxygen demandCR: Control reactorCSTR: Completely stirred tank reactorDSMZ: Deutsche Sammlung von
Mikroorganismen undZellkulturen
EGSB: Expanded granular sludge blanketreactor
FBR: Fluidized-bed-reactorFM: Fresh massHRT: Hydraulic retention timeMFGP: Magnetic foam glass particleMR: Magnetic immobilization reactorNKjel: Nitrogen content determined
according to the method byKjeldahl (DIN EN 25663:1933-11)
NH4
COONH2
: Ammonium carbamateNH4
HCO3
: Ammonium bicarbonateNH4
-N: Ammonium nitrogenOLR: Organic loading rate𝑟: Methane rateTS: Total solids
TS105
∘C: Content of total solids determinedat 105∘C
UASB: Upflow anaerobic sludge blanketreactor
VFA: Volatile fatty acidsVOA/TIC: Ratio of volatile organic acids to
total inorganic carbonVS: Volatile solidsVS550
∘C: Content of volatile solids deter-mined at 550∘C
VScorr: Corrected VS content𝑋𝑉
: Magnetic volume susceptibility𝑦: Methane yield.
Conflict of Interests
The authors declare that there is no conflict of interestsregarding the publication of this paper.
Acknowledgment
The authors would like to thank Christof Thomas for hisambitious work.
References
[1] IPCC, “Renewable energy sources and climate change mitiga-tion,” Special Report of the Intergovernmental Panel on ClimateChange, 2012.
[2] P. Weiland, “Biogas production: current state and perspectives,”Applied Microbiology and Biotechnology, vol. 85, no. 4, pp. 849–860, 2010.
[3] C. Wandrey and A. Aivasidis, “Continuous anaerobic digestionwithMethanosarcina barkeri,” Annals of the New York Academyof Sciences, vol. 413, pp. 489–500, 1983.
[4] D. J. Batstone, J. Keller, I. Angelidaki et al., “The IWA anaerobicdigestion model no 1 (ADM1),” Water Science and Technology,vol. 45, no. 10, pp. 65–73, 2002.
[5] C. Nicolella, M. C. M. van Loosdrecht, and J. J. Heijnen,“Wastewater treatment with particulate biofilm reactors,” Jour-nal of Biotechnology, vol. 80, no. 1, pp. 1–33, 2000.
[6] Z. Yang, Y.-C. Juang, D.-J. Lee, and Y.-Y. Duan, “Pore blockageof organic fouling layer with highly heterogeneous structure inmembrane filtration: role of minor organic foulants,” Journal ofMembrane Science, vol. 411, pp. 30–34, 2012.
[7] D. Jeison, P. Telkamp, and J. B. van Lier, “Thermophilicsidestream anaerobic membrane bioreactors: the shear ratedilemma,”Water Environment Research, vol. 81, no. 11, pp. 2372–2380, 2009.
[8] C. Boutin, A. Lienard, J. L. Ramain, and L. Beyeler, “Experimen-tal plants for very small communities—choice and design crite-ria for five different processes,” Water Science and Technology,vol. 28, no. 10, pp. 9–16, 1993.
[9] S. P. Singh and P. Prerna, “Review of recent advances in anaer-obic packed-bed biogas reactors,” Renewable and SustainableEnergy Reviews, vol. 13, no. 6-7, pp. 1569–1575, 2009.
[10] J. Hellman, A. E. W. Ek, C. Sundberg, M. Johansson, B. H.Svensson, andM. Karlsson, “Mechanisms of increasedmethaneproduction through re-circulation of magnetic biomass carri-ers in an experimental continuously stirred tank reactor,” in

10 Journal of Renewable Energy
Proceedings of the 12th World Congress of Anaerobic Digestion,Guadalajara, Mexico, 2010.
[11] K. Breitenbucher, M. Siegl, A. Knupfer, and M. Radke, “Open-pore sintered glass as a high-efficiency support medium inbioreactors—new results and long-term experiences achievedin high-rate anaerobic digestion,”Water Science and Technology,vol. 22, no. 1-2, pp. 25–32, 1990.
[12] K.-Y. Show and J.-H. Tay, “Influence of support media onbiomass growth and retention in anaerobic filters,” WaterResearch, vol. 33, no. 6, pp. 1471–1481, 1999.
[13] M. Perez, L. I. Romero, R. Rodrıguez-Cano, and D. Sales,“Anaerobic thermophilic colonization of porous support,”Chemical and Biochemical Engineering Quarterly, vol. 20, no. 2,pp. 203–208, 2006.
[14] VDI(Verein Deutscher Ingenieure), VDI Guideline 4630: Fer-mentation of Organic Materials—Characterisation of the Sub-strate, Sampling, Collection ofMaterial Data, Fermentation Tests,Beuth, Berlin, Germany, 2006.
[15] FNR (Fachagentur Nachwachsende Rohstoffe e.V.), Guide toBiogas from Production to Use, 2012.
[16] B. Demirel and P. Scherer, “Production of methane from sugarbeet silage without manure addition by a single-stage anaerobicdigestion process,” Biomass and Bioenergy, vol. 32, no. 3, pp.203–209, 2008.
[17] E. Abdoun andP.Weiland, “Optimization ofmonofermentationfrom renewable rawmaterials by the addition of trace elements,”Bornimer Agrartechnische Berichte, vol. 68, pp. 69–78, 2009.
[18] VDLUFA (Verband deutscher landwirtschaftlicherUntersuchungs- und Forschungsanstalten), “Method BookIII—The Chemical Analysis of Feedstuffs, 3rd ed., including1st–6th supplement delivery 1983–2006,” 1976–2006.
[19] C. H. Burchard, D. Groche, and H. P. Zerres, ATV Hand-buch EinfacherMessungen und Untersuchungen auf Klarwerken,Hirthammer, Munich, Germany, 10th edition, 2001.
[20] U. Deppenmeier, “Redox-driven proton translocation inmethanogenic archaea,” Cellular and Molecular Life Sciences,vol. 59, no. 9, pp. 1513–1533, 2002.
[21] C. Thomas, Abscheidung magnetischer aufwuchstrager ausablaufen von biogasanlagen [Bachelor thesis], Fachhochschule,Braunschweig, Wolfenbuttel, Germany, 2009.
[22] M. Franzreb, Magnettechnologie in der VerfahrenstechnikWassriger Medien, FZKA, Karlsruhe, Germany, 2003.
[23] R. Escudie, R. Cresson, J.-P. Delgenes, and N. Bernet, “Controlof start-up and operation of anaerobic biofilm reactors: anoverview of 15 years of research,” Water Research, vol. 45, no.1, pp. 1–10, 2011.
[24] A. P. Picanco, M. V. G. Vallero, E. P. Gianotti, M. Zaiat, and C. E.Blundi, “Influence of porosity and composition of supports onthe methanogenic biofilm characteristics developed in a fixedbed anaerobic reactor,” Water Science and Technology, vol. 44,no. 4, pp. 197–204, 2001.
[25] F. Habouzit, G. Gevaudan, J. Hamelin, J.-P. Steyer, and N. Ber-net, “Influence of support material properties on the potentialselection of Archaea during initial adhesion of a methanogenicconsortium,” Bioresource Technology, vol. 102, no. 5, pp. 4054–4060, 2011.
[26] B. Li and B. E. Logan, “Bacterial adhesion to glass and metal-oxide surfaces,” Colloids and Surfaces B, vol. 36, no. 2, pp. 81–90,2004.
[27] S. F. Simoni, T. N. P. Bosma, H. Harms, and A. J. B. Zehnder,“Bivalent cations increase both the subpopulation of adhering
bacteria and their adhesion efficiency in sand columns,” Envi-ronmental Science and Technology, vol. 34, no. 6, pp. 1011–1017,2000.
[28] A. Chauhan and A. Ogram, “Evaluation of support matricesfor immobilization of anaerobic consortia for efficient carboncycling in waste regeneration,” Biochemical and BiophysicalResearch Communications, vol. 327, no. 3, pp. 884–893, 2005.
[29] A. J. Silva, J. S. Hirasawa, M. B. Varesche, E. Foresti, and M.Zaiat, “Evaluation of support materials for the immobilizationof sulfate-reducing bacteria andmethanogenic archaea,”Anaer-obe, vol. 12, no. 2, pp. 93–98, 2006.
[30] D. Deublein and A. Steinhauser, Biogas from Waste andRenewable Resources: An Introduction, Wiley-VCH, Weinheim,Germany, 2nd edition, 2011.
[31] M. Desai and D. Madamwar, “Anaerobic digestion of a mixtureof cheese whey, poultry waste and cattle dung: a study of the useof adsorbents to improve digester performance,” EnvironmentalPollution, vol. 86, no. 3, pp. 337–340, 1994.
[32] S. Kumar,M.C. Jain, and P. K. Chhonkar, “A note on stimulationof biogas production from cattle dung by addition of charcoal,”Biological Wastes, vol. 20, no. 3, pp. 209–215, 1987.
[33] D. Somayaji and S. Khanna, “Biomethanation of rice and wheatstraw,”World Journal of Microbiology and Biotechnology, vol. 10,no. 5, pp. 521–523, 1994.

TribologyAdvances in
Hindawi Publishing Corporationhttp://www.hindawi.com Volume 2014
International Journal of
AerospaceEngineeringHindawi Publishing Corporationhttp://www.hindawi.com Volume 2014
FuelsJournal of
Hindawi Publishing Corporationhttp://www.hindawi.com Volume 2014
Journal ofPetroleum Engineering
Hindawi Publishing Corporationhttp://www.hindawi.com Volume 2014
Industrial EngineeringJournal of
Hindawi Publishing Corporationhttp://www.hindawi.com Volume 2014
Power ElectronicsHindawi Publishing Corporationhttp://www.hindawi.com Volume 2014
Advances in
CombustionJournal of
Hindawi Publishing Corporationhttp://www.hindawi.com Volume 2014
Journal of
Hindawi Publishing Corporationhttp://www.hindawi.com Volume 2014
Renewable Energy
Submit your manuscripts athttp://www.hindawi.com
Hindawi Publishing Corporationhttp://www.hindawi.com Volume 2014
StructuresJournal of
International Journal of
RotatingMachinery
Hindawi Publishing Corporationhttp://www.hindawi.com Volume 2014
EnergyJournal of
Hindawi Publishing Corporationhttp://www.hindawi.com Volume 2014
Hindawi Publishing Corporation http://www.hindawi.com
Journal ofEngineeringVolume 2014
Hindawi Publishing Corporation http://www.hindawi.com Volume 2014
International Journal ofPhotoenergy
Hindawi Publishing Corporationhttp://www.hindawi.com Volume 2014
Nuclear InstallationsScience and Technology of
Hindawi Publishing Corporationhttp://www.hindawi.com Volume 2014
Solar EnergyJournal of
Hindawi Publishing Corporationhttp://www.hindawi.com Volume 2014
Wind EnergyJournal of
Hindawi Publishing Corporationhttp://www.hindawi.com Volume 2014
Nuclear EnergyInternational Journal of
Hindawi Publishing Corporationhttp://www.hindawi.com Volume 2014
High Energy PhysicsAdvances in
The Scientific World JournalHindawi Publishing Corporation http://www.hindawi.com Volume 2014