Embed Size (px)
Citation preview

Research ArticleInvestigation of the Variability and Implications ofMeteorological Dry/Wet Conditions in the Poyang LakeCatchment, China, during the Period 1960–2010
Xu-chun Ye,1 Yun-liang Li,2 Xiang-hu Li,2 Chong-yu Xu,3 and Qi Zhang2,4
1School of Geographical Sciences, Southwest University, Chongqing 400715, China2Key Laboratory of Watershed Geographic Science, Nanjing Institute of Geography and Limnology, Chinese Academy of Sciences,Nanjing 210008, China3Department of Geosciences, University of Oslo, P.O. Box 1047, Blindern, 0316 Oslo, Norway4Key Laboratory of Poyang Lake Wetland and Watershed Research, Ministry of Education, Jiangxi Normal University,Jiangxi 330000, China
Correspondence should be addressed to Xu-chun Ye; [email protected]
Received 17 March 2015; Revised 30 June 2015; Accepted 1 July 2015
Academic Editor: Antonio Donateo
Copyright © 2015 Xu-chun Ye et al. This is an open access article distributed under the Creative Commons Attribution License,which permits unrestricted use, distribution, and reproduction in any medium, provided the original work is properly cited.
This paper presents a quantitative investigation of the variability ofmeteorological dry/wet conditions of the Poyang Lake catchmentduring 1960–2010 by using the standardized precipitation-evapotranspiration index (SPEI) based on daily observations of 14meteorological stations across the catchment. Extending from previous studies, the background of the encounter and overlap ofmultitimescales of meteorological dry/wet episodes for several severe drought and flood events were discussed. In addition, thepossible impacts of temperature changes on dry/wet variability were also examined by the comparison of SPEI and standardizedprecipitation index (SPI) variations at multitimescales during the study period. Major results show that the occurrence of dry/wetcondition has become increasingly frequent in the recent two decades, especially the extreme wet episodes in 1990s and the extremedry episodes in 2000s. Historically, the encounter and overlap of multitimescales of meteorological dry/wet episodes plays animportant role in the occurrence of several severe drought and flood events. The study concluded that the impact of temperatureanomaly to the dry/wet variability cannot be neglected.
1. Introduction
As global warming intensified hydrological cycle, spatial andtemporal distribution of water resource have been changedall over the world, exerting tremendous influences on theecological environment and agriculture development [1–4].As a natural phenomenon of environmental water deficitat basin or regional scale, water shortage can evolve intoa drought hazard when it lasts for a long time (such as afew months, even a year or several years), while short termenvironmental water surplus will lead to the occurrence ofsevere flood hazard. During the past half century, results frommany studies have indicated that the frequency and severityof extreme climate events are increasing, causing more and
more drought and flood hazards (e.g., [5, 6]). Furthermore,public awareness of extreme climatic events has risen sharplydue to the catastrophic nature of floods, droughts, storms,and other climatic extremes [7]. Investigation of the chang-ing characteristics of environmental dry/wet condition isimportant forwater resourcemanagement and drought/floodprevention according to hydrological alterations [7, 8].
The status of environmental water deficit is the precon-dition for the occurrence of local flood or drought hazards.Up to now, people have developed various drought indicesfor environmental dry/wet estimation. Among which, themost widely used indices include the Palmer drought severityindex (PDSI) [9–11] and the standardized precipitation index(SPI) [12–14] or normalised precipitation index (NPI) [15].
Hindawi Publishing CorporationAdvances in MeteorologyVolume 2015, Article ID 928534, 11 pageshttp://dx.doi.org/10.1155/2015/928534

2 Advances in Meteorology
These indices are the typical indicators for assessing the con-ditions of meteorological dryness [16]. PDSI is an indicatorof hydrometeorological dryness which is calculated from asimple water-balance model forced by monthly precipitationand temperature data [9]. However, lack of the multiscalarcharacter and complex calculation processesmakes the appli-cation of PDSI limited. The SPI and NPI calculation is basedonly on precipitation deficiency and does not consider othercritical variables that may affect drought condition. Due to itsrobustness and convenience in application, SPI has alreadybeen widely used to characterize dry/wet conditions all overthe world [17–19]. Moreover, it was recommended for meteo-rological dryness estimation in a recent meeting of theWorldMeteorological Organization (WMO) [20]. However, underthe background of global change, increased temperature hasbecome an important factor that has remarkable influence ondrought process [21]. Thus, objective estimation of dry/wetconditions needs a comprehensive consideration of precipita-tion and temperature changes. Similar to the principle of SPI,Vicente-Serrano et al. [22] proposed a new drought index:standardized precipitation-evapotranspiration index (SPEI)by considering the effect of precipitation and temperaturevariability on meteorological dry/wet conditions. The indexeffectively integrates the sensitivity of evaporative demand ofthe PDSI and the multiscalar character of the SPI [22, 23],which is an ideal tool for dry/wet monitoring under thebackground of global warming.
The Poyang Lake catchment is one of the most sensi-tive regions of climate change in the Yangtze River basin[24]; studies on the changing properties of local climateand streamflow of the catchment have drawn increasingconcerns in recent years. For example, Min and Liu [25]evaluated the change characteristics and possible underlyingcauses of extreme precipitation of the catchment. Tao etal. [26] investigated the spatial and temporal variability oftemperature extreme indices for the period 1959–2010 anddiscussed the possible correlation with Global-SST ENSOindex. Ye et al. [27] distinguished the relative impacts ofclimate change and human activities on the variation ofcatchment streamflow. In addition, several studies examinedthe variation of dry/wet condition of the catchment. Min etal. [28] analyzed the climatic characteristics of the drought inthe Poyang Lake catchment by using the 𝑍 index method. Liet al. [29] evaluated and compared the TRMM rainfall datawith rain gauges data in Poyang Lake basin and investigatedthe usefulness of TRMM rainfall formonitoring the temporaland spatial distribution of dry/wet conditions by the SPIand 𝑍 index method. However, to our knowledge, althoughquite a number of studies on this topic are available inthe literatures, there is a lack of studies that rationallyconsider the effect of temperature variability on the changeof meteorological dry/wet conditions under the backgroundof global warming. Furthermore, evaluation of the impactof multitimescale variability of dry/wet conditions is verylimited when addressing the occurrence of major droughtand flood events in the lake inflow catchment in recent years.
As reported by many studies that annual precipitationand temperature in the Poyang Lake catchment are likely toincrease continuously in the future as the results of global
warming (e.g., [30, 31]), understanding spatial and temporalvariability of dry/wet conditions of the lake inflow catchmentis essential for the mitigation and prevention against therisk of natural hazards. Extending from previous studies,objectives of this study are as follows: (1) to investigate thecharacteristics of spatial and temporal variability of dry/wetconditions defined by SPEI, (2) to examine the evolution ofSPEI at different timescales, and (3) to evaluate the impact oftemperature variability on dry/wet conditions in recent yearsunder the background of global warming.
2. Study Region and Data
The Poyang Lake catchment, located in the middle reachof the Yangtze River (Figure 1), serves as important waterresource and ecological function in China. The catchmentis mainly comprised of the five subcatchments: GanjiangRiver, Fuhe River, Xinjiang River, Xiushui River, and RaoheRiver catchments (see Figure 1). The Poyang Lake at theoutlet of the catchment receives water mainly from the fivetributaries and discharges into the Yangtze River from anarrowwatercourse in the north.The catchment area is about162,200 km2, which accounts for 9% of Yangtze River Basinand nearly 97% of Jiangxi Province. The catchment belongsto a subtropical climate with average annual temperature of17.5∘C and average annual precipitation of 1665mm. Due tothe dominant effect of Southeast Asian Monsoon, forty-fivepercent of annual precipitation is concentrated in the wetseason from April to June (Figure 1(b)).
Average annual discharge from the catchment is about1450 × 108m3, accounting for 15% of water resources of thewholeYangtzeRiver basin.However, due to the uneven distri-bution of seasonal precipitation, the Poyang Lake catchmentis one of the flood and drought-prone regions in China.During the past decades, both droughts and floods haveoccurred frequently in the lake, causing huge damage to theenvironment and the agricultural development. For example,the severe winter droughts of the catchment occurring in2003-2004, 2006-2007, and 2008-2009 almost brought thelake water storage down to less than 1% of its capacity, whichhas raised wide concerns for the lake wetland ecology andlocal water resources management [32–34]. As a typical openwater-carrying lake that naturally connects to the YangtzeRiver, the occurrence of droughts and floods in the lake is notonly controlled by the Yangtze River discharge but also highlyaffected by the catchment inflow [34, 35]. Therefore, changesof meteorological dry/wet conditions of the lake inflowcatchment are particularly important for the occurrence ofserious droughts and floods in the regional lake as well as thelower Yangtze River.
In this study, complete data set of daily precipitationand temperature from 14 standard national weather stationsinside the catchment was obtained from National ClimateCentre of China Meteorological Administration (CMA).Daily observations of all weather stations are available forthe period of 1960–2010, and there is no missing data onthe variables. Data quality control was made by CMA beforedelivery. Locations of these weather stations are indicated inFigure 1.

Advances in Meteorology 3
Prec
ipita
tion
(mm
) 300250
200
150
100
50
0
Month1 2 3 4 5 6 7 8 9 10 11 12
Tem
pera
ture
(∘C)
35
30
25
20
15
10
5
0
PrecipitationTemperature
(a)
(b)
N
N30∘
29∘
28∘
27∘
26∘
25∘
30∘
29∘
28∘
27∘
26∘
25∘
E 114∘
115∘
116∘
117∘
118∘
114∘
115∘
116∘
117∘
118∘
0 25.0 50.0 100.0
(km)Metro stationRivers
Poyang LakeSubbasin boundary
Figure 1:The geophysical location of Poyang Lake, China. (a) Distribution of meteorological stations across the Poyang Lake catchment, and(b) mean monthly precipitation and temperature of the Poyang Lake catchment for the period 1960–2010.
3. Methodology
3.1. Standardized Precipitation-Evapotranspiration Index(SPEI). The standardized precipitation-evapotranspirationindex (SPEI) was proposed by Vicente-Serrano et al. [22]based on precipitation and potential evapotranspirationconditions. In contrast with other drought indices, SPEIcombines the physical principles of the PDSI [12] withthe multiscalar character of the SPI [9]. The calculationprocedure of SPEI includes the following steps [22].
Step 1. Calculation of monthly climatic water balance:
𝐷𝑖= 𝑃𝑖−PET
𝑖, (1)
where 𝑃𝑖and PET
𝑖are precipitation and potential evapo-
transpiration for the month 𝑖 and 𝐷𝑖is the difference of the
two variables. In this study, potential evapotranspiration wascalculated byThornthwaite method [36].
Step 2. Establishing the time series of water deficit at differenttimescales:
𝐷𝑘
𝑛=
𝑘−1∑
𝑖=0(𝑃𝑛−𝑖−PET
𝑛−𝑖) , 𝑛 ≥ 𝑘, (2)
where 𝑘 is timescale (month) and 𝑛 is computing times.
Step 3. Fitting the established data series by applying theprobability density function of a three-parameter log-logisticdistribution:
𝑓 (𝑥) =𝛽
𝛼(𝑥 − 𝛾
𝛼)
𝛽−1[1+(
𝑥 − 𝛾
𝛼)
𝛽
]
−2
, (3)
where 𝛼, 𝛽, and 𝛾 are scale, shape, and origin parame-ters, respectively, which can be obtained by the L-moment

4 Advances in Meteorology
Table 1: SPEI classification and corresponding probabilities ofoccurrence.
Category SPEI Probability (%)Extreme wet SPEI ⩾ 2.0 2.3Severe wet 1.5 ⩽ SPEI < 2.0 4.4Moderate wet 1.0 ⩽ SPEI < 1.5 9.2Normal −1.0 < SPEI < 1.0 68.2Moderate dry −1.5 < SPEI ⩽ −1.0 9.2Severe dry −2.0 < SPEI ⩽ −1.5 4.4Extreme dry SPEI ⩽ −2.0 2.3
method. The cumulative probability at a given timescale iscalculated as
𝐹 (𝑥) = ∫
𝑥
0𝑓 (𝑥) 𝑑𝑡 = [1+( 𝛼
𝑥 − 𝛾)
𝛽
]
−1
. (4)
Step 4. Transforming the data series of the cumulative proba-bility to standard normal distribution, and then the SPEI canbe calculated as follows:
SPEI = 𝑊−𝐶0 + 𝐶1 + 𝐶2𝑊
2
1 + 𝑑1𝑊+ 𝑑2𝑊2 + 𝑑3𝑊
3 ,
𝑊 = √−2 ln (𝑃) 𝑃 ≤ 0.5,
(5)
where 𝑃 = 1 − 𝐹(𝑥). When 𝑃 > 0.5, then 𝑃 is replaced by1 − 𝑃. The constants are 𝐶
0= 2.515517, 𝐶
1= 0.802853, 𝐶
2=
0.010328, 𝑑1= 1.432788, 𝑑
2= 0.189269, and 𝑑
3= 0.001308.
According to the value of SPEI, meteorological dry/wetconditions can be classified into seven categories [22]. Table 1lists the SPEI classification and corresponding cumulativeprobabilities of occurrences.
3.2. Standardized Precipitation Index (SPI). The standardizedprecipitation index (SPI) was proposed to quantify precipi-tation anomaly with respect to long-term normal conditionsfor multiple timescales [12]. It is one of the most widely usedindicators for meteorological drought estimation. Generally,the calculation process of SPI is totally consistent withSPEI, but it just considers the precipitation deficiency onmeteorological drought. In addition, both indexes have thesame classification of the intensity of dry/wet conditions[12, 22, 23, 37]. In this study, SPI was used as a referenceindex to evaluate the impact of temperature variability ondry/wet conditions within the context of global warming.More detailed information on the calculation of the SPI canbe referred to the publications such as Mckee et al. [12] andDu et al. [37].
3.3. Trend Test. There are a lot of statistical techniques fortrend test of data series, such asmoving average, linear regres-sion, and Mann-Kendall trend test. Although each methodhas its own strengths and weaknesses in trend detection,the nonparametric Mann-Kendall (MK) statistical test [38,39] was applied in this study to estimate the change trends
of seasonal SPEI due to its robustness against nonnormaldistributions and insensitiveness to outliers.The test is widelyused for trends detection in hydrological and climatologicalseries (e.g., [27, 34]). According to the method, the nullhypothesis 𝐻
0of the test is that there is no trend of the
calculated drought/wetness conditions from which the dataset𝑋 (𝑥
1, 𝑥2, 𝑥3, . . . , 𝑥
𝑛) is drawn.The alternative hypothesis
𝐻1is that a monotonic trend exists in 𝑋 (𝑥
1, 𝑥2, 𝑥3, . . . , 𝑥
𝑛).
The null hypothesis𝐻0should be rejected if |𝑍| ⩾ 1.96 at 5%
significance level. The 𝑍 value is a standard normal variablethat represents the significance level of a specific trend. Apositive value of 𝑍 indicates increasing trend, and a negativevalue of 𝑍 indicates decreasing trend.
4. Results and Discussion
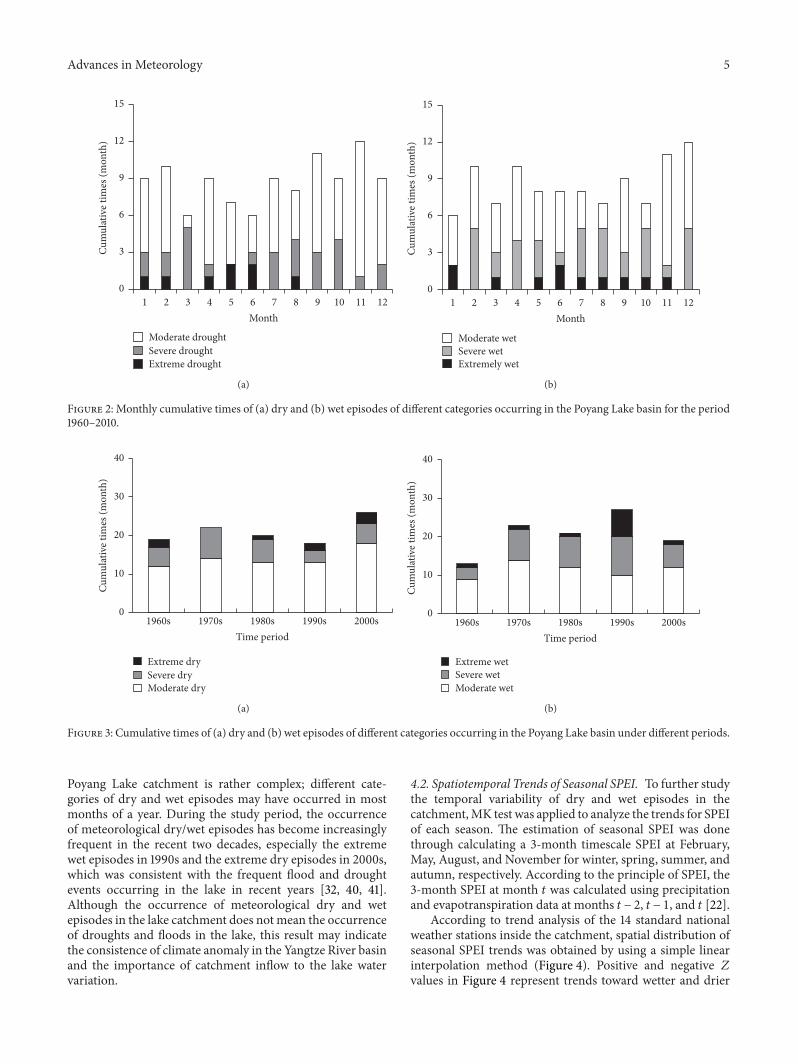
4.1. Frequency of Dry and Wet Months of the Catchment.Based on the spatial averages of the meteorological datafrom all the stations, SPEI of the whole catchment was firstestimated, and then cumulative frequency of dry and wetmonths of different category was calculated for the period1960–2010. As shown in Figure 2, statistical results indicatethere were 105 dry months occurring in the Poyang Lakecatchment during the past 51 years, among which moderatedry episode occurred in 70 months, severe dry episodeoccurred in 27 months, and extreme dry episode occurred in8months. On seasonal basis, different category of dry episodecan occur in any month of a year, and average occurrence ofdry episode in each month is about 9 times. For each month,dry episode is most likely to occur in February, September,and November, while it is least likely to occur in March andJune (Figure 2(a)). Moderate dry episode mainly occurred inSeptember and November, severe dry episode in March andOctober, and extreme dry episode inMay and June. As for theoccurrence of wet episode of the catchment, there were totally103wetmonths that can be identified during the study period,among which moderate wet episode occurred in 57 months,severe wet episode in 35 months, and extreme wet episodein 11 months. The most frequent occurrence of wet episodeis in November, December, and February, while the least isin January, March, and August (Figure 2(b)). Moderate wetepisode mainly occurred in November and December, severewet episode in December and February, and extreme wetepisode in January and June.
Figure 3 further shows the cumulative frequency of dryand wet episodes of different categories under differentperiods. It can be seen that the occurrence of dry episodesin 1970s and 2000s was relatively frequent, and the mostfrequent occurrence for wet episodes was in 1970s and1990s. Figure 3(a) indicates that extreme dry episodes mainlyoccurred in 1960s, 1990s, and 2000s and moderate dryepisode and severe dry episodewere relative frequent in 1970sand 2000s. In contrast, Figure 3(b) indicates that severe wetepisodes and extreme wet episodes mainly occurred in 1990s;moderate wet episodes were frequent in 1970s, 1980s, and2000s.
Generally, the above analysis indicates that the seasonaloccurrence of meteorological dry or wet episodes in the
Advances in Meteorology 5
0
3
6
9
12
15
1 2 3 4 5 6 7 8 9 10 11 12
Cum
ulat
ive t
imes
(mon
th)
Month
Moderate droughtSevere droughtExtreme drought
(a)
0
3
6
9
12
15
1 2 3 4 5 6 7 8 9 10 11 12
Cum
ulat
ive t
imes
(mon
th)
Month
Moderate wetSevere wetExtremely wet
(b)
Figure 2: Monthly cumulative times of (a) dry and (b) wet episodes of different categories occurring in the Poyang Lake basin for the period1960–2010.
0
10
20
30
40
1960s 1970s 1980s 1990s 2000s
Cum
ulat
ive t
imes
(mon
th)
Time period
Extreme drySevere dryModerate dry
(a)
0
10
20
30
40
1960s 1970s 1980s 1990s 2000s
Cum
ulat
ive t
imes
(mon
th)
Time period
Extreme wetSevere wetModerate wet
(b)
Figure 3: Cumulative times of (a) dry and (b) wet episodes of different categories occurring in the Poyang Lake basin under different periods.
Poyang Lake catchment is rather complex; different cate-gories of dry and wet episodes may have occurred in mostmonths of a year. During the study period, the occurrenceof meteorological dry/wet episodes has become increasinglyfrequent in the recent two decades, especially the extremewet episodes in 1990s and the extreme dry episodes in 2000s,which was consistent with the frequent flood and droughtevents occurring in the lake in recent years [32, 40, 41].Although the occurrence of meteorological dry and wetepisodes in the lake catchment does not mean the occurrenceof droughts and floods in the lake, this result may indicatethe consistence of climate anomaly in the Yangtze River basinand the importance of catchment inflow to the lake watervariation.
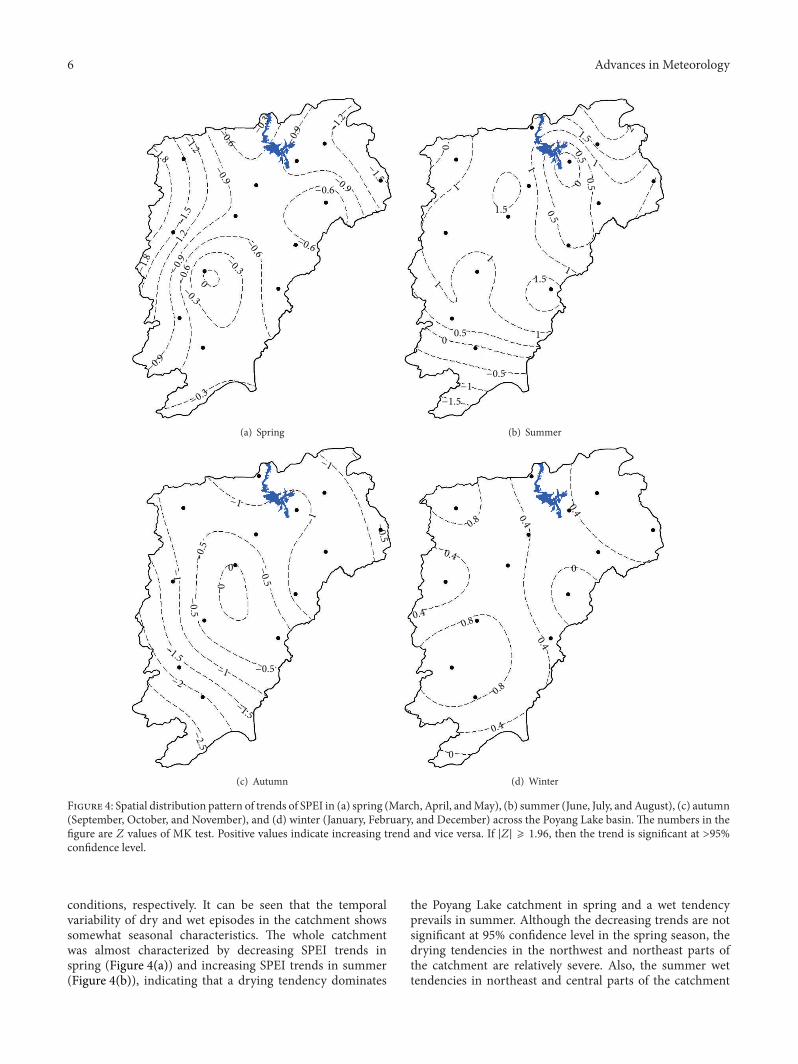
4.2. Spatiotemporal Trends of Seasonal SPEI. To further studythe temporal variability of dry and wet episodes in thecatchment,MK test was applied to analyze the trends for SPEIof each season. The estimation of seasonal SPEI was donethrough calculating a 3-month timescale SPEI at February,May, August, and November for winter, spring, summer, andautumn, respectively. According to the principle of SPEI, the3-month SPEI at month 𝑡 was calculated using precipitationand evapotranspiration data at months 𝑡 − 2, 𝑡 − 1, and 𝑡 [22].
According to trend analysis of the 14 standard nationalweather stations inside the catchment, spatial distribution ofseasonal SPEI trends was obtained by using a simple linearinterpolation method (Figure 4). Positive and negative 𝑍values in Figure 4 represent trends toward wetter and drier
6 Advances in Meteorology
−1.8
−1.5
−1.2
−0.9
−0.9
−0.9
−0.9
−0.6
−0.6
−0.6
−0.3
−0.3
−1.8
−1.5
−1.2
−1.2
−0.9
−0.6
−0.6
−0.3
−0.3
0
(a) Spring
−1.5
−1
−0.5
0
0
0
0.5
0.5
0.5
0.5 1
2
1
1
1
1
1
1
1.5
1.5
1.5
(b) Summer
−2.5
−2
−1.5
−1.5
−1
−1
−1
−1
−1
−0.5
−0.5
−0.5
−0.5
−0.5
0
0
(c) Autumn
0
0
0.4
0.4
0.4
0.4
0.4
0.4
0.8
0.8
0.8
(d) Winter
Figure 4: Spatial distribution pattern of trends of SPEI in (a) spring (March, April, andMay), (b) summer (June, July, andAugust), (c) autumn(September, October, and November), and (d) winter (January, February, and December) across the Poyang Lake basin. The numbers in thefigure are 𝑍 values of MK test. Positive values indicate increasing trend and vice versa. If |𝑍| ⩾ 1.96, then the trend is significant at >95%confidence level.
conditions, respectively. It can be seen that the temporalvariability of dry and wet episodes in the catchment showssomewhat seasonal characteristics. The whole catchmentwas almost characterized by decreasing SPEI trends inspring (Figure 4(a)) and increasing SPEI trends in summer(Figure 4(b)), indicating that a drying tendency dominates
the Poyang Lake catchment in spring and a wet tendencyprevails in summer. Although the decreasing trends are notsignificant at 95% confidence level in the spring season, thedrying tendencies in the northwest and northeast parts ofthe catchment are relatively severe. Also, the summer wettendencies in northeast and central parts of the catchment
Advances in Meteorology 7
Table 2: Statistical results of frequency and average duration of dry and wet episodes according to different timescales of SPEI.
Dry/wet SPEI-1 SPEI-3 SPEI-6 SPEI-12 SPEI-24 SPEI-48Dry
Frequency (times) 71 39 20 7 7 4Average duration (months) 1.48 2.33 4.85 14.71 14.00 24.75
WetFrequency (times) 67 35 19 10 6 2Average duration (months) 1.54 3.20 5.89 10.60 17.00 53.00
are relatively severe and not significant.These trends can alsobe identified in autumn and winter. Figure 4(c) shows thatthe entire Poyang Lake catchment, except for a small partin the central region, is characterized by decreasing SPEItrends in the autumn, indicating a drying tendency of thisseason. The drying tendency is particularly significant in thesouthwest part of the catchment with SPEI trends significantat the 95% confidence level. Figure 4(d) shows that the entirePoyang Lake catchment is characterized by increasing SPEIin winter.Thus, the wet tendency prevails over the catchmentin the winter season, although the increasing trends are notsignificant at 95% confidence level.
4.3. Variability of Multitimescales of SPEI. According to thedefinition described by McKee et al. [12], the frequency andduration of dry and wet episodes at different timescales werecalculated. In the definition, the beginning of a dry episodethat is defined as SPEI (or SPI) continued to be negativeand reached −1.0, and the end of the episode that is definedas SPEI (or SPI) turned out to be positive, and vice versafor wet event. Table 2 lists the statistical results of frequencyand average duration of dry and wet episodes accordingto different timescales of SPEI. Generally, during the studyperiod, the frequency of dry episodes is larger than that of thewet episodes, except for SPEI-12, while the average durationof wet episodes is longer. The average duration of SPEI-3 dryepisodes is 2.33months and for wet episodes it is 3.20months.However, average duration of SPEI-48 dry episodes is 24.75months, which is much shorter than the average duration of53.00 months of wet episodes, and the longest can last for 8years (1995–2003).
Figure 5 shows the evolution of multitimescales of SPEIvalues of the Poyang Lake catchment during 1960–2010.Because the shorter timescale of SPEI is sensitive to precipi-tation and temperature, the estimated 1-month SPEI (SPEI-1)and 3-month SPEI (SPEI-3) in Figure 5 are characterized byseasonal oscillations with large fluctuation during the studyperiod. The occurrence of those dry or wet episodes that lastfor half a year is also frequent and shows interannual oscil-lations (such as SPEI-6 in Figure 5). In addition, variabilityof SPEI-24 and SPEI-48 presents a feature of interdecadalvariability. Consistently, on decadal scale, continued andconsecutive dry or wet episodes that last for several yearsusually occurred in the Poyang Lake catchment, such as1963–1966 dry episode, 1978-1979 dry episode, 1993–1999 wetepisode, and 2006–2009 dry episode. The consecutive wetepisodes in 1993–1999 caused frequent flood hazards in the
catchment; for instance, the maximum catchment dischargeto Poyang Lake in 1998 was about 7 × 10⁴m3/s, the maximumin the recent 50 years [40]. However, the consecutive dryepisodes in 2006–2009 led to a severe water deficit of thecatchment [41], causing sharp decline of groundwater leveland reservoir water level and water supply and irrigationproblems for millions of inhabitants in the catchment [34].Thus, themultitimescales of SPEI can clearly reflect the statusof available water resources under the evolution of meteoro-logical dry/wet conditions. As discussed by other papers (e.g.,[12, 42]), variations of SPEI-1 and SPEI-3 are mainly affectedby monthly precipitation and temperature and can be usedto estimate the condition of upper soil moisture. Variationsof SPEI-6 and SPEI-12 well reflect the condition of lowersoil moisture and the river runoff, while SPEI-24 and SPEI-48 may indicate the condition of groundwater resources andreservoir storage.
Because the SPEI curves of different timescales aredifferent in periodicity, amplitude, and initial phase, thedry and wet episodes at different timescales may happensimultaneously and consequently produce extreme droughtor flood events [43]. Figure 5 shows that SPEI-48 reached theminimum values in 1966 (−1.86) and 2009 (−1.80). It takes4 years for SPEI-48 to return to normal climate conditionafter 1966. When in consideration of short-timescale SPEIvariation (such as SPEI-3), it is clear that different timescalesof dry episodes are easy to encounter and their effects canbe overlapped. This is also applicable to the wet episodes.Taking 1992, 2007, and 2009 as examples of drought eventsin the catchment, the SPEI for these three years are obviouslynegative for timescales less than 6 months. However, theintensity of the drought event occurred in 1992 and itsinfluence is much smaller than the droughts in 2007 and2009. It has been reported that lots of rivers as well asreservoirs almost dried out in 2007 and 2009; furthermore,shallow groundwater wells used as the major water supplyfor many of the villages in the catchment failed to meetdemand due to the decline of groundwater levels [34]. Thesevere drought events in 2007 and 2009 occurred based onthe background that shorter timescales of dry episodes andthe longer timescales of dry episodes (SPEI-24 and SPEI-48)were encountered and overlapped. This result indicates thata large part of precipitation in 2007 and 2009 was requiredto compensate the accumulated water deficit of groundwaterand reservoirs in the catchment and therefore aggravated theseverity and influence of these droughts. On the contrary,the occurrence of 1998 flood, the severest flood hazard in

8 Advances in Meteorology
−3−2−1
0123
−3−2−1
0123
−3−2−1
0123
−3−2−1
0123
−3−2−1
0123
−4−2
024
Year
1998 flood 2010 flood
1991 drought 2007 and 2009 drought
1998 flood 2010 flood
1991 drought 2007 and 2009 drought
1998 flood 2010 flood
1991 drought 2007 and 2009 drought
1998 flood 2010 flood
1991 drought 2007 and 2009 drought
1998 flood 2010 flood
1991 drought 2007 and 2009 drought
1998 flood 2010 flood
1991 drought 2007 and 2009 drought
SPEI
-1SP
EI-3
SPEI
-6SP
EI-1
2SP
EI-2
4SP
EI-4
8
1960 1965 1970 1975 1980 1985 1990 1995 2000 2005 2010
1960 1965 1970 1975 1980 1985 1990 1995 2000 2005 2010
1960 1965 1970 1975 1980 1985 1990 1995 2000 2005 2010
1960 1965 1970 1975 1980 1985 1990 1995 2000 2005 2010
1960 1965 1970 1975 1980 1985 1990 1995 2000 2005 2010
1960 1965 1970 1975 1980 1985 1990 1995 2000 2005 2010
Figure 5: Evolution of multitimescale of SPEI values and majordrought/flood events in the Poyang Lake catchment during 1960–2010.
recent 50 years, exactly coincided with the encounter andoverlap ofmultitimescale wet episodes since the positive SPEIis particularly obvious at all timescales (Figure 5). However,different from the 1998 flood, longer timescales of SPEI(SPEI-24 and SPEI-48) of another flood in 2010 show normalor dry conditions, whichwere conducive to alleviate the floodintensity.
4.4. Impact of Temperature Changes on Dry/Wet Variabilityin Recent Years. Temperature has an important effect onthe intensity, scope, and duration of dry/wet condition.Its impact on meteorological dry/wet condition is mainlyrealized by affecting the rate of evaporation. When temper-ature increases, the evaporation rate will be accelerated, andthis will aggravate the severity of drought, and vice versa[44]. Because the process of SPEI estimation is completelyconsistent with SPI but just adds the effect of potentialevapotranspiration, the differences between SPEI and SPI
−4−2
024
SPEISPI
−3−2−1
01234
−3−2−1
0123
Year
SPEI
-3SP
EI-6
SPEI
-12
SPEI
-48
1960 1965 1970 1975 1980 1985 1990 1995 2000 2005 2010
1960
−3−2−1
01234
1965 1970 1975 1980 1985 1990 1995 2000 2005 2010
1960 1965 1970 1975 1980 1985 1990 1995 2000 2005 2010
1960 1965 1970 1975 1980 1985 1990 1995 2000 2005 2010
(a)
−1.0−0.5
0.00.51.01.5
1960 1965 1970 1975 1980 1985 1990 1995 2000 2005 2010Year
Tem
pera
ture
depa
rtur
e (∘C)
(b)
Figure 6: (a) Comparison ofmultitimescales of SPEI and SPI during1960–2010; (b) variation of annual temperature departures during1960–2010.
reflect the contribution of temperature variability on theintensity of dry/wet condition.
As an example, Figure 6(a) shows the comparison of SPEIand SPI variations at timescales of 3, 6, 12, and 48 monthsduring the study period. We can see that the fluctuationsof SPEI and SPI show highly consistent patterns, with smalldiscrepancy at certain times. With timescales increasing, thediscrepancy between SPEI and SPI became more and moreobvious. The SPEI curve is obviously higher than SPI curveduring 1965–1986 but lower than SPI curve during 1998–2010under the timescale of 48 months. In consideration of theimpact of temperature changes on dry/wet conditions duringthe study period, it can be concluded that the higher SPEIcurve during 1965–1986 indicates a reduced dry intensity,while the lower SPEI curve during 1998–2010 indicates anincreased dry intensity. During the period of 1986–1995, theimpact of temperature is small, and also the SPEI curve showsalmost coincidence with SPI curve.

Advances in Meteorology 9
Precipitation deficit is considered to be the dominantfactor that affects the intensity of dry/wet condition; how-ever, temperature variability may play a modulating role.Figure 6(b) displays the anomaly of annual temperature ofthe Poyang Lake catchment in recent years, which indicatesthat the catchment has experienced a relative low temperatureperiod in 1965–1986 and a quick increase period after 1998.It is clear that negative temperature departure during 1965–1986 can alleviate drought in the dry year with SPEI <SPI and intensify flood in the wet year with SPEI > SPI.Similarly, positive temperature departure during 1998–2010can alleviate flood in the wet year with SPEI < SPI andintensify drought in the dry year with SPEI > SPI. Statisticalresult indicates that the average annual temperature duringthe period 1998–2010 is about 0.6∘C higher than the long-term average, and maximum temperature anomaly in 2007can reach up to 1.08∘C. On annual bases, for the typicaldrought years of 2003, 2007, and 2009, our observationindicates that the contribution of increased temperature todrought intensity of the catchment is about 22.8%, 9.1%, and23.9%, respectively. Therefore, in addition to the effect of lessprecipitation, the increased temperature is another importantfactor for the severe and continued droughts in the PoyangLake catchment after 2003.
5. Conclusions
By using the latest proposed drought index (SPEI), thispaper quantitatively investigated the evolution characteristicsof meteorological dry/wet variations in the Poyang Lakecatchment, China, for the period of 1960–2010. The resultsdemonstrate that the occurrence ofmeteorological dry or wetepisodes in the Poyang Lake catchment is rather complex;different categories of dry andwet episodes can occur inmostmonths of a year. The occurrence of meteorological dry andwet episodes has become increasingly frequent in the recenttwo decades, especially the extreme wet episodes in 1990sand the extreme dry episodes in 2000s. Different dry or wettendencies can be identified in the Poyang Lake catchmentunder different seasons. Generally, drying tendency is foundto be dominant over the lake catchment in spring andautumn, while wet tendency will prevail in summer andwinter.
Because the different timescales of SPEI reflect the statusof different available water resources, this paper concludedthat the dry or wet episodes at different timescales may occursimultaneously and consequently produce extreme droughtor flood events. Historically, the encounter and overlap ofmultitimescales of meteorological dry/wet episodes is animportant background for several severe droughts and floodsacross the catchment.
In addition, this study revealed that the impact oftemperature anomaly to the dry/wet variability may not beneglected. In the Poyang catchment, negative temperaturedeparture during 1965–1986 can alleviate droughts in the dryyears and intensify floods in the wet years. Similarly, positivetemperature departure during 1998–2010 can alleviate floodsin the wet years and intensify droughts in the dry years. It
is anticipated that annual temperature will increase contin-uously in the future as a result of global warming; integrateconsideration of the joint effects of precipitation and temper-ature changes is needed for the objective characterization ofdry/wet conditions in those large lake catchments in humidclimatic zone.
Conflict of Interests
The authors declare that there is no conflict of interestsregarding the publication of this paper.
Acknowledgments
This work was financially supported by the National BasicResearch Program of China (2012CB417003), the Collab-orative Innovation Center for Major Ecological SecurityIssues of Jiangxi Province and Monitoring Implementation(JXS-EW-00), National Natural Science Foundation of China(41201026), and the Science Foundation of Nanjing Instituteof Geography and Limnology, Chinese Academy of Sciences(NIGLAS2012135001).
References
[1] IPCC, Climate Change: Fourth Assessment Report of the Inter-governmental Panel on Climate Change, Cambridge UniversityPress, Cambridge, UK, 2007.
[2] C.-Y. Xu, L. Gong, T. Jiang, D. Chen, andV. P. Singh, “Analysis ofspatial distribution and temporal trend of reference evapotran-spiration and pan evaporation in Changjiang (Yangtze River)catchment,” Journal of Hydrology, vol. 327, no. 1-2, pp. 81–93,2006.
[3] S. J. Dery, M. A. Hernandez-Henrıquez, J. E. Burford, and E. F.Wood, “Observational evidence of an intensifying hydrologicalcycle in northern Canada,”Geophysical Research Letters, vol. 36,no. 13, Article ID L13402, 2009.
[4] J. R. Thompson, “Modelling the impacts of climate change onupland catchments in southwest Scotland usingMIKE SHE andthe UKCP09 probabilistic projections,”Hydrology Research, vol.43, no. 4, pp. 507–530, 2012.
[5] M. M. Q. Mirza, “Global warming and changes in the proba-bility of occurrence of floods in Bangladesh and implications,”Global Environmental Change, vol. 12, no. 2, pp. 127–138, 2002.
[6] B. C. Bates, Z. W. Kundzewicz, S. Wu, and J. P. Palutikof,“Climate change and water,” Technical Paper of the Intergov-ernmental Panel on Climate Change, IPCC Secretariat, Geneva,Switzerland, 2008.
[7] Q. Zhang, C.-Y. Xu, and Z. X. Zhang, “Observed changes ofdrought/wetness episodes in the Pearl River basin, China,using the standardized precipitation index and aridity index,”Theoretical and Applied Climatology, vol. 98, no. 1-2, pp. 89–99,2009.
[8] C.-Y. Xu and V. P. Singh, “Review on regional water resourcesassessment models under stationary and changing climate,”Water Resources Management, vol. 18, no. 6, pp. 591–612, 2004.
[9] W. C. Palmer, “Meteorological drought,” Research Paper 45, USWeather Bureau, 1965.
10 Advances in Meteorology
[10] J. Sheffield and E. F. Wood, “Global trends and variabilityin soil moisture and drought characteristics, 1950–2000, fromobservation driven simulations of the terrestrial hydrologiccycle,” Journal of Climate, vol. 21, no. 3, pp. 432–458, 2008.
[11] J. Sheffield, E. F. Wood, and M. L. Roderick, “Little change inglobal drought over the past 60 years,”Nature, vol. 491, no. 7424,pp. 435–438, 2012.
[12] B. T. McKee, J. N. Doesken, and J. Kleist, “The relationship ofdrought frequency and duration to time scales,” in Proceed-ings of the 8th Conference on Applied Climatology, pp. 179–184, American Meteorological Society, Anaheim, Calif, USA,January 1993.
[13] O. Bothe, K. Fraedrich, andX. Zhu, “The large-scale circulationsand summer drought and wetness on the Tibetan plateau,”International Journal of Climatology, vol. 30, no. 6, pp. 844–855,2010.
[14] S. N. Rahmat, N. Jayasuriya, and M. Bhuiyan, “Assessingdroughts using meteorological drought indices in Victoria,Australia,”Hydrology Research, vol. 46, no. 3, pp. 463–476, 2015.
[15] R. Gosling, “Assessing the impact of projected climate changeon drought vulnerability in Scotland,” Hydrology Research, vol.45, no. 6, pp. 806–816, 2014.
[16] J. S. Wang, J. Y. Guo, Y. W. Zhou, and L. F. Yang, “Researchprogress and prospects of drought indicators,” Arid LandGeography, vol. 30, pp. 60–65, 2007.
[17] H. Wu, M. D. Svoboda, M. J. Hayes, D. A. Wilhite, and F.Wen, “Appropriate application of the standardized precipitationindex in arid locations and dry seasons,” International Journal ofClimatology, vol. 27, no. 1, pp. 65–79, 2007.
[18] L. Vergni and F. Todisco, “Spatio-temporal variability of precip-itation, temperature and agricultural drought indices in centralItaly,” Agricultural and Forest Meteorology, vol. 151, no. 3, pp.301–313, 2011.
[19] A. R. Nafarzadegan, M. Rezaeian Zadeh, M. Kherad et al.,“Drought area monitoring during the past three decades in Farsprovince, Iran,” Quaternary International, vol. 250, pp. 27–36,2012.
[20] M. Hayes, M. Svoboda, N. Wall, and M. Widhalm, “Thelincoln declaration on drought indices: universal meteorolog-ical drought index recommended,” Bulletin of the AmericanMeteorological Society, vol. 92, no. 4, pp. 485–488, 2011.
[21] A. G. Dai, “Drought under global warming: a review,” WileyInterdisciplinary Reviews: Climate Change, vol. 2, no. 1, pp. 45–65, 2011.
[22] S. M. Vicente-Serrano, S. Beguerıa, and J. I. Lopez-Moreno,“A multiscalar drought index sensitive to global warming: thestandardized precipitation evapotranspiration index,” Journal ofClimate, vol. 23, no. 7, pp. 1696–1718, 2010.
[23] H. Tao, H. Borth, K. Fraedrich, B. D. Su, X. H. Zhu, and Y.G. Bai, “Drought and wetness variability in the Tarim RiverBasin and connection to large-scale atmospheric circulation,”International Journal of Climatology, vol. 34, no. 8, pp. 2678–2684, 2014.
[24] H.Guo, B. Su, Y.Wang, andT. Jiang, “Runoff coefficients changeand the analysis of the relationship between climate factorsand runoff coefficients in Poyang Lake Basin (China):1955–2002,” Journal of Lake Sciences, vol. 19, no. 2, pp. 163–169, 2007(Chinese).
[25] S. Min and J. Liu, “Characteristics and causes of the extremeprecipitation anomaly in Lake Poyang area,” Journal of LakeSciences, vol. 23, no. 3, pp. 435–444, 2011 (Chinese).
[26] H. Tao, K. Fraedrich, C. Menz, and J. Q. Zhai, “Trends inextreme temperature indices in the Poyang Lake Basin, China,”Stochastic Environmental Research and Risk Assessment, vol. 28,no. 6, pp. 1543–1553, 2014.
[27] X. C. Ye, Q. Zhang, J. Liu, X.H. Li, andC.-Y. Xu, “Distinguishingthe relative impacts of climate change and human activities onvariation of stream flow in the Poyang Lake catchment, China,”Journal of Hydrology, vol. 494, pp. 83–95, 2013.
[28] S. Min, M. Yan, and J. Liu, “Climatic characteristics of thedrought in Lake Poyang catchment,” Journal of Lake Sciences,vol. 25, no. 1, pp. 65–72, 2013 (Chinese).
[29] X. H. Li, Q. Zhang, and X. C. Ye, “Dry/wet conditions monitor-ing based on TRMM rainfall data and its reliability validationover Poyang Lake Basin, China,” Water, vol. 5, no. 4, pp. 1848–1864, 2013.
[30] H. Guo, G. Q. Yin, and T. Jiang, “Prediction on the possibleclimate change of Poyang Lake basin in the future 50 years,”Resources and Environment in the Yangtze Basin, vol. 17, pp. 73–78, 2008 (Chinese).
[31] X. C. Ye, Q. Zhang, L. Bai, and Q. Hu, “A modeling study ofcatchment discharge to Poyang Lake under future climate inChina,” Quaternary International, vol. 244, no. 2, pp. 221–229,2011.
[32] Q.Min and L. Zhan, “Characteristics of low-water level changesin Lake Poyang during 1952–2011,” Journal of Lake Sciences, vol.24, no. 5, pp. 675–678, 2012 (Chinese).
[33] L.-L. Zhang, J.-X. Yin, Y.-X. Jiang, and H. Wang, “Relation-ship between the hydrological conditions and the distributionof vegetation communities within the Poyang Lake NationalNature Reserve, China,” Ecological Informatics, vol. 11, pp. 65–75, 2012.
[34] Q. Zhang, X.-C. Ye, A. D. Werner et al., “An investigation ofenhanced recessions in Poyang Lake: comparison of YangtzeRiver and local catchment impacts,” Journal of Hydrology, vol.517, pp. 425–434, 2014.
[35] Q. Hu, S. Feng, H. Guo, G. Chen, and T. Jiang, “Interactions ofthe Yangtze river flow and hydrologic processes of the PoyangLake, China,” Journal of Hydrology, vol. 347, no. 1-2, pp. 90–100,2007.
[36] C. W. Thomthwaite, “An approach toward a rational classifica-tion of climate,” Geophysical Review, vol. 8, pp. 55–94, 1948.
[37] J. Du, J. Fang, W. Xu, and P. J. Shi, “Analysis of dry/wetconditions using the standardized precipitation index and itspotential usefulness for drought/flood monitoring in HunanProvince, China,” Stochastic Environmental Research and RiskAssessment, vol. 27, no. 2, pp. 377–387, 2013.
[38] H. B.Mann, “Nonparametric tests against trend,” Econometrica,vol. 13, pp. 245–259, 1945.
[39] M. G. Kendall, Rank CorrelationMethods, Griffin, London, UK,1975.
[40] Q. Min, “Analysis on the flood characters in 1990s, PoyangLake,” Journal of Lake Sciences, vol. 14, no. 4, pp. 323–330, 2002(Chinese).
[41] Y. B. Liu, G. P. Wu, and X. S. Zhao, “Recent declines in China’slargest freshwater lake: trend or regime shift?” EnvironmentalResearch Letters, vol. 8, no. 1, Article ID 014010, 9 pages, 2013.
[42] H. X. Su andG.Q. Li, “Low–frequency drought variability basedon SPEI in association with climate indices in Beijing,” ActaEcologica Sinica, vol. 32, no. 17, pp. 5467–5475, 2012 (Chinese).
Advances in Meteorology 11
[43] L. Wang and W. Chen, “Characteristics of multi–times calevariabilities of the drought over last 100 years in SouthwestChina,” Advances in Meteorological Science and Technology, vol.2, pp. 21–26, 2012 (Chinese).
[44] X.-C. Ye, X.-H. Li, J. Liu, C.-Y. Xu, and Q. Zhang, “Variationof reference evapotranspiration and its contributing climaticfactors in the Poyang Lake catchment, China,” HydrologicalProcesses, vol. 28, no. 25, pp. 6151–6162, 2014.

Submit your manuscripts athttp://www.hindawi.com
Hindawi Publishing Corporationhttp://www.hindawi.com Volume 2014
ClimatologyJournal of
EcologyInternational Journal of
Hindawi Publishing Corporationhttp://www.hindawi.com Volume 2014
EarthquakesJournal of
Hindawi Publishing Corporationhttp://www.hindawi.com Volume 2014
Hindawi Publishing Corporationhttp://www.hindawi.com
Applied &EnvironmentalSoil Science
Volume 2014
Mining
Hindawi Publishing Corporationhttp://www.hindawi.com Volume 2014
Journal of
Hindawi Publishing Corporation http://www.hindawi.com Volume 2014
International Journal of
Geophysics
OceanographyInternational Journal of
Hindawi Publishing Corporationhttp://www.hindawi.com Volume 2014
Journal of Computational Environmental SciencesHindawi Publishing Corporationhttp://www.hindawi.com Volume 2014
Journal ofPetroleum Engineering
Hindawi Publishing Corporationhttp://www.hindawi.com Volume 2014
GeochemistryHindawi Publishing Corporationhttp://www.hindawi.com Volume 2014
Journal of
Atmospheric SciencesInternational Journal of
Hindawi Publishing Corporationhttp://www.hindawi.com Volume 2014
OceanographyHindawi Publishing Corporationhttp://www.hindawi.com Volume 2014
Advances in
Hindawi Publishing Corporationhttp://www.hindawi.com Volume 2014
MineralogyInternational Journal of
Hindawi Publishing Corporationhttp://www.hindawi.com Volume 2014
MeteorologyAdvances in
The Scientific World JournalHindawi Publishing Corporation http://www.hindawi.com Volume 2014
Paleontology JournalHindawi Publishing Corporationhttp://www.hindawi.com Volume 2014
ScientificaHindawi Publishing Corporationhttp://www.hindawi.com Volume 2014
Hindawi Publishing Corporationhttp://www.hindawi.com Volume 2014
Geological ResearchJournal of
Hindawi Publishing Corporationhttp://www.hindawi.com Volume 2014
Geology Advances in