Embed Size (px)
Citation preview
Research ArticleInteraction-Aware Video Community-Based Content Delivery inWireless Mobile Networks
Lujie Zhong1 Shijie Jia23 Youzhong Ma23 and Yongxin Zhang23
1 Information Engineering College Capital Normal University Beijing 100048 China2Central Plains Economic Zone Wisdom Tourism Cooperative Innovation Center Luoyang Normal UniversityLuoyang Henan 471934 China3Academy of Information Technology Luoyang Normal University Luoyang Henan 471934 China
Correspondence should be addressed to Shijie Jia shjjiagmailcom
Received 4 December 2015 Accepted 27 March 2016
Academic Editor Han-Chieh Chao
Copyright copy 2016 Lujie Zhong et al This is an open access article distributed under the Creative Commons Attribution Licensewhich permits unrestricted use distribution and reproduction in any medium provided the original work is properly cited
The increase in the demand of content quality and the number of mobile users brings new challenges for the multimedia streamingservices in wireless mobile networks The virtual community technologies are promising by grouping the users with commoncharacteristics to get the gains in the performance of resource lookup and system scalability In this paper we propose a novelinteraction-aware video community-based content delivery (IVCCD) in wireless mobile networks IVCCD collects and analyzesthe interaction information between users to construct user interaction model and further capture the common characteristics inthe request and delivery of video content IVCCD employs a partition-based community discovery scheme to group the mobileusers in terms of the common characteristics and uses a community member management mechanism and a resource sharingscheme to achieve low-cost community maintenance and high searching performance Extensive tests show how IVCCD achievesmuch better performance results in comparison with other state-of-the-art solutions
1 Introduction
The increase of communication capacities in wireless mobilenetworks supports the ubiquitous Internet access of mobileusers via smart devices (eg smart phones and tablet PC)to obtain multimedia services which require high bandwidth[1ndash7] As Figure 1 shows the mobile users make use ofmultiple network interfaces equipped in smart devices tofetch multimedia content in heterogeneous wireless mobilenetworks Video streaming is a popular application whichpromotes fast increase of mobile data traffic in the wholeworld [8] Provisioning video content to the mobile usesin wireless mobile networks can improve experience ofmobile users (eg the mobile video can enrich travel of pas-sengers in train or taxi) [9ndash11] The multimedia streamingsystems mainly employ peer-to-peer (P2P) technologies toaddress the problems of large-scale deployment [12ndash15] Inparticular the emerging mobile P2P (MP2P) technologiesprovide feasible solutions to support the deployment ofmobile video streaming system in wireless mobile networks
[16ndash18] However the increase in the number of viewers leadsto high cost in the management and scheduling of resourceswhich brings negative effects for the scalability and quality ofservice (QoS) of mobile video streaming systems
The performance of P2P-based resource sharing and peermanagement determine the QoS and scalability of multi-media streaming systems so numerous solutions focus onthe design of resource sharing and overlay network mainte-nance For instance COME-P2P in [19] groups the mobilenodes into a Chord structure to obtain high performance ofresource searching and delivery by making use of the routinginformation in overlay networks However the dynamicpeer state causes frequent reconstruction of Chord structurewhich increases the maintenance cost of systems Withincreasing number of peers the huge maintenance costbecomes the bottleneck of system scalability Bethanabhotlaet al proposed a video resource scheduling scheme inwireless networks [20] which supports the dynamic selectionof suppliers and adaptively regulates the data transmissionrate according to the video quality demand of requesters
Hindawi Publishing CorporationMobile Information SystemsVolume 2016 Article ID 4047213 13 pageshttpdxdoiorg10115520164047213
2 Mobile Information Systems
V2I
V2V
RSU
WLAN
WLAN
VANETs
4G5G node
Cellular network
MANETs
Media server
Internet
N
Figure 1 Multimedia streaming services in wireless mobile networks
However the adaptive supplier selection leads to high startupdelay due to the dynamic distribution of resources Except fora mass of network bandwidth requirement from high-qualityvideo delivery the resource redundancy fragile logical con-nection and frequent resource lookup failure in overlaynetworks also consume the large number of bandwidthsThehigh-efficiency video content delivery solutions should haveoptimal distribution and quick lookup for the video resourcesin overlay networks to support green communications formobile video streaming services
The virtual community technologies group the users withsimilar characteristics and define the user behaviors such assearch and sharing of resources The autonomous manage-ment of resources in the communities can make the balancebetween maintenance cost and searching performance ofresources to improve the system scalability For instanceSocialTube captures the common interests between sourcenode and users according to the number of watched videosand groups the users with similar interests into the tree-basedcommunities [21] However SocialTube only uses the similar-ity in the number of requested and stored contents to evaluatethe closeness of user relationship so that the fragile linkbetween users leads to frequent reconstruction of communitystructure SAVE in [22] uses two users with common charac-teristics in watched video content and time period to definethe relationship between communitymembers Although thesimilar content implies the probability of requesting the samecontent in the future the users with common interests stillneed to use the communicationwith each other to achieve theresource sharing inmultimedia streaming systemsTherefore
an efficient solution which makes use of the interaction be-haviors between users to tighten up the relationship betweencommunity members and improve searching performanceand system scalability should be considered for video sharingin wireless mobile networks
In this paper we propose a novel interaction-awarevideo community-based content delivery (IVCCD) in wirelessmobile networks By the investigation of interaction behaviorsbetween mobile users IVCCD builds a novel interactionmodel to find the common characteristics between mobileusers IVCCD employs a partition-based community discov-ery scheme to group themobile users with similar interactionbehaviors by the iterative refinement for the prepartitionedresults according to the serving capacities and contact close-ness ofmobile users In order to improve video resource shar-ing performance IVCCD formulates a community membermanagement mechanism and a resource sharing scheme thatdefines member role to achieve the autonomous communitymaintenance which optimizes resource distribution andbalances searching performance and community mainte-nance cost Simulation results based on the two mobilitymodels random and Gauss-Markov mobility model showhow IVCCD achieves much better performance results incomparison with other state-of-the-art solutions
2 Related Work
The existing P2P-based multimedia streaming systems makeuse of the optimization of resource searching and schedul-ing to improve video sharing performance in recent years
Mobile Information Systems 3
QHWC makes use of caching of video content based on thevehicle disconnectivity andmobility to optimize the resourcedistribution QHWC proposed two metrics LUR and QCRto ensure high QoS in Internet-based VANETs [23] Zhou etal analyze two classes of delayed control information distri-butions the class with finite mean and variance and a generalclass that does not employ any parametric representation inorder to understand how the DCI effects the performanceof wireless video transmission [24] The designed distributedvideo-scheduling scheme realizes the theoretical analysisCOME-P2P in [19] groups the nodes into a DHT structureto obtain the gains of fast resource searching COME-P2Pfurther makes use of the routing information and multicastpath to refine the finger table and routing table by the cross-layer technologies in order to enable smooth video playbackHowever COME-P2P relies on the large number of messageexchanges to support the update of node state and DHTreconstruction including joining and leaving of nodes Withthe increase in the number of nodes the message overheadbrings negative effects for system scalability and wastes massnetwork bandwidth Moreover the dynamic routing andround trip time (RTT) can accurately describe the nodemobility so that it is difficult to achieve the delivery ofvideo resources in near geographical distance The variationof routing and RTT leads to frequent update of fingertable which further increases the maintenance cost of DHTstructure Bethanabhotla et al make use of Lyapunov driftplus penalty approach to solve the formulated network utilitymaximization problem which achieves the self-adaption inthe supplier selection and transmission rate between usersand helpers in terms of the user demand for video quality[20] However the resource delivery capacities of nodes aredynamic with the change of network topologies in wirelessnetworks This leads to frequent switchover of link betweenusers and helpers which increases startup delay of users andinfluences the playback smoothness BOSA in [25] assignsthe servers in mobile clouds according to the last timeslotinformation of resource requests and makes use of the first-come-first-served rule to schedulemultimedia flows in orderto the impartial use of free time among the servers HoweverBOSA neglects the dynamic user demand for the multimediacontent so that it is difficult to achieve impartial schedulingfor the server resources
Recently the numerous researchers focus on the designof virtual community-based resource sharing solutions Forinstance SAVE in [22] investigates the user switchoverbehavior between video content and groups the nodes whichrequest the same content into the communities SAVE buildsthe connection between communities according to the videocontent contact in order to obtain high gains of video search-ing performance However the nodes which watch similarvideo content during the same time period form the com-munities which results in the low robustness and scalabilityof community structure Doulkeridis et al make use ofhierarchical and partitioning clustering method to group thenodes The ordinary nodes and super nodes with strongcapacities which store the same resources form a community[26] The super nodes make use of the stored resourceindex list to speed up the resource lookup process However
the proposed community discovery method relies on thestored same resources which leads to fragile relationshipbetween community members The static community struc-ture is difficult to adapt to the dynamic user demandnamely the variation of resources stored by the nodes causesfrequent reconstruction of community structure reducingthe performance of resource sharing and system scalabilitySANE in [27] maps various interest characteristics of usersinto an interest space where the characteristics of each userare corresponding to an interest vector in the space Thecosine value of two vectors is considered as the closenesslevel of social relationship However the estimation methodsbased on common interests lead to fragile and changefuluser relationship so that the community structure also issubjected to frequent reconstruction AMCV in [28] clustersthe nodes which store the same video chunk into thecommunity and builds two kinds of connections (static anddynamic connection) to bridge communities according tothe common interests of users for the video content whichsupports fast resource lookup However although the staticand dynamic connection can adapt to the change of userinterest and help the user to fast fetch desired resources theincrease in the number of communities results in the overloadof community broker nodes reducing the system scalability
The above community-based solutions have some defectssuch as fragile member relationship low scalability and highmaintenance cost of community In order to address theabove problems an efficient solution should accurately esti-mate user relationship and build the flexible and scalablecommunity structure to support fast lookup and high-efficiency delivery We investigate the interaction behaviorsamong the mobile users to discover the common interestsfor the video content and obtain the preference of fetchingcontent which can accurately evaluate the closeness of userrelationship and ensure stable community structure andhigh-efficiency sharing
3 IVCCD Overview
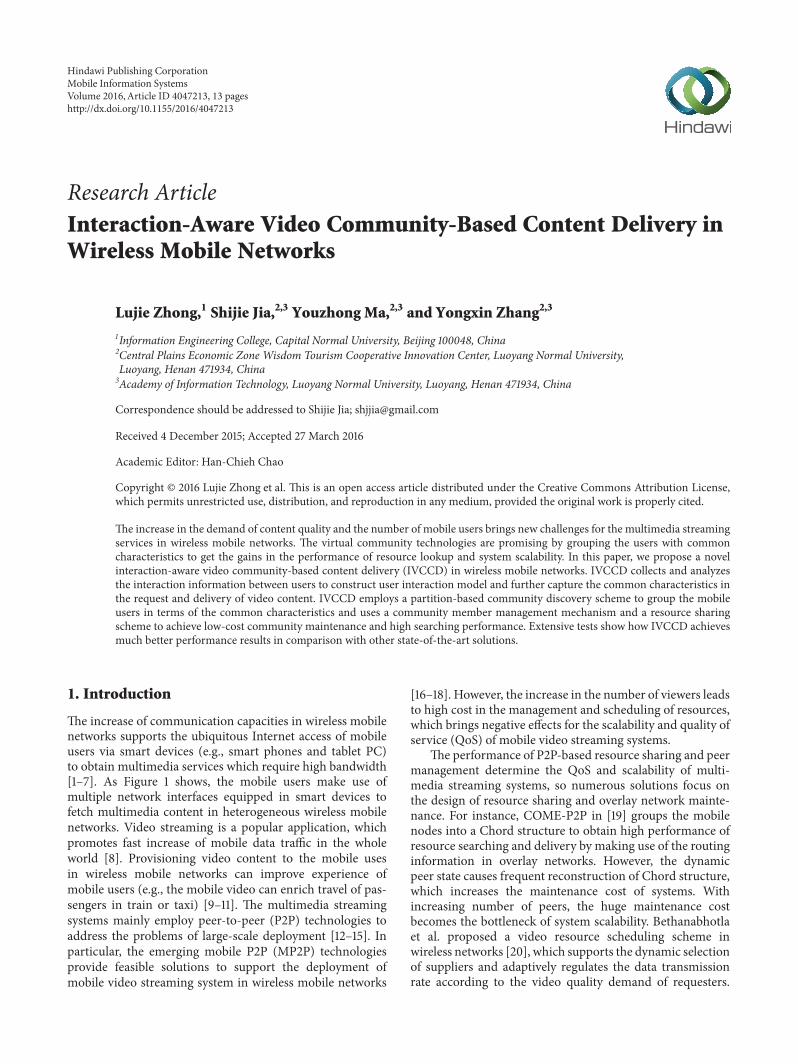
Figure 2 illustrates the design of IVCCD architecture whichincludes the interaction awareness community constructionand content delivery The mobile nodes join the multimediastreaming system by sending request message to the serveror overlay networks The server or the nodes which storesrequested video resources in overlay networks return aresponse message and transmit video data to the requestnodes The request nodes preferentially search and fetchvideo content from the suppliers in overlay networks in orderto reduce the server load If there are no requested resourcesin overlay networks the server provides the initial videocontent for the request nodesThe built connections betweenrequesters and suppliers are considered as the interactionbehaviors between nodes By the collection and analysisof node interaction behaviors the system can be aware ofinteraction range and frequentness of each node to discoverthe node set with close contact Based on the results ofcollection and analysis IVCCD uses a contact graph to buildthe interaction model which defines some important param-eters used in the community discovery algorithm such as
4 Mobile Information Systems
Community resourcedistribution
Community resourcesharing
Member role managementCommunity discovery
Interaction model Collection of interactionbehaviors
Content delivery
Community construction
Interaction awareness
IVCCD architecture
Figure 2 IVCCD architecture
the serving capacities of nodes and closeness between nodesThe community discovery algorithm uses the partitionmethodto obtain initial node sets in terms of node degree andmergesand refines these initial sets according to closeness betweennodes where these refined sets are considered as nodecommunitiesThemember role management defines the rolesand task for the community members and formulates themember maintenance scheme The distribution and sharingof community resource require the members to cooperativelystore video resources and formulate the intracommunity andintercommunity resource search algorithms
4 IVCCD Detailed Design
The interests for the video content drive the nodes to searchthe resources in P2P networks Because the suppliers arewatching or have stored the requested video they can providecorresponding video services for the requesters namely thesuppliers also are interested in the video content In fact therequesters and the suppliers have common interest for cur-rent video content and the request-response process betweenrequesters and suppliers is considered as an interactionThe traditional common interest discovery methods rely onthe analysis for historical records of watched video contentwhich difficultly in ensuring accuracy of common interestestimationThe interest-driven interaction not only describesthe accurate results of similarity in demand for the videocontent but also denotes the close relationship in contact Forinstance if the two nodes have close geographical locationsimilar demand and good communication quality theyalways keep frequent interactionThe nodes receive the videodata from the suppliers and record the information of suppli-ers When the nodes quit the system they send the messagescontaining the collected information of suppliers anddelivery(eg transmission delay and packet loss rate (PLR)) to theserver The server uses two tuples 119877 = (requester supplier)to denote the interaction between nodes An interaction set119878119877= (1198771 1198772 119877
119899) is stored at the server side
41 Interaction Awareness The servermakes use of a directedcontact graph 119866 = (119881 119864) to model the node interactionbehaviors119881 = (V
1 V2 V
119896) is a vertex set where any vertex
V119894denotes a node 119899
119894in the system Any edge 119890
119894119895in the edge
set 119864 denotes the interaction between 119899119894and 119899
119895 The two
nodes which have the edges such as 119899119894and 119899
119895are neighbor
relationship Any node 119899119894in the system may repeatedly fetch
the video from a supplier namely there is the difference forthe closeness of contact between nodes We define the edgeweight value 119908
119890119894119895to denote the closeness of contact between
nodes in terms of the interaction time The interaction timeindicates the transmission time of video data from suppliersto requesters The connection between nodes is fragile dueto the interest change namely when the nodes switch theplayback content to another video the data transmissionof both communication sides is discontinued The longinteraction time means that the nodes have strong interestfor the same video The estimation value of interaction timebetween 119899
119894and 119899119895is defined as
119908119890119894119895= arctan(
119873119894119895
sum
119888=1
119897119888) 119897 le 119871 119908
119890119894119895isin (0
120587
2) (1)
where 119897119888is an interaction time and 119873
119894119895is the number of
interaction between 119899119894and 119899119895119908119890119894119895also implies the preference
of supplier selection of the requester 119899119894except the contact
closeness For instance the mobile users preferentially fetchvideo content from other colleagues in workplaceThe degreeof each node in 119866 is the total number of in-degree andout-degree due to the directed edge which represents theinteraction range of nodesThe higher the node degree is thestronger the capacities of resource sharing are
The requesters always want to build the connection withthe suppliers which have high-quality delivery capacitieswhich ensures the watched quality of usersWe define servingcapacities of each node in terms of the delivery quality ofcontent by the investigation of transmission delay and PLRLet 119889119895119894and 119903119895119894denote the average delay and average PLR in
the process of data transmission from 119899119895to 119899119894 respectively
The serving capacities of 119899119895are defined as
119878119862119895=
sum119873119895
119888=1119903119895119888
119873119895
times log2(1 +
sum119873119895
119888=1119889119895119888
119873119895
) (2)
where 119873119895is the number of nodes which receive the data
transmission from 119899119895 The high transmission delay with
severe jitter breaks the playback smoothness and the highPLR cause the strong distortion of video screen reducing thewatched quality of users Further the low watched qualityalso results in the fragile connection between nodes namelythe requesters break current connection and re-search newsuppliers The nodes with strong serving capacities canattract more requesters to fetch the content in order to thebetter watched quality namely they have strong capacities ofresource sharing
42 Community Construction The robust and scalable com-munities not only require close relationship between mem-bers but also need the distinct boundaries to express
Mobile Information Systems 5
the difference of intercommunity nodes We employ a par-tition method for 119866 to construct the node communitieswhich includes two steps firstly the initial subgraphs areextracted from 119866 according to the node degree secondlythese subgraphs are combined or partitioned to constructnew subgraphs By the iteration of combination and partitionthe refined subgraphs are considered as the node commu-nities Although there is the probability of interaction forthe nodes which do not have edges in 119866 the frequency ofinteraction between them is less than that of nodes whichhave edges Therefore the graph partition-based communitystructure can obtain accurate clustering results
Firstly the node 119899119894which has the maximum value of
degree in 119881 is selected as the center node of a new subgraph119878119866(119899119894) The neighbor nodes of 119899
119894(the nodes have the edges
with 119899119894) are extracted from 119881 and become the members
of 119878119866(119899119894) In a similar way we continue to extract a new
subgraph 119878119866(119899119896) from the difference set 119881 minus 119878119866(119899
119894) The
condition of convergence of the above iteration is that allitems in119881 are partitioned into subgraphsThe nodes with thelarger degree have high dissemination capacities so that theinitial subgraphs have better resource sharing performanceHowever the partitioned results are limited to the selection ofinitial subgraph centers For instance the degree of noncentermembers in 119878119866(119899
119894) may be larger than that of center node
119899119896in 119878119866(119899
119896) Therefore the partitioned results need to be
refined namely the initial subgraphs are further partitionedor combined
Because the subgraphs are adjacent to each other thecombination mainly is to search the incorporable nodes inadjacent subgraphs For instance amember 119899
119886in 119878119866(119899
119894) finds
a neighbor node 119899ℎin 119878119866(119899
119896) If the weight value119908
119890119886ℎof 119890119886ℎis
larger than 119908119890ℎ119896
of edge 119890ℎ119896
between 119899ℎand 119899119896 119899ℎquits from
119878119866(119899119896) and becomes new member in 119878119866(119899
119894) When 119899
119886and
119899ℎhave two edges 119890
119886ℎand 119890ℎ119886
and 119899ℎand 119899
119896also have two
edges 119890119896ℎ
and 119890ℎ119896 we compare the total of 119908
119890119886ℎand 119908
119890ℎ119886with
that of 119908119890119896ℎ
and 119908119890ℎ119896
to make the decision of combinationIf (119908119890119886ℎ
+ 119908119890ℎ119886) gt (119908
119890119896ℎ+ 119908119890ℎ119896) 119899ℎleaves 119878119866(119899
119896) and joins
119878119866(119899119894) Otherwise if (119908
119890119886ℎ+ 119908119890ℎ119886) lt (119908
119890119896ℎ+ 119908119890ℎ119896) 119899ℎstays
in 119878119866(119899119896) With the subgraph combination if all members
in some subgraphs are merged into other subgraphs namelythese subgraphs only include center nodes the center nodesare marked as ordinary nodes and wait for the combinationby other subgraphsHowever the unlimited combination alsoleads to the inaccurate results For instance after themember119899119886in 119878119866(119899
119894) merges 119899
ℎ 119899ℎcontinues to search new nodes in
other subgraphs If this combination process continues thelongest path and member scale in 119878119866(119899
119894) keep increasing so
that the partitioned results become local optimumIn order to ensure the accuracy of partitioned results and
achieve the global optimum we define the merging noderule to make the decision of merging searched nodes by thecomparison of the state of subgraphs before and aftermergingthe nodes For instance let 119882(119878119866(119899
119894)) and 119862(119878119866(119899
119894)) be the
initial total of edgeweight value andnode capacities in 119878119866(119899119894)
respectively where 119882(sdot) and 119862(sdot) are the functions of calcu-lating the total of edge weight value and node capacities Anymember 119899
119886in 119878119866(119899
119894) wants to merge a member 119899
ℎin other
subgraphs If 119882(119878119866(119899119894))119873119864(119878119866(119899
119894)) le 119882(119878119866
(new)(119899119894))
119873119864(119878119866(new)
(119899119894)) and 119862(119878119866(119899
119894))119873119881(119878119866(119899
119894)) le
119862(119878119866(new)
(119899119894))119873119881(119878119866
(new)(119899119894)) 119899ℎis successfully merged
into 119878119866(119899119894) where 119878119866
(new)(119899119894) is new subgraph after the
combination and 119873119864(sdot) and 119873119881(sdot) return the number ofedges and nodes in graph respectively Otherwise 119899
ℎdoes
not become the new member in 119878119866(119899119894) and is marked as the
node which is unable to merge by 119899119886 In the next process
of searching nodes 119899119886ignores 119899
ℎ 119882(119878119866(119899
119894))119873119864(119878119866(119899
119894))
and 119862(119878119866(119899119894))119873119881(119878119866(119899
119894)) denote the mean value of edge
weight and node capacities in 119878119866(119899119894) respectively The
defined rule indicates that the new members cannot leadto the decrease in contact closeness and serving capacitiesfor current subgraphs which ensures the tight relationshipand high-quality service provision between members Theconvergence condition of combination and partition processfor the subgraphs is that all nodes in 119866 are grouped into thesubgraphs and the nodes in subgraphs stop to search newnodes in other subgraphs After the process of combinationand partition the existing subgraphs are considered asthe node communities The pseudocode of the process ofcommunity discovery is detailed in Algorithm 1
43 Content Delivery The community management mainlyincludes the role assignment and cache control of memberswhich reduces the maintenance cost of members and opti-mize the distribution of community resources We definethree roles for the community members ordinary memberbroker member and bridged member
(1) The ordinary members are responsible for the pro-vision of requested content delivery for the requesters andmake the replacement of cached content in terms of therequirement of broker members When a mobile node joinsthe system and becomes new community member thenode maintains a connection with any member in currentcommunity at least If the ordinary members quit currentcommunities they send a message to the neighbor membersin current communities
(2)The center nodes in subgraphs act as the broker mem-bers in communities and are responsible for the mainte-nance of cached resources of members and disseminationof resource request message The broker members with highdegree can achieve the fast and low-cost dissemination ofinformation including resource request and member state incommunities which reduces startup delay and deals with thevariation of resource demand of members in real timeWhenthe brokermembers receive the requestmessages they spreadthe messages to their neighbor members and require theseneighbor members to assist the resource searching Whenthe broker members quit communities the intracommunitymembers which have the high node degree become newbroker membersThe exited broker members require that theneighbor nodeswith themaximumdegree valuemaintain theinformation of their neighbor nodes
(3) The nodes located in boundary of subgraphs are con-sidered as the bridged members which are responsible formaintaining connections with the neighbor nodes in othercommunities and forwarding the request messages to other
6 Mobile Information Systems
(1) 119879119866 = 119866 119894 = 0 119895 = 0(2) lowast 119881 is node set in 119866 |119881| returns number of nodes in 119881119863(sdot) returns nodersquos degree (in-degree and out-degree) lowast(3) while(119879119866 is not NULL ampamp 119894 lt 119873119881(119866))(4) if 119863(119881[119894]) is maximum value of degree of nodes in 119879119866
(5) 119881[119894] and 119881[119894]rsquos neighbor nodes form a sub-graph 119878119866(119881[119894])(6) 119879119866 = 119866 minus 119878119866(119881[119894])(7) end if(8) 119894++(9) end while(10) lowast 119873119861
119881[119895]is set of 119881[119895]rsquos neighbor nodes in other sub-graphs |119873119861
119881[119895]| returns number of items in119873119861
119881[119895] lowast
(11) while(all nodes join into sub-graphs and all nodes stop to search new nodes)(12) if (119881[119895] is not center node)(13) for (119896 = 0 119896 lt |119873119861
119881[119895]| 119896++)
(14) if (119873119861119881[119895]
[119896] is not marked by 119881[119895] ampamp 119873119861119881[119895]
[119896]meets requirement of becoming new member)(15) 119873119861
119881[119895][119896] joins sub-graph of 119881[119895]
(16) else119873119861119881[119895]
[119896] is marked as unavailable node by 119881[119895](17) end if(18) end for(19) end if(20) 119895++(21) if (119895 ge |119881|)(22) 119895 = 0(23) end if(24) end while
Algorithm 1 Process of community discovery
communities Because the bridged members have the con-nectionswith the intercommunitymembers they are suitablefor becoming the interfaces between communities to achievethe resource sharing When the bridged members leavecurrent communities they send the information of theirneighbor nodes to any neighbor node in current communi-ties
When amember 119899119894in any community wants to download
a video content it firstly sends the request messages to theintracommunity neighbor members If the intracommunityneighbor members of 119899
119894store the requested resource they
return the response messages and 119899119894selects the member with
the maximum value of serving capacities as the supplierOtherwise if the neighbor members of 119899
119894do not provide
desired resource 119899119894requests the broker member to assist
searching resource by sending a request message containingthe information of requested resource and members whichhave been consulted by 119899
119894 The broker member disseminates
the request message to the neighbor members and requirethat these neighbor members continue to spread the requestmessage when they also do not store requested resource Ifthe broker member finds that there is no resource in currentcommunity it requires that the bridged members assistsearchingThe bridgedmembers directly forward the requestmessage to the broker members in adjacent communitiesIf the adjacent communities do not include the requestedresource 119899
119894directly requests the server to fetch the resource
because the lookup resource in the whole overlay networkbrings high startup delay The pseudocode of the process ofcontent delivery is detailed in Algorithm 2
With increasing storage capacities of mobile devices themobile nodes may carry one or multiple video resources Akey issue is how to make use of storage resource of mobilenodes to support high-efficiency resource sharingThe intra-community resource lookup can reduce the lookup delay dueto the relatively few forwarding nodes IVCCD employs thelocal resource lookup strategy in order to avoid the highlookup delay which reduces the lookup success rate There-fore we use a dissemination-aware resource distributionapproach to dynamically regulate community resource After119866 is divided into multiple communities the server collectsthe information of dissemination process of resources Forinstance a member 119899
119894in any community requests a video
content from the server because there are no availableresources in all communities The other requester connectswith 119899
119894and fetches resource namely the following members
search and select the suppliers in overlay networks Therequesters and suppliers form a tree structure in terms ofthe video streaming direction namely 119899
119894is the root node of
tree and 119899119894rsquos receivers which obtain the video data from 119899
119894
become child nodes of 119899119894 The server collects the information
of nodes in the above dissemination process and selects thenode 119899
119896with the maximum receivers as the dissemination
relay node which is defined as two-tuple 119877119873 = (119899119896VID119888)
where VID119888denotes the ID of video 119888 We group these relay
nodes according to the similarity of watched videos Thesimilarity between two videos VID
119886and VID
119887is defined as
119878119886119887
=
1003816100381610038161003816119899119904119886 cap 119899119904119887
1003816100381610038161003816
max [10038161003816100381610038161198991199041198861003816100381610038161003816 1003816100381610038161003816119899119904119887
1003816100381610038161003816] (3)
Mobile Information Systems 7
(1) lowast 119899119894is request node in a community 119862
ℎ 119899119895is broker member in 119862
ℎ 119899119896is bridged member in 119862
ℎ lowast
(2) 119899119894sends request messages to neighbor members maintained by 119899
119894
(3) if(119899119894receives response messages)
(4) for(119896 = 0 119896 lt 119898 119896++)(5) estimates serving capacities of member
119896by (2)
(6) end for(7) selects member with maximum value of serving capacities as supplier(8) else 119899
119894sends request message to 119899
119895
(9) 119899119895forwards message to other members
(10) if(119899119895receives response messages)
(11) 119899119895returns member list to 119899
119894
(12) else 119899119895forward request message to 119899
119896
(13) if (119899119896successfully receives response from other communities)
(14) 119899119896returns list of candidate suppliers to 119899
119894
(15) 119899119894estimates serving capacities by (2) and select supplier
(16) else 119899119896forward request message to server
(17) end if(18) end if(19) end if(20) 119899
119896receives video data from supplier (server)
Algorithm 2 Process of content delivery
where 119899119904119886and 119899119904
119887are the sets of nodes which watch VID
119886
and VID119887 respectively and |119899119904
119886cap 119899119904119887| returns the number
of intersection between 119899119904119886and 119899119904
119887 If 119878119886119887
gt 119878 where 119878 isthe mean value of similarity of all videos VID
119886and VID
119887
are similar in content Because each video is correspondingto a relay node there is a relationship between the similarvideo set and the relay node set When a member fetches avideo from the server the server requires that the nodes in thecorresponding relay node set buffer and spread the requestedvideo which is beneficial to speeding up the resource dissem-ination with the help of multiple relay nodesThe relay nodessend the messages containing current resources to the brokermembers and require the broker members to spread theresource information in communities If there are memberswhich are interested in pushed resource these membersconnect with the intracommunity relay nodes to obtain theresource Although the resource disseminationmessages leadto the increase in the message overhead the small number ofbandwidth consumptions reduces the lookup delay
5 Testing and Test Results Analysis
51 Testing Topology and Scenarios We compare the perfor-mance of the proposed IVCCD with a state-of-the-art P2P-based video sharing solution AMCV [28] The number ofvideo files is 20 and the length of each file is 100 s IVCCDand AMCV were modeled and implemented in NS-2 wheresome simulation parameters of the wireless mobile networkare listed in Table 1 for the two solutions
Before the simulation in terms of created 6000 playbacklogs for 30 video files IVCCD analyzes these logs to group100 mobile nodes into the communities and group the videoswith similar content and 100 mobile users in AMCV ran-domly request 20 videos and join into the communities cor-responding to 20 videos which are same as those of IVCCD
Table 1 Simulation parameter setting for wireless mobile network
Parameters ValuesArea 1000 times 1000m2
Channel ChannelWirelessChannelNetwork interface PhyWirelessPhyExtMAC interface Mac802 11Number of mobile nodes 500Mobile speed range of nodes [1 20]msSimulation time 500 sSignal range of mobile nodes 200mDefault distance between server andnodes 6 hops
Transmission protocol UDPWireless routing protocol DSRBandwidth of server 20MbsBandwidth of mobile nodes 10MbsTransmission rate of video data 128 kbs
In the process of simulation we generate 100 playbacklogs for the 100 community members namely they watchdiverse video content according to the playback logs wherethe watched time is 10 random Moreover we also create100 playback logs for the 100 mobile nodes namely theyrandomly request and play video content (join correspondingcommunities) according to the created playback logs wherethe viewing time also is random 100 mobile nodes join thesystem following the Poisson distribution from 0 s to 450 sIn IVCCD and AMCV all community member only store avideo file and the mobile nodes delete the local resource andrebuffer new resources when they play new videos
8 Mobile Information Systems
AMCV-RMMIVCCD-RMM
200 250 300
Simulation time (s)350 400 450 500
25
15
05
0
1
2
3
500 100 150
Aver
age s
tart
up d
elay
(s)
Figure 3 ASD with RMM against simulation time
On the other hand we use two mobility models (1) Thefirst is randommobility model (RMM) Initially the locationspeed and moving target of mobile nodes are randomlyassigned When the mobile nodes arrive at the assignedtarget they keep themovement state following the r-assignedrandom moving target and speed (2) The second is Gauss-Markov mobility model (GMM) [29] Initially the locationand moving target of mobile nodes are randomly assignedThe mobile nodes experience the state of acceleration stableturn and deceleration in the process of movement Whenthe mobile nodes arrive at the assigned target location theycontinue to move according to the reassigned target Becausethe movement with high speed influences the performanceof content delivery such as delay and PLR the mobile speedrange of nodes is set to [1 20]ms The default distancebetween server and nodes is set to 6 hops in order to ensurethe equitable cost of fetching resources and differentiate theaccess cost for the server and the mobile nodes In AMCV119875119879119887and 119875119879
119903are set to 02 and 012 respectively
52 Performance Evaluation The performance of IVCCD iscompared with that of AMCV in terms of average startupdelay (ASD) packet loss rate (PLR) throughput video qual-ity and overlay maintenance cost respectively
ASD Let 119905119894(119904) and 119905
119894(119903) be the time of sending requestmessage
and receiving first video data of a node 119899119894 respectively 119905
119894(119903) minus
119905119894(119904) is considered as the startup delay of 119899
119894 The mean value
of startup delay of all nodes during a time interval 119879 denotesASD
Figures 3 and 4 show the performance of ASD of twosolutions AMCV and IVCCD in terms of two mobilitymodels RMM and GMMwith the increase in the simulationtime where the time interval 119879 is set to 20 s As Figure 3shows AMCVrsquos ASD results firstly experience a fall after risefrom 119905 = 0 s to 119905 = 140 s AMCVrsquos curve also fast increasesfrom 119905 = 160 s to 119905 = 280 s and fast decreases from 119905 = 300 s to119905 = 500 s AMCVrsquos ASD results are in the delay range between12 s and 275 s and reach the peak value 2748 at 119905 = 280 sIVCCDrsquos curve fast increases from 119905 = 0 s to 119905 = 100 s and
AMCV-GMMIVCCD-GMM
200 250 300
Simulation time (s)350 400 450 500
25
15
05
0
1
2
3
500 100 150
Aver
age s
tart
up d
elay
(s)
Figure 4 ASD with GMM against simulation time
Aver
age s
tart
up d
elay
(s)
20 40 60 80 100 120 140 160 180 200
0
1
2
3
Number of request nodes
AMCV-RMMIVCCD-RMM
Figure 5 ASD with RMM against number of request nodes
relatively slowly falls with slight fluctuation from 119905 = 100 sto 119905 = 200 s The red curve also fast rises from 119905 = 220 s to119905 = 280 s and slowly decreases to roughly 1 s at 119905 = 500 s withslight fluctuation In Figure 4 the two curves correspondingto the delay results of AMCV and IVCCD experience the twoprocesses of rise and fall The blue curve has a fall after risewith the fluctuation from 119905 = 0 s to 119905 = 180 s starts to increasefrom 119905 = 200 s and decreases from 119905 = 340 s to 119905 = 500 s afterreaching the peak value (2571 s) at 119905 = 340 s The red curvefirstly experiences a fall after rise with the fluctuation from119905 = 0 s to 119905 = 200 s and keeps the fluctuation at high levelsIVCCDrsquos results also have a fall after rise from 119905 = 220 s to 119905 =500 s and reach the peak value (2718 s) at 119905 = 360 s AlthoughIVCCDrsquos results are higher than those ofAMCVduring initialsimulation time IVCCDrsquos curve maintains lower level thanthat of AMCV
Figures 5 and 6 show the performance of ASD of AMCVand IVCCD in terms of RMM and GMM with increasingnumber of nodes As Figure 5 shows AMCVrsquos blue curvehas two processes of rise and fall with increasing numberof request nodes and AMCVrsquos results are in the range (155250) IVCCDrsquos red curve also experiences the two variation
Mobile Information Systems 9Av
erag
e sta
rtup
del
ay (s
)
20 40 60 80 100 120 140 160 180 200
0
1
2
3
Number of request nodes
AMCV-GMMIVCCD-GMM
Figure 6 ASD with GMM against number of request nodes
process of rise and fall with the fluctuation and IVCCDrsquosresults are in the range (125 220) In Figure 6 AMCVrsquosblue curve shows a process of rise and fall with the frequentfluctuation and AMCVrsquos results are in the range (145 255)IVCCDrsquos results are kept in a stable interval (13 22) with thefluctuation IVCCDrsquos results have both lower values and lessfluctuation than those of AMCV
The delay of searching and transmission determinesthe performance of startup delay After the construction ofcommunities AMCV relies on the static and dynamic con-nections between communities to forward the request mes-sage where the dynamic connections are built by the prob-ability of requesting resources of community members Thelow accuracy of prediction results leads to the fact that thedynamic connections cannot be built so that the requestmes-sages cannot fast arrive at the suppliers Moreover AMCVdoes not consider the performance of resource deliverybetween nodes so that the low delay of data transmissioncannot be ensured On the other hand if there are noavailable suppliers in overlay network the request nodes needto connect with the server to obtain the initial resourcesBecause the default distance between server and nodes isset to 6 hops the high data transmission delay also bringsnegative effects for the startup delay For instance AMCVrsquosASD value reaches 229 s at 119905 = 80 s and IVCCDrsquos ASD valueskeep high level from 119905 = 80 s to 119905 = 140 s In IVCCD therequest nodes only search the suppliers in current andadjacent communities which reduces the searching delayIVCCD makes use of the buffering and dissemination ofresources of relay nodes to enlarge the coverage range ofrequested resources in overlay network which furtherreduces the searching delay of resources Moreover IVCCDinvestigates the serving capacities of community membersand the requested nodes can select the optimal suppliers toimprove the delivery performance Therefore IVCCDrsquos ASDresults are better than those of AMCV
Packet Loss Rate (PLR) Let119873119904and119873
119903be the number of sent
and received packets respectively The mean value of ratiobetween 119873
119904minus 119873119903and 119873
119904during a time interval 119879 is defined
as PLR
AMCV-RMMIVCCD-RMM
200 250 300
Simulation time (s)350 400 450 50050 100 150
Pack
et lo
ss ra
te
0
01
02
03
04
05
Figure 7 PLR with RMM against simulation time
AMCV-GMMIVCCD-GMM
200 250 300
Simulation time (s)350 400 450 50050 100 150
0
01
02
03
04
05
Pack
et lo
ss ra
te
Figure 8 PLR with GMM against simulation time
Figures 7 and 8 show the PLR performance of AMCVand IVCCD in terms of RMM and GMM with increasingsimulation time where the time interval 119879 is set to 50 s AsFigure 7 shows the curves ofAMCVand IVCCDhave similarchanging process namely they experience fall after fast risewith the increase in the simulation time where 119879 is set to50 s Although IVCCDrsquos curve keeps higher level than that ofAMCV from 119905 = 150 s to 119905 = 200 s AMCVrsquos results haveboth larger PLR values and higher increment than those ofIVCCD where the curves of AMCV and IVCCD reach thepeak value 044 and 038 at 119905 = 350 s respectively In Figure 8the results of AMCV and IVCCD show the trend of fall afterrise during the whole simulation time The curve of IVCCDis higher than that of AMCV from 119905 = 0 s to 119905 = 200 s butit has lower increment and peak value than those of AMCVfrom 119905 = 250 s to 119905 = 500 s
Figures 9 and 10 show the PLR performance of AMCVand IVCCD in terms of RMM andGMMwith the increase inthe number of nodes As Figure 9 shows the curves of AMCVand IVCCD also have a rise trend with the increase in thenumber of request nodes where119879 is defined as the timewhenevery 20 request nodes start to search resources The AMCV
10 Mobile Information Systems
0
01
02
03
04
05
20 40 60 80 100 120 140 160 180 200
Number of request nodes
AMCV-RMMIVCCD-GMM
Pack
et lo
ss ra
te
Figure 9 PLR with RMM against number of request nodes
0
01
02
03
04
05
20 40 60 80 100 120 140 160 180 200
Number of request nodes
AMCV-GMMIVCCD-GMM
Pack
et lo
ss ra
te
Figure 10 PLR with GMM against number of request nodes
results are between [003 041] and reach the peak value 041when the number of request nodes is 200 The red curvecorresponding to the IVCCD results is between 004 and 037and keeps lower levels than that of AMCVThe IVCCD resultsare roughly 10 lower than those of AMCV In Figure 10AMCVrsquos curve experiences the three processes slow rise andfast and stable increase IVCCDrsquos results have slow increaseand keep uniform rise Although the IVCCDrsquos curve is higherthan that of AMCV during initial stage IVCCDrsquos results arelower than those of AMCVduring the later period of increasein the number of nodes
Initially because the small number of nodes requestvideos the relatively enough network bandwidth can supportthe high-efficiency delivery namely the PLR results of twosolutions keep low levels When the number of request nodesincreases the available network bandwidth is consumed fastso that the PLR results of AMCV and IVCCD fast increasedue to the network congestion Because the request nodesstop the resource searching from 119905 = 450 s to 119905 = 500 sand some of them have finished video playback the fastdecrease of congestion levels and network traffic lead to fastfall of two curves On the other hand AMCV only focus on
AMCV-RMMIVCCD-RMM
200 250 300
Simulation time (s)350 400 450 500500 100 150
0
1000
2000
3000
4000
5000
6000
7000
8000
Thro
ughp
ut (k
bs)
Figure 11 Throughput with RMM against simulation time
the efficiency of resource searching and neglect the perfor-mance of content deliveryThe nodes in AMCV cannot selectthe optimal suppliers which leads to the fact that the deliveryprocess of content is subjected to the severe negative influencein wireless mobile network The high mobility of mobilenodes results in the fast change of geographical distancebetween two communication parties which introduces thejitter of delivery performance and increases the probabilitiesof packet loss IVCCD investigates the interaction betweennodes and the serving capacities of nodes to build thecommunities Moreover the relay nodes can assist spreadingresources tomultiple communities which enhances the prob-abilities of intracommunity delivery Therefore the requestnodes select optimal suppliers which ensures high-efficiencydata transmission
Average Throughput Let 119873119901119903 and size
119901be the number and
size of packets received in the overlay during a certain timeperiod 119879 respectivelyThe ratio between119873
119901119903times size
119901and 119879 is
defined as the average throughput where 119879 is set to 20 sFigures 11 and 12 show the average throughput perfor-
mance of AMCV and IVCCD in terms of RMM and GMMwith increasing simulation time where the time interval 119879 isset to 20 s As Figure 11 shows the curves of average through-put of AMCV and IVCCD have similar changing trend withincreasing simulation time The blue curve corresponding toAMCVrsquos results fast increases from 119905 = 0 s to 119905 = 300 s andkeeps a slight rise from 119905 = 320 s to 119905 = 440 s AMCVrsquos resultsdecrease to 4465 kbs from 119905 = 460 s to 119905 = 500 s IVCCDrsquosred curve keeps a fast rise from 119905 = 0 s to 119905 = 100 s and slowlyincreases from 119905 = 120 s to 119905 = 140 s This red curve also fastincreases from 119905 = 160 s to 119905 = 440 s and finally decreases to4842 kbs at 119905 = 500 s Although IVCCDrsquos curve is lower thanthat of AMCV from 119905 = 120 s to 119905 = 240 s the increment andpeak value of IVCCD results are larger than those of AMCVIn Figure 12 the two curves of AMCV and IVCCD also havesimilar variation process during the whole simulation timeThe blue curve fast increases from 119905 = 0 s to 119905 = 200 s keepsslow rise from 119905 = 220 s to 119905 = 420 s and fast decreases afterreaching the peak value at 119905 = 420 s The red curve also has
Mobile Information Systems 11
AMCV-GMMIVCCD-GMM
200 250 300
Simulation time (s)350 400 450 500500 100 150
0
1000
2000
3000
4000
5000
6000
7000
8000
Thro
ughp
ut (k
bs)
Figure 12 Throughput with GMM against simulation time
a fast rise from 119905 = 0 s to 119905 = 280 s keeps slow increase from119905 = 300 s to 119905 = 440 s and starts to fall from 119905 = 460 s to 119905 =
500 s Although IVCCDrsquos results are less than those of AMCVfrom 119905 = 0 s to 119905 = 200 s IVCCDrsquos curve is higher than thatof AMCV and has larger peak value than that of AMCV
The mobile nodes for two solutions AMCV and IVCCDrequest and fetch the video content following a Poisson distri-bution from 119905 = 0 s to 119905 = 450 s The increase in the numberof request nodes causes fast rise of network traffic The twocurves corresponding to AMCV and IVCCD fast increasefrom 119905 = 0 s to 119905 = 440 s and rapidly fall from 119905 = 460 s to 119905 =500 s due to the decrease in the amount of video streamingBecause the high traffic is greater than the available networkbandwidth the generated network congestion leads to highPLR so that the throughput of AMCV and IVCCD keepsslow increase from 119905 = 300 s to 119905 = 440 s In AMCV therequest nodes randomly select the suppliers so the deliveryperformance of video content is subjected to severe influenceby the network congestion and mobility of nodes In IVCCDthe request nodes select the suppliers with maximum servingcapacities which reduce the negative effects by the networkcongestion and mobility of nodes Therefore the deliveryperformance of IVCCD including average throughput andPLR is better than that of AMCV
Video Quality Let EXP Thr and CRT Thr be the averagethroughput expected from the video delivery and actualthroughput measured respectively MAX Bit denotes theaverage bitrate of the video stream and MAX Bit and EXPThr are set to 128 kbs according to the simulation settingsWe make use of the Peak Signal-to-Noise Ratio (PSNR) tomeasure the video quality of two solutions in decibels (dB)[30] The PSNR value is calculated according to
PSNR = 20 sdot log10(
MAX Bit
radic(EXP Thr minus CRT Thr)2) (4)
Figures 13 and 14 show the PSNR performance of AMCVand IVCCD in terms of RMM and GMM with increasing
20 40 60 80 100 120 140 160 180 200
PSN
R
Number of request nodes
35
30
25
20
15
10
0
5
AMCV-RMMIVCCD-RMM
Figure 13 PSNR with RMM against number of request nodes
20 40 60 80 100 120 140 160 180 200
PSN
R
Number of request nodes
35
30
25
20
15
10
0
5
AMCV-GMMIVCCD-GMM
Figure 14 PSNR with GMM against number of request nodes
number of request nodes Figure 13 shows PSNR values ofAMCV and IVCCD for the single video streaming corre-sponding to every request node with the increase in thenumber of request nodes The two curves of AMCV andIVCCD have a fast fall trend where AMCVrsquos results are inthe range [7 30] and IVCCDrsquos results are between 8 dB and28 dB In Figure 14 AMCVrsquos results fast decrease with theincrease in the number of request nodes However IVCCDrsquosresults keep a stable decrease Although the IVCCDrsquos resultsare lower than those of AMCV in the initial phase IVCCDrsquosbars are higher than those of AMCV in the later stage
PSNR represents the watched quality of users andincludes some key impact factors such as throughput andstream bitrate With the increase in the number of requestnodes the huge traffic triggers the network congestion whichseriously limits the increase of throughput due to high PLRIn other words PSNR values keep low level with decreasingthroughput In AMCV the performance of content deliverybetween request nodes and suppliers is subjected to theinfluence by the node mobility and network congestion InIVCCD the high-efficiency data transmission benefit fromthe strong serving capacities of suppliers Therefore thecongestion period time is longer than that of IVCCD and
12 Mobile Information Systems
50 100 150 200 250 300 350 400 450 500
Simulation time (s)
5
4
3
2
1
Mes
sage
ove
rhea
d (k
bs)
AMCVIVCCD
Figure 15 Maintenance overhead against simulation time
the decrement of AMCVrsquos PSNR values is larger than that ofIVCCD
Maintenance Overhead The maintenance cost of overlaytopology mainly includes the management of member stateforwarded request message and interaction between com-munities We use the average bandwidth used by the sentmessages for maintaining the overlay topology to denote themaintenance overhead
As Figure 15 shows the two curves of AMCV and IVCCDhave fast rise trajectory with the increase in the simulationtime AMCVrsquos blue curve keeps fast rise from 119905 = 50 s to119905 = 450 s and slightly decreases at 119905 = 500 s IVCCDrsquos redcurve maintains a slow increase from 119905 = 50 s to 119905 = 450 sand finally decreases at 119905 = 500 s The increment and peakvalue of AMCVrsquos results are larger than those of IVCCD
In AMCV the broker members need to forward andhandle the messages of requesting resources and memberstate and maintain the static and dynamic connections withother communities The increase in the number of requestnodes and dynamic connections leads to high load of brokermembers which limits the system scalability Moreover thefrequent change of requested content of communitymemberscauses the continuous movement of nodes between com-munities The fragile community structure further increasesthe maintenance cost However IVCCD has stable commu-nity structure and the dynamic change of requested videosof members cannot cause the community reconstructionAlthough the broker members assist spreading resourceinformation in communities and the bridgedmembersmain-tain the connections with other communities the rangeof message dissemination is relatively limited and is lowfrequency Therefore IVCCDrsquos maintenance overhead keepslower levels than that of AMCV
6 Conclusion
In this paper we propose a novel interaction-aware com-munity-based video sharing solution (IVCCD) in wirelessmobile networks IVCCD constructs a directed graph-based
interaction model according to the analysis of interactionbehaviors between the mobile users In order to obtainscalable and robust community structure IVCCD partitionsnodes in graph in terms of the node degree and usesthe weight values of edges and serving capacities of nodesas refined rules to generate the node community IVCCDemploys a multiple role-based community member manage-ment mechanism to balance the community maintenancecost and optimize resource distribution IVCCD analyzes theresource dissemination process in overlay networks and usesthe resource push and prebuffering approach to improve theperformance of resource searching The simulation resultsbased on the two mobility models random and Gauss-Markovmobility model show how IVCCDhas lower averagestartup delay less packet loss rate higher throughput highervideo quality and lower maintenance overhead than AMCVThe simulation results also show that the mobility is animportant influence factor for the performance of multime-dia streaming systems In the future work we focus on themodeling of mobility of mobile nodes and the evaluationof mobility influence for the performance of multimediastreaming systems
Competing Interests
The authors declare that there is no conflict of interestsregarding the publication of this paper
Acknowledgments
This work was supported in part by the National NaturalScience Foundation of China (NSFC) under Grant nos61402303 61501216 61502219 61572246 and U1404611 theProject of BeijingMunicipal Commission of Education underGrant KM201510028016 the Science and Technology KeyProject of Henan province (152102210331 and 152102210332)and Technology Plan Projects (Openness amp Cooperation) ofHenan province (152106000048)
References
[1] L Zhou H-C Chao and A V Vasilakos ldquoJoint forensics-scheduling strategy for delay-sensitive multimedia applicationsover heterogeneous networksrdquo IEEE Journal on Selected Areasin Communications vol 29 no 7 pp 1358ndash1367 2011
[2] S Chen and J Zhao ldquoThe requirements challenges and tech-nologies for 5G of terrestrial mobile telecommunicationrdquo IEEECommunications Magazine vol 52 no 5 pp 36ndash43 2014
[3] F Song R Li and H Zhou ldquoFeasibility and issues for establish-ing network-based carpooling schemerdquo Pervasive and MobileComputing vol 24 pp 4ndash15 2015
[4] HWang S Chen H Xu M Ai and Y Shi ldquoSoftNet a softwaredefined decentralized mobile network architecture toward 5GrdquoIEEE Network vol 29 no 2 pp 16ndash22 2015
[5] C-F Lai R-H Hwang H-C Chao M M Hassan and AAlamri ldquoA buffer-aware HTTP live streaming approach forSDN-enabled 5G wireless networksrdquo IEEE Network vol 29 no1 pp 49ndash55 2015
Mobile Information Systems 13
[6] C Xu T Liu J Guan H Zhang and G-M Muntean ldquoCMT-QA quality-aware adaptive concurrent multipath data transferin heterogeneous wireless networksrdquo IEEE Transactions onMobile Computing vol 12 no 11 pp 2193ndash2205 2013
[7] Y Ye S Ci N Lin and Y Qian ldquoCross-layer design for delay-and energy-constrained multimedia delivery in mobile termi-nalsrdquo IEEE Wireless Communications vol 21 no 4 pp 62ndash692014
[8] CiscoCiscoVisual Networking Index GlobalMobile Data TrafficForecast Update 2012ndash2017 Cisco 2013
[9] O T Cruces M Fiore and J M B Ordinas ldquoCooperativedownload in vehicular environmentsrdquo IEEE Transactions onMobile Computing vol 11 no 4 pp 663ndash678 2012
[10] E Baccarelli F Chiti N Cordeschi et al ldquoGreen multimediawireless sensor networks distributed intelligent data fusionin-network processing and optimized resource managementrdquoIEEE Wireless Communications vol 21 no 4 pp 20ndash26 2014
[11] S Jia C Xu J Guan H Zhang and G-M Muntean ldquoA novelcooperative content fetching-based strategy to increase thequality of video delivery to mobile users in wireless networksrdquoIEEE Transactions on Broadcasting vol 60 no 2 pp 370ndash3842014
[12] Y Zhao Y Liu C Chen and J Zhang ldquoEnabling P2P one-viewmultiparty video conferencingrdquo IEEE Transactions on Paralleland Distributed Systems vol 25 no 1 pp 73ndash82 2014
[13] C Xu S Jia L Zhong and G-M Muntean ldquoSocially awaremobile peer-to-peer communications for community multime-dia streaming servicesrdquo IEEE Communications Magazine vol53 no 10 pp 150ndash156 2015
[14] D Wu Y Liang J He and X Hei ldquoBalancing performanceand fairness in P2P live video systemsrdquo IEEE Transactions onCircuits and Systems for Video Technology vol 23 no 6 pp1029ndash1039 2013
[15] C-L Chang W-M Chen and C-H Hung ldquoReliable consid-eration of P2P-based VoD system with interleaved video framedistributionrdquo IEEE Systems Journal vol 8 no 1 pp 304ndash3122014
[16] W Zhang Z Li and Q Zheng ldquoSAMP supporting multi-source heterogeneity in mobile P2P IPTV systemrdquo IEEE Trans-actions on Consumer Electronics vol 59 no 4 pp 772ndash7782013
[17] N Kumar J-H Lee and J J P C Rodrigues ldquoIntelligentmobilevideo surveillance system as a Bayesian coalition game in vehic-ular sensor networks learning automata approachrdquo IEEETrans-actions on Intelligent Transportation Systems vol 16 no 3 pp1148ndash1161 2015
[18] C Xu F Zhao J Guan H Zhang and G-M Muntean ldquoQoE-driven user-centric vod services in urban multihomed P2P-based vehicular networksrdquo IEEE Transactions on VehicularTechnology vol 62 no 5 pp 2273ndash2289 2013
[19] J-L Kuo C-H Shih C-Y Ho and Y-C Chen ldquoA cross-layerapproach for real-time multimedia streaming on wireless peer-to-peer ad hoc networkrdquoAdHocNetworks vol 11 no 1 pp 339ndash354 2013
[20] D Bethanabhotla G Caire and M J Neely ldquoAdaptive videostreaming for wireless networks with multiple users andhelpersrdquo IEEE Transactions on Communications vol 63 no 1pp 268ndash285 2015
[21] H Shen Z Li Y Lin and J Li ldquoSocialtube P2P-assisted videosharing in online social networksrdquo IEEETransactions on Paralleland Distributed Systems vol 25 no 9 pp 2428ndash2440 2014
[22] H Shen Y Lin and J Li ldquoA social-network-aided efficientpeer-to-peer live streaming systemrdquo IEEEACMTransactions onNetworking vol 23 no 3 pp 987ndash1000 2015
[23] N Kumar S Zeadally and J J P C Rodrigues ldquoQoS-awarehierarchical web caching scheme for online video streamingapplications in internet-based vehicular ad hoc networksrdquo IEEETransactions on Industrial Electronics vol 62 no 12 pp 7892ndash7900 2015
[24] L Zhou Z Yang Y Wen and J J P C Rodrigues ldquoDistributedwireless video scheduling with delayed control informationrdquoIEEE Transactions on Circuits and Systems for Video Technologyvol 24 no 5 pp 889ndash901 2014
[25] L Zhou Z Yang J J P C Rodrigues andM Guizani ldquoExplor-ing blind online scheduling for mobile cloud multimedia ser-vicesrdquo IEEE Wireless Communications vol 20 no 3 pp 54ndash612013
[26] C Doulkeridis A Vlachou K Noslashrvag Y Kotidis and MVazirgiannis ldquoEfficient search based on content similarity overself-organizing P2P networksrdquo Peer-to-Peer Networking andApplications vol 3 no 1 pp 67ndash79 2010
[27] H Shen Y Lin and J Li ldquoSocial connections in user-generatedcontent video systems analysis and recommendationrdquo IEEETransactions on Parallel and Distributed Systems vol 26 no 1pp 252ndash261 2015
[28] C Xu S Jia L Zhong H Zhang and G-M Muntean ldquoAnt-inspired mini-community-based solution for video-on-de-mand services in wireless mobile networksrdquo IEEE Transactionson Broadcasting vol 60 no 2 pp 322ndash335 2014
[29] D Perdana and R F Sari ldquoPerformance evaluation of corruptedsignal caused by randomway point and GaussMarkovmobilitymodel on IEEE 16094 standardsrdquo in Proceedings of the 4th IEEEInternational Symposium on Next-Generation Electronics (ISNErsquo15) May 2015
[30] C Xu Z Li J Li H Zhang and G-M Muntean ldquoCross-layerfairness-driven concurrent multipath video delivery over het-erogeneous wireless networksrdquo IEEE Transactions on Circuitsand Systems for Video Technology vol 25 no 7 pp 1175ndash11892015
Submit your manuscripts athttpwwwhindawicom
Computer Games Technology
International Journal of
Hindawi Publishing Corporationhttpwwwhindawicom Volume 2014
Hindawi Publishing Corporationhttpwwwhindawicom Volume 2014
Distributed Sensor Networks
International Journal of
Advances in
FuzzySystems
Hindawi Publishing Corporationhttpwwwhindawicom
Volume 2014
International Journal of
ReconfigurableComputing
Hindawi Publishing Corporation httpwwwhindawicom Volume 2014
Hindawi Publishing Corporationhttpwwwhindawicom Volume 2014
Applied Computational Intelligence and Soft Computing
thinspAdvancesthinspinthinsp
Artificial Intelligence
HindawithinspPublishingthinspCorporationhttpwwwhindawicom Volumethinsp2014
Advances inSoftware EngineeringHindawi Publishing Corporationhttpwwwhindawicom Volume 2014
Hindawi Publishing Corporationhttpwwwhindawicom Volume 2014
Electrical and Computer Engineering
Journal of
Journal of
Computer Networks and Communications
Hindawi Publishing Corporationhttpwwwhindawicom Volume 2014
Hindawi Publishing Corporation
httpwwwhindawicom Volume 2014
Advances in
Multimedia
International Journal of
Biomedical Imaging
Hindawi Publishing Corporationhttpwwwhindawicom Volume 2014
ArtificialNeural Systems
Advances in
Hindawi Publishing Corporationhttpwwwhindawicom Volume 2014
RoboticsJournal of
Hindawi Publishing Corporationhttpwwwhindawicom Volume 2014
Hindawi Publishing Corporationhttpwwwhindawicom Volume 2014
Computational Intelligence and Neuroscience
Industrial EngineeringJournal of
Hindawi Publishing Corporationhttpwwwhindawicom Volume 2014
Modelling amp Simulation in EngineeringHindawi Publishing Corporation httpwwwhindawicom Volume 2014
The Scientific World JournalHindawi Publishing Corporation httpwwwhindawicom Volume 2014
Hindawi Publishing Corporationhttpwwwhindawicom Volume 2014
Human-ComputerInteraction
Advances in
Computer EngineeringAdvances in
Hindawi Publishing Corporationhttpwwwhindawicom Volume 2014

2 Mobile Information Systems
V2I
V2V
RSU
WLAN
WLAN
VANETs
4G5G node
Cellular network
MANETs
Media server
Internet
N
Figure 1 Multimedia streaming services in wireless mobile networks
However the adaptive supplier selection leads to high startupdelay due to the dynamic distribution of resources Except fora mass of network bandwidth requirement from high-qualityvideo delivery the resource redundancy fragile logical con-nection and frequent resource lookup failure in overlaynetworks also consume the large number of bandwidthsThehigh-efficiency video content delivery solutions should haveoptimal distribution and quick lookup for the video resourcesin overlay networks to support green communications formobile video streaming services
The virtual community technologies group the users withsimilar characteristics and define the user behaviors such assearch and sharing of resources The autonomous manage-ment of resources in the communities can make the balancebetween maintenance cost and searching performance ofresources to improve the system scalability For instanceSocialTube captures the common interests between sourcenode and users according to the number of watched videosand groups the users with similar interests into the tree-basedcommunities [21] However SocialTube only uses the similar-ity in the number of requested and stored contents to evaluatethe closeness of user relationship so that the fragile linkbetween users leads to frequent reconstruction of communitystructure SAVE in [22] uses two users with common charac-teristics in watched video content and time period to definethe relationship between communitymembers Although thesimilar content implies the probability of requesting the samecontent in the future the users with common interests stillneed to use the communicationwith each other to achieve theresource sharing inmultimedia streaming systemsTherefore
an efficient solution which makes use of the interaction be-haviors between users to tighten up the relationship betweencommunity members and improve searching performanceand system scalability should be considered for video sharingin wireless mobile networks
In this paper we propose a novel interaction-awarevideo community-based content delivery (IVCCD) in wirelessmobile networks By the investigation of interaction behaviorsbetween mobile users IVCCD builds a novel interactionmodel to find the common characteristics between mobileusers IVCCD employs a partition-based community discov-ery scheme to group themobile users with similar interactionbehaviors by the iterative refinement for the prepartitionedresults according to the serving capacities and contact close-ness ofmobile users In order to improve video resource shar-ing performance IVCCD formulates a community membermanagement mechanism and a resource sharing scheme thatdefines member role to achieve the autonomous communitymaintenance which optimizes resource distribution andbalances searching performance and community mainte-nance cost Simulation results based on the two mobilitymodels random and Gauss-Markov mobility model showhow IVCCD achieves much better performance results incomparison with other state-of-the-art solutions
2 Related Work
The existing P2P-based multimedia streaming systems makeuse of the optimization of resource searching and schedul-ing to improve video sharing performance in recent years
Mobile Information Systems 3
QHWC makes use of caching of video content based on thevehicle disconnectivity andmobility to optimize the resourcedistribution QHWC proposed two metrics LUR and QCRto ensure high QoS in Internet-based VANETs [23] Zhou etal analyze two classes of delayed control information distri-butions the class with finite mean and variance and a generalclass that does not employ any parametric representation inorder to understand how the DCI effects the performanceof wireless video transmission [24] The designed distributedvideo-scheduling scheme realizes the theoretical analysisCOME-P2P in [19] groups the nodes into a DHT structureto obtain the gains of fast resource searching COME-P2Pfurther makes use of the routing information and multicastpath to refine the finger table and routing table by the cross-layer technologies in order to enable smooth video playbackHowever COME-P2P relies on the large number of messageexchanges to support the update of node state and DHTreconstruction including joining and leaving of nodes Withthe increase in the number of nodes the message overheadbrings negative effects for system scalability and wastes massnetwork bandwidth Moreover the dynamic routing andround trip time (RTT) can accurately describe the nodemobility so that it is difficult to achieve the delivery ofvideo resources in near geographical distance The variationof routing and RTT leads to frequent update of fingertable which further increases the maintenance cost of DHTstructure Bethanabhotla et al make use of Lyapunov driftplus penalty approach to solve the formulated network utilitymaximization problem which achieves the self-adaption inthe supplier selection and transmission rate between usersand helpers in terms of the user demand for video quality[20] However the resource delivery capacities of nodes aredynamic with the change of network topologies in wirelessnetworks This leads to frequent switchover of link betweenusers and helpers which increases startup delay of users andinfluences the playback smoothness BOSA in [25] assignsthe servers in mobile clouds according to the last timeslotinformation of resource requests and makes use of the first-come-first-served rule to schedulemultimedia flows in orderto the impartial use of free time among the servers HoweverBOSA neglects the dynamic user demand for the multimediacontent so that it is difficult to achieve impartial schedulingfor the server resources
Recently the numerous researchers focus on the designof virtual community-based resource sharing solutions Forinstance SAVE in [22] investigates the user switchoverbehavior between video content and groups the nodes whichrequest the same content into the communities SAVE buildsthe connection between communities according to the videocontent contact in order to obtain high gains of video search-ing performance However the nodes which watch similarvideo content during the same time period form the com-munities which results in the low robustness and scalabilityof community structure Doulkeridis et al make use ofhierarchical and partitioning clustering method to group thenodes The ordinary nodes and super nodes with strongcapacities which store the same resources form a community[26] The super nodes make use of the stored resourceindex list to speed up the resource lookup process However
the proposed community discovery method relies on thestored same resources which leads to fragile relationshipbetween community members The static community struc-ture is difficult to adapt to the dynamic user demandnamely the variation of resources stored by the nodes causesfrequent reconstruction of community structure reducingthe performance of resource sharing and system scalabilitySANE in [27] maps various interest characteristics of usersinto an interest space where the characteristics of each userare corresponding to an interest vector in the space Thecosine value of two vectors is considered as the closenesslevel of social relationship However the estimation methodsbased on common interests lead to fragile and changefuluser relationship so that the community structure also issubjected to frequent reconstruction AMCV in [28] clustersthe nodes which store the same video chunk into thecommunity and builds two kinds of connections (static anddynamic connection) to bridge communities according tothe common interests of users for the video content whichsupports fast resource lookup However although the staticand dynamic connection can adapt to the change of userinterest and help the user to fast fetch desired resources theincrease in the number of communities results in the overloadof community broker nodes reducing the system scalability
The above community-based solutions have some defectssuch as fragile member relationship low scalability and highmaintenance cost of community In order to address theabove problems an efficient solution should accurately esti-mate user relationship and build the flexible and scalablecommunity structure to support fast lookup and high-efficiency delivery We investigate the interaction behaviorsamong the mobile users to discover the common interestsfor the video content and obtain the preference of fetchingcontent which can accurately evaluate the closeness of userrelationship and ensure stable community structure andhigh-efficiency sharing
3 IVCCD Overview
Figure 2 illustrates the design of IVCCD architecture whichincludes the interaction awareness community constructionand content delivery The mobile nodes join the multimediastreaming system by sending request message to the serveror overlay networks The server or the nodes which storesrequested video resources in overlay networks return aresponse message and transmit video data to the requestnodes The request nodes preferentially search and fetchvideo content from the suppliers in overlay networks in orderto reduce the server load If there are no requested resourcesin overlay networks the server provides the initial videocontent for the request nodesThe built connections betweenrequesters and suppliers are considered as the interactionbehaviors between nodes By the collection and analysisof node interaction behaviors the system can be aware ofinteraction range and frequentness of each node to discoverthe node set with close contact Based on the results ofcollection and analysis IVCCD uses a contact graph to buildthe interaction model which defines some important param-eters used in the community discovery algorithm such as
4 Mobile Information Systems
Community resourcedistribution
Community resourcesharing
Member role managementCommunity discovery
Interaction model Collection of interactionbehaviors
Content delivery
Community construction
Interaction awareness
IVCCD architecture
Figure 2 IVCCD architecture
the serving capacities of nodes and closeness between nodesThe community discovery algorithm uses the partitionmethodto obtain initial node sets in terms of node degree andmergesand refines these initial sets according to closeness betweennodes where these refined sets are considered as nodecommunitiesThemember role management defines the rolesand task for the community members and formulates themember maintenance scheme The distribution and sharingof community resource require the members to cooperativelystore video resources and formulate the intracommunity andintercommunity resource search algorithms
4 IVCCD Detailed Design
The interests for the video content drive the nodes to searchthe resources in P2P networks Because the suppliers arewatching or have stored the requested video they can providecorresponding video services for the requesters namely thesuppliers also are interested in the video content In fact therequesters and the suppliers have common interest for cur-rent video content and the request-response process betweenrequesters and suppliers is considered as an interactionThe traditional common interest discovery methods rely onthe analysis for historical records of watched video contentwhich difficultly in ensuring accuracy of common interestestimationThe interest-driven interaction not only describesthe accurate results of similarity in demand for the videocontent but also denotes the close relationship in contact Forinstance if the two nodes have close geographical locationsimilar demand and good communication quality theyalways keep frequent interactionThe nodes receive the videodata from the suppliers and record the information of suppli-ers When the nodes quit the system they send the messagescontaining the collected information of suppliers anddelivery(eg transmission delay and packet loss rate (PLR)) to theserver The server uses two tuples 119877 = (requester supplier)to denote the interaction between nodes An interaction set119878119877= (1198771 1198772 119877
119899) is stored at the server side
41 Interaction Awareness The servermakes use of a directedcontact graph 119866 = (119881 119864) to model the node interactionbehaviors119881 = (V
1 V2 V
119896) is a vertex set where any vertex
V119894denotes a node 119899
119894in the system Any edge 119890
119894119895in the edge
set 119864 denotes the interaction between 119899119894and 119899
119895 The two
nodes which have the edges such as 119899119894and 119899
119895are neighbor
relationship Any node 119899119894in the system may repeatedly fetch
the video from a supplier namely there is the difference forthe closeness of contact between nodes We define the edgeweight value 119908
119890119894119895to denote the closeness of contact between
nodes in terms of the interaction time The interaction timeindicates the transmission time of video data from suppliersto requesters The connection between nodes is fragile dueto the interest change namely when the nodes switch theplayback content to another video the data transmissionof both communication sides is discontinued The longinteraction time means that the nodes have strong interestfor the same video The estimation value of interaction timebetween 119899
119894and 119899119895is defined as
119908119890119894119895= arctan(
119873119894119895
sum
119888=1
119897119888) 119897 le 119871 119908
119890119894119895isin (0
120587
2) (1)
where 119897119888is an interaction time and 119873
119894119895is the number of
interaction between 119899119894and 119899119895119908119890119894119895also implies the preference
of supplier selection of the requester 119899119894except the contact
closeness For instance the mobile users preferentially fetchvideo content from other colleagues in workplaceThe degreeof each node in 119866 is the total number of in-degree andout-degree due to the directed edge which represents theinteraction range of nodesThe higher the node degree is thestronger the capacities of resource sharing are
The requesters always want to build the connection withthe suppliers which have high-quality delivery capacitieswhich ensures the watched quality of usersWe define servingcapacities of each node in terms of the delivery quality ofcontent by the investigation of transmission delay and PLRLet 119889119895119894and 119903119895119894denote the average delay and average PLR in
the process of data transmission from 119899119895to 119899119894 respectively
The serving capacities of 119899119895are defined as
119878119862119895=
sum119873119895
119888=1119903119895119888
119873119895
times log2(1 +
sum119873119895
119888=1119889119895119888
119873119895
) (2)
where 119873119895is the number of nodes which receive the data
transmission from 119899119895 The high transmission delay with
severe jitter breaks the playback smoothness and the highPLR cause the strong distortion of video screen reducing thewatched quality of users Further the low watched qualityalso results in the fragile connection between nodes namelythe requesters break current connection and re-search newsuppliers The nodes with strong serving capacities canattract more requesters to fetch the content in order to thebetter watched quality namely they have strong capacities ofresource sharing
42 Community Construction The robust and scalable com-munities not only require close relationship between mem-bers but also need the distinct boundaries to express
Mobile Information Systems 5
the difference of intercommunity nodes We employ a par-tition method for 119866 to construct the node communitieswhich includes two steps firstly the initial subgraphs areextracted from 119866 according to the node degree secondlythese subgraphs are combined or partitioned to constructnew subgraphs By the iteration of combination and partitionthe refined subgraphs are considered as the node commu-nities Although there is the probability of interaction forthe nodes which do not have edges in 119866 the frequency ofinteraction between them is less than that of nodes whichhave edges Therefore the graph partition-based communitystructure can obtain accurate clustering results
Firstly the node 119899119894which has the maximum value of
degree in 119881 is selected as the center node of a new subgraph119878119866(119899119894) The neighbor nodes of 119899
119894(the nodes have the edges
with 119899119894) are extracted from 119881 and become the members
of 119878119866(119899119894) In a similar way we continue to extract a new
subgraph 119878119866(119899119896) from the difference set 119881 minus 119878119866(119899
119894) The
condition of convergence of the above iteration is that allitems in119881 are partitioned into subgraphsThe nodes with thelarger degree have high dissemination capacities so that theinitial subgraphs have better resource sharing performanceHowever the partitioned results are limited to the selection ofinitial subgraph centers For instance the degree of noncentermembers in 119878119866(119899
119894) may be larger than that of center node
119899119896in 119878119866(119899
119896) Therefore the partitioned results need to be
refined namely the initial subgraphs are further partitionedor combined
Because the subgraphs are adjacent to each other thecombination mainly is to search the incorporable nodes inadjacent subgraphs For instance amember 119899
119886in 119878119866(119899
119894) finds
a neighbor node 119899ℎin 119878119866(119899
119896) If the weight value119908
119890119886ℎof 119890119886ℎis
larger than 119908119890ℎ119896
of edge 119890ℎ119896
between 119899ℎand 119899119896 119899ℎquits from
119878119866(119899119896) and becomes new member in 119878119866(119899
119894) When 119899
119886and
119899ℎhave two edges 119890
119886ℎand 119890ℎ119886
and 119899ℎand 119899
119896also have two
edges 119890119896ℎ
and 119890ℎ119896 we compare the total of 119908
119890119886ℎand 119908
119890ℎ119886with
that of 119908119890119896ℎ
and 119908119890ℎ119896
to make the decision of combinationIf (119908119890119886ℎ
+ 119908119890ℎ119886) gt (119908
119890119896ℎ+ 119908119890ℎ119896) 119899ℎleaves 119878119866(119899
119896) and joins
119878119866(119899119894) Otherwise if (119908
119890119886ℎ+ 119908119890ℎ119886) lt (119908
119890119896ℎ+ 119908119890ℎ119896) 119899ℎstays
in 119878119866(119899119896) With the subgraph combination if all members
in some subgraphs are merged into other subgraphs namelythese subgraphs only include center nodes the center nodesare marked as ordinary nodes and wait for the combinationby other subgraphsHowever the unlimited combination alsoleads to the inaccurate results For instance after themember119899119886in 119878119866(119899
119894) merges 119899
ℎ 119899ℎcontinues to search new nodes in
other subgraphs If this combination process continues thelongest path and member scale in 119878119866(119899
119894) keep increasing so
that the partitioned results become local optimumIn order to ensure the accuracy of partitioned results and
achieve the global optimum we define the merging noderule to make the decision of merging searched nodes by thecomparison of the state of subgraphs before and aftermergingthe nodes For instance let 119882(119878119866(119899
119894)) and 119862(119878119866(119899
119894)) be the
initial total of edgeweight value andnode capacities in 119878119866(119899119894)
respectively where 119882(sdot) and 119862(sdot) are the functions of calcu-lating the total of edge weight value and node capacities Anymember 119899
119886in 119878119866(119899
119894) wants to merge a member 119899
ℎin other
subgraphs If 119882(119878119866(119899119894))119873119864(119878119866(119899
119894)) le 119882(119878119866
(new)(119899119894))
119873119864(119878119866(new)
(119899119894)) and 119862(119878119866(119899
119894))119873119881(119878119866(119899
119894)) le
119862(119878119866(new)
(119899119894))119873119881(119878119866
(new)(119899119894)) 119899ℎis successfully merged
into 119878119866(119899119894) where 119878119866
(new)(119899119894) is new subgraph after the
combination and 119873119864(sdot) and 119873119881(sdot) return the number ofedges and nodes in graph respectively Otherwise 119899
ℎdoes
not become the new member in 119878119866(119899119894) and is marked as the
node which is unable to merge by 119899119886 In the next process
of searching nodes 119899119886ignores 119899
ℎ 119882(119878119866(119899
119894))119873119864(119878119866(119899
119894))
and 119862(119878119866(119899119894))119873119881(119878119866(119899
119894)) denote the mean value of edge
weight and node capacities in 119878119866(119899119894) respectively The
defined rule indicates that the new members cannot leadto the decrease in contact closeness and serving capacitiesfor current subgraphs which ensures the tight relationshipand high-quality service provision between members Theconvergence condition of combination and partition processfor the subgraphs is that all nodes in 119866 are grouped into thesubgraphs and the nodes in subgraphs stop to search newnodes in other subgraphs After the process of combinationand partition the existing subgraphs are considered asthe node communities The pseudocode of the process ofcommunity discovery is detailed in Algorithm 1
43 Content Delivery The community management mainlyincludes the role assignment and cache control of memberswhich reduces the maintenance cost of members and opti-mize the distribution of community resources We definethree roles for the community members ordinary memberbroker member and bridged member
(1) The ordinary members are responsible for the pro-vision of requested content delivery for the requesters andmake the replacement of cached content in terms of therequirement of broker members When a mobile node joinsthe system and becomes new community member thenode maintains a connection with any member in currentcommunity at least If the ordinary members quit currentcommunities they send a message to the neighbor membersin current communities
(2)The center nodes in subgraphs act as the broker mem-bers in communities and are responsible for the mainte-nance of cached resources of members and disseminationof resource request message The broker members with highdegree can achieve the fast and low-cost dissemination ofinformation including resource request and member state incommunities which reduces startup delay and deals with thevariation of resource demand of members in real timeWhenthe brokermembers receive the requestmessages they spreadthe messages to their neighbor members and require theseneighbor members to assist the resource searching Whenthe broker members quit communities the intracommunitymembers which have the high node degree become newbroker membersThe exited broker members require that theneighbor nodeswith themaximumdegree valuemaintain theinformation of their neighbor nodes
(3) The nodes located in boundary of subgraphs are con-sidered as the bridged members which are responsible formaintaining connections with the neighbor nodes in othercommunities and forwarding the request messages to other
6 Mobile Information Systems
(1) 119879119866 = 119866 119894 = 0 119895 = 0(2) lowast 119881 is node set in 119866 |119881| returns number of nodes in 119881119863(sdot) returns nodersquos degree (in-degree and out-degree) lowast(3) while(119879119866 is not NULL ampamp 119894 lt 119873119881(119866))(4) if 119863(119881[119894]) is maximum value of degree of nodes in 119879119866
(5) 119881[119894] and 119881[119894]rsquos neighbor nodes form a sub-graph 119878119866(119881[119894])(6) 119879119866 = 119866 minus 119878119866(119881[119894])(7) end if(8) 119894++(9) end while(10) lowast 119873119861
119881[119895]is set of 119881[119895]rsquos neighbor nodes in other sub-graphs |119873119861
119881[119895]| returns number of items in119873119861
119881[119895] lowast
(11) while(all nodes join into sub-graphs and all nodes stop to search new nodes)(12) if (119881[119895] is not center node)(13) for (119896 = 0 119896 lt |119873119861
119881[119895]| 119896++)
(14) if (119873119861119881[119895]
[119896] is not marked by 119881[119895] ampamp 119873119861119881[119895]
[119896]meets requirement of becoming new member)(15) 119873119861
119881[119895][119896] joins sub-graph of 119881[119895]
(16) else119873119861119881[119895]
[119896] is marked as unavailable node by 119881[119895](17) end if(18) end for(19) end if(20) 119895++(21) if (119895 ge |119881|)(22) 119895 = 0(23) end if(24) end while
Algorithm 1 Process of community discovery
communities Because the bridged members have the con-nectionswith the intercommunitymembers they are suitablefor becoming the interfaces between communities to achievethe resource sharing When the bridged members leavecurrent communities they send the information of theirneighbor nodes to any neighbor node in current communi-ties
When amember 119899119894in any community wants to download
a video content it firstly sends the request messages to theintracommunity neighbor members If the intracommunityneighbor members of 119899
119894store the requested resource they
return the response messages and 119899119894selects the member with
the maximum value of serving capacities as the supplierOtherwise if the neighbor members of 119899
119894do not provide
desired resource 119899119894requests the broker member to assist
searching resource by sending a request message containingthe information of requested resource and members whichhave been consulted by 119899
119894 The broker member disseminates
the request message to the neighbor members and requirethat these neighbor members continue to spread the requestmessage when they also do not store requested resource Ifthe broker member finds that there is no resource in currentcommunity it requires that the bridged members assistsearchingThe bridgedmembers directly forward the requestmessage to the broker members in adjacent communitiesIf the adjacent communities do not include the requestedresource 119899
119894directly requests the server to fetch the resource
because the lookup resource in the whole overlay networkbrings high startup delay The pseudocode of the process ofcontent delivery is detailed in Algorithm 2
With increasing storage capacities of mobile devices themobile nodes may carry one or multiple video resources Akey issue is how to make use of storage resource of mobilenodes to support high-efficiency resource sharingThe intra-community resource lookup can reduce the lookup delay dueto the relatively few forwarding nodes IVCCD employs thelocal resource lookup strategy in order to avoid the highlookup delay which reduces the lookup success rate There-fore we use a dissemination-aware resource distributionapproach to dynamically regulate community resource After119866 is divided into multiple communities the server collectsthe information of dissemination process of resources Forinstance a member 119899
119894in any community requests a video
content from the server because there are no availableresources in all communities The other requester connectswith 119899
119894and fetches resource namely the following members
search and select the suppliers in overlay networks Therequesters and suppliers form a tree structure in terms ofthe video streaming direction namely 119899
119894is the root node of
tree and 119899119894rsquos receivers which obtain the video data from 119899
119894
become child nodes of 119899119894 The server collects the information
of nodes in the above dissemination process and selects thenode 119899
119896with the maximum receivers as the dissemination
relay node which is defined as two-tuple 119877119873 = (119899119896VID119888)
where VID119888denotes the ID of video 119888 We group these relay
nodes according to the similarity of watched videos Thesimilarity between two videos VID
119886and VID
119887is defined as
119878119886119887
=
1003816100381610038161003816119899119904119886 cap 119899119904119887
1003816100381610038161003816
max [10038161003816100381610038161198991199041198861003816100381610038161003816 1003816100381610038161003816119899119904119887
1003816100381610038161003816] (3)
Mobile Information Systems 7
(1) lowast 119899119894is request node in a community 119862
ℎ 119899119895is broker member in 119862
ℎ 119899119896is bridged member in 119862
ℎ lowast
(2) 119899119894sends request messages to neighbor members maintained by 119899
119894
(3) if(119899119894receives response messages)
(4) for(119896 = 0 119896 lt 119898 119896++)(5) estimates serving capacities of member
119896by (2)
(6) end for(7) selects member with maximum value of serving capacities as supplier(8) else 119899
119894sends request message to 119899
119895
(9) 119899119895forwards message to other members
(10) if(119899119895receives response messages)
(11) 119899119895returns member list to 119899
119894
(12) else 119899119895forward request message to 119899
119896
(13) if (119899119896successfully receives response from other communities)
(14) 119899119896returns list of candidate suppliers to 119899
119894
(15) 119899119894estimates serving capacities by (2) and select supplier
(16) else 119899119896forward request message to server
(17) end if(18) end if(19) end if(20) 119899
119896receives video data from supplier (server)
Algorithm 2 Process of content delivery
where 119899119904119886and 119899119904
119887are the sets of nodes which watch VID
119886
and VID119887 respectively and |119899119904
119886cap 119899119904119887| returns the number
of intersection between 119899119904119886and 119899119904
119887 If 119878119886119887
gt 119878 where 119878 isthe mean value of similarity of all videos VID
119886and VID
119887
are similar in content Because each video is correspondingto a relay node there is a relationship between the similarvideo set and the relay node set When a member fetches avideo from the server the server requires that the nodes in thecorresponding relay node set buffer and spread the requestedvideo which is beneficial to speeding up the resource dissem-ination with the help of multiple relay nodesThe relay nodessend the messages containing current resources to the brokermembers and require the broker members to spread theresource information in communities If there are memberswhich are interested in pushed resource these membersconnect with the intracommunity relay nodes to obtain theresource Although the resource disseminationmessages leadto the increase in the message overhead the small number ofbandwidth consumptions reduces the lookup delay
5 Testing and Test Results Analysis
51 Testing Topology and Scenarios We compare the perfor-mance of the proposed IVCCD with a state-of-the-art P2P-based video sharing solution AMCV [28] The number ofvideo files is 20 and the length of each file is 100 s IVCCDand AMCV were modeled and implemented in NS-2 wheresome simulation parameters of the wireless mobile networkare listed in Table 1 for the two solutions
Before the simulation in terms of created 6000 playbacklogs for 30 video files IVCCD analyzes these logs to group100 mobile nodes into the communities and group the videoswith similar content and 100 mobile users in AMCV ran-domly request 20 videos and join into the communities cor-responding to 20 videos which are same as those of IVCCD
Table 1 Simulation parameter setting for wireless mobile network
Parameters ValuesArea 1000 times 1000m2
Channel ChannelWirelessChannelNetwork interface PhyWirelessPhyExtMAC interface Mac802 11Number of mobile nodes 500Mobile speed range of nodes [1 20]msSimulation time 500 sSignal range of mobile nodes 200mDefault distance between server andnodes 6 hops
Transmission protocol UDPWireless routing protocol DSRBandwidth of server 20MbsBandwidth of mobile nodes 10MbsTransmission rate of video data 128 kbs
In the process of simulation we generate 100 playbacklogs for the 100 community members namely they watchdiverse video content according to the playback logs wherethe watched time is 10 random Moreover we also create100 playback logs for the 100 mobile nodes namely theyrandomly request and play video content (join correspondingcommunities) according to the created playback logs wherethe viewing time also is random 100 mobile nodes join thesystem following the Poisson distribution from 0 s to 450 sIn IVCCD and AMCV all community member only store avideo file and the mobile nodes delete the local resource andrebuffer new resources when they play new videos
8 Mobile Information Systems
AMCV-RMMIVCCD-RMM
200 250 300
Simulation time (s)350 400 450 500
25
15
05
0
1
2
3
500 100 150
Aver
age s
tart
up d
elay
(s)
Figure 3 ASD with RMM against simulation time
On the other hand we use two mobility models (1) Thefirst is randommobility model (RMM) Initially the locationspeed and moving target of mobile nodes are randomlyassigned When the mobile nodes arrive at the assignedtarget they keep themovement state following the r-assignedrandom moving target and speed (2) The second is Gauss-Markov mobility model (GMM) [29] Initially the locationand moving target of mobile nodes are randomly assignedThe mobile nodes experience the state of acceleration stableturn and deceleration in the process of movement Whenthe mobile nodes arrive at the assigned target location theycontinue to move according to the reassigned target Becausethe movement with high speed influences the performanceof content delivery such as delay and PLR the mobile speedrange of nodes is set to [1 20]ms The default distancebetween server and nodes is set to 6 hops in order to ensurethe equitable cost of fetching resources and differentiate theaccess cost for the server and the mobile nodes In AMCV119875119879119887and 119875119879
119903are set to 02 and 012 respectively
52 Performance Evaluation The performance of IVCCD iscompared with that of AMCV in terms of average startupdelay (ASD) packet loss rate (PLR) throughput video qual-ity and overlay maintenance cost respectively
ASD Let 119905119894(119904) and 119905
119894(119903) be the time of sending requestmessage
and receiving first video data of a node 119899119894 respectively 119905
119894(119903) minus
119905119894(119904) is considered as the startup delay of 119899
119894 The mean value
of startup delay of all nodes during a time interval 119879 denotesASD
Figures 3 and 4 show the performance of ASD of twosolutions AMCV and IVCCD in terms of two mobilitymodels RMM and GMMwith the increase in the simulationtime where the time interval 119879 is set to 20 s As Figure 3shows AMCVrsquos ASD results firstly experience a fall after risefrom 119905 = 0 s to 119905 = 140 s AMCVrsquos curve also fast increasesfrom 119905 = 160 s to 119905 = 280 s and fast decreases from 119905 = 300 s to119905 = 500 s AMCVrsquos ASD results are in the delay range between12 s and 275 s and reach the peak value 2748 at 119905 = 280 sIVCCDrsquos curve fast increases from 119905 = 0 s to 119905 = 100 s and
AMCV-GMMIVCCD-GMM
200 250 300
Simulation time (s)350 400 450 500
25
15
05
0
1
2
3
500 100 150
Aver
age s
tart
up d
elay
(s)
Figure 4 ASD with GMM against simulation time
Aver
age s
tart
up d
elay
(s)
20 40 60 80 100 120 140 160 180 200
0
1
2
3
Number of request nodes
AMCV-RMMIVCCD-RMM
Figure 5 ASD with RMM against number of request nodes
relatively slowly falls with slight fluctuation from 119905 = 100 sto 119905 = 200 s The red curve also fast rises from 119905 = 220 s to119905 = 280 s and slowly decreases to roughly 1 s at 119905 = 500 s withslight fluctuation In Figure 4 the two curves correspondingto the delay results of AMCV and IVCCD experience the twoprocesses of rise and fall The blue curve has a fall after risewith the fluctuation from 119905 = 0 s to 119905 = 180 s starts to increasefrom 119905 = 200 s and decreases from 119905 = 340 s to 119905 = 500 s afterreaching the peak value (2571 s) at 119905 = 340 s The red curvefirstly experiences a fall after rise with the fluctuation from119905 = 0 s to 119905 = 200 s and keeps the fluctuation at high levelsIVCCDrsquos results also have a fall after rise from 119905 = 220 s to 119905 =500 s and reach the peak value (2718 s) at 119905 = 360 s AlthoughIVCCDrsquos results are higher than those ofAMCVduring initialsimulation time IVCCDrsquos curve maintains lower level thanthat of AMCV
Figures 5 and 6 show the performance of ASD of AMCVand IVCCD in terms of RMM and GMM with increasingnumber of nodes As Figure 5 shows AMCVrsquos blue curvehas two processes of rise and fall with increasing numberof request nodes and AMCVrsquos results are in the range (155250) IVCCDrsquos red curve also experiences the two variation
Mobile Information Systems 9Av
erag
e sta
rtup
del
ay (s
)
20 40 60 80 100 120 140 160 180 200
0
1
2
3
Number of request nodes
AMCV-GMMIVCCD-GMM
Figure 6 ASD with GMM against number of request nodes
process of rise and fall with the fluctuation and IVCCDrsquosresults are in the range (125 220) In Figure 6 AMCVrsquosblue curve shows a process of rise and fall with the frequentfluctuation and AMCVrsquos results are in the range (145 255)IVCCDrsquos results are kept in a stable interval (13 22) with thefluctuation IVCCDrsquos results have both lower values and lessfluctuation than those of AMCV
The delay of searching and transmission determinesthe performance of startup delay After the construction ofcommunities AMCV relies on the static and dynamic con-nections between communities to forward the request mes-sage where the dynamic connections are built by the prob-ability of requesting resources of community members Thelow accuracy of prediction results leads to the fact that thedynamic connections cannot be built so that the requestmes-sages cannot fast arrive at the suppliers Moreover AMCVdoes not consider the performance of resource deliverybetween nodes so that the low delay of data transmissioncannot be ensured On the other hand if there are noavailable suppliers in overlay network the request nodes needto connect with the server to obtain the initial resourcesBecause the default distance between server and nodes isset to 6 hops the high data transmission delay also bringsnegative effects for the startup delay For instance AMCVrsquosASD value reaches 229 s at 119905 = 80 s and IVCCDrsquos ASD valueskeep high level from 119905 = 80 s to 119905 = 140 s In IVCCD therequest nodes only search the suppliers in current andadjacent communities which reduces the searching delayIVCCD makes use of the buffering and dissemination ofresources of relay nodes to enlarge the coverage range ofrequested resources in overlay network which furtherreduces the searching delay of resources Moreover IVCCDinvestigates the serving capacities of community membersand the requested nodes can select the optimal suppliers toimprove the delivery performance Therefore IVCCDrsquos ASDresults are better than those of AMCV
Packet Loss Rate (PLR) Let119873119904and119873
119903be the number of sent
and received packets respectively The mean value of ratiobetween 119873
119904minus 119873119903and 119873
119904during a time interval 119879 is defined
as PLR
AMCV-RMMIVCCD-RMM
200 250 300
Simulation time (s)350 400 450 50050 100 150
Pack
et lo
ss ra
te
0
01
02
03
04
05
Figure 7 PLR with RMM against simulation time
AMCV-GMMIVCCD-GMM
200 250 300
Simulation time (s)350 400 450 50050 100 150
0
01
02
03
04
05
Pack
et lo
ss ra
te
Figure 8 PLR with GMM against simulation time
Figures 7 and 8 show the PLR performance of AMCVand IVCCD in terms of RMM and GMM with increasingsimulation time where the time interval 119879 is set to 50 s AsFigure 7 shows the curves ofAMCVand IVCCDhave similarchanging process namely they experience fall after fast risewith the increase in the simulation time where 119879 is set to50 s Although IVCCDrsquos curve keeps higher level than that ofAMCV from 119905 = 150 s to 119905 = 200 s AMCVrsquos results haveboth larger PLR values and higher increment than those ofIVCCD where the curves of AMCV and IVCCD reach thepeak value 044 and 038 at 119905 = 350 s respectively In Figure 8the results of AMCV and IVCCD show the trend of fall afterrise during the whole simulation time The curve of IVCCDis higher than that of AMCV from 119905 = 0 s to 119905 = 200 s butit has lower increment and peak value than those of AMCVfrom 119905 = 250 s to 119905 = 500 s
Figures 9 and 10 show the PLR performance of AMCVand IVCCD in terms of RMM andGMMwith the increase inthe number of nodes As Figure 9 shows the curves of AMCVand IVCCD also have a rise trend with the increase in thenumber of request nodes where119879 is defined as the timewhenevery 20 request nodes start to search resources The AMCV
10 Mobile Information Systems
0
01
02
03
04
05
20 40 60 80 100 120 140 160 180 200
Number of request nodes
AMCV-RMMIVCCD-GMM
Pack
et lo
ss ra
te
Figure 9 PLR with RMM against number of request nodes
0
01
02
03
04
05
20 40 60 80 100 120 140 160 180 200
Number of request nodes
AMCV-GMMIVCCD-GMM
Pack
et lo
ss ra
te
Figure 10 PLR with GMM against number of request nodes
results are between [003 041] and reach the peak value 041when the number of request nodes is 200 The red curvecorresponding to the IVCCD results is between 004 and 037and keeps lower levels than that of AMCVThe IVCCD resultsare roughly 10 lower than those of AMCV In Figure 10AMCVrsquos curve experiences the three processes slow rise andfast and stable increase IVCCDrsquos results have slow increaseand keep uniform rise Although the IVCCDrsquos curve is higherthan that of AMCV during initial stage IVCCDrsquos results arelower than those of AMCVduring the later period of increasein the number of nodes
Initially because the small number of nodes requestvideos the relatively enough network bandwidth can supportthe high-efficiency delivery namely the PLR results of twosolutions keep low levels When the number of request nodesincreases the available network bandwidth is consumed fastso that the PLR results of AMCV and IVCCD fast increasedue to the network congestion Because the request nodesstop the resource searching from 119905 = 450 s to 119905 = 500 sand some of them have finished video playback the fastdecrease of congestion levels and network traffic lead to fastfall of two curves On the other hand AMCV only focus on
AMCV-RMMIVCCD-RMM
200 250 300
Simulation time (s)350 400 450 500500 100 150
0
1000
2000
3000
4000
5000
6000
7000
8000
Thro
ughp
ut (k
bs)
Figure 11 Throughput with RMM against simulation time
the efficiency of resource searching and neglect the perfor-mance of content deliveryThe nodes in AMCV cannot selectthe optimal suppliers which leads to the fact that the deliveryprocess of content is subjected to the severe negative influencein wireless mobile network The high mobility of mobilenodes results in the fast change of geographical distancebetween two communication parties which introduces thejitter of delivery performance and increases the probabilitiesof packet loss IVCCD investigates the interaction betweennodes and the serving capacities of nodes to build thecommunities Moreover the relay nodes can assist spreadingresources tomultiple communities which enhances the prob-abilities of intracommunity delivery Therefore the requestnodes select optimal suppliers which ensures high-efficiencydata transmission
Average Throughput Let 119873119901119903 and size
119901be the number and
size of packets received in the overlay during a certain timeperiod 119879 respectivelyThe ratio between119873
119901119903times size
119901and 119879 is
defined as the average throughput where 119879 is set to 20 sFigures 11 and 12 show the average throughput perfor-
mance of AMCV and IVCCD in terms of RMM and GMMwith increasing simulation time where the time interval 119879 isset to 20 s As Figure 11 shows the curves of average through-put of AMCV and IVCCD have similar changing trend withincreasing simulation time The blue curve corresponding toAMCVrsquos results fast increases from 119905 = 0 s to 119905 = 300 s andkeeps a slight rise from 119905 = 320 s to 119905 = 440 s AMCVrsquos resultsdecrease to 4465 kbs from 119905 = 460 s to 119905 = 500 s IVCCDrsquosred curve keeps a fast rise from 119905 = 0 s to 119905 = 100 s and slowlyincreases from 119905 = 120 s to 119905 = 140 s This red curve also fastincreases from 119905 = 160 s to 119905 = 440 s and finally decreases to4842 kbs at 119905 = 500 s Although IVCCDrsquos curve is lower thanthat of AMCV from 119905 = 120 s to 119905 = 240 s the increment andpeak value of IVCCD results are larger than those of AMCVIn Figure 12 the two curves of AMCV and IVCCD also havesimilar variation process during the whole simulation timeThe blue curve fast increases from 119905 = 0 s to 119905 = 200 s keepsslow rise from 119905 = 220 s to 119905 = 420 s and fast decreases afterreaching the peak value at 119905 = 420 s The red curve also has
Mobile Information Systems 11
AMCV-GMMIVCCD-GMM
200 250 300
Simulation time (s)350 400 450 500500 100 150
0
1000
2000
3000
4000
5000
6000
7000
8000
Thro
ughp
ut (k
bs)
Figure 12 Throughput with GMM against simulation time
a fast rise from 119905 = 0 s to 119905 = 280 s keeps slow increase from119905 = 300 s to 119905 = 440 s and starts to fall from 119905 = 460 s to 119905 =
500 s Although IVCCDrsquos results are less than those of AMCVfrom 119905 = 0 s to 119905 = 200 s IVCCDrsquos curve is higher than thatof AMCV and has larger peak value than that of AMCV
The mobile nodes for two solutions AMCV and IVCCDrequest and fetch the video content following a Poisson distri-bution from 119905 = 0 s to 119905 = 450 s The increase in the numberof request nodes causes fast rise of network traffic The twocurves corresponding to AMCV and IVCCD fast increasefrom 119905 = 0 s to 119905 = 440 s and rapidly fall from 119905 = 460 s to 119905 =500 s due to the decrease in the amount of video streamingBecause the high traffic is greater than the available networkbandwidth the generated network congestion leads to highPLR so that the throughput of AMCV and IVCCD keepsslow increase from 119905 = 300 s to 119905 = 440 s In AMCV therequest nodes randomly select the suppliers so the deliveryperformance of video content is subjected to severe influenceby the network congestion and mobility of nodes In IVCCDthe request nodes select the suppliers with maximum servingcapacities which reduce the negative effects by the networkcongestion and mobility of nodes Therefore the deliveryperformance of IVCCD including average throughput andPLR is better than that of AMCV
Video Quality Let EXP Thr and CRT Thr be the averagethroughput expected from the video delivery and actualthroughput measured respectively MAX Bit denotes theaverage bitrate of the video stream and MAX Bit and EXPThr are set to 128 kbs according to the simulation settingsWe make use of the Peak Signal-to-Noise Ratio (PSNR) tomeasure the video quality of two solutions in decibels (dB)[30] The PSNR value is calculated according to
PSNR = 20 sdot log10(
MAX Bit
radic(EXP Thr minus CRT Thr)2) (4)
Figures 13 and 14 show the PSNR performance of AMCVand IVCCD in terms of RMM and GMM with increasing
20 40 60 80 100 120 140 160 180 200
PSN
R
Number of request nodes
35
30
25
20
15
10
0
5
AMCV-RMMIVCCD-RMM
Figure 13 PSNR with RMM against number of request nodes
20 40 60 80 100 120 140 160 180 200
PSN
R
Number of request nodes
35
30
25
20
15
10
0
5
AMCV-GMMIVCCD-GMM
Figure 14 PSNR with GMM against number of request nodes
number of request nodes Figure 13 shows PSNR values ofAMCV and IVCCD for the single video streaming corre-sponding to every request node with the increase in thenumber of request nodes The two curves of AMCV andIVCCD have a fast fall trend where AMCVrsquos results are inthe range [7 30] and IVCCDrsquos results are between 8 dB and28 dB In Figure 14 AMCVrsquos results fast decrease with theincrease in the number of request nodes However IVCCDrsquosresults keep a stable decrease Although the IVCCDrsquos resultsare lower than those of AMCV in the initial phase IVCCDrsquosbars are higher than those of AMCV in the later stage
PSNR represents the watched quality of users andincludes some key impact factors such as throughput andstream bitrate With the increase in the number of requestnodes the huge traffic triggers the network congestion whichseriously limits the increase of throughput due to high PLRIn other words PSNR values keep low level with decreasingthroughput In AMCV the performance of content deliverybetween request nodes and suppliers is subjected to theinfluence by the node mobility and network congestion InIVCCD the high-efficiency data transmission benefit fromthe strong serving capacities of suppliers Therefore thecongestion period time is longer than that of IVCCD and
12 Mobile Information Systems
50 100 150 200 250 300 350 400 450 500
Simulation time (s)
5
4
3
2
1
Mes
sage
ove
rhea
d (k
bs)
AMCVIVCCD
Figure 15 Maintenance overhead against simulation time
the decrement of AMCVrsquos PSNR values is larger than that ofIVCCD
Maintenance Overhead The maintenance cost of overlaytopology mainly includes the management of member stateforwarded request message and interaction between com-munities We use the average bandwidth used by the sentmessages for maintaining the overlay topology to denote themaintenance overhead
As Figure 15 shows the two curves of AMCV and IVCCDhave fast rise trajectory with the increase in the simulationtime AMCVrsquos blue curve keeps fast rise from 119905 = 50 s to119905 = 450 s and slightly decreases at 119905 = 500 s IVCCDrsquos redcurve maintains a slow increase from 119905 = 50 s to 119905 = 450 sand finally decreases at 119905 = 500 s The increment and peakvalue of AMCVrsquos results are larger than those of IVCCD
In AMCV the broker members need to forward andhandle the messages of requesting resources and memberstate and maintain the static and dynamic connections withother communities The increase in the number of requestnodes and dynamic connections leads to high load of brokermembers which limits the system scalability Moreover thefrequent change of requested content of communitymemberscauses the continuous movement of nodes between com-munities The fragile community structure further increasesthe maintenance cost However IVCCD has stable commu-nity structure and the dynamic change of requested videosof members cannot cause the community reconstructionAlthough the broker members assist spreading resourceinformation in communities and the bridgedmembersmain-tain the connections with other communities the rangeof message dissemination is relatively limited and is lowfrequency Therefore IVCCDrsquos maintenance overhead keepslower levels than that of AMCV
6 Conclusion
In this paper we propose a novel interaction-aware com-munity-based video sharing solution (IVCCD) in wirelessmobile networks IVCCD constructs a directed graph-based
interaction model according to the analysis of interactionbehaviors between the mobile users In order to obtainscalable and robust community structure IVCCD partitionsnodes in graph in terms of the node degree and usesthe weight values of edges and serving capacities of nodesas refined rules to generate the node community IVCCDemploys a multiple role-based community member manage-ment mechanism to balance the community maintenancecost and optimize resource distribution IVCCD analyzes theresource dissemination process in overlay networks and usesthe resource push and prebuffering approach to improve theperformance of resource searching The simulation resultsbased on the two mobility models random and Gauss-Markovmobility model show how IVCCDhas lower averagestartup delay less packet loss rate higher throughput highervideo quality and lower maintenance overhead than AMCVThe simulation results also show that the mobility is animportant influence factor for the performance of multime-dia streaming systems In the future work we focus on themodeling of mobility of mobile nodes and the evaluationof mobility influence for the performance of multimediastreaming systems
Competing Interests
The authors declare that there is no conflict of interestsregarding the publication of this paper
Acknowledgments
This work was supported in part by the National NaturalScience Foundation of China (NSFC) under Grant nos61402303 61501216 61502219 61572246 and U1404611 theProject of BeijingMunicipal Commission of Education underGrant KM201510028016 the Science and Technology KeyProject of Henan province (152102210331 and 152102210332)and Technology Plan Projects (Openness amp Cooperation) ofHenan province (152106000048)
References
[1] L Zhou H-C Chao and A V Vasilakos ldquoJoint forensics-scheduling strategy for delay-sensitive multimedia applicationsover heterogeneous networksrdquo IEEE Journal on Selected Areasin Communications vol 29 no 7 pp 1358ndash1367 2011
[2] S Chen and J Zhao ldquoThe requirements challenges and tech-nologies for 5G of terrestrial mobile telecommunicationrdquo IEEECommunications Magazine vol 52 no 5 pp 36ndash43 2014
[3] F Song R Li and H Zhou ldquoFeasibility and issues for establish-ing network-based carpooling schemerdquo Pervasive and MobileComputing vol 24 pp 4ndash15 2015
[4] HWang S Chen H Xu M Ai and Y Shi ldquoSoftNet a softwaredefined decentralized mobile network architecture toward 5GrdquoIEEE Network vol 29 no 2 pp 16ndash22 2015
[5] C-F Lai R-H Hwang H-C Chao M M Hassan and AAlamri ldquoA buffer-aware HTTP live streaming approach forSDN-enabled 5G wireless networksrdquo IEEE Network vol 29 no1 pp 49ndash55 2015
Mobile Information Systems 13
[6] C Xu T Liu J Guan H Zhang and G-M Muntean ldquoCMT-QA quality-aware adaptive concurrent multipath data transferin heterogeneous wireless networksrdquo IEEE Transactions onMobile Computing vol 12 no 11 pp 2193ndash2205 2013
[7] Y Ye S Ci N Lin and Y Qian ldquoCross-layer design for delay-and energy-constrained multimedia delivery in mobile termi-nalsrdquo IEEE Wireless Communications vol 21 no 4 pp 62ndash692014
[8] CiscoCiscoVisual Networking Index GlobalMobile Data TrafficForecast Update 2012ndash2017 Cisco 2013
[9] O T Cruces M Fiore and J M B Ordinas ldquoCooperativedownload in vehicular environmentsrdquo IEEE Transactions onMobile Computing vol 11 no 4 pp 663ndash678 2012
[10] E Baccarelli F Chiti N Cordeschi et al ldquoGreen multimediawireless sensor networks distributed intelligent data fusionin-network processing and optimized resource managementrdquoIEEE Wireless Communications vol 21 no 4 pp 20ndash26 2014
[11] S Jia C Xu J Guan H Zhang and G-M Muntean ldquoA novelcooperative content fetching-based strategy to increase thequality of video delivery to mobile users in wireless networksrdquoIEEE Transactions on Broadcasting vol 60 no 2 pp 370ndash3842014
[12] Y Zhao Y Liu C Chen and J Zhang ldquoEnabling P2P one-viewmultiparty video conferencingrdquo IEEE Transactions on Paralleland Distributed Systems vol 25 no 1 pp 73ndash82 2014
[13] C Xu S Jia L Zhong and G-M Muntean ldquoSocially awaremobile peer-to-peer communications for community multime-dia streaming servicesrdquo IEEE Communications Magazine vol53 no 10 pp 150ndash156 2015
[14] D Wu Y Liang J He and X Hei ldquoBalancing performanceand fairness in P2P live video systemsrdquo IEEE Transactions onCircuits and Systems for Video Technology vol 23 no 6 pp1029ndash1039 2013
[15] C-L Chang W-M Chen and C-H Hung ldquoReliable consid-eration of P2P-based VoD system with interleaved video framedistributionrdquo IEEE Systems Journal vol 8 no 1 pp 304ndash3122014
[16] W Zhang Z Li and Q Zheng ldquoSAMP supporting multi-source heterogeneity in mobile P2P IPTV systemrdquo IEEE Trans-actions on Consumer Electronics vol 59 no 4 pp 772ndash7782013
[17] N Kumar J-H Lee and J J P C Rodrigues ldquoIntelligentmobilevideo surveillance system as a Bayesian coalition game in vehic-ular sensor networks learning automata approachrdquo IEEETrans-actions on Intelligent Transportation Systems vol 16 no 3 pp1148ndash1161 2015
[18] C Xu F Zhao J Guan H Zhang and G-M Muntean ldquoQoE-driven user-centric vod services in urban multihomed P2P-based vehicular networksrdquo IEEE Transactions on VehicularTechnology vol 62 no 5 pp 2273ndash2289 2013
[19] J-L Kuo C-H Shih C-Y Ho and Y-C Chen ldquoA cross-layerapproach for real-time multimedia streaming on wireless peer-to-peer ad hoc networkrdquoAdHocNetworks vol 11 no 1 pp 339ndash354 2013
[20] D Bethanabhotla G Caire and M J Neely ldquoAdaptive videostreaming for wireless networks with multiple users andhelpersrdquo IEEE Transactions on Communications vol 63 no 1pp 268ndash285 2015
[21] H Shen Z Li Y Lin and J Li ldquoSocialtube P2P-assisted videosharing in online social networksrdquo IEEETransactions on Paralleland Distributed Systems vol 25 no 9 pp 2428ndash2440 2014
[22] H Shen Y Lin and J Li ldquoA social-network-aided efficientpeer-to-peer live streaming systemrdquo IEEEACMTransactions onNetworking vol 23 no 3 pp 987ndash1000 2015
[23] N Kumar S Zeadally and J J P C Rodrigues ldquoQoS-awarehierarchical web caching scheme for online video streamingapplications in internet-based vehicular ad hoc networksrdquo IEEETransactions on Industrial Electronics vol 62 no 12 pp 7892ndash7900 2015
[24] L Zhou Z Yang Y Wen and J J P C Rodrigues ldquoDistributedwireless video scheduling with delayed control informationrdquoIEEE Transactions on Circuits and Systems for Video Technologyvol 24 no 5 pp 889ndash901 2014
[25] L Zhou Z Yang J J P C Rodrigues andM Guizani ldquoExplor-ing blind online scheduling for mobile cloud multimedia ser-vicesrdquo IEEE Wireless Communications vol 20 no 3 pp 54ndash612013
[26] C Doulkeridis A Vlachou K Noslashrvag Y Kotidis and MVazirgiannis ldquoEfficient search based on content similarity overself-organizing P2P networksrdquo Peer-to-Peer Networking andApplications vol 3 no 1 pp 67ndash79 2010
[27] H Shen Y Lin and J Li ldquoSocial connections in user-generatedcontent video systems analysis and recommendationrdquo IEEETransactions on Parallel and Distributed Systems vol 26 no 1pp 252ndash261 2015
[28] C Xu S Jia L Zhong H Zhang and G-M Muntean ldquoAnt-inspired mini-community-based solution for video-on-de-mand services in wireless mobile networksrdquo IEEE Transactionson Broadcasting vol 60 no 2 pp 322ndash335 2014
[29] D Perdana and R F Sari ldquoPerformance evaluation of corruptedsignal caused by randomway point and GaussMarkovmobilitymodel on IEEE 16094 standardsrdquo in Proceedings of the 4th IEEEInternational Symposium on Next-Generation Electronics (ISNErsquo15) May 2015
[30] C Xu Z Li J Li H Zhang and G-M Muntean ldquoCross-layerfairness-driven concurrent multipath video delivery over het-erogeneous wireless networksrdquo IEEE Transactions on Circuitsand Systems for Video Technology vol 25 no 7 pp 1175ndash11892015
Submit your manuscripts athttpwwwhindawicom
Computer Games Technology
International Journal of
Hindawi Publishing Corporationhttpwwwhindawicom Volume 2014
Hindawi Publishing Corporationhttpwwwhindawicom Volume 2014
Distributed Sensor Networks
International Journal of
Advances in
FuzzySystems
Hindawi Publishing Corporationhttpwwwhindawicom
Volume 2014
International Journal of
ReconfigurableComputing
Hindawi Publishing Corporation httpwwwhindawicom Volume 2014
Hindawi Publishing Corporationhttpwwwhindawicom Volume 2014
Applied Computational Intelligence and Soft Computing
thinspAdvancesthinspinthinsp
Artificial Intelligence
HindawithinspPublishingthinspCorporationhttpwwwhindawicom Volumethinsp2014
Advances inSoftware EngineeringHindawi Publishing Corporationhttpwwwhindawicom Volume 2014
Hindawi Publishing Corporationhttpwwwhindawicom Volume 2014
Electrical and Computer Engineering
Journal of
Journal of
Computer Networks and Communications
Hindawi Publishing Corporationhttpwwwhindawicom Volume 2014
Hindawi Publishing Corporation
httpwwwhindawicom Volume 2014
Advances in
Multimedia
International Journal of
Biomedical Imaging
Hindawi Publishing Corporationhttpwwwhindawicom Volume 2014
ArtificialNeural Systems
Advances in
Hindawi Publishing Corporationhttpwwwhindawicom Volume 2014
RoboticsJournal of
Hindawi Publishing Corporationhttpwwwhindawicom Volume 2014
Hindawi Publishing Corporationhttpwwwhindawicom Volume 2014
Computational Intelligence and Neuroscience
Industrial EngineeringJournal of
Hindawi Publishing Corporationhttpwwwhindawicom Volume 2014
Modelling amp Simulation in EngineeringHindawi Publishing Corporation httpwwwhindawicom Volume 2014
The Scientific World JournalHindawi Publishing Corporation httpwwwhindawicom Volume 2014
Hindawi Publishing Corporationhttpwwwhindawicom Volume 2014
Human-ComputerInteraction
Advances in
Computer EngineeringAdvances in
Hindawi Publishing Corporationhttpwwwhindawicom Volume 2014
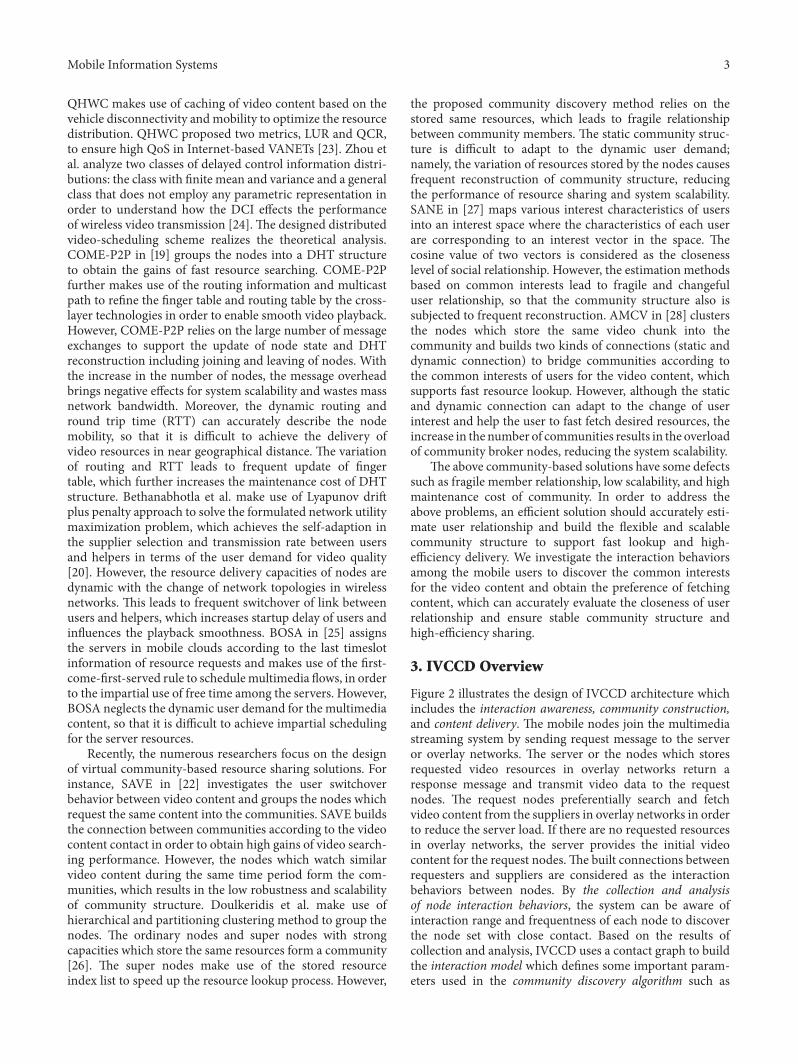
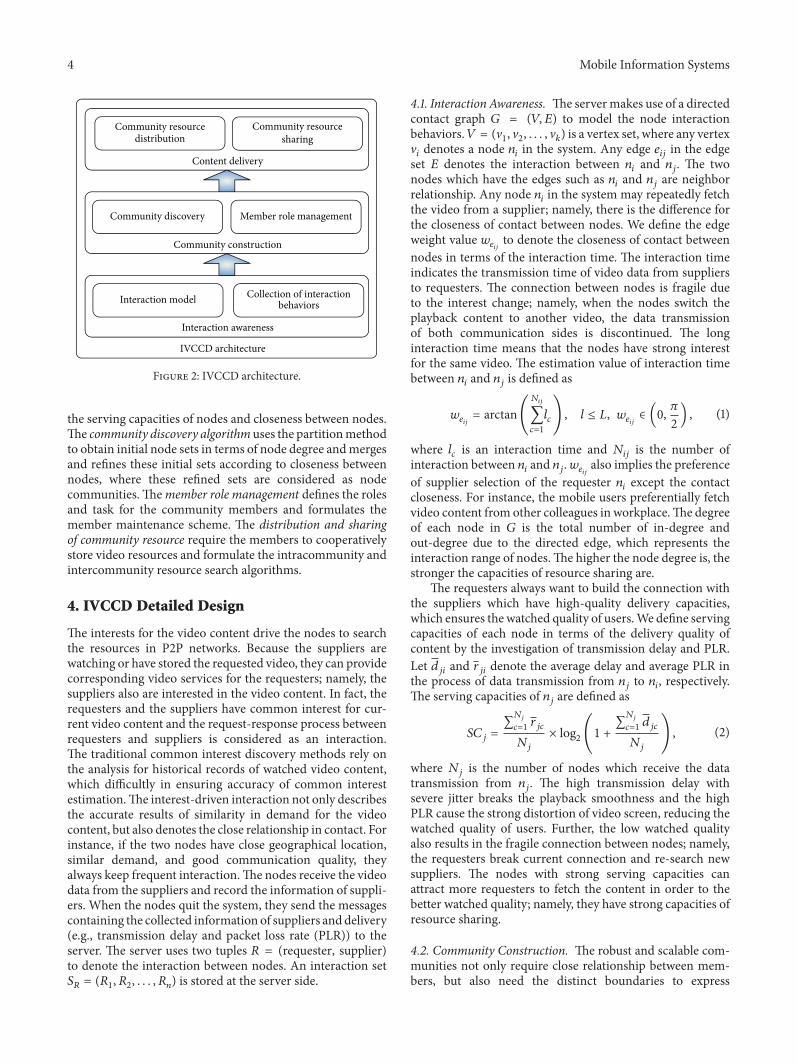
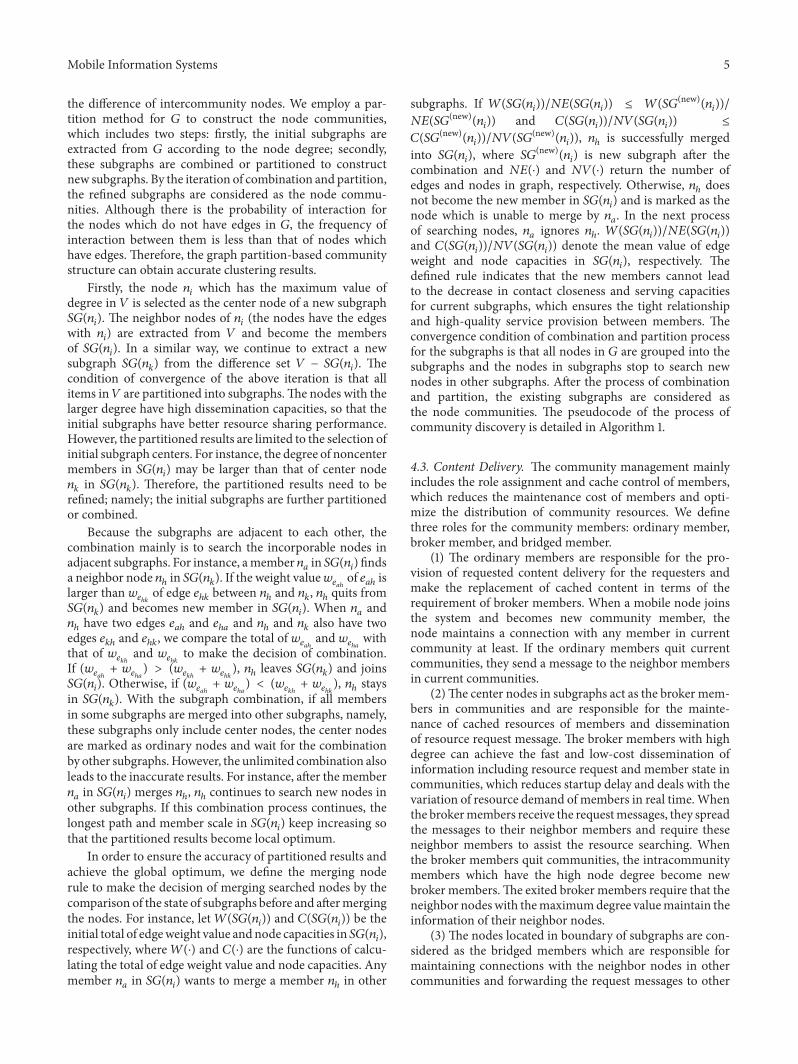
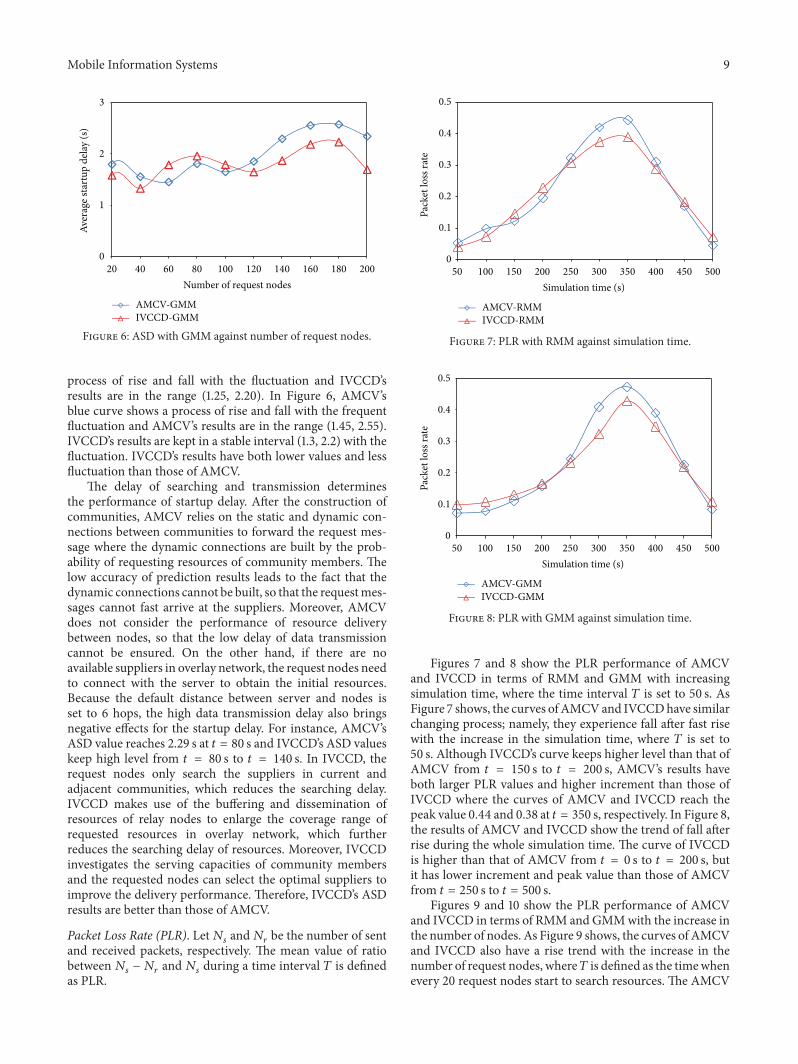


![GUI Interaction on Autopilotricecrispi/docs/p2b_submission.pdf · [19], testing GUI elements [2], context-aware video tutorials [3,16], and GUI task automation [7]. Yet, computer](https://img.dokumen.tips/doc/110x75/5ff0ae228435341c9b63aeb5/gui-interaction-on-ricecrispidocsp2bsubmissionpdf-19-testing-gui-elements.jpg)


![MOOC Video Interaction Patterns: What Do They Tell Us? · MOOC Video Interaction Patterns: What Do They Tell Us? 3 click-level video analysis. [7] emphasizes on the video interaction](https://img.dokumen.tips/doc/110x75/5e1252b7230a1250be7df6a4/mooc-video-interaction-patterns-what-do-they-tell-us-mooc-video-interaction-patterns.jpg)