Embed Size (px)
Citation preview

Research ArticleIdentification of Historical Veziragasi Aqueduct Usingthe Operational Modal Analysis
E. Ercan and A. Nuhoglu
Department of Civil Engineering, Ege University, 35100 Izmir, Turkey
Correspondence should be addressed to E. Ercan; [email protected]
Received 30 August 2013; Accepted 17 October 2013; Published 8 January 2014
Academic Editors: D. G. Aggelis and N. Alver
Copyright © 2014 E. Ercan and A. Nuhoglu. This is an open access article distributed under the Creative Commons AttributionLicense, which permits unrestricted use, distribution, and reproduction in any medium, provided the original work is properlycited.
This paper describes the results of a model updating study conducted on a historical aqueduct, called Veziragasi, in Turkey. Theoutput-only modal identification results obtained from ambient vibration measurements of the structure were used to update afinite elementmodel of the structure. For the purposes of developing a solidmodel of the structure, the dimensions of the structure,defects, and material degradations in the structure were determined in detail by making a measurement survey. For evaluation ofthe material properties of the structure, nondestructive and destructive testing methods were applied. The modal analysis of thestructure was calculated by FEM. Then, a nondestructive dynamic test as well as operational modal analysis was carried out anddynamic properties were extracted.Thenatural frequencies and correspondingmode shapeswere determined fromboth theoreticaland experimental modal analyses and compared with each other. A good harmony was attained between mode shapes, but therewere some differences between natural frequencies.The sources of the differences were introduced and the FEMmodel was updatedby changing material parameters and boundary conditions. Finally, the real analytical model of the aqueduct was put forward andthe results were discussed.
1. Introduction
The variety and natural availability of the materials neededfor masonry and the choice of laying pieces of stones orbricks on top of each other with or withoutmortar havemadethis technique easy and common. Additionally, masonry hasimportant characteristics such as aesthetics, solidity, dura-bility, easy maintenance, versatility, and fire protection asdiscussed by Lourenco [1]. However the lack of insight andmodels for the complex behavior of units, mortar, joints,and masonry as a composite material has made analysis ofmasonry difficult. Existing calculationmethods are mainly ofan empirical and traditional nature and the use of numericaltools for the analysis or design ofmasonry structures is ratherincipient as discussed by Lourenco [2]. Historical masonrystructures have been particularly vulnerable to earthquakesand winds for thousands of years. The preservation ofhistorical structures is considered to be a fundamental issuein the cultural life of modern societies as a consequenceof the failure of preventing some of them from collapsing
in past decades [3]. For this reason, the conservation andthe structural safety assessment of historical structures havebecome an increasing concern. There are many studies con-cerning this topic in the literature including both analyticaland experimental investigations of these structures.
Bayraktar et al. [4] described the results of an ambientvibration test and operational modal analysis carried outon the historical masonry bell-tower of the Hagia Sophiachurch in Trabzon, Turkey. Bernardeschi et al. [5] describedthe numerical techniques implemented in the finite elementcode for structural analysis of Buti’s masonry bell-tower,a medieval structure located on the Pisa mountains. Twodifferent load conditions were taken into consideration in thenumerical analysis of the tower: the first was its own weight,and the second was an earthquake load in addition to itsown weight. Bayraktar et al. [6] investigated the nonlinearseismic performance of the Mikron arch bridge, a nineteenthcentury Ottoman-era structure built over the Firtina rivernear Rize, Turkey, using ambient vibrations. Firstly, a finiteelement analysis of the Mikron arch bridge was conducted,
Hindawi Publishing Corporatione Scientific World JournalVolume 2014, Article ID 518608, 8 pageshttp://dx.doi.org/10.1155/2014/518608

2 The Scientific World Journal
then the bridge was subjected to ambient vibration testing,and the vibratory response was obtained. The investigatorsthen used enhanced frequency domain decomposition andstochastic subspace identification techniques to extract theexperimental natural frequencies,mode shapes, and dampingratios from these measurements. The experimental resultswere compared with those obtained by the linear finiteelement analysis of the bridge. A good agreement between themode shapes was observed during this comparison, thoughthis was not the case for natural frequencies. The bound-ary conditions and material properties of the linear finiteelement model of the Mikron arch bridge were readjustedusing the vibration test results and the analytical model wasupdated.
It is seen that the ambient vibration test has beenpreferred in many attempts to determine the dynamic char-acteristics of structures. The method is especially preferredfor testing of historical structures because no excitationequipment is needed. As environmental excitations such aswind, traffic, and human influences are always present, thetest implies a minimum interference with the normal use ofthe structures. Furthermore, the ambient vibration test doesnot have any negative effect on the structures.
In this study, an Ottoman aqueduct, Veziragasi, (Figure 1)was investigated. An aqueduct is a water supply or navigablechannel constructed to convey water. Although particularlyassociated with the Romans, aqueducts were devised muchearlier in Greece, in the Near East, and on the Indiansubcontinent, where peoples such as the Egyptians andHarappans built sophisticated irrigation systems. Like mostother structures, aqueducts were built using the masonrytechnique.
The Ottoman “Vezir System,” conveying the waters ofsprings near Buca, Southeast of Izmir, and crossing Melezcreek via a high aqueduct is called Veziragası or Vezir. TheVezir aqueduct was constructed in 1678 by the order ofGrand Vizier Koprulu Fazıl Ahmet Pasa. The stone used inthe construction of the structure is roughly cut andesite,except for the arches, which are made from clay brick witha thick mortar. In the study, firstly, the dimensions of thestructure, defects such as cracks and material degradationson the structure, and the materials used in different partswere determined in detail by making a measurement survey.Secondly, the material properties of the components of themasonry were determined for the finite element method(FEM) using uniaxial compressive and indirect tension tests.Nondestructive testing (NDT) methods such as impact-echo, ultrasonic-echo, and ultrasonic pulse velocity testingmethods were also used for evaluation of material properties.The SIBIE (stack imaging of spectral amplitudes based onimpact-echo) technique was applied to evaluate the innerstructure of the aqueduct. The solid model of the structurewas then developed and the modal analysis of the structurewas calculated by FEM. A nondestructive dynamic test andoperational modal analysis (OMA) were then administeredand the dynamic properties of the aqueduct were extracted.The results from OMA and the results from FEM werecompared and according to the feedback, the FEMmodel wasupdated by changing the material parameters and boundary
conditions. Finally, the real material properties were deter-mined.
2. Descriptions of the Structure, HistoryInvestigation, and Measurement Survey
The Vezir aqueduct system brings water to the fountainsof the city of Izmir. The Vezir aqueduct was constructedin 1678 by the order of Grand Vizier Koprulu Fazıl AhmetPasa. Grand Vizier Koprulu Fazıl Ahmet Pasa funded theconstruction of thiswater systembyhimself so the systemwascalled Vezir Water System, as discussed by Aktepe [7]. TodayVezir aqueduct is located from North to East along YesildereStreet and on the hillside of the Kadifekale. The walls of thestructure are stone masonry with grey and pink andesite andmortar joints. The span arches are brick masonry with thickmortar. The three arches of the North section have extensivecracks.
The aqueduct was previously 150 meters in length but 45meters of the Vezir aqueduct collapsed and today 85 meterswith 4 spans at one side of the North section and a 20-metersection with one span at the other side of the South sectionremain. The North section has a length of 85 meters, a widthof 3.5 meters, and a height of 8 meters. The span lengthsfrom North to South are 5.20m, 5.33m, 6.00m, and 3.5m,respectively.
2.1. Material Tests on Stone, Brick, and Mortar. In order todetermine the parameters needed for finite element mod-eling, material nondestructive and destructive tests wereadministered on the constituents of the masonry. Stonesand bricks from the structure were taken and destructivetests were carried out. Samples strong enough from whichto cut out core samples of diameter 54mm for stone anddiameter 25mm for bricks were selected. Indirect tensiontests (Brazilian test) and uniaxial compression (UAC) testswere carried out as discussed in TS 699 andUlusay et al. [8, 9](Figure 2). The average results are shown in Table 1.
For the nondestructive tests, before taking the samples tothe laboratory, L and LB type Proceq Schmidt hammers wereused to find the surface hardness values (rebound value) ofthe stone and clay brick samples, respectively. The Schmidthammer test was also applied to the stones and clay bricks ofthe whole structure (Figure 3). The compressive strength wascalculated from the “rebound (R) value-compressive strengthscheme” of Ulusay et al. [9]. In the laboratory, before indirectand uniaxial compression tests were applied to the stoneand clay brick samples, ultrasonic wave velocity tests hadbeen conducted using pundit type equipment (Figure 3). Themodulus of elasticity values of the stone samples was alsodetermined by (1) given in ASTM [10]:
𝐸 = 𝑉2𝜌 (1 + 𝑚) ×
(1 − 2𝑚)
(1 − 𝑚), (1)
where 𝑉, 𝜌, and 𝑚 are ultrasonic pulse velocity, density, andPoisson’s ratio, respectively. The Poisson’s ratio is taken tobe 0.21 for the andesite stone. The estimated modulus of

The Scientific World Journal 3
(a) (b)
Figure 1: Veziragasi aqueduct.
Figure 2: Drilling out core samples, cutting edges, uniaxial compression, and Brazilian test.
elasticity values from ultravelocity tests is higher than thevalues obtained through destructive tests (Table 1).
The mortar samples were weak and too small for drillingso only point load tests could be applied on arbitrary-shaped samples. By use of the point load index, the uniaxialcompressive strengths ofmortars were estimated.The averageestimated uniaxial strength of mortars was calculated to be6.25MPa from point load tests. Tensile strength andmodulusof elasticity of mortar were also estimated from the literaturewith the aid of point load test results. The tensile strengthand modulus of elasticity 𝜎
𝑡, 0.79MPa, and 𝐸, 150MPa, were
taken, respectively. The density of the mortar was calculatedto be 𝜌 = 1.70 gr/cm3.
3. Determination of Material Parametersfor Analytical Model
Masonry is a composite and this composite material consistsof two or more different constituent materials. By the useof the homogenization approach, the behaviors of mortarand stone/brick were assumed to act together so the overallbehavior of the compositemedia has been taken into account.While determining the elastic parameters of the masonry
aqueduct, the homogenization equations which depend onthe strength parameters of constituents were used. Theaqueduct has two types of masonry: stone masonry MS andbrick masonry BS.
3.1. Determination of Material Parameters of MS and BSfrom Destructive Test Results. The compressive strength ofmasonry is determined by (2) as described by Eurocode 6 [11]:
𝑓𝑘= 𝐾 ⋅ 𝑓
0.65
𝑏⋅ 𝑓0.25
𝑚, (2)
where𝐾 is a constant, 𝑓𝑏is the compressive strength of stone
or brick, and𝑓𝑚is compressive strength of mortar.𝐾 is in the
range from 0.4 to 0.6 and depends on the morphology of themasonry as described by Eurocode 6 [11]. 𝐾 was taken to be0.5 in this study.
The modulus of elasticity of masonry was determined bythe use of (3) as described by Lourenco [2]:
𝐸 =𝑡𝑚+ 𝑡𝑚
(𝑡𝑚/𝐸𝑚) + (𝑡𝑢/𝐸𝑢)𝜌, (3)
where 𝑡𝑚, 𝑡𝑢,𝐸𝑚, and 𝐸
𝑢are the thickness of mortar and
height of the unit (stone or clay brick); the coefficient 𝜌 varies

4 The Scientific World Journal
Table 1: Test results of stone and clay brick.
Sample Number ofsamples
Density 𝜌(g/cm3)
Reboundvalue, 𝑅
Compressivestrength from𝑅 (Mpa)
Compressivestrength fromUAC (Mpa)
𝐸 fromUAC (Gpa)
Tensilestrength fromBrazilian test
(Mpa)
Ultravel.(m/sec)
𝐸 from U.V. (Gpa)
Stone(standarddeviation)
25 2.43 (0.8) 53.49 (2.7) 82 53.35 (3.4) 11.59 (0.4) 6.09 (1.81) 4030 (220) 16.24
Brick(standarddeviation)
11 1.79 (0.1) 30.74 (4.4) 24 10.41 (2.1) 0.81 (0.06) 1.43 (0.08) 2739 (180) —
(a) (b) (c)
Figure 3: In situ Schmidt test and ultrasonic wave velocity test on stone and brick.
Table 2: Material parameters of masonry for FE model.
Material parameter Stone masonry Brick masonryCompressive strength (MPa) 10.49 3.62Tensile strength (MPa) 1.05 0.36Modulus of elasticity (MPa) 871 201Shear modulus 326 80.4Density (kg/m3) 2100 1750Poisson ratio 0.17 0.17
with the bond between mortar and unit and was taken to be0.5 for this study as described by Lourenco [2].
The shearmodulus can be taken to be 40%of themodulusof elasticity as described by Eurocode 6 [11]. The tensilestrength of masonry can be taken to be 10% of compressivestrength as described by Kocak [12].
The densities of BM and SM were calculated to be2.1 kg/cm3 and 1.75 kg/cm3, respectively. The Poisson ratiowas taken to be 0.17 for masonry as described by Kocak [12].The elastic material parameters of SM and BM for the finiteelement model are shown in Table 2.
3.2. Impact-Echo Tests. Impact-echo is one of the nonde-structive testing methods for concrete based on multiplereflections of an acoustical wave between the test surface ofconcrete and an interface between materials with differentmechanical impedances. An impact load is applied at the sur-face of the concrete and the vibrations caused by this impactare recorded by a receiver. As a result, a waveform is built upin the time domain. In the traditional impact-echo analysis,this waveform is transformed into the frequency domain byapplying FFT. Peak frequencies are identified in the frequencyspectrum and corresponding depth is calculated by the givenformula in (4), where 𝐶
𝑝is longitudinal wave velocity, 𝑓 is
the measured frequency, and 𝑑 is the corresponding depth asdescribed by Sansolone [13] and Ata et al. [14]:
𝑑 =
𝐶𝑝
2𝑓. (4)
However, in most of the practical applications, due tothe complex information existing in the data, it is difficultto interpret the frequency spectrum. Consequently, the SIBIE(stack imaging of spectral amplitudes based on impact-echo)procedure has been developed to improve the impact-echomethod. The impact-echo method has been utilised for the
The Scientific World Journal 5
Table 3: Comparison of analytical and experimental modal parameters.
Frequencynumber
Analytical modalparameters (Hz)
PP method (Hz) SSI method (Hz) Damping ratios (%)
Test 1 Test 2 Test 1 Test 2 Test 1 Test 2
1 2.877 2.769 2.778 2.758 2.758 1.896 1.8962 4.205 4.513 4.542 4.556 4.52 3.304 3.3043 5.555 5.413 5.405 5.39 5.375 3.846 3.8464 5.83 6.198 6.149 6.08 6.099 2.723 2.7235 7.3699 Not extracted 7.035 Not extracted 7.015 Not extracted 2.105
(a)
(b)
Figure 4: Impact-echo test on aqueduct and digital storage oscillo-scope.
evaluation of masonry structures. In this study, a stonemasonry bridge was tested by carrying out the impact-echoand SIBIE procedures.
3.2.1. SIBIE Procedure. Based on the inverse scattering theoryin elastodynamics as described by Nakahara and Kitahara[15], the SIBIE procedure was developed at KumamotoUniversity by Ohtsu and Watanabe [16] and Ata et al. [14].This is an imaging technique for detecting waveforms in thefrequency domain. In this study, the theory of SIBIE will notbe mentioned.
3.2.2. Impact-Echo Tests Results. The clay masonry archtested is shown in Figure 4. The tests were carried out at
(a)
(b)
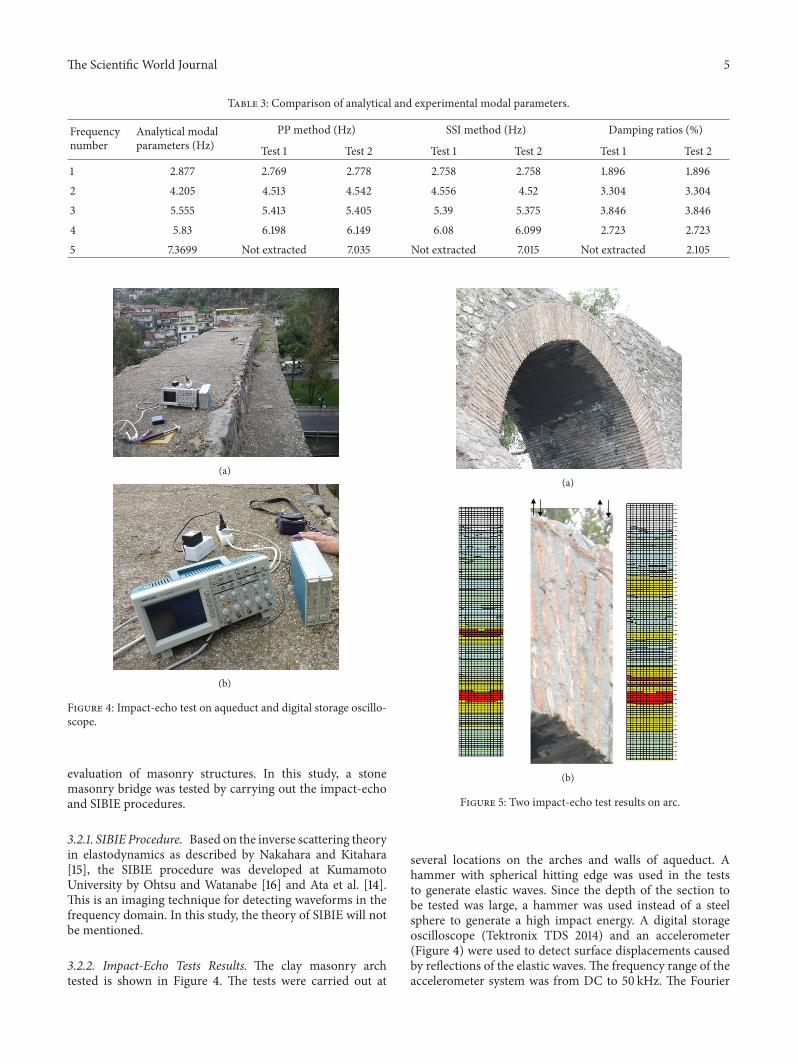
Figure 5: Two impact-echo test results on arc.
several locations on the arches and walls of aqueduct. Ahammer with spherical hitting edge was used in the teststo generate elastic waves. Since the depth of the section tobe tested was large, a hammer was used instead of a steelsphere to generate a high impact energy. A digital storageoscilloscope (Tektronix TDS 2014) and an accelerometer(Figure 4) were used to detect surface displacements causedby reflections of the elastic waves. The frequency range of theaccelerometer system was from DC to 50 kHz. The Fourier

6 The Scientific World Journal
Z
X
Y
Figure 6: 3D FE model of Vezir aqueduct.
Figure 7: Uniaxial accelerometers placed to the top of the aqueductalongside.
spectra of accelerations were analyzed by FFT (Fast FourierTransform). Sampling time was 4 𝜇sec and the number ofdigitized data for each waveform was 2048.The cross-sectionof the bridge part tested was divided into square elements toperform SIBIE analysis. In this study, the size of square meshfor SIBIE analysis was set to 10mm.
The results of the SIBIE analysis of the impact appliedabove the center of the arch are depicted in Figure 5.The SIBIE figure corresponds to the cross-section of theelement that is tested. Here, the red color zones indicatethe higher reflection due to the interface between mate-rials with different mechanical impedances. In the figure,impact and detection locations are indicated with arrows.The distance between impact and detection was selected tobe 5 cm. The depth of the section tested was 110 cm. Theback wall reflection of the yellow color zone cannot beclearly observed in the SIBIE figure. The red color regionsare clearly observed corresponding to the material interfaces.These reflections are due to extensive cracks in the archwhich must be considered in the analytical model of theaqueduct.
According to the test results, the discontinuities in thestructure appeared in the SIBIE results as relevant regions(red zones in this case). By evaluating the results, it can besaid that there are some flaws between layers. Some flawscould be seen by side but SIBIE results show that there wereothers inside the structure as well. The size of these flawswas estimated to be about 3-4 cm and occurred because ofdelamination of unit and mortar. These flaws decrease thestrength of the material and thus affect the durability of thestructure and these factors are considered in the FEMmodelof the structure.
4. Eigen Values and ModeShapes of Vezir Aqueduct
For the Eigen values and mode shapes of the structure, acommercial finite element program SAP 2000 [17] was used.First of all, with the help of the measurement survey data,the 3D geometry of the Veziragasi aqueduct was defined by37376 solid elements (Figure 6) and the calculated materialparameters of SM (stone masonry) and BM (brick masonry)were defined to the program and the FE model was created.After the analysis was completed, the theoretical modalshapes of the structure were gathered. The results are shownin Table 3.
5. Operational Modal Analysisof Vezir Aqueduct
The dynamic behavior of structures is related to their modalcharacteristics such as natural frequencies, mode shapes, anddamping ratios. This dynamic behavior is a combination ofmany factors including assumptions in the design criteriaand construction and uncertainties in the geometrical andmaterial properties. Modal testing is a method to estimatethe natural frequencies and mode shapes. Various methods,including both time and frequency domain-based proce-dures, are available for extracting modal information fromthe dynamic response of a structure and the correspondinginput excitation. The process of establishing the dynamiccharacteristics of a system from an experimental model iscalled “system identification.” In this study operationalmodalanalysis (OMA) is used for system identification. In OMA,accelerometers are placed on the structure and the structureis excited by an unknown input force such as traffic, wind,and seismic loads caused by ambience and the responses ofthe structure are measured by these accelerometers.
The operational modal analysis ambient excitation doesnot lend itself to frequency response functions (FRFs) orimpulse response function calculations because the inputforce is not measured. Therefore, a modal identificationprocedure will need to base itself on output-only data.Some modal parameter identification methods have beendeveloped. In this study, the peak picking (PP) method fromthe power spectral densities (PSDs) and SSI methods wereused for OMAs.The physics background of all these methodsis quite similar, but a few implementation aspects such as datareduction, type of equation solvers, and sequence of matrixoperations are different. In this study, the theory of OMAwillnot be mentioned.
Two ambient vibration tests were conducted for reliabilityon the aqueduct to determine its dynamic characteristics.10 uniaxial accelerometers were used in OMA and thesewere placed on the top of the aqueduct alongside and themodel was prepared for OMA (Figure 7). Signals acquiredfrom accelerometers were gathered in the 17-channel dataacquisition system (Bruel and Kjaer 3560) and were sentto Pulse software for further processing (Figure 8). Modalparameters were then extracted using OMA software [18].

The Scientific World Journal 7
(a) (b)
Figure 8: Uniaxial accelerometers and 17-channel data acquisition system.
−180
−90
0
0 4 8 12 16Frequency (Hz)
Enhanced frequency domain decomposition—peak pickingSingular values of spectral density of matrices
of data set: measurement 1
(dB|
(1m
/s2)2
/Hz)
(a)
(Dim
ensio
n)
Stabilization diagram of estimated state space modelsData set: measurement 1
Unweighted principal components
70503010
0 4 8 12 16Frequency (Hz)
(b)
Figure 9: The frequency response function (PP method) and stabilization diagram of the measurement (SSI method).
Table 4: Updated and experimental modal frequencies.
Frequency Analytical (SAP 2000) Updated frequencies (SAP 2000) Experimental frequencies (PP) Experimental frequencies (SSI)1 2.877 2.755 2.758 2.7592 4.2050 4.521 4.556 4.5153 5.555 5.410 5.391 5.3984 5.831 5.971 6.089 6.219
The ambient vibration tests were conducted under environ-mental loads such as wind effects and traffic. The OMA,PP, and SSI methods (Figure 9) were used to determine thenatural frequencies, mode shapes, and damping ratios ofthe aqueduct. The results from test 1 and test 2 are shownin Table 3. Frequencies obtained with the SSI method arenearly the same with those found in the PP method but alittle bit different from the FEM results. Differences betweenthe analytical and experimental results come from someuncertain parameters of the masonry.
6. Evaluation of Analytical andExperimental Results
The modal analyses results indicated that the initial theoret-ical frequencies were greater than the experimental frequen-cies, while themode shapes had a goodharmony.Thepossiblereasons for this are the unknown mechanical properties ofthe masonry, cracks, and boundary conditions of the base. Bychanging some boundaries and the elasticity modulus of the
foundation of the aqueduct, the FEMmodel was updated andfrequency values from FEM had become nearly the same asthe experimental values as shown in Table 4.
The study also clearly showed that the ambient vibrationtest is a very effective method for determining the dynamiccharacteristics of historical structures under operationalconditions. In this study, the natural frequencies, modeshapes, andmodal damping ratios of the Vezir aqueduct wereobtained using the ambient vibrations produced by trafficand wind. This was a nondestructive test for the aqueduct.Structural health can be assessed depending on the changesin dynamic characteristics of the aqueduct. If the naturalfrequencies and mode shapes of the aqueduct are measuredagain later, structural health can be evaluated by consideringthe changes.
7. Conclusions
The conventional testing methods and empirical formulasgiven in codes and standards for determining the material

8 The Scientific World Journal
parameters of the masonry structures can be consideredsufficient. On the other hand, by using the OMA results, thematerial properties and boundary conditions assigned in theFEmodel can bemodified to have real structural behavior. Atfirst, the modal shapes extracted from FEA and OMA werein good agreement with each other but there was a little bit ofdifference in the frequency values. By changing the boundaryconditions and modulus of elasticity using the OMA results,this difference was reduced and the 3D FE model of thestructure was modified. With the help of the updated FEmodel, the structure can be tested for different earthquakeswhich have happened in the past and the structural health ofthe aqueduct can be understood.
Conflict of Interests
The authors declare that there is no conflict of interestsregarding the publication of this paper.
Acknowledgments
The authors gratefully acknowledge the valuable contribu-tions of Ahmet Can Altunısık, Barıs Sevim, Temel Turker,and Alemdar Bayraktar to this study.
References
[1] P. B. Lourenco, Computational strategies for masonry structures[Ph.D. thesis], Delft University Press, Delft, The Netherlands,1996.
[2] P. B. Lourenco, Assessment of the Stability Conditions of Cister-cian Cloister, 2, International congress on Studies in AncientStructures, Istanbul, Turkey, 2001.
[3] L. Binda, G. Gatti, G. Mangano, C. Poggi, and L. G. Sacchi, “Thecollapse of the Civic Tower of Pavia: a survey of the materialsand structure,” Mason International, vol. 20, no. 6, pp. 11–20,1992.
[4] A. Bayraktar, T. Turker, B. Sevim, A. C. Altunısık, and F.Yıldırım, “Modal parameter identification of Hagia Sophia bell-tower via ambient vibration test,” Journal of NondestructiveEvaluation, vol. 28, no. 1, pp. 37–47, 2009.
[5] K. Bernardeschi, C. Padovani, and G. Pasquinelli, “Numericalmodelling of the structural behaviour of Buti’s bell tower,”Journal of Cultural Heritage, vol. 5, no. 4, pp. 371–378, 2004.
[6] A. Bayraktar, B. Sevim, A. C. Altunısık, S. Atamturktur, andF. Birinci, “Assessment of nonlinear seismic performance ofa restored historical arch bridge using ambient vibrations,”Nonlinear Dynamics, vol. 63, no. 4, pp. 755–770, 2011.
[7] M. M. Aktepe, Izmir Yazıları: Camiler, Hanlar, Medreseler,Sebiller, Hazırlayan Yayınları, Fikret Yılmaz, Izmir BB Kultur,Izmir, Turkey, 2003.
[8] TS 699, Methods of Testing Natural Building Stones, Institute ofTurkish Standards, Ankara, Turkey, 1987.
[9] R. Ulusay, C. Gokceoglu, and A. Binal, Rock Mechanics Lab-oratory Experiments, Turkish Chambers of Geology Engineers,Ankara, Turkey, 2001.
[10] ASTM, Standard Method for Laboratory Determination of PulseVelocities and Ultrasonic Elastic Constants of Rock, 1996, D2845-97, 1969.
[11] “European Committee for Standardization,” Eurocode 6, Brus-sels, Belgium, 1996.
[12] A. Kocak, Linear and nonlinear analysis of historical masonrystructures under static and dynamic loads case study: KucukAyasofya mosque [Ph.D. thesis], Yildiz Technical University,Istanbul, Turkey, 1999.
[13] M. Sansalone, “Impact-echo: the complete story,”ACI StructuralJournal, vol. 94, no. 6, pp. 777–786, 1997.
[14] N. Ata, S.Mihara, andM.Ohtsu, “Imaging of ungrouted tendonducts in prestressed concrete by improved SIBIE,” NDT and EInternational, vol. 40, no. 3, pp. 258–264, 2007.
[15] K. Nakahara and M. Kitahara, “Inversion of defects by lin-earized inverse scattering methods with measured waveforms,”in Proceedings International Symposium on Inverse Problems inEngineering Mechanics (ISIP ’00), pp. 9–18, Springer, Berlin,Germany, 2002.
[16] M. Ohtsu and T. Watanabe, “Stack imaging of spectral ampli-tudes based on impact-echo for flaw detection,” NDT and EInternational, vol. 35, no. 3, pp. 189–196, 2002.
[17] SAP2000, Integrated Finite Element Analysis and Design ofStructures, Computers and Structures, Berkeley, Calif, USA,2005.
[18] OMA, Operational Modal Analysis, Release 4. 0, StructuralVibration Solution A/S, Aalborg East, Denmark, 2006.

International Journal of
AerospaceEngineeringHindawi Publishing Corporationhttp://www.hindawi.com Volume 2014
RoboticsJournal of
Hindawi Publishing Corporationhttp://www.hindawi.com Volume 2014
Hindawi Publishing Corporationhttp://www.hindawi.com Volume 2014
Active and Passive Electronic Components
Control Scienceand Engineering
Journal of
Hindawi Publishing Corporationhttp://www.hindawi.com Volume 2014
International Journal of
RotatingMachinery
Hindawi Publishing Corporationhttp://www.hindawi.com Volume 2014
Hindawi Publishing Corporation http://www.hindawi.com
Journal ofEngineeringVolume 2014
Submit your manuscripts athttp://www.hindawi.com
VLSI Design
Hindawi Publishing Corporationhttp://www.hindawi.com Volume 2014
Hindawi Publishing Corporationhttp://www.hindawi.com Volume 2014
Shock and Vibration
Hindawi Publishing Corporationhttp://www.hindawi.com Volume 2014
Civil EngineeringAdvances in
Acoustics and VibrationAdvances in
Hindawi Publishing Corporationhttp://www.hindawi.com Volume 2014
Hindawi Publishing Corporationhttp://www.hindawi.com Volume 2014
Electrical and Computer Engineering
Journal of
Advances inOptoElectronics
Hindawi Publishing Corporation http://www.hindawi.com
Volume 2014
The Scientific World JournalHindawi Publishing Corporation http://www.hindawi.com Volume 2014
SensorsJournal of
Hindawi Publishing Corporationhttp://www.hindawi.com Volume 2014
Modelling & Simulation in EngineeringHindawi Publishing Corporation http://www.hindawi.com Volume 2014
Hindawi Publishing Corporationhttp://www.hindawi.com Volume 2014
Chemical EngineeringInternational Journal of Antennas and
Propagation
International Journal of
Hindawi Publishing Corporationhttp://www.hindawi.com Volume 2014
Hindawi Publishing Corporationhttp://www.hindawi.com Volume 2014
Navigation and Observation
International Journal of
Hindawi Publishing Corporationhttp://www.hindawi.com Volume 2014
DistributedSensor Networks
International Journal of