Embed Size (px)
Citation preview
Research ArticleFull Debonding Process of Adhesively Bonded Composite andMetallic Pipe Joints under Torsion
Jun Han and Hong Yuan
MOE Key Lab of Disaster and Control in Engineering Institute of Applied Mechanics Jinan University Guangzhou China
Correspondence should be addressed to Hong Yuan tyuanhongjnueducn
Received 2 September 2016 Revised 27 November 2016 Accepted 13 December 2016
Academic Editor Alkis S Paipetis
Copyright copy 2016 J Han and H YuanThis is an open access article distributed under the Creative Commons Attribution Licensewhich permits unrestricted use distribution and reproduction in any medium provided the original work is properly cited
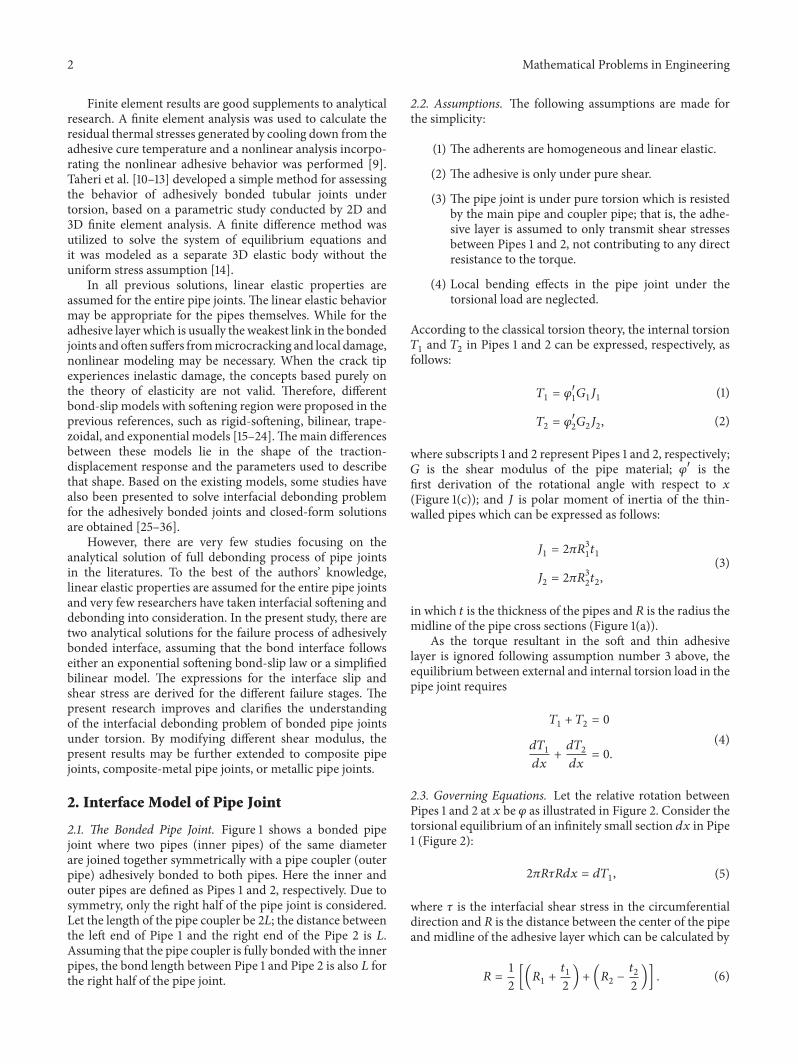
Bonded joints are very common inmany pipeline systems in which the bond behavior of the joint interface is of crucial importanceThis paper presents two analytical solutions for the debonding process of a pipe joint under torsion assuming that the bondinterface follows either an exponential softening bond-slip law or a simplified bilinear model The solutions are general applicableto composites andmetallic and indeed other pipes Based on the analytical solutions the influences of the bond length and stiffnesson the torque-displacement curve and ultimate load are investigated The solutions can be used to explain the stress transfermechanism the interface crack propagation and the ductility of the joint
1 Introduction
Pipes are very important structures in many industries suchas energy aerospace and construction [1] In considerationof whole weight strength and maintenance workload it iscommonly accepted that there should be less joints in a pipingsystem at first design Due to the limitation of transportationinstallation and rehabilitation a joint seems essential for alarge structure system containing different components Thelimitations of the overall system performance usually comefrom the capacity of pipe jointsTherefore the pipe joints playthemost important role in the overall integrity ofmost pipingsystems [2]
For metallic piping system the joints can be divided intothree types flange coupling welding and adhesive bondingThe first two traditional connections have the same shortagesuch as high stress concentration However the adhesivelybonded pipe joint can effectively lower the stress concen-tration [3] While for composite piping system connectingmethods can be roughly summarized as adhesive bondingbutt-strap heat-activated coupling and flange coupling Thefirst three joints are considered as permanent joints andthe same joint mechanism is found Most composite flangesare connected to composite pipe with one of the threepermanent methods Therefore a general adhesively bonded
pipe joint analysis can be used to analyze all the three typesof permanent composite pipe joints [4]
Adhesively bonded pipe joints provide uniform loadtransfer over the bonded area Nevertheless stress distri-bution in the bondline adhesive is nonuniform Among allthe possible loading configurations such as tension torsionand bending torsion is one of the fundamental types Dueto the difficulties in the analysis of interfacial behavior fewtheoretical studies of mode III (torsion) interfacial fractureproblems are available in the previous references
Based on the mechanics of composite materials and themaximum strain failure criterion an analytical and experi-mental study was conducted to investigate the elastic and fail-ure behavior of composite laminated pipe under torsion [5]Based on the general composite shell theory Zou and Taheri[6] studied the stress concentrations at and near the end of thejoints as functions of various parameters such as the overlaplength and thickness of the adhesive layer Pugno and Surace[7] confirmed that the maximum stresses were attained at theends of the adhesive and that the peak of maximum stresswas reached at the end of the stiffer tube and does not tendto zero as the adhesive length approaches infinity Chengand Li [8] developed an adhesively bonded smart compositepipe joint system by integrating electromechanical couplingpiezoelectric layers with the connection coupler
Hindawi Publishing CorporationMathematical Problems in EngineeringVolume 2016 Article ID 1237493 13 pageshttpdxdoiorg10115520161237493
2 Mathematical Problems in Engineering
Finite element results are good supplements to analyticalresearch A finite element analysis was used to calculate theresidual thermal stresses generated by cooling down from theadhesive cure temperature and a nonlinear analysis incorpo-rating the nonlinear adhesive behavior was performed [9]Taheri et al [10ndash13] developed a simple method for assessingthe behavior of adhesively bonded tubular joints undertorsion based on a parametric study conducted by 2D and3D finite element analysis A finite difference method wasutilized to solve the system of equilibrium equations andit was modeled as a separate 3D elastic body without theuniform stress assumption [14]
In all previous solutions linear elastic properties areassumed for the entire pipe joints The linear elastic behaviormay be appropriate for the pipes themselves While for theadhesive layer which is usually the weakest link in the bondedjoints andoften suffers frommicrocracking and local damagenonlinear modeling may be necessary When the crack tipexperiences inelastic damage the concepts based purely onthe theory of elasticity are not valid Therefore differentbond-slip models with softening region were proposed in theprevious references such as rigid-softening bilinear trape-zoidal and exponential models [15ndash24]Themain differencesbetween these models lie in the shape of the traction-displacement response and the parameters used to describethat shape Based on the existing models some studies havealso been presented to solve interfacial debonding problemfor the adhesively bonded joints and closed-form solutionsare obtained [25ndash36]
However there are very few studies focusing on theanalytical solution of full debonding process of pipe jointsin the literatures To the best of the authorsrsquo knowledgelinear elastic properties are assumed for the entire pipe jointsand very few researchers have taken interfacial softening anddebonding into consideration In the present study there aretwo analytical solutions for the failure process of adhesivelybonded interface assuming that the bond interface followseither an exponential softening bond-slip law or a simplifiedbilinear model The expressions for the interface slip andshear stress are derived for the different failure stages Thepresent research improves and clarifies the understandingof the interfacial debonding problem of bonded pipe jointsunder torsion By modifying different shear modulus thepresent results may be further extended to composite pipejoints composite-metal pipe joints or metallic pipe joints
2 Interface Model of Pipe Joint
21 The Bonded Pipe Joint Figure 1 shows a bonded pipejoint where two pipes (inner pipes) of the same diameterare joined together symmetrically with a pipe coupler (outerpipe) adhesively bonded to both pipes Here the inner andouter pipes are defined as Pipes 1 and 2 respectively Due tosymmetry only the right half of the pipe joint is consideredLet the length of the pipe coupler be 2L the distance betweenthe left end of Pipe 1 and the right end of the Pipe 2 is 119871Assuming that the pipe coupler is fully bonded with the innerpipes the bond length between Pipe 1 and Pipe 2 is also 119871 forthe right half of the pipe joint
22 Assumptions The following assumptions are made forthe simplicity
(1) The adherents are homogeneous and linear elastic
(2) The adhesive is only under pure shear
(3) The pipe joint is under pure torsion which is resistedby the main pipe and coupler pipe that is the adhe-sive layer is assumed to only transmit shear stressesbetween Pipes 1 and 2 not contributing to any directresistance to the torque
(4) Local bending effects in the pipe joint under thetorsional load are neglected
According to the classical torsion theory the internal torsion1198791 and 1198792 in Pipes 1 and 2 can be expressed respectively asfollows
1198791 = 1205931015840111986611198691 (1)
1198792 = 1205931015840211986621198692 (2)
where subscripts 1 and 2 represent Pipes 1 and 2 respectively119866 is the shear modulus of the pipe material 1205931015840 is thefirst derivation of the rotational angle with respect to 119909(Figure 1(c)) and 119869 is polar moment of inertia of the thin-walled pipes which can be expressed as follows
1198691 = 21205871198773111990511198692 = 2120587119877321199052 (3)
in which 119905 is the thickness of the pipes and 119877 is the radius themidline of the pipe cross sections (Figure 1(a))
As the torque resultant in the soft and thin adhesivelayer is ignored following assumption number 3 above theequilibrium between external and internal torsion load in thepipe joint requires
1198791 + 1198792 = 01198891198791119889119909 + 1198891198792119889119909 = 0 (4)
23 Governing Equations Let the relative rotation betweenPipes 1 and 2 at 119909 be 120593 as illustrated in Figure 2 Consider thetorsional equilibrium of an infinitely small section 119889119909 in Pipe1 (Figure 2)
2120587119877120591119877119889119909 = 1198891198791 (5)
where 120591 is the interfacial shear stress in the circumferentialdirection and 119877 is the distance between the center of the pipeand midline of the adhesive layer which can be calculated by
119877 = 12 [(1198771 + 11990512 ) + (1198772 minus 11990522 )] (6)
Mathematical Problems in Engineering 3
Adhesivelayer
t2
R
R1
R2
t1
(a) Cross section
Pipe coupler(pipe 2)
Main pipe(pipe 1)
Left end Right end
TT
T T
L
x
(b) Side view
Pipe coupler(pipe 2)
Main pipe(pipe 1)
Left end Right end
T
T
L
x
(c) Right half of the pipe joint
Figure 1 An adhesively bonded pipe joint
Main pipe(pipe 1)
Coupler(pipe 2)
dxdx
120591(x)
120591(x)
(a)
1205931205931
1205932
120575 = 120593R
R
(b)
Figure 2 Equilibrium of local interfacial shear stresses
The relative slip at the bond interface in the circumferentialdirection as 120575 can be found from the relative interfacialrotation 120593
120575 = 119877120593 = 1198771205931 minus 1198771205932 (7)
After substituting (1)ndash(4) into (5) and introducing the param-eter 120582 local bond strength 120591119891 and interfacial fracture energy119866119891 we have
11988921205751198891199092 minus 21198661198911205912119891
1205822119891 (120575) = 0 (8)
12059310158401 = 120591211989121198661198911205822 21205871198772
11986611198691 119889120575119889119909 (9)
where
1205822 = 2120587119877311986611198691 + 11986621198692119866111986911198662119869212059121198912119866119891 (10)
Substituting (9) into (1) the relationship of 1198791 and derivativeof 120575 can be obtained
1198791 = 21205871198772 120591211989121198661198911205822 119889120575119889119909 (11)
Equation (8) is the governing differential equation of theadhesively bonded joint It can be solved once the local bond-slip model is given
24 Bond-SlipModel As introduced before researchers haveproposed various bond-slip models Experimental resultsindicate that the bilinear model which features a linear
4 Mathematical Problems in Engineering
Exponential softening modelBilinear model
120591
120591f
1205751 120575f 120575
Gf
0
Figure 3 Bond-slip models
ascending branch followed by a linear descending branchprovides a close approximation [31] However the use oflinear softening law may lead to overestimating the mechan-ical properties of the joint Therefore a bond-slip law char-acterised by a linear phase with slope 120572 followed by anexponential softening branch is used [35] And the resultsbased on the two models are compared in order to providebetter understanding of failure process
For the exponential bond-slip law (Figure 3) the inter-facial shear stress increases linearly with slip within theelastic range The shear stress peaks at 120591119891 at which thevalue of the slip is denoted by 1205751 This stage is defined aselastic stage which is simplified as E The interface entersthe softening stage thereafter and the interfacial shear stressdecays exponentially with the interfacial slip This stage isdefined as softening stage which is simplified as S Themathematical expressions of the interfacial bond-slip law inFigure 3 are
120591 = 119891 (120575) = 1205911198911205751 120575 (0 le 120575 le 1205751)120591119891119890minus21205722(1205751205751minus1) (120575 gt 1205751) (12)
The bilinear model (Figure 3) features a linear ascendingbranch followed by a linear descending branch to zero at aslip 120575119891 This stage is defined as debonding stage which issimplified as D It is usually treated as a simplified model ofthe exponential softening model The results are usually veryclose if the fracture energy119866119891 is the same for the two models[28]This bond-slipmodel ismathematically described by thefollowing
120591 = 119891 (120575) =
1205911198911205751 120575 (0 le 120575 le 1205751)120591119891120575119891 minus 1205751 (120575119891 minus 120575) (1205751 lt 120575 le 120575119891)0 (120575 gt 120575119891)
(13)
The positive coefficient 1205722 in (12) characterises the exponen-tial decay can be related to the slip parameters of the bilinearmodel by letting the interfacial fracture energy 119866119891 be equalfor the two models
1205722 = 1205751120575119891 minus 1205751 (14)
3 Debonding Process The Exponential Model
31 Elastic Stage At small loads there is no interfacial soft-ening or debonding along the interface so the entire lengthof the interface is in an elastic stress state Substituting thefirst expression in (12) into (8) gives the following differentialequation
12057510158401015840 (119909) minus 12058221120575 (119909) = 0 (0 le 120575 le 1205751) (15)
where
12058221 = 2120587119877311986611198691 + 1198662119869211986611198691119866211986921205911198911205751 (16)
The inner pipe is free from stress at 119909 = 0 and subjectedto a torque 119879 at 119909 = 119871 so the boundary conditions can beexpressed as
12059310158401 (0) = 0 (17)
12059310158401 (119871) = 11987911986611198691 (18)
Based on these boundary conditions the solution of (15)for the relative shear displacement and shear stress of theadhesive layer can be written in the form
120575 (119909) = 1198791205751120582121205871198772120591119891 cosh (1205821119909)sinh (1205821119871) (19)
120591 (119909) = 119879120582121205871198772 cosh (1205821119909)sinh (1205821119871) (20)
The interfacial slip at the free end of the outer pipe (ie thevalue of 120575 at 119909 = 119871) is defined as the displacement of thebonded joint for convenience and denoted by Δ here From(19) the torque-displacement is expressed as
119879 = 2120587119877212059111989112057511205821 tanh (1205821119871) Δ (21)
32 Elastic-Softening Stage As the load increases the interfa-cial slip reaches 1205751 at 119909 = 119871 and the bond enters the softeningstage thereThewhole interface is in an elastic-softening stageand the length of the softening region 119886 increases with theincrease of torque 119879 Substituting (12) into (8) gives (15) andthe following equation for this stage
12057510158401015840 (119909) minus 12058222119890minus21205722(120575(119909)1205751) = 0 (120575 gt 1205751) (22)
Mathematical Problems in Engineering 5
where
12058222 = 2120587119877311986611198691 + 119866211986921198661119869111986621198692 12059111989111989021205722 (23)
Applying the boundary conditions of (17) and (18) and thefollowing continuity conditions
120575 (119871 minus 119886) = 12057511205751015840 (119909) is continues at 119909 = 119871 minus 119886 (24)
the solution for the elastic region of the interface (0 le 120575 le 1205751ie 0 le 119909 le 119871 minus 119886) is obtained as
120575 (119909) = 1205751 cosh (1205821119909)cosh [1205821 (119871 minus 119886)]
120591 (119909) = 120591119891 cosh (1205821119909)cosh [1205821 (119871 minus 119886)]
(25)
and the solution for the softening region of the interface (120575 gt1205751 ie 119871 minus 119886 le 119909 le 119871) is120575 (119909) = 1119899 ln(21198981198991198881 ) + 2119899 ln cosh [1198992radic1198881 (119909 minus 1198882)] (26)
120591 (119909) = 120591119891119890minus21205722[120575(119909)1205751minus1] (27)
where
119898 = 12058222119899 = 212057221205751
(28)
Using (24) the constants 1198881 and 1198882 can be obtained as
1198881 = 12057511205821 tanh [1205821 (119871 minus 119886)]2 + 2119898119899 119890minus1198991205751 (29)
1198882 = 119871 minus 119886 minus 2119899radic1198881 arccosh(radic 119899119888121198981198901198991205751) (30)
The expression of slip at 119909 = 119871 can be obtained from (26) as
Δ = 120575 (119871)= 1119899 ln(21198981198991198881 ) + 2119899 ln cosh [1198992radic1198881 (119871 minus 1198882)] (31)
Substituting (18) and (26) into (9) yields
119879 = 212058711987721205911198911205751198911205822 radicminus2119898119899 119890minus119899Δ + 1198881 (32)
For exponential model by substituting (31) into (32) theexpression of 119879 above can be rewritten as
119879 = 212058711987721205911198911205751198911205822 radic1198881 tanh [1198992radic1198881 (119871 minus 1198882)] (33)
When 119871 is sufficiently large (approaches to infinity) (33) and(29) converge to
119879119906 = 212058711987721205911198911205751198911205822 radic1198881 (34)
where
1198881 = (12057511205821)2 + 2119898119899 119890minus1198991205751 (35)
in which 119879119906 is the maximum possible value (the asymptoticvalue) 119879 can reach
In bonded joints there is usually an effective bond length119897119890 which is defined as the length beyond which an increase ofthe bond length the loading capacity of the bonded joint doesnot increase further [37] For the exponential bond-slip lawemployed here the loading (torque) capacity always increaseswith the bond length 119871 but the rate of increase would be verysmall if 119871 is sufficiently large Following Yuan et al 2004 theeffective bond length is defined here as the bond lengthwhichprovides a resistance of 97 of 119879119906 Following this definition119897119890 can be obtained from (30) and (33)ndash(35) as
119897119890 = 119886119890 + 21205821 (36)
where
119886119890 = 4119899radic1198881 minus 2119899radic1198881 arccosh(radic 119899119888121198981198901198991205751) (37)
33 Softening Stage As the load increases the peak of theshear stress moves towards the middle of the joint (119909 = 0)When the interfacial slip at 119909 = 0 reaches 1205751 the wholeinterface enters into softening This stage is governed by(22) with the boundary conditions of (17) and (18) Thesolution for the interfacial slip and the shear stress of the bondinterface can be obtained as
120575 (119909) = 1119899 ln(21198981198991198883 ) + 2119899 ln cosh [1198992radic1198883 (119909 minus 1198884)] (38)
120591 (119909) = 120591119891119890minus21205722[120575(119909)1205751minus1] (39)
where the constants 1198883 and 1198884 are1198883 tanh2 [119899radic11988832 (119871 minus 1198884)] = ( 119879120575119891120582221205871198772120591119891)
2 1198884 = 0
(40)
Substituting (18) and (38) into (9) yields
119879 = 212058711987721205911198911205751198911205822 radicminus2119898119899 119890minus119899Δ + 1198883 (41)
6 Mathematical Problems in Engineering
The expression of the slip at 119909 = 119871 can be obtained from (38)
Δ = 1119899 ln(21198981198991198883 ) + 2119899 ln cosh [1198992radic1198883 (119871 minus 1198884)] (42)
4 Debonding Process Bilinear Model
41 Elastic Stage The solution for the elastic stage is the sameas that in Section 31
42 Elastic-Softening Stage As the load increases softeningcommences at 119909 = 119871 once the shear stress reaches 120591119891 there 119879increases as the softening length 119886 increases Substituting thefirst or the second expression in (13) into (8) gives (15) andthe following
12057510158401015840 (119909) minus 12058223 [120575119891 minus 120575 (119909)] = 0 (1205751 lt 120575 le 120575119891) (43)
where
12058223 = 2120587119877311986611198691 + 119866211986921198661119869111986621198692120591119891120575119891 minus 1205751 (44)
With the same boundary and continuity conditions as inSection 32 the solution for the elastic region of the interface(0 le 120575 le 1205751 ie 0 le 119909 le 119871 minus 119886) is the same as that inSection 32 and the solution for the softening region of theinterface (1205751 lt 120575 le 120575119891 ie 119871 minus 119886 le 119909 le 119871) is given by
120575 (119909) = (120575119891 minus 1205751)sdot 12058231205821 tanh [1205821 (119871 minus 119886)] sin [1205823 (119909 minus 119871 + 119886)]minus cos [1205823 (119909 minus 119871 + 119886)] + 120575119891120575119891 minus 1205751
(45)
120591 (119909)= minus120591119891 12058231205821 tanh [1205821 (119871 minus 119886)] sin [1205823 (119909 minus 119871 + 119886)]minus cos [1205823 (119909 minus 119871 + 119886)]
(46)
Substituting (18) and (45) into (9) yields
119879 = 212058711987721205911198911205823 12058231205821 tanh [1205821 (119871 minus 119886)] cos (1205823119886)+ sin (1205823119886)
(47)
The expression of the slip at 119909 = 119871 can be obtained from (45)
Δ = (120575119891 minus 1205751) 12058231205821 tanh [1205821 (119871 minus 119886)] sin (1205823119886)minus cos (1205823119886) + 120575119891120575119891 minus 1205751
(48)
During this stage the torque-displacement curve can bedetermined from (47) and (48) When the interfacial slipincreases to 120575119891 at 119909 = 119871 but the slip at 119909 = 0 is less than 1205751the interface enters into elastic-softening-debonding stageWhen the slip at 119909 = 0 reaches 1205751 and the slip at 119909 = 119871 is lessthan 120575119891 the interface enters into softening stage Thereforethere exists a critical bond length to distinguish the failureprocess
119871119888119903 = 12058721205823 (49)
When the bond length is larger than 119871119888119903 the interface entersinto elastic-softening-debonding stage When the bondlength is shorter than 119871119888119903 the interface enters into softeningstage For the bilinear model 119879 reaches its maximum whenthe derivative of (47) with respect to 119886 equals zeroTherefore119886 at the ultimate load can be found from the followingrelationship
tanh [1205821 (119871 minus 119886)] = 12058231205821 tan (1205823119886) (50)
Substituting (50) into (47) yields
119879 = 212058711987721205911198911205823120575119891120575119891 minus 1205751 sin (1205823119886) (51)
It can be shown from (50) and (51) that 119879 approaches thefollowing value when 119871 is large
119879119906 = 21205871198772120591119891120582 (52)
Following the same definition in (36) and considering thattanh(2) asymp 097 the effective bond length when 097119879119906 isreached can be obtained from (50)ndash(52) to give
119897119890 = 119886119890 + 121205821 ln[1205821 + 1205823 tan (1205823119886119890)1205821 minus 1205823 tan (1205823119886119890)] (53)
where
119886119890 = 11205823 arcsin[[097radic120575119891 minus 1205751120575119891 ]] (54)
43 Joints with 119871 gt 119871119888119903431 Elastic-Softening-Debonding Stage If 119871 gt 119871119888119903 as thetorque increases the interfacial slip at 119909 = 119871 reaches 120575119891 whichrepresents the initiation of debonding (or macrocracking orfracture) Because Δ = 120575119891 at the initiation of debondingthe corresponding value of 119886 denoted by 119886119889 can be obtainedfrom (48) as
12058231205821 tanh [1205821 (119871 minus 119886119889)] sin (1205823119886119889) minus cos (1205823119886119889) = 0 (55)
Mathematical Problems in Engineering 7
Debonding propagates hereafter and the peak shear stressmoves towards 119909 = 0 Assuming that the debonded lengthof the interface starting at 119909 = 119871 is 119889 (25) and (45)-(46)are still valid if replacing 119871 by 119871 minus 119889 Therefore the torque-displacement relationship can be written as
119879 = 212058711987721205911198911205823 12058231205821 tanh [1205821 (119871 minus 119889 minus 119886)] cos (1205823119886)+ sin (1205823119886)
(56)
Δ = 120575119891 + 120575119891119879120582221205871198772120591119891 119889 (57)
As the interfacial shear stress at119909 = 119871minus119889 is zero the followingrelationship can be obtained
12058231205821 tanh [1205821 (119871 minus 119889 minus 119886)] sin (1205823119886) minus cos (1205823119886) = 0 (58)
Substituting (58) into (56) yields the following simplifiedform
119879 = 212058711987721205911198911205823 1sin (1205823119886) (59)
At the end of this stage the softening-debonding stage startswhen 119871 minus 119889 = 119886119906 Substituting this into (58) yields
119886119906 = 12058721205823 (60)
Moreover by substituting (60) into (59) (59) can be writtenas
119879 = 212058711987721205911198911205823 (61)
432 Softening-Debonding Stage This stage is governed by(43) with the boundary conditions of (17) and
12059310158401 (119886) = 11987911986611198691 (62)
120575 (119886) = 120575119891 (63)
Based on the boundary conditions the following solution canthus be found by solving the governing equation (43)
119886 = 12058721205823 = 119886119906 (64)
120575 (119909) = 120575119891 minus 1205751198911198791205822212058711987721205911198911205823 cos (1205823119909) (0 le 119909 le 119886119906) (65)
120591 (119909) = 120582311987921205871198772 cos (1205823119909) (0 le 119909 le 119886119906) (66)
From (64) it is seen that the length of softening zoneremains constant during this stage The torque-displacementrelationship can be obtained by solving (8) for the case of 120575 gt120575119891 or directly displacement superposition along the bondedjoint
Δ = 120575119891 + 120575119891119879120582221205871198772120591119891 (119871 minus 119886119906) (67)
44 For Joints with 119871 lt 119871119888119903441 Softening Stage As the load increases the shear stresspeak moves towards 119909 = 0 When the interfacial slip at119909 = 0 reaches 1205751 the whole interface enters into the softeningzoneThis stage is governed by (43)with boundary conditionsof (17) and (18) Based on the boundary conditions thefollowing solution can be obtained by solving the governingequation (43)
120575 (119909) = 120575119891 minus 1198791205822120575119891 cos (1205823119909)212058711987721205911198911205823 sin (1205823119871) (68)
120591 (119909) = 1198791205823 cos (1205823119909)21205871198772 sin (1205823119871) (69)
The expression of the slip at 119909 = 119871 can be obtained from (68)
Δ = 120575119891 minus 1198791205822120575119891212058711987721205911198911205823 cot (1205823119871) (70)
As shown in the bond-slip law when the interface slip reaches120575119891 debonding occurs Substituting this condition into (70)the external load reduces to zero Hence it can be concludedthat the softening stage here always represents the ultimatefailure stage
5 Numerical Simulations
The results of an adhesively bonded metal-composite pipejoint are presented here The typical inner diameter andthickness are assumed to be 300 and 10mm for the metallicmain pipe respectively And the inner diameter and thicknessof the composite coupler are assumed to be 3204 and5mm respectively For metallic main pipe the mechanicalproperties are chosen as 11986411 = 11986422 = 200GPa 11986612 =75GPa and 12058312 = 03 For composite coupler themechanicalproperties are chosen as 11986411 = 252GPa 11986422 = 75GPa11986612 = 24GPa and 12058312 = 032 The parameters for interfacialbond-slip laws are identified as 120591119891 = 72MPa 1205751 = 0034mmand 120575119891 = 016mm
According to the material properties and geometryparameters given above the critical bond length for bilinearmodel can be calculated as 119871119888119903 = 23mm Therefore bondlengths of 20 and 80mm are chosen
51 Load-Displacement Curves
511 Load-Displacement Curves for Exponential Model Theload-displacement curve for exponential model is shown in
8 Mathematical Problems in Engineering
B
CO
A
T(K
Nm
)
0
3
6
9
12
15
18
005 01 015 020Δ (mm)
(a) 119871 = 20mm
B
O
A
C
T(K
Nm
)
0
5
10
15
20
01 02 03 04 05 06 070Δ (mm)
(b) 119871 = 80mm
Figure 4 Load-displacement curves exponential model
B
O
A
C
T(K
Nm
)
0
5
10
15
20
004 008 012 0160Δ (mm)
(a) 119871 = 20mm
A
B
C
O D
T(K
Nm
)
0
5
10
15
20
01 02 03 04 05 06 070Δ (mm)
(b) 119871 = 80mm
Figure 5 Load-displacement curves bilinear model
Figure 4 OA AB and BC are elastic elastic-softening andsoftening stages respectively
512 Load-Displacement Curves for Bilinear Model Whenthe bond length is shorter than 119871119888119903 take 119871 = 20mm andthe load-displacement curve is shown in Figure 5(a) OA ABand BC are elastic elastic-softening and softening stagesrespectively When the bong length is longer than 119871119888119903 take119871 = 80mm and the load-displacement curve is shown inFigure 5(b) OA AB BC and CD are elastic elastic-soften-ing elastic-softening-debonding and softening-debondingstages respectively
52 Shear Stress Distribution Theshear stress distribution forexponential model is shown in Figure 6 When the load issmall the interfacial shear stress at loaded end is less thanpeak stress and the interface is in an elastic stage When theinterfacial shear stress reaches peak stress at loaded end theinterface enters into elastic-softening stage As load increasesthe peak stress moves from loaded end to unloaded end andthe length of softening zone increases When the interfacialshear stress at unloaded end reaches peak stress the interfaceenters into softening stage For simplified legend the criticalstatus is defined as the end For example the critical status
between elastic stage and elastic-softening stage is defined asE-end in Figure 6(a) And the following abbreviations are thesame
The shear stress distribution of 119871 = 20mm and 119871 =80mm for bilinear model are shown in Figures 7(a) and 7(b)respectively When the load is small the interfacial shearstress at loaded end is less than peak stress and the interfaceis an in elastic stage When the interfacial shear stress reachespeak stress at loaded end the interface enters into elastic-softening stage As load increases the peak stress moves fromloaded end to unloaded end and the length of softening zoneincreases When the interfacial shear stress at unloaded endreaches peak stress while Δ lt 120575119891 the interface enters intosoftening stage shown as in Figure 7(a)WhenΔ = 120575119891 and theinterfacial shear stress at unloaded end is less than peak stressthen the interface enters into elastic-softening-debondingstage as shown in Figure 7(b) The length of debonding zoneincreases as the peak stressmoves to unloaded endWhen theinterfacial shear stress at unloaded end reaches peak stressthe interface enters into softening-debonding stage
53 Parametric Study Figure 8(a) shows the influence fordifferent bond lengths of bilinearmodel on the load-displace-ment curves From the figure the significant influence for
Mathematical Problems in Engineering 9
0
2
4
6
8120591
(MPa
)
5 10 15 200x (mm)
EndashT = 415KNmE-endndashT = 877KNmE-SndashT = 1558KNm
E-S-endndashT = 1505KNmSndashT = 797KNm
(a) 119871 = 20mm
0
2
4
6
8
120591(M
Pa)
20 40 60 800x (mm)
EndashT = 417KNmE-endndashT = 886KNmE-SndashT = 1932KNm
E-S-endndashT = 1718KNmSndashT = 896KNm
(b) 119871 = 80mm
Figure 6 Shear stress distribution exponential model
0
2
4
6
8
120591(M
Pa)
5 10 15 200x (mm)
EndashT = 427KNmE-endndashT = 879KNmE-SndashT = 1672KNm
E-S-endndashT = 1673KNmSndashT = 864KNm
(a) 119871 = 20mm
0
2
4
6
8120591
(MPa
)
20 40 60 800x (mm)
EndashT = 395KNmE-endndashT = 889KNmE-SndashT = 1573KNmE-S-endndashT = 1928KNm
E-S-DndashT = 1928KNmE-S-D-endndashT = 1711KNmS-DndashT = 922KNm
(b) 119871 = 80mm
Figure 7 Shear stress distribution bilinear model
T(K
Nm
)
01 02 03 04 05 06 070Δ (mm)
0
5
10
15
20
L = 20mmL = 40mm
L = 60mmL = 80mm
(a) Bilinear model
T(K
Nm
)
0
5
10
15
20
01 02 03 04 05 06 070Δ (mm)
L = 20mmL = 40mm
L = 60mmL = 80mm
(b) Exponential model
Figure 8 Effect of bond length on load-displacement
10 Mathematical Problems in Engineering
Exponential modelBilinear model
T(K
Nm
)
0
5
10
15
20
005 01 015 020Δ (mm)
(a) 119871 = 20mm
Exponential modelBilinear model
T(K
Nm
)
0
5
10
15
20
005 01 015 02 025 03 0350Δ (mm)
(b) 119871 = 40mm
Exponential modelBilinear model
T(K
Nm
)
0
5
10
15
20
01 02 03 04 050Δ (mm)
(c) 119871 = 60mm
Exponential modelBilinear model
T(K
Nm
)
0
5
10
15
20
01 02 03 04 05 06 070Δ (mm)
(d) 119871 = 80mm
Figure 9 Comparison of the load-displacement curves predicted from using the two bond-slip models
bond length on the curves could be observed In the rangeof the effective bond length as the bond length increasesnot only the interface failure processes change but also theultimate load and interfacial slip Specifically the increaseof the bond length can increase damage ductility Howeverwhen the bond length reaches a certain length (effective bondlength) the ultimate load will hardly change Figure 8(b)shows the influence for different bond lengths of exponentialmodel on the load-displacement curves From the figure weknow that as the bond length increases the ultimate loadincreases But the failure processes are all the same Namelythe increase of the bond length can also increase damageductility
Figure 9 shows the comparison of the load-displacementcurves between the two models for different bond lengthsThe load-displacement curves are different when a softeningarea exists In addition since there is no debonding situationin the exponential model the displacement can increaseunlimitedly with this being different from bilinear modelin which the slip would approach 120575119891 From the figuresthe load increases faster in the bilinear model as the bondlengths increases However when the bond length is long
the ultimate loads between the two models seem no moredifferent
Figure 10 shows the load-displacement curves for differ-ent ratios of torsion stiffness (120573 = (11986621198692)(11986611198691)) From thefigures we can see that as the ratio increases the ultimateload increases but the slip decreases namely the ductilityreduces Moreover the larger the ratio is the smaller thechange magnitude will be
Figure 11 shows the relationship of effective bond lengthand ratio of torsion stiffness From the figure we can see thata stiffer coupler leads to a longer effective bond length Butas the ratio is getting larger the effective bond length doesnot obviously increase As the ratio increases the effectivebond lengths of two models have the similar trend but theeffective bond length of exponential model is longer than thatof bilinear model
Through the numerical computation the ultimate load ofexponential and bilinear models for different bond lengthscould be obtained Figure 12 shows the ultimate load fordifferent bond lengths From the figure we can see that forbilinear model when the bond length is short the ultimateload increases significantly with the bond length When
Mathematical Problems in Engineering 11
0
50
100
150T
(KN
m)
005 01 015 02 025 030Δ (mm)
120573 = 1
120573 = 2
120573 = 3
120573 = 4
(a) Bilinear model
0
50
100
150
T(K
Nm
)
005 01 015 02 025 030Δ (mm)
120573 = 1
120573 = 2
120573 = 3
120573 = 4
(b) Exponential model
Figure 10 Effect of torsion stiffness on the load-displacement curve
Bilinear modelExponential model
80
120
160
200
240
280
l e(m
m)
2 4 6 8 100120573
Figure 11 Effect of the torsion stiffness ratio on the effective bondlength
Exponential modelBilinear model
0
5
10
15
20
T(K
Nm
)
20 40 60 800L (nm)
Figure 12 Effect of the bond length on the ultimate load
the bond length is long the ultimate load stays essentiallyunchanged For the exponentialmodel when the bond length
is short the trend is similar to the bilinear model but theultimate load is relatively smaller Bothmodels have the sameultimate load when the bond length is relatively long
6 Conclusions
On the basis of fully understanding the mechanical behaviorof the joint interface this paper gives a further understandingof the key factors of interfacial debonding By modifyingdifferent shear moduli the present results may be furtherextended to composite pipe joints composite-metal pipejoints or metallic pipe joints Based on the derivations in thecurrent study some important conclusions are summarizedas follows
(1) Through the nonlinear fracture mechanics the ana-lytical expressions of the interfacial shear stress andthe load-displacement relationship at loaded end ofpipe joints under torsion loads could be gottenThus the shear stress propagation and the debondingprogress of the whole interface for different bondlengths could be predicted
(2) The influences of different bond length on the load-displacement curve and the ultimate load are studiedthrough the analytical solutions The stress transfermechanism the interface crack propagation and theductility behavior of the joints could be explained
Competing Interests
The authors declare that they have no competing interests
Acknowledgments
Theauthors gratefully acknowledge the financial support pro-vided by the Science and Technology Scheme of GuangzhouCity (201510010013) Science and Technology Scheme ofGuangdong Province (2012A030200003) and the Natural
12 Mathematical Problems in Engineering
Science Foundation of China (National Key Project no11032005)
References
[1] E Dragoni and L Goglio ldquoAdhesive stresses in axially-loadedtubular bonded jointsmdashpart I critical review and finite elementassessment of publishedmodelsrdquo International Journal of Adhe-sion and Adhesives vol 47 pp 35ndash45 2013
[2] Z Y Ouyang and G Q Li ldquoInterfacial debonding of pipe jointsunder torsion loads a model for arbitrary nonlinear cohesivelawsrdquo International Journal of Fracture vol 155 no 1 pp 19ndash312009
[3] Z Ouyang and G Li ldquoCohesive zone model based analyticalsolutions for adhesively bonded pipe joints under torsionalloadingrdquo International Journal of Solids and Structures vol 46no 5 pp 1205ndash1217 2009
[4] C Yang and Z Guan ldquoStress analysis of composite pipe jointsunder combined torsional and tensile loadingrdquo Journal ofPressure Vessel Technology vol 131 no 5 Article ID 0512102009
[5] Y Zhao and S S Pang ldquoStress-strain and failure analyses ofcomposite pipe under torsionrdquo Journal of Pressure Vessel Tech-nology Transactions of the ASME vol 117 no 3 pp 273ndash2781995
[6] G P Zou and F Taheri ldquoStress analysis of adhesively bondedsandwich pipe joints subjected to torsional loadingrdquo Interna-tional Journal of Solids and Structures vol 43 no 20 pp 5953ndash5968 2006
[7] N Pugno and G Surace ldquoTubular bonded joint under torsiontheoretical analysis and optimization for uniform torsionalstrengthrdquoThe Journal of Strain Analysis for Engineering Designvol 36 no 1 pp 17ndash24 2001
[8] J Cheng and G Li ldquoStress analyses of a smart compositepipe joint integrated with piezoelectric composite layers undertorsion loadingrdquo International Journal of Solids and Structuresvol 45 no 5 pp 1153ndash1178 2008
[9] J H Oh ldquoStrength prediction of tubular composite adhesivejoints under torsionrdquo Composites Science and Technology vol67 no 7-8 pp 1340ndash1347 2007
[10] R Hosseinzadeh and F Taheri ldquoNon-linear investigation ofoverlap length effect on torsional capacity of tubular adhesivelybonded jointsrdquo Composite Structures vol 91 no 2 pp 186ndash1952009
[11] R Hosseinzadeh N Cheraghi and F Taheri ldquoAn engineeringapproach for design and analysis of metallic pipe joints undertorsion by the finite element methodrdquo The Journal of StrainAnalysis for EngineeringDesign vol 41 no 6 pp 443ndash452 2006
[12] R Hosseinzadeh K Shahin and F Taheri ldquoA simple approachfor characterizing the performance of metallic tubularadhesively-bonded joints under torsion loadingrdquo Journal ofAdhesion Science and Technology vol 21 no 16 pp 1613ndash16312007
[13] R A Esmaeel and F Taheri ldquoInfluence of adherendrsquos delamina-tion on the response of single lap and socket tubular adhesivelybonded joints subjected to torsionrdquo Composite Structures vol93 no 7 pp 1765ndash1774 2011
[14] W Xu and G Q Li ldquoFinite difference three-dimensional solu-tion of stresses in adhesively bonded composite tubular jointsubjected to torsionrdquo International Journal of Adhesion amp Adhe-sives vol 30 no 4 pp 191ndash199 2010
[15] A Hillerborg M Modeer and P-E Petersson ldquoAnalysis ofcrack formation and crack growth in concrete by means offracture mechanics and finite elementsrdquo Cement and ConcreteResearch vol 6 no 6 pp 773ndash781 1976
[16] ANeedleman ldquoContinuummodel for void nucleation by inclu-sion debondingrdquo Journal of Applied Mechanics TransactionsASME vol 54 no 3 pp 525ndash531 1987
[17] V Tvergaard and JW Hutchinson ldquoThe relation between crackgrowth resistance and fracture process parameters in elastic-plastic solidsrdquo Journal of theMechanics and Physics of Solids vol40 no 6 pp 1377ndash1397 1992
[18] J Dai T Ueda andY Sato ldquoDevelopment of the nonlinear bondstress-slip model of fiber reinforced plastics sheet-concreteinterfaces with a simple methodrdquo Journal of Composites forConstruction vol 9 no 1 pp 52ndash62 2005
[19] B Taljsten ldquoStrengthening of concrete prisms using the plate-bonding techniquerdquo International Journal of Fracture vol 82no 3 pp 253ndash266 1996
[20] R Xu andC Liu ldquoCZM-based debonding simulation of crackedbeams strengthened by FRP sheetsrdquo Journal of EngineeringMechanics vol 138 no 2 pp 210ndash220 2011
[21] S-KWoo andY Lee ldquoExperimental study on interfacial behav-ior of CFRP-bonded concreterdquo KSCE Journal of Civil Engineer-ing vol 14 no 3 pp 385ndash393 2010
[22] C Mazzotti M Savoia and B Ferracuti ldquoAn experimentalstudy on delamination of FRP plates bonded to concreterdquo Con-struction and Building Materials vol 22 no 7 pp 1409ndash14212008
[23] B Ferracuti M Savoia and CMazzotti ldquoInterface law for FRP-concrete delaminationrdquo Composite Structures vol 80 no 4 pp523ndash531 2007
[24] T Yu D Fernando J G Teng and X L Zhao ldquoExperimentalstudy on CFRP-to-steel bonded interfacesrdquo Composites Part BEngineering vol 43 no 5 pp 2279ndash2289 2012
[25] J F Chen H Yuan and J G Teng ldquoDebonding failure alonga softening FRP-to-concrete interface between two adjacentcracks in concretemembersrdquo Engineering Structures vol 29 no2 pp 259ndash270 2007
[26] VNarayanamurthy J F Chen J Cairns andD JOehlers ldquoPlateend debonding in the constant bending moment zone of platedbeamsrdquo Composites Part B Engineering vol 43 no 8 pp 3361ndash3373 2012
[27] H Yuan J F Chen J G Teng and X Z Lu ldquoInterfacial stressanalysis of a thin plate bonded to a rigid substrate and subjectedto inclined loadingrdquo International Journal of Solids and Struc-tures vol 44 no 16 pp 5247ndash5271 2007
[28] J G Teng H Yuan and J F Chen ldquoFRP-to-concrete interfacesbetween two adjacent cracks theoretical model for debondingfailurerdquo International Journal of Solids and Structures vol 43no 18-19 pp 5750ndash5778 2006
[29] H Yuan X Lu D Hui and L Feo ldquoStudies on FRP-concreteinterface with hardening and softening bond-slip lawrdquoCompos-ite Structures vol 94 no 12 pp 3781ndash3792 2012
[30] D Fernando T Yu and J G Teng ldquoBehavior of CFRP laminatesbonded to a steel substrate using a ductile adhesiverdquo Journal ofComposites for Construction vol 18 no 2 Article ID 040130402014
[31] ZWuH Yuan andH Niu ldquoStress transfer and fracture propa-gation in different kinds of adhesive jointsrdquo Journal of Engineer-ing Mechanics vol 128 no 5 pp 562ndash573 2002
Mathematical Problems in Engineering 13
[32] H Yuan J G Teng R Seracino Z S Wu and J Yao ldquoFull-range behavior of FRP-to-concrete bonded jointsrdquo EngineeringStructures vol 26 no 5 pp 553ndash565 2004
[33] A Caggiano E Martinelli and C Faella ldquoA fully-analyticalapproach for modelling the response of FRP plates bonded to abrittle substraterdquo International Journal of Solids and Structuresvol 49 no 17 pp 2291ndash2300 2012
[34] F Chen and P Qiao ldquoDebonding analysis of FRP-concreteinterface between two balanced adjacent flexural cracks inplated beamsrdquo International Journal of Solids and Structures vol46 no 13 pp 2618ndash2628 2009
[35] L De Lorenzis and G Zavarise ldquoCohesive zone modeling ofinterfacial stresses in plated beamsrdquo International Journal ofSolids and Structures vol 46 no 24 pp 4181ndash4191 2009
[36] P Cornetti and A Carpinteri ldquoModelling the FRP-concretedelamination by means of an exponential softening lawrdquo Engi-neering Structures vol 33 no 6 pp 1988ndash2001 2011
[37] J F Chen and J G Teng ldquoAnchorage strength models forFRP and steel plates bonded to concreterdquo Journal of StructuralEngineering vol 127 no 7 pp 784ndash791 2001
Submit your manuscripts athttpwwwhindawicom
Hindawi Publishing Corporationhttpwwwhindawicom Volume 2014
MathematicsJournal of
Hindawi Publishing Corporationhttpwwwhindawicom Volume 2014
Mathematical Problems in Engineering
Hindawi Publishing Corporationhttpwwwhindawicom
Differential EquationsInternational Journal of
Volume 2014
Applied MathematicsJournal of
Hindawi Publishing Corporationhttpwwwhindawicom Volume 2014
Probability and StatisticsHindawi Publishing Corporationhttpwwwhindawicom Volume 2014
Journal of
Hindawi Publishing Corporationhttpwwwhindawicom Volume 2014
Mathematical PhysicsAdvances in
Complex AnalysisJournal of
Hindawi Publishing Corporationhttpwwwhindawicom Volume 2014
OptimizationJournal of
Hindawi Publishing Corporationhttpwwwhindawicom Volume 2014
CombinatoricsHindawi Publishing Corporationhttpwwwhindawicom Volume 2014
International Journal of
Hindawi Publishing Corporationhttpwwwhindawicom Volume 2014
Operations ResearchAdvances in
Journal of
Hindawi Publishing Corporationhttpwwwhindawicom Volume 2014
Function Spaces
Abstract and Applied AnalysisHindawi Publishing Corporationhttpwwwhindawicom Volume 2014
International Journal of Mathematics and Mathematical Sciences
Hindawi Publishing Corporationhttpwwwhindawicom Volume 2014
The Scientific World JournalHindawi Publishing Corporation httpwwwhindawicom Volume 2014
Hindawi Publishing Corporationhttpwwwhindawicom Volume 2014
Algebra
Discrete Dynamics in Nature and Society
Hindawi Publishing Corporationhttpwwwhindawicom Volume 2014
Hindawi Publishing Corporationhttpwwwhindawicom Volume 2014
Decision SciencesAdvances in
Discrete MathematicsJournal of
Hindawi Publishing Corporationhttpwwwhindawicom
Volume 2014 Hindawi Publishing Corporationhttpwwwhindawicom Volume 2014
Stochastic AnalysisInternational Journal of
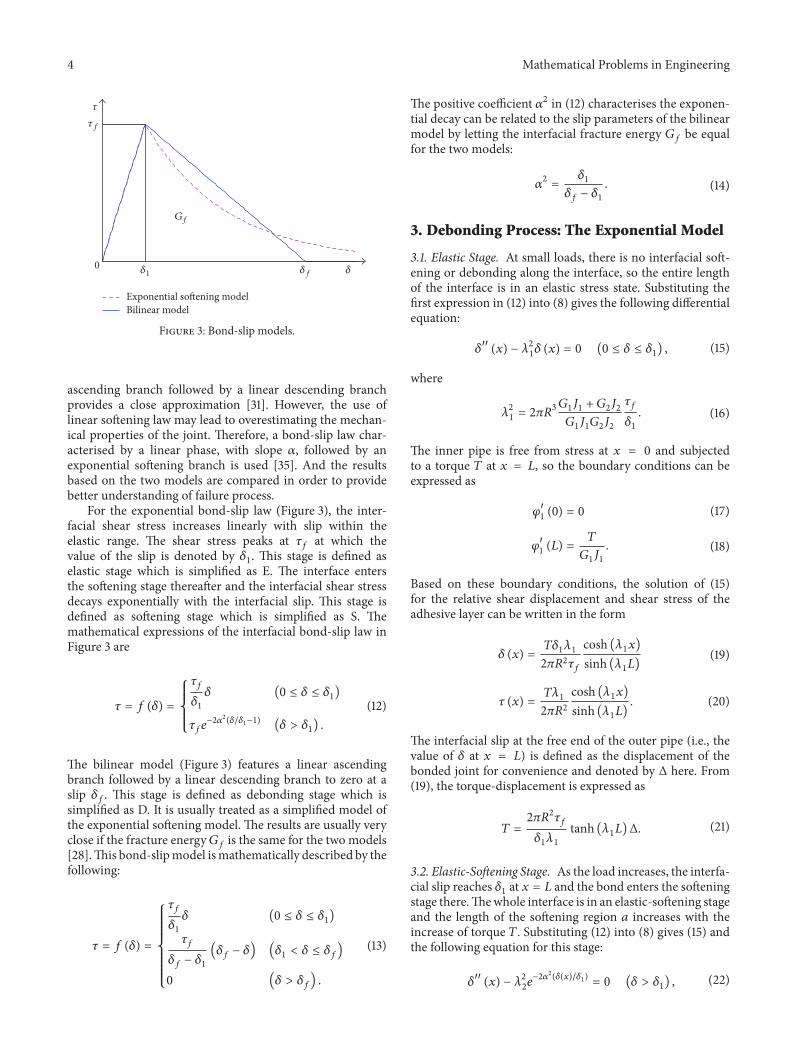
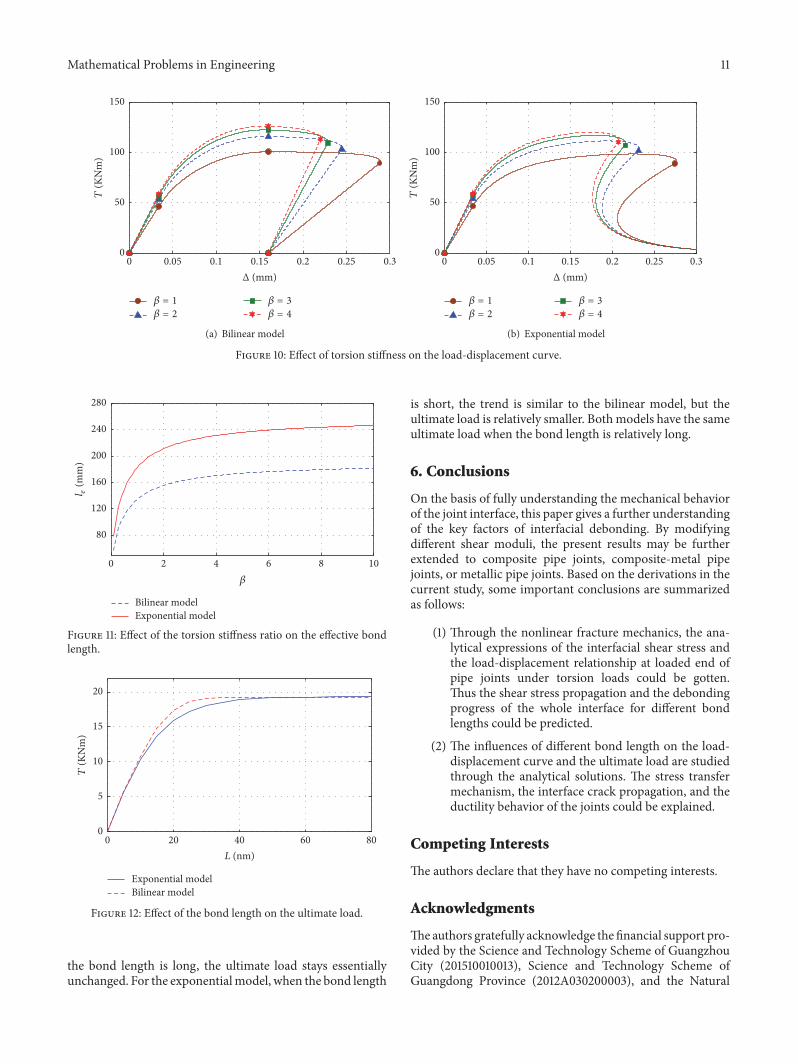
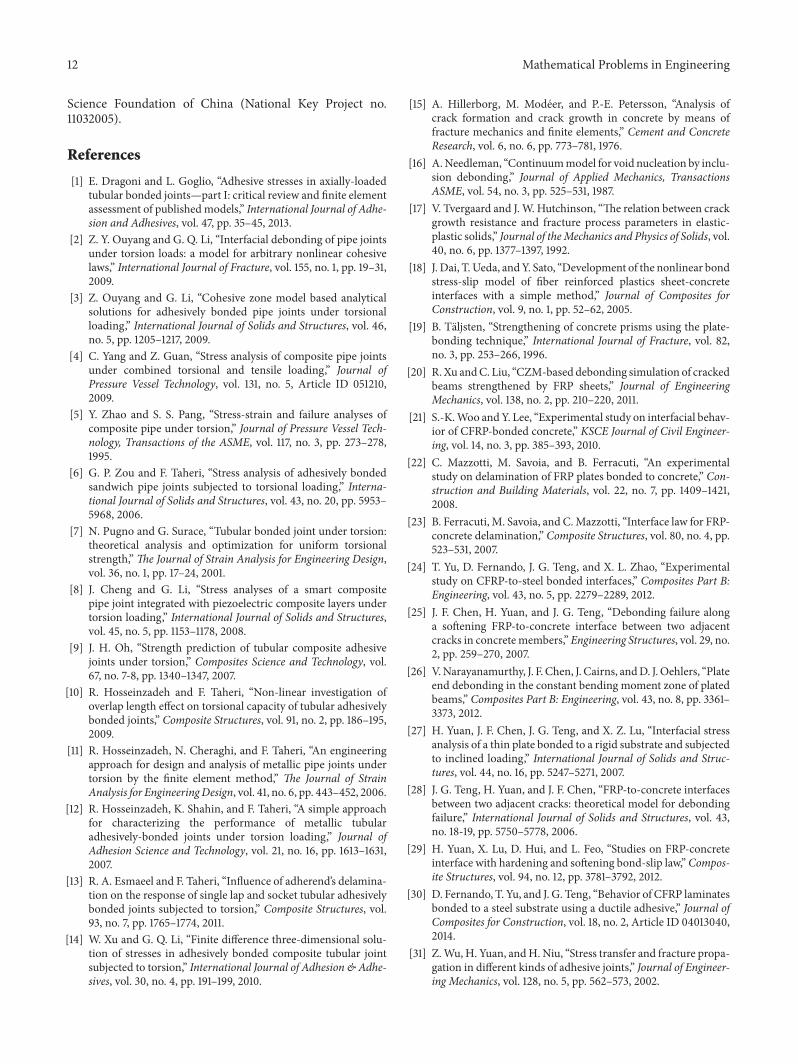
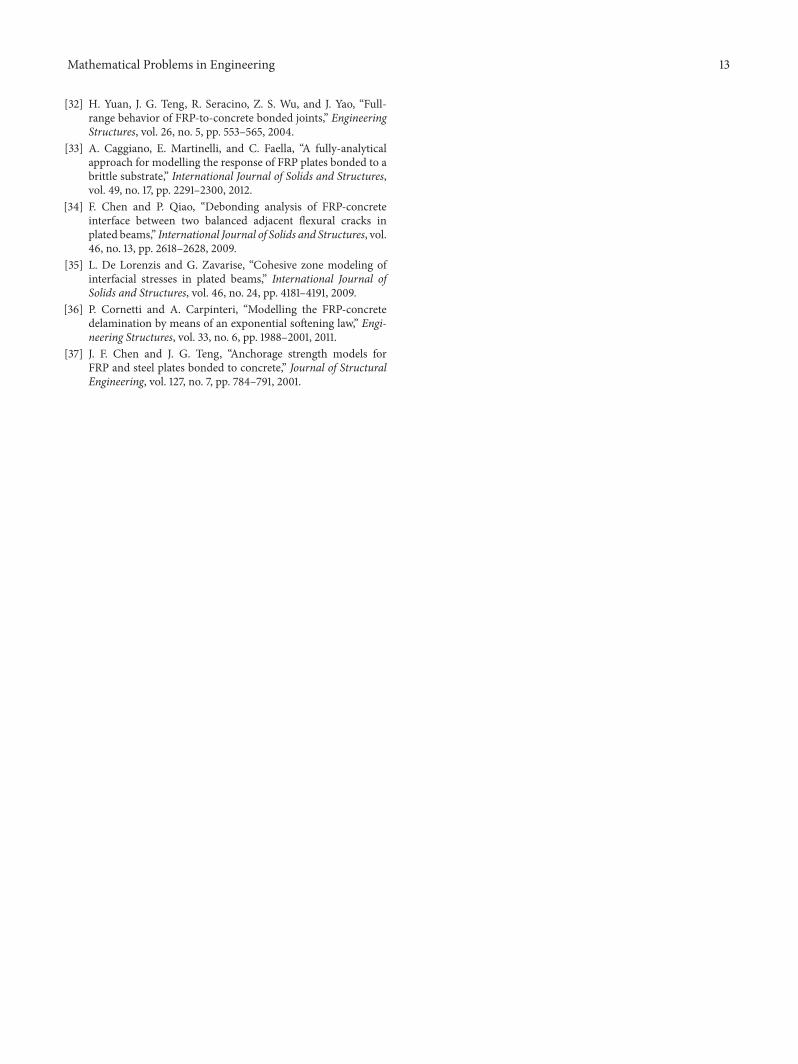