Embed Size (px)
Citation preview

Research ArticleFluid Evolution of the Magmatic Hydrothermal PorphyryCopper Deposit Based on Fluid Inclusion and Stable IsotopeStudies at Darrehzar, Iran
B. Alizadeh Sevari1 and A. Hezarkhani2
1 Department of Basic Sciences, Payame Noor University, P.O. Box 19395-3697, Tehran, Iran2Department of Mining and Metallurgy Engineering, Amirkabir University of Technology, Tehran, Iran
Correspondence should be addressed to B. Alizadeh Sevari; [email protected]
Received 3 August 2013; Accepted 22 September 2013; Published 8 January 2014
Academic Editors: A. C. Riccardi and A. V. Travin
Copyright © 2014 B. Alizadeh Sevari and A. Hezarkhani. This is an open access article distributed under the Creative CommonsAttribution License, which permits unrestricted use, distribution, and reproduction in any medium, provided the original work isproperly cited.
The Darrehzar porphyry Cu-Mo deposit is located in southwestern Iran (∼70 km southwest of Kerman City). The porphyriesoccur as Tertiary quartz-monzonite stocks and dikes, ranging in composition from microdiorite to diorite and granodiorite.Hydrothermal alteration and mineralization at Darrehzar are centered on the stock and were broadly synchronous with itsemplacement. Early hydrothermal alteration was dominantly potassic and propylitic and was followed by later phyllic andargillic alteration. The hydrothermal system involved both magmatic and meteoric water which were boiled extensively. Coppermineralization was accompanied by both potassic and phyllic alterations. Based on number, nature, and phases number which areavailable in room temperature, three types of fluid inclusions are typically observed in these veins: (1) vapor rich, (2) liquid rich and(3) multi phase. The primary multiphase inclusions within the quartz crystals were chosen for microthermometric analyses. Earlyhydrothermal alteration was caused by high-temperature, high-salinity orthomagmatic fluid and produced a potassic assemblage.Phyllic alteration was caused by high-salinity and lower-temperature orthomagmatic fluid. Magmatic and meteoric water mixtureswere developed in the peripheral part of the stock and caused propylitic alteration which is attributed to a liquid-rich, lowertemperature.
1. Introduction
Due to their low metal grade and very large volume,porphyry-type deposits are described as disseminated andmineralization is, to a great extent, controlled by fractures andfaults.
Porphyry copper deposits are formed where magmatic-hydrothermal fluids are expelled from a crystallizing magma[1, 2] and initiated by injection of oxidized magma saturatedwith S- and metal-rich, aqueous fluids from cupolas onthe tops of the subjacent parental plutons. The sequenceof alteration-mineralization is principally a consequence ofprogressive rock and fluid cooling caused by solidificationof the underlying parental plutons and downward propa-gation of the lithostatic-hydrostatic transition [3]. Cooling,depressurization, and reaction between the fluids and thewallrocks cause metals to precipitate in and around the fractures,
forming veins with alteration envelopes. Alteration assem-blages and associatedmineralization in porphyry ore depositsdevelop from huge hydrothermal systems dominated bymagmatic and meteoric fluids [4, 5].
Porphyry Cu systems host some of the most widely dis-tributed mineralization types at convergent plate boundariesincluding porphyry deposits centered on intrusions. Thesystems commonly define linear belts, some many hundredsof kilometers long, as well as occurring less commonly inapparent isolation [3].
Sahand-Bazman volcanic belt in Iran is a part of thecollisional Alpine-Himalaya orogenic belt, which extendsnorth-westward from Sahand volcano in Azerbaijan prov-ince, to Bazman volcano in southeast Iran, a distance ofapproximately 1700 km. This belt was formed by subductionof the Arabian plate beneath central Iran during the Alpineorogeny as first identified by Stocklin and Setudenia [6]
Hindawi Publishing CorporationISRN GeologyVolume 2014, Article ID 865941, 10 pageshttp://dx.doi.org/10.1155/2014/865941
2 ISRN Geology
and consists of alkaline and calc-alkaline volcanic rocks andrelated intrusions (I-type) [7–11].
Darrehzar deposit is located southeast of the Sarchesh-meh porphyry Cu deposit. Proven reserve of Darrehzardeposit is >80 million tons of disseminated sulfide ore, withan average grade of 0.55% Cu and approximately 0.005%Mb[12].
First studies at Darrehzar were carried out in 1969 byGeologic Survey of Iran, containing detailed geophysical,geochemical, and geological surveys. Next studies were pub-lished by Grujicic and Volickovic [13], Maanijou [14], andRanjbar et al. [15].
In this study, for the first time at Darrehzar area, wewill elucidate the hydrothermal history of the Darrehzarporphyry deposit in order to identify the factors controllingcopper-molybdenum mineralization. We have conducted afluid inclusion study and analyzed oxygen and sulfur isotopiccompositions of selected minerals. This information hasenabled us to determine the conditions under which thedeposit formed, reconstruct the fluid evolution, and developa model which satisfactorily explains the concentration of Cumineralization.
2. Geological Setting
The Darrehzar porphyry copper deposit is located ∼70 kmsouthwest of Kerman City in the Kerman province of south-western Iran (Figure 1). The stock is a part of the Sahand-Bazman igneous and metallogenic belt, a deeply erodedTertiary volcanic field, roughly 100 by 1700 km in extent, con-sisting mainly of rhyolite and andesite, with numerous felsicintrusions. Subduction and subsequent continental collisionfrom Paleocene to Oligocene caused extensive alkaline andcalc-alkaline volcanic and plutonic igneous activity [16–18].
The Darrehzar porphyries occur as Tertiary quartz-monzonite stocks and dikes, ranging in composition frommicrodiorite to diorite and granodiorite, intruding into vol-canic, volcanic-clastic, and volcanic sedimentary complexes.The volcanic sedimentary complex is the oldest rock witheocene age, covering a large area of Darrehzar.
Andesite and pyroclastic rocks are situated in the periph-eral parts of altered rock while microdiorite, diorite, andgranodiorite stocks build the central part of alteration zone.In this part, alterations are more intensive, rocks are crushed,and system of fracturing is well developed. Along both sidesofDarrehzar rivers remnant, of the river trace are situated andcomposed of pebbles of andesite and altered rocks, cementedwith clay and limonite.
The Darrehzar stock is highly altered, and even in theoutermost part of the intrusion it is not possible to findcompletely fresh rock. Surface weathering has developedFe-rich lithological units in leached zone and concentratedcopper minerals in supergene zone.
3. Hydrothermal Alteration andMineralization
Alteration assemblages and related mineralization in theDarrehzar porphyry copper deposit have been investigated
by geological mapping, and detailed mineralogical petro-graphical and chemical studies of a large number of drillcores and outcrop samples from various parts of the stockhave been carried out. Hydrothermal alterations at Darrehzardeposit are very intensive and weathering process changedthem even more. The central part of Darrehzar is composedof intensively hydrothermally altered rocks, covering thesurface of about 1.8 km2. Altered zone is elongated in eastwestdirection, 2.2 km × 1 km in size. Boundary between thealtered and unaltered rocks is sharp and in some parts it isvery irregular. At some area altered rocks interfinger withunaltered ones.
Early hydrothermal alteration was dominantly potassicand propylitic and was followed by later phyllic and argillicalterations. The earliest alteration is represented by potassicmineral assemblages developed pervasively and by halosaround veins in the deep and central parts of the Darrehzarstock. Potassic alteration is characterized by K-feldspar andsecondary biotite. This alteration displays a close spatialassociation with mineralization. Eastern boreholes reachedpotassic alteration in shallower depth thanwestern boreholes,indicating the presence of north-south reverse fault anderosion of overall alterations in this area.
The change from potassic to phyllic alteration is gradualand is marked by an increase in the proportion of muscovite.Phyllic alteration is characterized by the replacement ofalmost all rock-forming silicates by sericite and quartz andoverprints the earlier formed potassic alteration. Surfacesamples of phyllic alteration with gray color have quartzcontent in rocks and veins and are harder. Quartz veinsare surrounded by weak sericitic halos. Vein-hosted pyriteis partially replaced by chalcopyrite. Silicification was syn-chronous with phyllic alteration and variably affected a largepart of the stock and most dikes. In contrast to the transitionzone, appreciable Cu was added to the rock during phyllicalteration.
Because of erosion, propylitic alteration zone especiallyat eastern area of Darrehzar was rarely detected in boreholesamples and only was seen in contact area of porphyry stockwith eocene volcanic and volcano-clastic rocks.
Propylitic alteration is represented mainly by chloritiza-tion of primary and secondary biotite and groundmass mate-rial in rocks peripheral to the central potassic zone. Epidotereplaced plagioclase, but this alteration is less pervasive andless intense than chloritization. Minor mineral associatedwith propylitic alteration are albite, calcite, sericite, anhydrite(gypsum), and pyrite.
The shallow argillic alteration is interpreted to representa supergene blanket over the deposit and the deeper clayalteration of feldspar may have had the same origin. Rockswith argillic alteration are highly fractured and bleached.Some samples have aggregation of chlorite and clay minerals.
Feldspar is locally altered to clay down to a depth of300m, and within 80m of the erosional surface the entirerock has been altered to an assemblage of clay minerals. XRDanalyses indicate that kaolinite is the dominant clay mineralmixed with rarely montmorillonite and other erosion miner-als. This alteration is manifested by advanced replacement ofplagioclase and mafic phases by clay minerals.

ISRN Geology 3
Caspian Sea Turkmenistan
Tehran
Afghanistan
Chah Firuzeh
Sarcheshmeh
Paki
stan
Persian Gulf
Saudi Arabia
Iraq
Alborz MountainsSanandaj-Sirjan zoneLut blockEastern IranSahand-Bazman belt
MakranCentral IranZagros fold beltKopet Dagh
SymbolsStudy areaFaultThrust fault
45∘ 48∘ 51∘ 54∘ 57∘ 60∘ 63∘
39∘
37∘
35∘
33∘
31∘
29∘
27∘
25∘0 100 200
(km)
(a)
Geological map of Darrehzar
Qc
Ev
QZ-MZ
Ev
QZ-MZ
Et
EvEv
Ea-t
QZ-MZ
EtEvEt
EvEv
Et
Ev
MD and DI
MD and DI
MD&DI
Qc
GD
Ev
Ev
Qc
Qc
QT1
Ev
Qc
Qtr
GD
Ev
DW
Ev
QT1
Evb
Ev
Ev
393000
393000
393500
393500
394000
394000
394500
394500
395000
395000
3305
700
3305
700
3306
000
3306
000
3306
300
3306
300
3306
600
3306
600
3306
900
3306
900
0 200 400 600 800100
(meters)
Quaternary
Oligo-Miocene
Eocene
Cenozoic
Cenozoic
Cenozoic
Qal: Recent alluviumQtr: River traces
Qc: Clay and silt with debris rockQT1: Recent alluvium and talus
Gd: GranodioriteMD&DI: Microdiorite and diorite
Qz-Mz: Quartz-monzonite
Evb: Volcanic brecciaEa-t: Andesite, andesite basalt,crystal tuff, vitric tuff, vitriclithic tuff, lapilli tuff, and agglomerate
Et: Crystal tuff, vitric tuff, vitric
DW: Dam water Fault
Ev: Andesite and andesite basalt
NW
SE
lithic tuff, lapilli tuff, and agglomerate
(b)
Figure 1: (a) Geological map of Iran (7 and 20) showing Sahand-Bazman belt: calc-alkaline volcanic and quartz-monzonite and quartz dioriteintrusions, hosting Cu-Mo-porphyry-type mineralization and (b) detailed geological map of the Darrehzar area showing the distribution ofdifferent sites.
Based on drill cores, hypogene coppermineralizationwasintroduced during potassic and phyllic alteration and exists asdisseminations and as veinlets form. During potassic alter-ation, the copper mineralization consisted of chalcopyriteand bornite; later hypogene copper mineralization consistedmainly of chalcopyrite.
Copper grades and sulphide content increase toward themargins of the central potassic zone, from less than 0.10 wt%to 0.9 wt%. There is also a positive correlation betweensilicification and copper mineralization.
At the exposed surface of the deposit, rocks are highlyaltered and the only mineral which has survived supergeneargillization is quartz. Most of the sulfide minerals havebeen leached, and copper was concentrated in an underlyingsupergene zone by downward percolating ground waters.
4. Vein and Veinlet Classification
The veinlet sequence in porphyry Cu deposits, first detailedby Gustafson and Hunt [19] and widely studied since [18],
is highly distinctive. Based on mineralogy and cross-cuttingrelationships at Darrehzar area, it is possible to distinguishfour main groups of veins representing four episodes of veinformation: (I) quartz + pyrite ± molybdenite ± anhydrite ±k-feldspar ± chalcopyrite ± bornite ± cu and fe oxidicminerals (peripheral); (II) quartz + chalcopyrite + pyrite +molybdenite; (III) quartz + pyrite ± calcite ± chalcopyrite ±anhydrite (gypsum); (IV) quartz or calcite, gypsum or ±pyrite.
5. Fluid Inclusions Studies
Fluid inclusions from sulfide-bearing quartz veins obtainedfrom drill cores were studied (Figure 2). The samples offluid inclusions are abundant in quartz of all vein types, andrange in diameter from 1𝜇m up to 15 𝜇m. The majority ofinclusions examined during this study had diameters of 4–12 𝜇m. Only fluid inclusions within the quartz crystals inquartz-sulfide and quartz-molybdenite veinlets were chosenfor microthermometric studies. Most of the observations

4 ISRN Geology
PV-23
PV-22
PV-17
PV-16
PV-14
PV-12
PV9
PV8PV7
PV6PV5
PV4
PV3
PV2PV1
PI7
PI6
PI5
PI4
PI2
PI1
PC6PV11
PV10
PC58
PC56
PC21
PC17
DA-68
DA-67
DA-66 DA-65
DA-64DA-63
DA-62DA-61
DA-60
DA-59
DA-58
DA-57DA-56
DA-55
DA-54DA-53DA-52
DA-51DA-50
DA-49
DA-48
DA-47
DA-46
DA-45
DA-44
DA-43
DA-42
DA-41
DA-40
DA-39
DA-38
DA-37
DA-36
DA-35DA-34
DA-33DA-32
DA-31
DA-30
DA-29
DA-28
DA-27
DA-26
DA-25
DA-24
DA-23 DA-22
DA-21
DA-20
DA-19
DA-18 DA-17 DA-16
DA-15
DA-14DA-13
DA-12
DA-11
DA-10
DA-09
DA-08
DA-07DA-06
DA-04
DA-03
DA-01
DA-02
393600
393600
393900
393900
394200
394200
394500
394500
394800
394800
395100
395100
3305
800
3305
800
3306
000
3306
000
3306
200
3306
200
3306
400
3306
400
3306
600
3306
600
PV-13
D-hole for FIOld D-holes
FI: Fluid inclusions
0 150 30075(meters)
N
W
S
E
Fault
Figure 2: Location map of drill holes (red circles refer to locations of drill holes that were sampled).
LV
30 micrometer
(a)
LVHS inclusion
30 micrometer
Secondary fluid
inclusions
(b)
Figure 3: Photomicrographs of different inclusion types within mineralized quartz vein.
were restricted to fluid inclusions in coarse-grained quartz ofearly mineralized veins.
Fluid inclusions were classified into three main typesbased on the number, nature, and proportion of phases atroom temperature. The following types of fluid inclusionshave been identified (Figure 3). (1) Liquid vapor (LV) inclu-sions consist of liquid + vapor ± solid phases with the liquidphase volumetrically dominant. These fluid inclusions are
common in all mineralized quartz veins and are abundantin Groups II and III veins. (2) Vapor liquid (VL) inclusionsalso contain vapor + liquid ± solid phases. These inclusionsmainly homogenize to vapor, and rarely to liquid, or by Crit-ical Homogenization. (3) Liquid vapor halite solid (LVHS)inclusions are multiphase and consist of liquid + vapor +halite + other solids. Based on the number and type of thesolids, this type of inclusions is further classified into three

ISRN Geology 5
0
5
10
15
20Fr
eque
ncy
LV (s)
VL (s)VL (p)
VL (ps)
LVHS (p)LVHS (ps)
LVHS (s)
Homogenization temperature ( ∘C)180 240 300 360 420 480 540 600
(a) Group I
0
5
10
15
20
Freq
uenc
y
LV (p)
LV (ps)
LV (s)VL (p)
VL (ps)
VL (s)LVHS (p)
LVHS (ps)
LVHS (s)
180 240 300 360 420 480 540 600Homogenization temperature ( ∘C)
(b) Group II
0
5
10
15
20
Freq
uenc
y
LVHS (s)
LVHS (ps)
LVHS (p)
VL (p)LV (s)
LV (ps)
LV (p)
180 240 300 360 420 480 540 600Homogenization temperature ( ∘C)
(c) Group III
Figure 4: Histograms of homogenization temperatures for LV, VL, and LVHS fluid inclusions frommineralized quartz veins (p: primary, ps:pseudosecondary, and s: secondary).
subtypes. Subtype LVHS1inclusions are characterized by
the presence of halite + chalcopyrite ± anhydrite ± K-Fe-Cl phase. Halite, anhydrite, and chalcopyrite have consistentphase ratios and are interpreted to be daughter minerals.Vapor bubbles occupy <25% of the inclusions by volume.Subtype LVHS
2inclusions contain sylvite in addition to the
phases in LVHS1inclusions. The solid phases occupy 60%
of inclusion volumes, and the vapor bubbles cccupy 20% ofinclusion volumes. Subtype LVHS
3inclusions contain halite,
which is commonly accompanied by hematite, but do notcontain chalcopyrite, sylvite, or K-Fe-Cl phases. The volumeof the solid phases is typically <40% of the inclusions, andbubble volumes range between 20 and 60%.
5.1. Microthermometric Analysis. The Linkam operating unitwas applied to measure the temperatures of phase changesin fluid inclusions, which operates by passing preheated orprecooled N
2vapor around the sample [20]. Stage calibration
was performed using synthetic and/or well-known fluid
inclusions. Accuracy at the standard reference temperatureswas ±0.2∘C at −56.6∘C (triple point of CO
2), ±0.1∘C at 0∘C
(melting point of ice), ±2∘C at 374.1∘C (critical homoge-nization of H
2O), and ±9∘C at 573∘C (alpha to beta quartz
transition).The heating rate was approximately 1∘C/min nearthe temperatures of phase transitions. Descriptive statistics ofmicrothermometric data in vein groups are shown in Table 1.
5.2. Homogenization Temperatures. LV fluid inclusionshomogenize to liquid 𝑇h(L + V → L) at temperaturesbetween 215∘ and 514∘C, with an average of 297∘C. Most ofVL inclusions homogenize to vapor 𝑇h(V+L → V) between287∘ and 575∘C.
In the halite-bearing inclusions,𝑇s NaCl (the temperatureat which halite dissolves) and 𝑇h(L-V) (temperature of vaporand liquid homogenization) were recorded (Figure 4).
The liquid and vapour phases in LVHS inclusions homog-enize to liquid at temperatures between 211∘ and 487∘C.The liquid-vapour homogenization temperature for LVHS

6 ISRN Geology
Table 1: Descriptive statistics of microthermometric data in veingroups at Darrehzar area.
FItype Statistical parameter 𝑇h 𝑇S NaCL L/V Salinity
LV
Minimum 215 — 1.2 2.01Maximum 514 — 19 16.32Mean 297 — 4.38 8.02
Standard deviation 56.64 — 2.96 3.8
VL
Minimum 287 — 0.11 0.87Maximum 575 — 1 18.55Mean 421 — 0.49 9.36
Standard deviation 67.83 — 0.3 5.2
LVHS
Minimum 211 211 0.47 31.44Maximum 487 510 9 59.86Mean 330 351 3.66 43.21
Standard deviation 65.98 72.19 2 6.74
inclusions is from 215∘ to 350∘C in quartz veins. The halitedissolution temperatures (𝑇s NaCl) for LVHS inclusionsare between 211∘ and 510∘C. Anhydrite and chalcopyritedid not dissolve on heating to temperatures in excess of600∘C. Chalcopyrite was identified on the basis of its opticalcharacteristics (opacity and triangular cross-section) andcomposition in opened inclusions (SEM-EDAX analysesyielded peaks for Cu, Fe, and S). Anhydrite forms transparentanisotropic prisms andwas shown by SEM-EDAX analyses toconsist only of Ca and S (elements lighter than F could not beanalyzed) [21].
5.3. Salinity in the Fluid Inclusions. Halite-bearing and non-halite-bearing liquid-rich inclusions at Darrehzar exhibit awide variation in salinity, ranging from 0.9 to 59.9 wt% NaCl(Figure 5).
LVHS fluid inclusions (high-salinity population) havehigher salinities than LV and VL inclusions (low-salinitypopulation) and clearly separated each other by a salinitygap within the range of 19–31 wt% (Figure 5). Low-salinityinclusions have salinity from 0.9 to 18.6 wt% NaCl andtheir correlation coefficient between the salinity and theirhomogenization temperature is weak (𝑅2 = 0.07). High-salinity inclusions have salinity between 31.4 and 59.9 wt%NaCl and have good correlation coefficient (𝑅2 = 0.7)between the salinity and their homogenization temperature(Figure 6).
6. Stable Isotope Investigation
Samples containing veinlets of sulfides, quartz, and sulfateswere selected for stable isotope analysis.
Oxygen isotope analyses were conducted on the samplesof quartz veins in the potassic, transition, and phyllic alter-ation zones. Quartz grains were separated using both heavyliquid and hand picking methods.
Sulfide (pyrite, chalcopyrite, and molybdenite) and sul-fate (anhydrite) samples were selected for sulfur isotopic
0
10
20
30
40
50
60
70
200 300 400 500 600
Salin
ity (w
t% N
aCl)
Salinity versus homogenization temperature
−10
R2 = 0.0549
Homogenization temperature ( ∘C)
Figure 5: Scatter plot of salinity versus homogenization temperatureshowing two different populations.
analyses. These samples were prepared through crushing,sieving, and hand-picking. S, O isotope analyses were carriedout in the laboratories at Centre for Stable Isotope Researchand Analysis, University of Gottingen, Germany.
6.1. Oxygen Isotopes. The 𝛿18O values of quartz are in rangeof 9% to 10.3 relative to standard mean ocean water (SMOW)with amean of 9.6%. 𝛿18OH
2O values were calculated from the
quartz analyses using the fractionation equation ofMatsuhisaet al. [24].
The range of 𝛿18OH2O valuesis between 6.13% and 7.06%
(Group I veins), 4.92% and 6.25% (Group II veins), and 3.31%and 4.22% (Group III veins) (Figure 7).
The result showed that hydrothermal fluids with defer-ent origin have circulated in three phases, responsible forfluid mineralization. In the first phase, orthomagmatic fluid(𝛿
18O(fluid)𝛿 > 6%) was circulated at system and caused para-
genic mineralization of quartz + k-feldspar + molybdenite +anhydrite ± pyrite ± chalcopyrite which formed Group Iveins.
In the next phase by decreasing temperature and fluidcooling up to 350∘C, meteoric water flowed inward system(𝛿18O
(fluid) ∼ 5% to 6%) and formedGroup II veins consistingof quartz + chalcopyrite ± pyrite ± bornite ± molybdenite.Phyllic alteration resulted from invasion of mixed meteoricwaters with decreasing temperature of the system.
In the last phase, the hydrothermal system changed frommagmatic to meteoric water and caused porphyry stockalteration (𝛿18O
(fluid) < 4.5%). Based on fluid inclusionstudy and calculation of the isotopic composition of ore-forming fluid with decreasing of temperature up to 300∘C,ore- forming fluid with properties close to themeteoric watercaused paragenic mineralization of quartz + pyrite + calcite +chalcopyrite ± anhydrite and made Group III veins.
6.2. Sulfur Isotopes. Sulfur isotopic analyses were performedon pyrite, anhydrite, chalcopyrite, and molybdenite samplesseparated from Groups I, II, and III veins. The eight pyritesamples analyzed have 𝛿34S values between −3.1% and −0.4%,

ISRN Geology 7
0
5
10
15
20
200 300 400 500 600
Salin
ity (w
t% N
aCl)
Low salinity versus homogenization temperature
R2 = 0.0716
Homogenization temperature (∘C)
(a)
25
35
45
55
65
200 300 400 500
Salin
ity (w
t% N
aCl)
High salinity versus homogenization temperature
R2 = 0.71
Homogenization temperature ( ∘C)
(b)
Figure 6: (a) Weak correlation coefficient between the salinity and their homogenization temperature in low-salinity population. (b) Goodcorrelation coefficient between the salinity and their homogenization temperature in high-salinity inclusions.
7.06
6.25
4.22
6.13
4.92
3.31
2
3
4
5
6
7
8
∗Calculated from Matsuhisa et al.'s equationGroup I∗ Group II∗ Group III∗
𝛿18O
H2
O
Figure 7: Oxygen isotope results of the mineralized group quartzveins.
the three chalcopyrite samples have 𝛿34S values of −1.8% to−1.3%, the twomolybdenite samples have 𝛿34S values rangingfrom −1.8% to −0.7%, and the eleven anhydrite samples have𝛿
34S values from 10.3% to 11.7%.The 𝛿34S values of the anhydrite are approximately
constant and heavier than those of associated or coexistingsulfides. One of two samples of molybdenite is enriched with𝛿
34S relative to pyrite and pyrite in turn is similarly enrichedwith 𝛿34S relative to chalcopyrite. These isotopic trends areconsistent with isotope equilibrium theory and sulfur-isotopefractionation trends [25].
7. Discussion
Themaximum pressure of fluid entrapment can be calculatedfrom the estimated thickness of the overlying rock column atthe time of intrusion. The latter represents 1500m to 2000mof volcanic, volcanic-clastic, and volcanic sedimentary com-plexes. This corresponds to a lithostatic pressure of 450 to
500 bars, assuming an average rock density of 2.7 g/cm3 anda hydrostatic pressure of 150 to 200 bars, assuming a fluiddensity near 1 g/cm3.
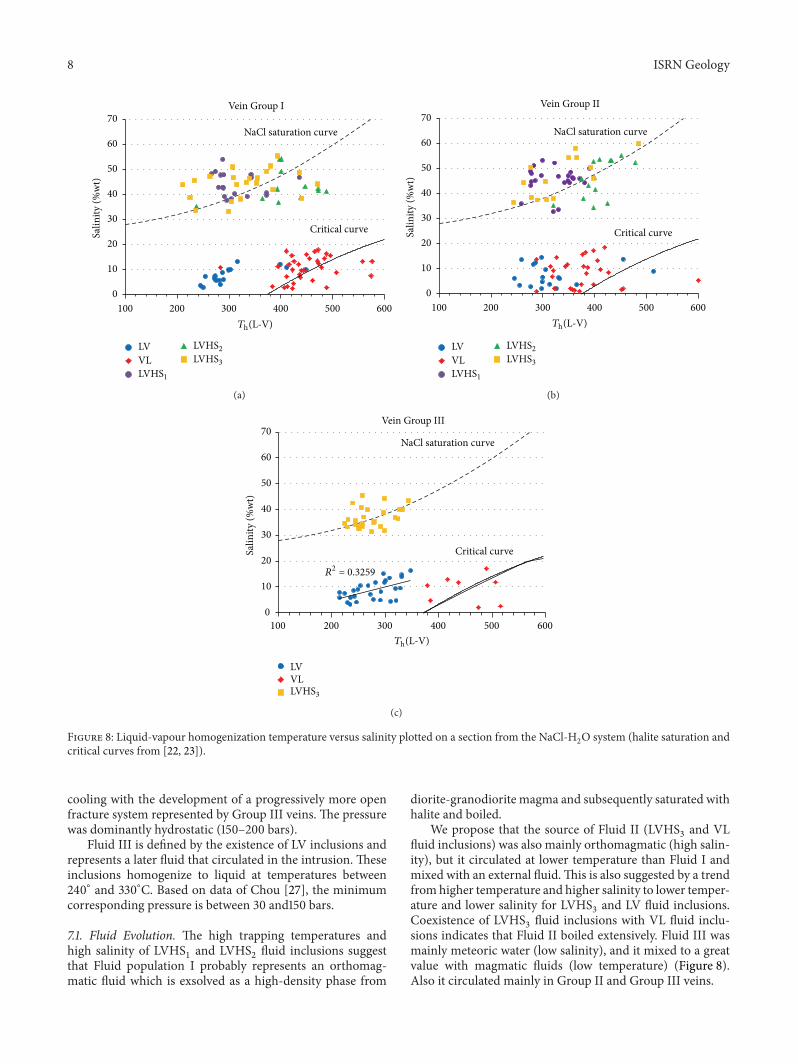
LVHS2fluid inclusions occur with VL inclusions in
Group I quartz veins associated with potassic alteration,defining fluid population I. The homogenization tempera-tures for type LVHS
2inclusions (𝑇h(L-V) > 𝑇s NaCl) vary
between 330∘ and ∼500∘C and for coexisting VL inclusionsvary between 400∘ and 500∘C (Figure 8).
At these temperatures, the maximum pressure for thecoexistence of these two fluid inclusion types (bubble pointcurve) is approximately 300 to 400 bars. On the other hand,the existence of LVHS fluid inclusions with 𝑇s NaCl > 𝑇h(L-V) implies that pressure was locally or temporarily muchhigher. In fact, pressures estimated for those inclusions (fluidpressure) range up to 800 bars which is excessive lithostaticpressure (as already discussed, the lithostatic pressure was450 to 500 bars) and that pressure generally oscillatedbetween 150 to 200 bars (hydrostatic) and >500 bars inresponse to repeated cracking and sealing of the rock at450∘C. So pressure during the trapping of fluid populationI varied from 150–200 to >500 bars and temperature was∼450∘C.
Fluid II is defined by the coexistence of LVHS3and
VL inclusions. In Groups I and II veins, LVHS3inclusions
homogenize by vapor disappearance after halite dissolutionat a modal temperature of 350∘C. Based on data fromSourirajan and Kennedy [26] and Chou [27] for the NaCl-H2O system, the corresponding fluid pressure was ∼200
bars. VL inclusions homogenize to a vapor at between 380∘and 520∘C; that is, at significantly higher temperatures thanLVHS
3inclusions, those of they could indicate heterogeneous
entrapment of liquid and vapor during boiling. In GroupIII veins, the LVHS
3inclusions homogenize at temperatures
<300∘C by both vapor disappearance and halite dissolution.Fluid II was thus trapped at considerably lower temper-
atures than fluid I (350∘ versus 350–500∘C) and underwent
8 ISRN Geology
NaCl saturation curve
Critical curve
Vein Group I
0
10
20
30
40
50
60
70
100 200 300 400 500 600
Salin
ity (%
wt)
LVVLLVHS1
LVHS2LVHS3
Th(L-V)
(a)
0
10
20
30
40
50
60
70
100 200 300 400 500 600
Vein Group II
Salin
ity (%
wt)
NaCl saturation curve
Critical curve
LVVLLVHS1
LVHS2LVHS3
Th(L-V)
(b)
0
10
20
30
40
50
60
70
100 200 300 400 500 600
Salin
ity (%
wt)
Vein Group III
NaCl saturation curve
Critical curve
R2 = 0.3259
LVVLLVHS3
Th(L-V)
(c)
Figure 8: Liquid-vapour homogenization temperature versus salinity plotted on a section from the NaCl-H2O system (halite saturation and
critical curves from [22, 23]).
cooling with the development of a progressively more openfracture system represented by Group III veins. The pressurewas dominantly hydrostatic (150–200 bars).
Fluid III is defined by the existence of LV inclusions andrepresents a later fluid that circulated in the intrusion. Theseinclusions homogenize to liquid at temperatures between240∘ and 330∘C. Based on data of Chou [27], the minimumcorresponding pressure is between 30 and150 bars.
7.1. Fluid Evolution. The high trapping temperatures andhigh salinity of LVHS
1and LVHS
2fluid inclusions suggest
that Fluid population I probably represents an orthomag-matic fluid which is exsolved as a high-density phase from
diorite-granodiorite magma and subsequently saturated withhalite and boiled.
We propose that the source of Fluid II (LVHS3and VL
fluid inclusions) was also mainly orthomagmatic (high salin-ity), but it circulated at lower temperature than Fluid I andmixed with an external fluid.This is also suggested by a trendfromhigher temperature and higher salinity to lower temper-ature and lower salinity for LVHS
3and LV fluid inclusions.
Coexistence of LVHS3fluid inclusions with VL fluid inclu-
sions indicates that Fluid II boiled extensively. Fluid III wasmainly meteoric water (low salinity), and it mixed to a greatvalue with magmatic fluids (low temperature) (Figure 8).Also it circulated mainly in Group II and Group III veins.

ISRN Geology 9
8. Conclusions
The multiple intrusions of microdiorite to diorite and gra-nodiorite rocks at Darrehzar indicate a long-lived intrusiveepisode associated with repeated fracturing and hydrother-mal activity. Fluid inclusion and isotopic analyses fromthe deposit indicate three distinct hydrothermal fluids. Thefirst hydrothermal was characterized by high temperatures,high salinities, and 𝛿18O
(fluid)𝛿 > 6%. The presence ofmolybdenite and anhydrite inGroup I veins, chalcopyrite andanhydrite in Group II veins, and chalcopyrite and anhydritein LVHS
1and LVHS
2inclusions from vein Groups I and II
suggests that Fluid I was responsible for the transport andeventual deposition of Fe, Cu, Mo, and S. Fluid population Icould indicate an orthomagmatic fluid which is subsequentlysaturated with halite and boiled. The second hydrothermalfluid (Fluid II) was formedmainly by mixing magmatic fluid,at moderate-to-high temperature, and 𝛿18O
(fluid)𝛿 ∼ 5 to 6%.This fluid was responsible for sericitic alteration zones in theupper portion of the stock.
The third hydrothermal fluid (Fluid III) consisted of lowtemperature, low-to-moderate salinity, and 𝛿18O
(fluid)𝛿 <4.5%. This fluid was responsible for peripheral propyliticalteration. The circulation of Fluid III, which did not pene-trate into the hotter and most central part of the intrusion,caused this alteration zone. This fluid also caused somedistribution of argillic alteration, in which almost all thefeldspars were altered to kaolinite and other clay minerals.
These three interpreted hydrothermal fluids correspondto three different populations of fluid inclusions in Darrehzarveins.
Fluid III formed by progressive dilution of magmaticfluid with a great volume of meteoric waters. Incursion ofdilute meteoric fluids into the permeable stockwork systemincreased Na/K ratios and caused the remobilization redepo-sition of previously precipitated copper sulfides in fracturedzones through acidification and oxidation.
Conflict of Interests
B. Alizadeh Sevari and A. Hezarkhani, as the authors of thepaper, have no direct financial relation that might lead to aconflict of interests for any of them.
References
[1] C. W. Burnham, “Magmas and hydrothermal fluids,” in Geo-chemistry of Hydrothermal Ore Deposits, H. L. Barnes, Ed., pp.71–136, Jon Wiley & Sons, 1979.
[2] T. Ulrich, D. Gunther, and C. A. Heinrich, “The evolution of aporphyry Cu-Au deposit, based on LA-ICP-MS analysis of fluidinclusions: bajo de la alumbrera, Argentina,” Economic Geology,vol. 96, no. 8, pp. 1743–1774, 2001.
[3] R. H. Sillitoe, “Porphyry copper systems,” Economic Geology,vol. 105, no. 1, pp. 3–41, 2010.
[4] R. H. Sillitoe, “Characteristics and controls of the largestporphyry copper-gold and epithermal gold deposits in thecircum-pacific region,”Australian Journal of Earth Sciences, vol.44, no. 3, pp. 373–388, 1997.
[5] J. W. Hedenquist and J. P. Richards, “The influence of geo-chemical techniques on the development of genetic models forporphyry copper deposits,” in Techniques in Hydrothermal OreDeposits Geology, J. P. Richards and P. B. Larson, Eds., vol. 10,pp. 235–256, 1998.
[6] J. Stocklin and A. Setudenia, Lexique Stratigraphique Interna-tional, vol. 3, ASIE, Centre National de la Recherche Scien-tifique, Quai Anatole, France, 1972.
[7] J. O. Stocklin, Structural Correlation of the Alpine RangesBetween Iran and Central Asia, Memoire Hors Serie, SocieteGeologique de France, Paris, France, 1977.
[8] M. Berberian, “An explanatory note on the first seismotectonicmap of Iran, a seismotectonic review of the country,” Report 39,In Geological Survey of Iran, pp.7–142, 1976.
[9] M. Berberian, “The southern caspian: a compressional depres-sion floored by a trapped, modified oceanic crust,” CanadianJournal of Earth Sciences, vol. 20, no. 2, pp. 163–183, 1983.
[10] M. Berberian and G. C. King, “Towards a paleogeography andtectonic evolution of Iran,” Canadian Journal of Earth Sciences,vol. 18, no. 2, pp. 210–265, 1981.
[11] F. Pourhosseini, Petrogenesis of Iranian Plutons: A Study ofthe Natanz and Bazman Intrusive Complexes [Ph.D. thesis],University of Cambridge, 1981.
[12] R. Derakhshani and M. Abdolzadeh, “Geochemistry, miner-alization and alteration zones of darrehzar porphyry copperdeposit, Kerman, Iran,” Journal of Applied Sciences, vol. 9, no.9, pp. 1628–1646, 2009.
[13] B. Grujicic and S. Volickovic, “Copper Deposit darrehzarmineral inventories computation,” Internal Report 27, NationalIranian Copper Industries, Exploration Department, 1991.
[14] M. Maanijou, Alteration halos and their connection to miner-alization of darrehzar porphyry Cu deposit and its geochemicalzoning, Pariz area, Kerman, Iran [M.S. thesis], Shahid BeheshtiUniversity, Tehran, Iran, 1993.
[15] H. Ranjbar, H. Hassanzadeh, M. Torabi, and O. Ilaghi, “Integra-tion and analysis of airborne geophysical data of the DarrehzarArea, KermanProvince, Iran, using principal component analy-sis,” Journal of Applied Geophysics, vol. 48, no. 1, pp. 33–41, 2001.
[16] H. Etminan, “Etminan The discovery of porphyry copper-molybdenum mineralization adjacent to Sungun village in thenorthwest of Ahar and a proposed program for its detailedexploration,” Confidential Report, Iran, Geological Report,Geological Survey of Iran, 1977.
[17] J. Shahabpour, Aspects of alteration and mineralization at theSar-Cheshmeh copper-molybdenumdeposit, Kerman, Iran [Ph.D.thesis], Leeds University, 1982.
[18] A. Hezarkhani, “Hydrothermal evolution of the sar-cheshmehporphyry Cu-Mo deposit, Iran: evidence from fluid inclusions,”Journal of Asian Earth Sciences, vol. 28, no. 4–6, pp. 409–422,2006.
[19] L. B. Gustafson and J. P. Hunt, “The porphyry copper deposit atEl Salvador, Chile,”EconomicGeology, vol. 70, no. 5, pp. 857–912,1975.
[20] J. Were, R. J. Bodnar, and P. B. Barton, “A novel gas-flowfluid inclusion heating-freezing stage,” Geological Society ofAmerica, Abstracts and Programs 11, 539, 1979.
[21] A. Hezarkhani, A. E. Williams-Jones, and C. H. Gammons,“Factors controlling copper solubility and chalcopyrite deposi-tion in the Sungun porphyry copper deposit, Iran,”MineraliumDeposita, vol. 34, no. 8, pp. 770–783, 1999.

10 ISRN Geology
[22] R. J. Bodnar, “Introduction to aqueous fluid systems,” in FluidInclusions: Analysis and Interpretation, I. Samson, A. Anderson,and D. Marshall, Eds., pp. 81–99, Mineralogical Association ofCanada, Quebec, Canada, 2003.
[23] E. Roedder, “Introduction to fluid inclusions,” Reviews inMineralogy, vol. 12, p. 644, 1984.
[24] Y. Matsuhisa, J. R. Goldsmith, and R. N. Clayton, “Oxygenisotopic fractionation in the system quartz-albite-anorthite-water,”Geochimica et Cosmochimica Acta, vol. 43, no. 7, pp. 1131–1140, 1979.
[25] H. Ohmoto andM. B. Goldhaber, “Sulfur and carbon isotopes,”in Geochemistry of Hydrothermal Ore Deposits, H. L. Barnes,Ed., pp. 517–611, JohnWiley and Sons, New York, NY,USA, 1997.
[26] S. Sourirajan and G. C. Kennedy, “The system H2O–NaCl at
elevated temperatures and pressures,” The American Journal ofScience, no. 260, pp. 115–141, 1962.
[27] I.-M. Chou, “Phase relations in the system NaCl-KCl-H2O.
III: solubilities of halite in vapor-saturated liquids above 445∘Cand redetermination of phase equilibrium properties in thesystem NaCl-H
2O to 1000∘C and 1500 bars,” Geochimica et
Cosmochimica Acta, vol. 51, no. 7, pp. 1965–1975, 1987.

Submit your manuscripts athttp://www.hindawi.com
Hindawi Publishing Corporationhttp://www.hindawi.com Volume 2014
ClimatologyJournal of
EcologyInternational Journal of
Hindawi Publishing Corporationhttp://www.hindawi.com Volume 2014
EarthquakesJournal of
Hindawi Publishing Corporationhttp://www.hindawi.com Volume 2014
Hindawi Publishing Corporationhttp://www.hindawi.com
Applied &EnvironmentalSoil Science
Volume 2014
Mining
Hindawi Publishing Corporationhttp://www.hindawi.com Volume 2014
Journal of
Hindawi Publishing Corporation http://www.hindawi.com Volume 2014
International Journal of
Geophysics
OceanographyInternational Journal of
Hindawi Publishing Corporationhttp://www.hindawi.com Volume 2014
Journal of Computational Environmental SciencesHindawi Publishing Corporationhttp://www.hindawi.com Volume 2014
Journal ofPetroleum Engineering
Hindawi Publishing Corporationhttp://www.hindawi.com Volume 2014
GeochemistryHindawi Publishing Corporationhttp://www.hindawi.com Volume 2014
Journal of
Atmospheric SciencesInternational Journal of
Hindawi Publishing Corporationhttp://www.hindawi.com Volume 2014
OceanographyHindawi Publishing Corporationhttp://www.hindawi.com Volume 2014
Advances in
Hindawi Publishing Corporationhttp://www.hindawi.com Volume 2014
MineralogyInternational Journal of
Hindawi Publishing Corporationhttp://www.hindawi.com Volume 2014
MeteorologyAdvances in
The Scientific World JournalHindawi Publishing Corporation http://www.hindawi.com Volume 2014
Paleontology JournalHindawi Publishing Corporationhttp://www.hindawi.com Volume 2014
ScientificaHindawi Publishing Corporationhttp://www.hindawi.com Volume 2014
Hindawi Publishing Corporationhttp://www.hindawi.com Volume 2014
Geological ResearchJournal of
Hindawi Publishing Corporationhttp://www.hindawi.com Volume 2014
Geology Advances in


![Indigenous Enhanced Mineralization Pyrene, Benzo[a]pyrene ...Indigenous soil microorganism mineralization experiments. All of the mineralization experiments were performed by using](https://img.dokumen.tips/doc/110x75/5e7c41b0b7c4ef64181e5e16/indigenous-enhanced-mineralization-pyrene-benzoapyrene-indigenous-soil-microorganism.jpg)


