Embed Size (px)
Citation preview

Research ArticleFactors Driving Readmissions in Tibia and Femur Fractures
Alexander Chern, Sarah E. Greenberg, Rachel V. Thakore, Vasanth Sathiyakumar,William T. Obremskey, and Manish K. Sethi
The Vanderbilt Orthopaedic Institute Center for Health Policy, Vanderbilt University, 1215 21st Avenue S., MCE,South Tower, Suite 4200, Nashville, TN 37232, USA
Correspondence should be addressed to Manish K. Sethi; [email protected]
Received 31 July 2014; Accepted 25 February 2015
Academic Editor: Rene C. Verdonk
Copyright © 2015 Alexander Chern et al. This is an open access article distributed under the Creative Commons AttributionLicense, which permits unrestricted use, distribution, and reproduction in any medium, provided the original work is properlycited.
As the American healthcare system shifts towards bundled payments, readmissions will become a measure of healthcare quality.The purpose of this study was to characterize readmission trends and factors influencing readmission in patients with diaphysealfemur and tibia fractures. Through a retrospective chart review, all patients who presented to a level 1 trauma center from 2004 to2006 were evaluated. By using current procedural terminology codes, 1,040 patients with diaphyseal tibia or femur fractures fixedby IMNwere identified. 645 patients were included for analysis. 30-day, 60-day, and 90-day readmission rates were compared withfracture type, reason for readmission, and basic demographic information. The 60-day readmission rate for open tibia fractures(14.8%) was significantly higher than the 60-day readmission rate for closed tibia fractures (8.0%) (𝑝 = 0.037). When comparingreasons for 60-day readmissions, 50% of closed fractures were readmitted due to infection, while the other 50% needed additionalsurgery. 91.7% of open fractures readmitted in 60 days were due to infection. In a bundled payment system, orthopedic traumamust gain insight into drivers of readmission to identify those at risk for readmission and design effective healthcare plans for thesepatients.
1. Introduction
A significant portion of healthcare costs stem from hospitalreadmissions. With nearly one in five Medicare patientsreturning to the hospital within a month of discharge, theUnited States Government considers patient readmissionsa serious problem in an expensive and inefficient health-care system. The Medicare Payment Advisory Commission(MedPAC) estimates that 12% of Medicare patients arereadmitted for potentially avoidable reasons [1]. Nearly 2million Medicare patients are readmitted within 30 days ofrelease annually, costing Medicare $17.5 billion in additionalhospital bills. Since hospital readmissions reflect hospital carequality and account for billions of dollars in annual Medicarecosts, reducing readmissions among Medicare beneficiarieshas become a key priority for physicians [1].
To combat these unnecessary rehospitalizations, CMShas started to levy a maximum penalty of 1% of Medicarepayments to hospitals for excessive readmissions for patientswith heart failure, heart attack, and pneumonia [1]. In fiscal
year 2015, this list will be expanded to at least four addi-tional conditions, including chronic obstructive pulmonarydisease, coronary artery bypass graft surgery, percutaneoustransluminal coronary angioplasty, and other conditions thegovernment deems appropriate [1]. With CMS’s institution ofepisode-based payment, hospitals must also assume the costsfor all care provided up to 30 days after discharge, includingall readmissions occurring in that time [2]. Moreover, opera-tive management of fractures contributes significantly to sur-gical expenses, with musculoskeletal conditions accountingfor approximately $510 billion in treatment costs per year [3–5]. One study by Nacke et al. found that 30-day readmissionrates are as high as 80.4% for orthopedic spine fractures and58.3% for total joint arthroplasty, while another study byHahnel et al. demonstrated a 3-month readmission rate of19.0% for operative hip fractures [6, 7].
As the US healthcare system shifts toward new poli-cies that no longer reimburse hospitals for perioperativereadmission and even penalize hospitals for unnecessaryreadmission, it is important for orthopedic trauma surgeons
Hindawi Publishing CorporationAdvances in OrthopedicsVolume 2015, Article ID 974543, 6 pageshttp://dx.doi.org/10.1155/2015/974543

2 Advances in Orthopedics
Table 1: Demographic information for patients with tibia and femur fractures.
Tibia (closed) Tibia (open) Tibia (total) Femur (closed) Femur (open) Femur (total)Average age (y) 38.1 34.3 36.1 33.83 31.98 33.37Gender 𝑛 (%)
Male 56 (74.7) 71 (87.7) 127 (81.4) 267 (72.8) 97 (79.5) 367 (74.4)Female 19 (25.3) 10 (12.3) 29 (18.6) 100 (27.2) 25 (20.5) 125 (25.6)
Average initial length of stay (d) 2.66 3.05 2.86 6.0 4.19 5.55Gustilo grade 𝑛 (%)
1
N/A
15 (18.5)
N/A N/A
38 (31.1)
N/A2 37 (45.7) 43 (35.2)3 29 (35.8) 41 (33.6)4 0 (0.0) 05 0 (0.0) 0
ASA class 𝑛 (%)1 18 (24.0) 15 (18.5) 33 (21.2) 32 (8.7) 9 (7.4) 41 (8.4)2 48 (64.0) 57 (70.4) 105 (67.3) 218 (59.4) 71 (58.2) 289 (59.1)3 8 (10.7) 8 (9.9) 16 (10.3) 96 (26.2) 31 (25.4) 127 (26.0)4 1 (1.3) 1 (1.2) 2 (1.2) 21 (5.72) 11 (9.0) 32 (6.5)5 0 (0.0) 0 (0.0) 0 (0.0) 0 (0) 0 (0.0) 0 (0.0)
Race 𝑛 (%)African American 11 (14.7) 19 (23.5) 30 (19.2) 70 (19.1) 19 (15.6) 89 (18.2)American Indian 0 (0.0) 0 (0.0) 0 (0.0) 0 (0.0) 1 (0.8) 1 (0.2)Asian 0 (0.0) 0 (0.0) 0 (0.0) 3 (0.8) 1 (0.8) 4 (0.8)Caucasian 59 (78.7) 56 (69.1) 115 (73.7) 263 (71.7) 92 (75.4) 355 (72.6)Hispanic 3 (4.0) 4 (4.9) 7 (4.5) 12 (3.3) 5 (4.1) 17 (3.5)Unknown 2 (2.7) 2 (2.5) 4 (2.6) 19 (5.2) 4 (3.3) 23 (4.7)
to develop tools to assess the risk of postoperative read-mission for both optimizing patient safety and minimizingcosts. Readmissions following orthopedic procedures arean important factor in evaluating the cost-effectiveness ofthese procedures, and establishing a system to reduce riskof readmission has already been shown to be successfulin reducing costs for the healthcare system [8, 9]. Withan increasing emphasis on reducing healthcare costs bypredicting readmission rates and creating an appropriatehealthcare plan for the patient, it is critical to gain insight intothe readmission trends of different fractures.
In this study, we investigate the postoperative readmis-sion trends for tibia and femur fractures and explore thefactors influencing readmission.
2. Methods
After receiving IRB approval, all patients who presentedto a level I trauma center from Jan. 1, 2004, to Dec. 31,2006, with a diaphyseal tibia or femur fracture fixed byIMN were identified using CPT codes and the institution’sorthopaedic database. A total of 1,040 patients were iden-tified. Patient charts were reviewed to identify and selectisolated cases where there was only a single fracture thatrequired operative fixation with no other organ injury (𝑛 =645), while patients with multiple injuries were excludedfrom the study. The charts of the selected 645 patients with
isolated fractures were reviewed for readmission informationand basic demographic information, including age, gender,initial length of stay, and fracture type (open versus closed).Readmission information included reason for readmissionand whether or not the patient was readmitted within 0 to30 days, 0 to 60 days, or 0 to 90 days after initial dischargefrom the hospital. Only rehospitalizations related to theoriginal surgery were included for this study. Patients weregrouped into fracture type (tibia or femur) and were furthercategorized by whether the fracture was open or closed.Readmitted patients were also grouped into the followingreadmission categories: postoperative infection (either forincision and drainage or antibiotics), postoperative surgicalrevision (for removal of hardware, nonunion, or revision),and nonoperative medical conditions (UTIs, PNAs, hypoten-sion, anemia, etc.). Amultivariate analysis controlling for age,gender, race, and ASA score was performed to determine ifthere is a statistically significant difference in 30-, 60-, and90-day readmission rates for open and closed fractureswithineach type of fracture (tibia or femur). To calculate 𝑝-values,𝑡-tests were used due to large sample sizes.
3. Results
There were 645 selected patients, 489 with femur fractures(367 closed versus 122 open) and 156 with tibia fractures (75closed versus 81 open). Demographic information for thesegroups is shown in Table 1.
Advances in Orthopedics 3
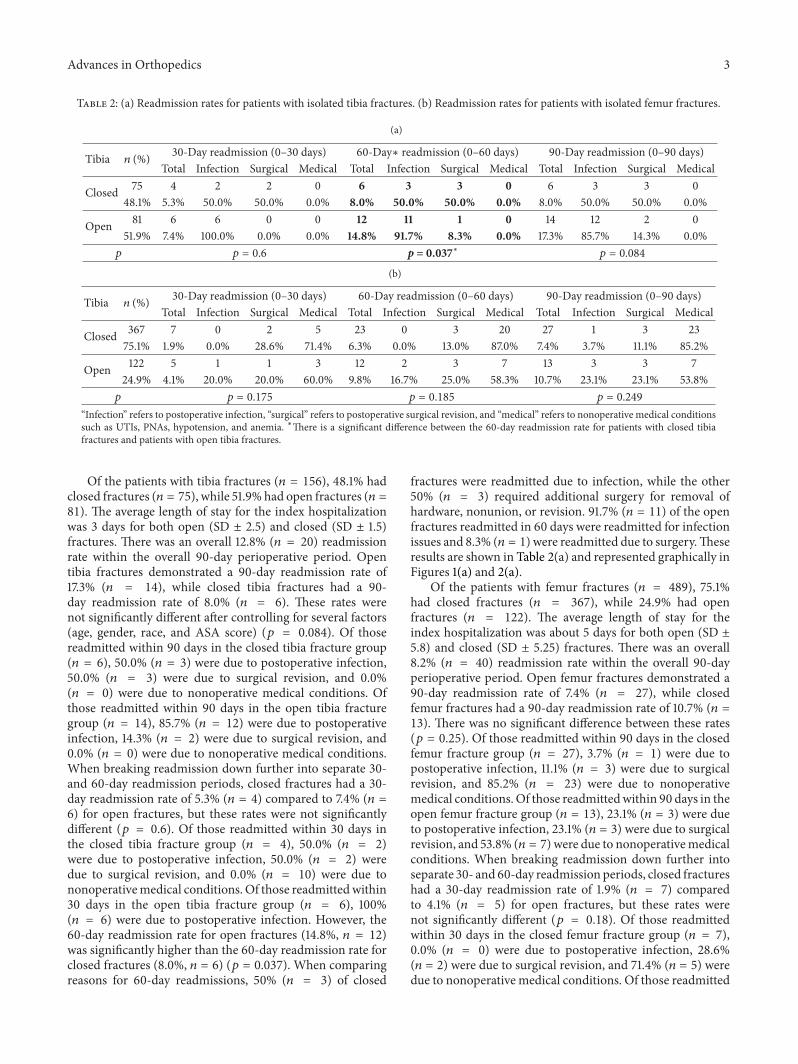
Table 2: (a) Readmission rates for patients with isolated tibia fractures. (b) Readmission rates for patients with isolated femur fractures.
(a)
Tibia 𝑛 (%) 30-Day readmission (0–30 days) 60-Day∗ readmission (0–60 days) 90-Day readmission (0–90 days)Total Infection Surgical Medical Total Infection Surgical Medical Total Infection Surgical Medical
Closed 75 4 2 2 0 6 3 3 0 6 3 3 048.1% 5.3% 50.0% 50.0% 0.0% 8.0% 50.0% 50.0% 0.0% 8.0% 50.0% 50.0% 0.0%
Open 81 6 6 0 0 12 11 1 0 14 12 2 051.9% 7.4% 100.0% 0.0% 0.0% 14.8% 91.7% 8.3% 0.0% 17.3% 85.7% 14.3% 0.0%𝑝 𝑝 = 0.6 p = 0.037∗ 𝑝 = 0.084
(b)
Tibia 𝑛 (%) 30-Day readmission (0–30 days) 60-Day readmission (0–60 days) 90-Day readmission (0–90 days)Total Infection Surgical Medical Total Infection Surgical Medical Total Infection Surgical Medical
Closed 367 7 0 2 5 23 0 3 20 27 1 3 2375.1% 1.9% 0.0% 28.6% 71.4% 6.3% 0.0% 13.0% 87.0% 7.4% 3.7% 11.1% 85.2%
Open 122 5 1 1 3 12 2 3 7 13 3 3 724.9% 4.1% 20.0% 20.0% 60.0% 9.8% 16.7% 25.0% 58.3% 10.7% 23.1% 23.1% 53.8%𝑝 𝑝 = 0.175 𝑝 = 0.185 𝑝 = 0.249
“Infection” refers to postoperative infection, “surgical” refers to postoperative surgical revision, and “medical” refers to nonoperative medical conditionssuch as UTIs, PNAs, hypotension, and anemia. ∗There is a significant difference between the 60-day readmission rate for patients with closed tibiafractures and patients with open tibia fractures.
Of the patients with tibia fractures (𝑛 = 156), 48.1% hadclosed fractures (𝑛 = 75), while 51.9% had open fractures (𝑛 =81). The average length of stay for the index hospitalizationwas 3 days for both open (SD ± 2.5) and closed (SD ± 1.5)fractures. There was an overall 12.8% (𝑛 = 20) readmissionrate within the overall 90-day perioperative period. Opentibia fractures demonstrated a 90-day readmission rate of17.3% (𝑛 = 14), while closed tibia fractures had a 90-day readmission rate of 8.0% (𝑛 = 6). These rates werenot significantly different after controlling for several factors(age, gender, race, and ASA score) (𝑝 = 0.084). Of thosereadmitted within 90 days in the closed tibia fracture group(𝑛 = 6), 50.0% (𝑛 = 3) were due to postoperative infection,50.0% (𝑛 = 3) were due to surgical revision, and 0.0%(𝑛 = 0) were due to nonoperative medical conditions. Ofthose readmitted within 90 days in the open tibia fracturegroup (𝑛 = 14), 85.7% (𝑛 = 12) were due to postoperativeinfection, 14.3% (𝑛 = 2) were due to surgical revision, and0.0% (𝑛 = 0) were due to nonoperative medical conditions.When breaking readmission down further into separate 30-and 60-day readmission periods, closed fractures had a 30-day readmission rate of 5.3% (𝑛 = 4) compared to 7.4% (𝑛 =6) for open fractures, but these rates were not significantlydifferent (𝑝 = 0.6). Of those readmitted within 30 days inthe closed tibia fracture group (𝑛 = 4), 50.0% (𝑛 = 2)were due to postoperative infection, 50.0% (𝑛 = 2) weredue to surgical revision, and 0.0% (𝑛 = 10) were due tononoperativemedical conditions. Of those readmittedwithin30 days in the open tibia fracture group (𝑛 = 6), 100%(𝑛 = 6) were due to postoperative infection. However, the60-day readmission rate for open fractures (14.8%, 𝑛 = 12)was significantly higher than the 60-day readmission rate forclosed fractures (8.0%, 𝑛 = 6) (𝑝 = 0.037). When comparingreasons for 60-day readmissions, 50% (𝑛 = 3) of closed
fractures were readmitted due to infection, while the other50% (𝑛 = 3) required additional surgery for removal ofhardware, nonunion, or revision. 91.7% (𝑛 = 11) of the openfractures readmitted in 60 days were readmitted for infectionissues and 8.3% (𝑛 = 1) were readmitted due to surgery.Theseresults are shown in Table 2(a) and represented graphically inFigures 1(a) and 2(a).
Of the patients with femur fractures (𝑛 = 489), 75.1%had closed fractures (𝑛 = 367), while 24.9% had openfractures (𝑛 = 122). The average length of stay for theindex hospitalization was about 5 days for both open (SD ±5.8) and closed (SD ± 5.25) fractures. There was an overall8.2% (𝑛 = 40) readmission rate within the overall 90-dayperioperative period. Open femur fractures demonstrated a90-day readmission rate of 7.4% (𝑛 = 27), while closedfemur fractures had a 90-day readmission rate of 10.7% (𝑛 =13). There was no significant difference between these rates(𝑝 = 0.25). Of those readmitted within 90 days in the closedfemur fracture group (𝑛 = 27), 3.7% (𝑛 = 1) were due topostoperative infection, 11.1% (𝑛 = 3) were due to surgicalrevision, and 85.2% (𝑛 = 23) were due to nonoperativemedical conditions. Of those readmittedwithin 90 days in theopen femur fracture group (𝑛 = 13), 23.1% (𝑛 = 3) were dueto postoperative infection, 23.1% (𝑛 = 3) were due to surgicalrevision, and 53.8% (𝑛 = 7) were due to nonoperativemedicalconditions. When breaking readmission down further intoseparate 30- and 60-day readmission periods, closed fractureshad a 30-day readmission rate of 1.9% (𝑛 = 7) comparedto 4.1% (𝑛 = 5) for open fractures, but these rates werenot significantly different (𝑝 = 0.18). Of those readmittedwithin 30 days in the closed femur fracture group (𝑛 = 7),0.0% (𝑛 = 0) were due to postoperative infection, 28.6%(𝑛 = 2) were due to surgical revision, and 71.4% (𝑛 = 5) weredue to nonoperative medical conditions. Of those readmitted

4 Advances in Orthopedics
0
2
4
6
8
10
12
14
16
18
20
30 60 90
Readmission period (day)
ClosedOpen
Patie
nts r
eadm
itted
(%)
(a)
0
2
4
6
8
10
12
14
16
18
20
30 60 90
Readmission period (day)
ClosedOpen
Patie
nts r
eadm
itted
(%)
(b)
Figure 1: (a) 30-Day, 60-day, and 90-day readmission rates for isolated diaphyseal tibia fractures. (b) 30-Day, 60-day, and 90-day readmissionrates for isolated diaphyseal femur fractures. Note. All orthopaedic trauma surgery patients who presented with a diaphyseal tibia or femurfracture to VUMC between January 1, 2004, and December 31, 2006, were included in this analysis. (a) compares 30-day, 60-day, and 90-dayreadmission for closed tibia and open tibia fractures. (b) compares 30-day, 60-day, and 90-day readmission for closed femur and open femurfractures.
0
20
40
60
80
100
120
Closed Open Closed Open Closed Open
Readmission period (day)
MedicalSurgical
Infection
30 60 90
(%)
(a)
0
20
40
60
80
100
120
Closed Open Closed Open Closed Open
Readmission period (day)MedicalSurgical
Infection
30 60 90
(%)
(b)
Figure 2: (a) Patients readmitted for isolated diaphyseal open and closed tibia fractures classified by reason for readmission. (b) Patientsreadmitted for isolated diaphyseal open and closed femur fractures classified by reason for readmission.Note. All orthopaedic trauma surgerypatients who presented with a diaphyseal tibia or femur fracture to VUMC between January 1, 2004, and December 31, 2006, were includedin this analysis. Reasons for readmissions were classified as “infection” (postoperative infection), “surgical” (postoperative surgical revision),and “medical” (nonoperative medical conditions such as UTIs, PNAs, hypotension, and anemia).
within 30 days in the open femur fracture group (𝑛 = 5),20.0% (𝑛 = 1) were due to postoperative infection, 20.0%(𝑛 = 1) were due to surgical revision, and 60.0% (𝑛 = 3) weredue to nonoperativemedical conditions. Closed fractures hada 60-day readmission rate of 6.3% (𝑛 = 23), while openfractures had a 60-day readmission rate of 9.8% (𝑛 = 12).However, there was no significant difference between theserates (𝑝 = 1.9). Of those readmitted within 60 days in theclosed femur fracture group (𝑛 = 23), 0.0% (𝑛 = 0) were dueto postoperative infection, 13.0% (𝑛 = 3) were due to surgicalrevision, and 87.0% (𝑛 = 20) were due to nonoperative
medical conditions. Of those readmitted within 60 days inthe open femur fracture group (𝑛 = 12), 16.7% (𝑛 = 2) weredue to postoperative infection, 25.0% (𝑛 = 3) were due tosurgical revision, and 58.3% (𝑛 = 7) were due to nonoperativemedical conditions.These results are shown in Table 2(b) andgraphically in Figures 1(b) and 2(b).
4. Discussion
Open tibia fractures have significantly higher rates of 60-dayreadmission than closed fractures. For 60-day tibia fracture

Advances in Orthopedics 5
readmissions, infection drove the vast majority of readmis-sions for open injuries, while closed injury readmissions wereequally driven by infection and need for surgery. However,the study was unable to establish a significant difference in30-day and 90-day readmission rates for closed and opentibia fractures. In addition, the study was unable to establish asignificant difference in 30-day, 60-day, and 90-day readmis-sion rates for closed and open femur fractures. These resultssuggest that open fractures do not drive readmission forfemur fractures.Themajority of femur fracture readmissionswere driven by nonoperative medical conditions.
In a bundled payment system,where orthopedic surgeonsmay be penalized for readmissions and where readmission isa measure of quality, it is crucial that we have a better under-standing of the drivers of care and readmission. Since hospitalreadmissions are a significant contributor to hospital costs,gaining insight into the readmission trends of different frac-tures can help orthopedic trauma surgeons identify patientsat greatest risk for readmission, allowing for the appropriateallocation of resources to reduce hospital costs and the designof appropriate healthcare plans to maximize patient care.While previous studies have documented complication ratesfor diaphyseal femur and tibia fractures, no study has yetexplored readmission rates for these particular fractures orthe impact of open fractures on readmission. Moreover, thereadmission rates for diaphyseal femur and tibia fractures canbe directly correlated with the new episode-of-care concept,since the study investigated the rate of readmissions within30-, 60-, and 90-day periods following initial discharge.CMS’s institution of episode-based payment mandates thathospitals must assume the costs for all care provided up to30 days after discharge, including readmissions [1].
Additional studies with different approaches in method-ologies and categorization of patient readmission shouldbe used to establish which types of readmission are mostcommon and if other variables can predict a patient’s riskfor being readmitted for these reasons as well. For example,Hahnel et al. divide readmissions following hip fracturesurgery into orthopedic causes, medical causes, surgicalcauses, and rehabilitation failure causes [7]. Being able toidentify specific reasons for readmission will enable hospitalsto further improve allocation of resources to minimizereadmission and hospital costs and maximize patient care[1]. Though we accounted for demographic factors such asage, race, gender, and ASA score in our statistical analyses,theremay be other unidentified covariateswe can include thatmay influence 90-day patient readmission. Additionally, ourstudy did not control for the socioeconomic status of eachpatient, which is found to be a risk factor for trauma injuries[10]. According to Zhou et al., socioeconomic factors, such asunemployment and minimal education, increase the risk ofdeveloping postoperative complications [11].
Future directions include investigating additional frac-ture types, especially common ones such as clavicle and hipfractures, to characterize readmission rates for the variousinjuries seen in orthopedic trauma. Factors besides the openor closed nature of a fracture should be evaluated for theireffect on postoperative readmission. Different classificationsystems, such as the Gustilo Open Fracture Classification
System (see Table 1) and the Muller AO Classification ofFractures, can be useful because injury localization andseverity influence the orthopedic trauma surgeon’s choiceof treatment and the patient’s outcome, which will affectreadmission rates [12].
Our study is the first of its kind to investigate readmissionrates for diaphyseal femur and tibia fractures, as well as theimpact of open fractures on readmission. We demonstratethat open tibia fractures have significantly higher rates of60-day readmission than closed fractures. For 60-day tibiafracture readmissions, infection drove the vast majority ofreadmissions for open injuries, while closed injury readmis-sions were equally driven by infection and need for surgery.We also demonstrated that there is no significant differencein 30-day, 60-day, and 90-day readmission rates for femurfractures, thus suggesting that open fractures do not drivereadmission in femur fractures. Instead, themajority of femurfracture readmissions were driven by nonoperative medicalconditions. As changes to the US healthcare system result ineliminating reimbursements for postoperative readmission,it is crucial for physicians to gain insight into readmissiontrends in order to identify and create tools to predict patientsmost at risk for readmission [1]. This is especially importantin the future bundled payment system where readmissionwill be a measure of quality and where orthopedic surgeonsmay be penalized for readmissions. Moreover, by assessingpatients’ risk for readmission, physicians can both reducethe financial burden that surgical specialties place on hospi-tals and improve healthcare quality by creating appropriatehealthcare plans for patients.
Ethical Approval
This study has approval from the Vanderbilt IRB.
Disclosure
Level of evidence is prognostic, Level III.
Disclaimer
This study used no previously copyrightedmaterials or signedpatient consent forms.
Conflict of Interests
William T. Obremskey has previously consulted for biomet-rics; done expert testimony in legal matters, has a grant fromthe Department of Defense, and has been a BoardMember ofthe OTA and SEFC. For the remaining authors no conflict ofinterests was declared.
References
[1] Medicare Advisory Payment Commission, Report to theCongress: Medicare and the Health Care Delivery System, U.S.House of Representatives, 2013.

6 Advances in Orthopedics
[2] H. Lamberts and I. Hofmans-Okkes, “Episode of care: a coreconcept in family practice,” Journal of Family Practice, vol. 42,no. 2, pp. 161–167, 1996.
[3] J. Jacobs, G. Anderson, J. Bell et al.,TheBurden of Musculoskele-tal Diseases in the United States, Bone and Joint Decade, 2008.
[4] R. Burge, B. Dawson-Hughes, D. H. Solomon, J. B. Wong, A.King, and A. Tosteson, “Incidence and economic burden ofosteoporosis-related fractures in the United States, 2005–2025,”Journal of Bone andMineral Research, vol. 22, no. 3, pp. 465–475,2007.
[5] R. T. Burge, A. B. King, E. Balda, and D. Worley, “Methodologyfor estimating current and future burden of osteoporosis in statepopulations: application to Florida in 2000 through 2025,”Valuein Health, vol. 6, no. 5, pp. 574–583, 2003.
[6] E. Nacke, N. Ramos, S. Stein, L. Hutzler, and J. A. Bosco III,“When do readmissions for infection occur after spine and totaljoint procedures?” Clinical Orthopaedics and Related Research,vol. 471, no. 2, pp. 569–573, 2013.
[7] J.Hahnel,H. Burdekin, and S.Anand, “Re-admissions followinghip fracture surgery,” Annals of the Royal College of Surgeons ofEngland, vol. 91, no. 7, pp. 591–595, 2009.
[8] M. E. Costantino, B. Frey, B. Hall, and P. Painter, “Theinfluence of a postdischarge intervention on reducing hospitalreadmissions in a medicare population,” Population HealthManagement, vol. 16, no. 5, pp. 310–316, 2013.
[9] C. J. Jordan, R. Y.Goldstein, R. F.Michels, L.Hutzler, J. D. Slover,and J. A. Bosco III, “Comprehensive program reduces hospitalreadmission rates after total joint arthroplasty,” The AmericanJournal of Orthopedics, vol. 41, no. 11, pp. E147–E151, 2012.
[10] O. Brattstrom, M. Eriksson, E. Larsson, and A. Oldner, “Socio-economic status and co-morbidity as risk factors for trauma,”European Journal of Epidemiology, 2014.
[11] X. Zhou, J. Olivier, and D. O. McDaniel, “Impact of socioe-conomic disparities and education on trauma-induced clinicalcomplications,” Public Administration andManagement, vol. 14,no. 1, pp. 123–144, 2009.
[12] T. P. Ruedi, R. E. Buckley, and C. G. Moran, AO Principles ofFractureManagement, vol. 1,Thieme, NewYork, NY, USA, 2007.

Submit your manuscripts athttp://www.hindawi.com
Stem CellsInternational
Hindawi Publishing Corporationhttp://www.hindawi.com Volume 2014
Hindawi Publishing Corporationhttp://www.hindawi.com Volume 2014
MEDIATORSINFLAMMATION
of
Hindawi Publishing Corporationhttp://www.hindawi.com Volume 2014
Behavioural Neurology
EndocrinologyInternational Journal of
Hindawi Publishing Corporationhttp://www.hindawi.com Volume 2014
Hindawi Publishing Corporationhttp://www.hindawi.com Volume 2014
Disease Markers
Hindawi Publishing Corporationhttp://www.hindawi.com Volume 2014
BioMed Research International
OncologyJournal of
Hindawi Publishing Corporationhttp://www.hindawi.com Volume 2014
Hindawi Publishing Corporationhttp://www.hindawi.com Volume 2014
Oxidative Medicine and Cellular Longevity
Hindawi Publishing Corporationhttp://www.hindawi.com Volume 2014
PPAR Research
The Scientific World JournalHindawi Publishing Corporation http://www.hindawi.com Volume 2014
Immunology ResearchHindawi Publishing Corporationhttp://www.hindawi.com Volume 2014
Journal of
ObesityJournal of
Hindawi Publishing Corporationhttp://www.hindawi.com Volume 2014
Hindawi Publishing Corporationhttp://www.hindawi.com Volume 2014
Computational and Mathematical Methods in Medicine
OphthalmologyJournal of
Hindawi Publishing Corporationhttp://www.hindawi.com Volume 2014
Diabetes ResearchJournal of
Hindawi Publishing Corporationhttp://www.hindawi.com Volume 2014
Hindawi Publishing Corporationhttp://www.hindawi.com Volume 2014
Research and TreatmentAIDS
Hindawi Publishing Corporationhttp://www.hindawi.com Volume 2014
Gastroenterology Research and Practice
Hindawi Publishing Corporationhttp://www.hindawi.com Volume 2014
Parkinson’s Disease
Evidence-Based Complementary and Alternative Medicine
Volume 2014Hindawi Publishing Corporationhttp://www.hindawi.com