Embed Size (px)
Citation preview
Research ArticleEconomic Impact of NMMO Pretreatment on Ethanol andBiogas Production from Pinewood
Marzieh Shafiei1 Keikhosro Karimi12 Hamid Zilouei1 and Mohammad J Taherzadeh3
1 Department of Chemical Engineering Isfahan University of Technology Isfahan 84156-83111 Iran2 Industrial Biotechnology Group Institute of Biotechnology and Bioengineering Isfahan University of TechnologyIsfahan 84156-83111 Iran
3 Swedish Centre for Resource Recovery University of Boras 501 90 Boras Sweden
Correspondence should be addressed to Marzieh Shafiei mshafieiceiutacir
Received 3 June 2014 Accepted 15 July 2014 Published 7 September 2014
Academic Editor Meisam Tabatabaei
Copyright copy 2014 Marzieh Shafiei et alThis is an open access article distributed under the Creative Commons Attribution Licensewhich permits unrestricted use distribution and reproduction in any medium provided the original work is properly cited
Processes for ethanol and biogas (scenario 1) and biomethane (scenario 2) production from pinewood improved by N-methylmorpholine-N-oxide (NMMO) pretreatment were developed and simulated by Aspen plusThese processes were comparedwith two processes using steam explosion instead of NMMO pretreatment ethanol (scenario 3) and biomethane (scenario 4)production and the economies of all processes were evaluated by Aspen Process Economic Analyzer Gasoline equivalent pricesof the products including 25 value added tax (VAT) and selling and distribution expenses for scenarios 1 to 4 were respectively140 120 124 and 104 Cl which are lower than gasoline price The profitability indexes for scenarios 1 to 4 were 114 093 116and 096 respectively Despite the lower manufacturing costs of biomethane the profitability indexes of these processes were lowerthan those of the bioethanol processes because of higher capital requirements The results showed that taxing rule is an effectiveparameter on the economy of the biofuelsThe gasoline equivalent prices of the biofuels were 15ndash37 lower than gasoline however37 of the gasoline price contributes to energy and carbon dioxide tax which are not included in the prices of biofuels based onthe Swedish taxation rules
1 Introduction
Ethanol and biomethane are two common biofuels which arealready available in the market in some countries Ethanol ismainly produced from sugar and starch based raw materialsHowever wide investigations are performed for replacementof these food based raw materials with cheaper and moreabundant lignocellulosic materials [1] Biogas is currentlyproduced in wastewater treatment plants or from variousorganic wastes such as municipal solid waste manure andindustrial and agricultural wastes [2] Biogas from wastesis mainly used in the power plants and the compressedbiomethane is commercially available beside the compressednatural gas (CNG) as a vehicle fuel Considering the predictedexpansion of methane usage in Sweden there would be anincreasingmarket for biomethane to be used as a vehicle fuelMoreover further developments in natural gas grid supportmore injection of biomethane in the grid [3]
A pretreatment step prior to biofuel production fromlignocellulosic materials is essential for improvement of thelow yields [1 5ndash9] Pretreatment with N-methyl morpholine-N-oxide (NMMO) is among the novel and efficient meth-ods [5ndash7] NMMO is a nontoxic cellulose solvent doesnot produce toxic wastes and can be recycled over 98[6] NMMO pretreatment modifies the structure of ligno-cellulosic materials to obtain higher yields of enzymatichydrolysis and anaerobic digestion During pretreatmentNMMO dissolves cellulose which is inside of the cell wallof wood Afterwards addition of water regenerates celluloseand less crystalline and amorphous cellulose precipitates onthe biomass surfaces The hydrolysis of regenerated celluloseis much more convenient than the intact cellulose inside thecell wall Furthermore the pretreatment process increases thebiomass porosity and consequently accessibility of degradingenzymes or bacteria to the inside of the biomass Betteraccessibility to the inside of biomass results in enhanced
Hindawi Publishing CorporationBioMed Research InternationalVolume 2014 Article ID 320254 13 pageshttpdxdoiorg1011552014320254
2 BioMed Research International
yields of enzymatic hydrolysis and anaerobic digestion [5]One of the important features of NMMO pretreatment isthat physical removal of lignin and hemicellulose is notnecessary to obtain a high cellulose hydrolysis yield Themodifications made by NMMO pretreatment are so efficientthat the subsequent enzymatic hydrolysis yield is significantlyhigher than the yield aftermost of the other pretreatments forexample steam explosion
Another promising pretreatment process is steam explo-sion Although it has a lower efficiency compared withNMMO pretreatment it is a simple method that is wellinvestigated in laboratory and pilot scales and is suggested forindustrial scale applications [1]
Biofuel production from lignocellulosic materials is adeveloping technology and still challenging with technicaland economical bottlenecks Technoeconomic analysis helpsto overcome these problems using process simulation toolstogether with economic analysis [10] Several technoeco-nomic analyses were performed for bioethanol productionfrom lignocelluloses [10ndash12] The economics of biogas pro-duction from lignocellulosic materials were also studied [2 313] However no reference was detected for technoeconomiccomparison of NMMOand steam explosion pretreatment forboth bioethanol and biogas production from lignocellulosicmaterials
Significant improvements in the ethanol and biogas yieldsfromNMMOtreated pinewoodwere observed [5] In the cur-rent study based on the experimental results the economicsof the processes for bioethanol and biogas productions withNMMO pretreatment were compared with two processesusing continuous steam explosion pretreatment for similarproducts The processes were simulated and optimized usingAspen plus and the economics were evaluated with AspenProcess Economic Analyzer (PEA) A sensitivity analysis wasalso performed to determine the effective parameters
2 Methods
Four scenarios for production of bioethanol and biogas usingsteam explosion or NMMO pretreatment were developedThe process for each scenario was simulated by Aspen plusand then the economy was studied by Aspen PEA Theselected raw material was pinewood because of availabilityof the experimental results [5] however other lignocellulosicfeedstocks can be used with some minor modifications
21 Process Development This study includes four mainscenarios In the first two scenarios NMMO pretreatmentis used for improvement of ethanol and biogas production(scenario 1) and for only biogas production (scenario 2) Theother two scenarios are for the production of the similarproducts but steam explosion pretreatment is used instead ofNMMO pretreatment (scenarios 3 and 4)
211 Scenario 1 NMMO Pretreatment for Improvementof Ethanol and Biogas Production The raw materials areunloaded from trucks to storage area and conveyed forsize reduction All of the scenarios include similar units
for the feedstock handling area In scenario 1 (Figure 1)raw materials are reduced in size and then pretreated withNMMO for 3 hours at 120∘C (Figure 2) Then the materialsare regenerated by addition of hot water washed with waterto remove NMMO and then sent to the biofuel productionprocess An optimized evaporation unit is used for therecovery and concentration of NMMO (Table 1) [12]
In scenario 1 the wood is washed with water after thepretreatment and the water containing 70NMMO is sent toevaporation The evaporation concentrates NMMO to 85and it is reused in the pretreatment A makeup stream forNMMO is considered in the process to supply the amountof NMMO which is not recovered during the washing ofthe treated wood Based on the calculations the NMMOrecovery of 995 is required to have an economically feasibleprocess Efficient multistage countercurrent equipment forsolid washing is considered to provide this recovery Duringthe pretreatment addition of antioxidant agents preventedthe oxidation and degradation of NMMO
Ethanol production includes hydrolysis nonisothermalsimultaneous saccharification and fermentation (NSSF) dis-tillation and dehydration After pretreatment the raw mate-rials are hydrolyzed with Cellic CTec3 enzyme (Novozymes)for 24 hours It is claimed that this newly developed enzymehas a higher efficiency compared with the previous types ofthe Cellic enzymes [12 14] Because of improvements in theenzyme efficiency the enzyme is loaded at the rate of 18ww of cellulose [12] The hydrolysis temperature is set to45∘C for better stability Afterwards the hydrolysate is cooleddown to 37∘C for SSF fermentation for 24 hours [12] Fourmain fermenters and four hydrolysis reactors are designedwith volumes of 800m3 For each of the hydrolysis andfermentation reactors seed fermenters with relative volumeratio of 1 10 until volume of 80 l are used for inoculumpreparation All fermenters and auxiliary equipment aremade up of stainless steel 304
The distillation dehydration and wastewater treatment(WWT) units are similar to the systems presented by Shafieiet al [12] with modifications for the new raw material andlower capacity The distillation unit system (Figure 3 andTable 2) purifies ethanol to 955 For further purification to999 a molecular sieve unit is used The ethanol recoverywas assumed to be 96 in the distillation unit Afterwardsthe wastewater from the striper column is filtered for solidremoval and then sent to an anaerobic digester of UASB typefor biogas productionThis system removes 90 of the CODand the effluent is further purified using aerobic digestion[12] The biogas produced in this process is not sufficientto have an economically feasible upgrading therefore it issold to a nearby combined heat and power (CHP) plant Anamount of 6 biogas loss was assumed during the storage[15]
212 Scenario 2 NMMO Pretreatment for Improvement ofBiogas Production The block flow diagram (BFD) for sce-nario 2 is presented in Figure 4 Similar to scenario 1 unitsfor feed handling andNMMOpretreatmentwere assumed forthis scenario The treated materials are then conveyed to the
BioMed Research International 3
Raw materials
Enzyme Nutrients
pH control materials
Feed handling and
pretreatment
NMMO Water
Steam
Hydrolysis and
fermentation
Steam
Ethanol
Stillage
Water
Biogas
Beer
Vent vapors Distillation
and dehydration
Anaerobic and aerobic
digestion
Waste water
Solid residue
WaterCO2
Figure 1 Block flow diagram (BFD) of scenario 1 NMMO pretreatment for production of ethanol and biogas
Make-up NMMO
Recy
cled
NM
MO
Raw materials Preheater 1 Preheater 2 Pretreatment
Multistage solid wash
Pretreated materials
Evaporator 1 Evaporator 2Flas
h dr
um 1
Flas
h dr
um 2
Ejector Ejector
Knoc
kout
dr
um
Knoc
kout
dr
um
Com
pres
sors
Make-up water
Figure 2 PFD of NMMO pretreatment unit The optimized mechanical vapor recompression (MVR) system was used for the evaporators(scenarios 1 and 2)
solid-state biogas production unit presented by DRANCO(Germany) [16] (Figure 5) Seven digesters with volume of3200m3 made of acid resistant coated carbon steel are usedin the process The digesters are vertical cone bottom vesselsand are fed using screw pumps A portion of the outflow ismixedwith the pretreatedwood andnutrients are sent back tothe top of digesters so the overall retention time of materialsis 20 days [13 16] The digested materials are dewatered to30 solid content and sold as a byproduct for combustionMacrofilters and reverse osmosis system are used for waterpurification while 80 of the water is recycled to the process[17] The effluent water is treated using aerobic digestion[12] The produced biogas is upgraded to 97 with waterscrubbing technologywith regeneration and then pressurizedfor further application as fuel Methane losses are estimatedto be 15 in the upgrading process and 6during the storage[15]
213 Scenario 3 Steam Explosion Pretreatment for Improve-ment of Ethanol and Biogas Production TheBFD for scenario3 is presented in Figure 6The feedstock is handled in an areasimilar to the previous scenarios Afterwards the feedstockis conveyed to the pretreatment area where it is subjectedto continuous steam explosion pretreatment (Figure 7) Theprocess design was similar to the process presented by Shafieiet al [13] with some modifications for the new raw materialand lower capacity Briefly the system consists of three par-allel pretreatment units each of them has screw conveyorspresteamer flash vessel pretreatment reactor and expansiontank The treated materials are used for bioethanol produc-tion in a process similar to scenario 1 Moreover the dehydra-tion and wastewater treatment units are similar to scenario 1[12]The raw biogas is sold as a byproduct for heat and powergeneration
4 BioMed Research International
Co2 96Process waterVapor from fermentation
Steam
Beer
Con
dens
ers
Reflu
x dr
um
Scru
bber
Beer
colu
mn
Rect
ifier
colu
mn
ReboilerReboiler
Molecular sieve unit
Ethanol 999
Water to process
Stillage to wastewater treatment
Figure 3 PFD of distillation unit Beer is processed by a beer column a rectifier column and a molecular sieve unit and the product is fuelethanol (scenarios 1 and 3)
Steam
Raw materials
NMMO
pH control
Feed handling
Water
Pretreatment
Nutrient Biogas (to upgrading)
Digestate
Water (purified)
Solid residue
Solid-state anaerobic digestion
Aerobic digestion
Waste water
Figure 4 BFD of scenario 2 NMMO pretreatment for production of biomethane
Table 1 The process conditions for the equipment of NMMO pretreatment in Figure 2
Equipmentconditions Preheater 1 Preheater 2 Pretreatment Multistage
solid wash Evaporator 1 Flashdrum 1 Evaporator 2 Flash
drum 2 Compressor
Input 119879 (∘C) 20 90 120 120a 45b 873 798 798 90 100Output 119879 (∘C) 90 120 120 45a 62b 798 798 90 90 170Input 119875 (barg) 0 0 05 3 0 minus078 minus078 minus097 0Output 119875 (barg) 0 05 05 3 minus078 minus078 minus097 minus097 064aThe temperature of main streamsbTemperature of washing water
BioMed Research International 5
Anaerobic digester Biogasto upgrading system
NutrientspH control materials
Pretreated materials
Recycled water
To wastewater treatment
Belt press
Solid residue
Figure 5 PFD of solid-state biogas production unit (scenarios 2 and 4)
Raw materials
Enzyme Nutrients
pH control materials
Feed handling and
pretreatment
LP steam HP steam
Water
Hydrolysis and
fermentation
Steam
Ethanol
Stillage
Water
Biogas
Beer
Vent vapors Distillation
and dehydration
Anaerobic and aerobic
digestion
Waste water
Solid residue
WaterCO2
Figure 6 BFD of scenario 3 steam explosion pretreatment for production of ethanol and biogas
214 Scenario 4 Steam Explosion Pretreatment for Improve-ment of Biogas Production In scenario 4 (Figure 8) thefeedstock handling and pretreatment area are similar toscenario 3 However the materials are sent for solid-statebiogas production in a process similar to scenario 2 Thewater from the process is purified using macrofilters andreverse osmosis system and partially recycled to the processComplete recycling is not possible due to accumulationof some ions and chemicals in the process The biogas isupgraded and pressurized in a process similar to scenario 2[17 18]
22 Plant Location and Capacity Sweden was selected forthe plant location because of its large biofuel vehicle fleet inEurope [19] In order to support the economy of the biofuelproduction plant it is necessary to locate it nearby a CHPplant In such a way a part of capital costs for steam andelectricity production is reduced Several CHP plants arealready built in Sweden for production of energy from woodmunicipal waste and forest biomass Most of the CHP plantsin the main cities of Sweden are large enough to support theelectricity and steam requirement of the biofuel plant Forinstance each of the CHP plants in Stockholm area produces800ndash1700GW heat and 200ndash750GW electricity [20] Finally
the availability of raw material and transportation costswould affect the final decision for exact selection of the plantlocation
Wood is already used in Sweden for energy productionFor example in Brista plant in Stockholm 350000 ton peryear of wood chips is used [20] In this study the plantswere designed for utilization of 100000 tonyear pinewoodwhich have a half of the capacity of previous studies [12] Thewooden raw material required for this plant is around 1 ofthe total amount of 16 million m3 of sawn wood (spruce andpine) produced in Sweden [21]
Biogas the byproduct of scenarios 1 and 3 can be soldto the CHP plant for combustion Solid residue anotherbyproduct of the processes contains about 30 dry materialOver 70 of the dry material of solid residue is ligninand other main materials are cellulose hemicellulose andbiomass Solid residue may be further used in gasificationpyrolysis or combustion processes However presence ofwater in the solid residue is one of the major challenges forgasification and pyrolysis [22] Thus solid residue is sold tothe CHP plant for burning
23 Process Simulation and Economic Evaluation The mainequipment of the four processes was simulated by Aspen
6 BioMed Research International
Raw materialsPreheater
Water
Low pressure steam
Noncondensable gasses
Pretreatment
High pressure steam
Low pressure steam 2
Pretreated materials
Expansion tank
Figure 7 PFD of steam explosion pretreatment unit (scenarios 3 and 4)
Table 2 The process conditions for equipment of ethanol distillation in Figure 3
Equipmentconditions Beer column Scrubber column Rectifier column Molecular sieve unitTop input 119879 (∘C) 50a 40b 25 mdash mdashBottom input 119879 (∘C) 110 39 90 106Top output 119879 (∘C) 60 39 106 103Bottom output 119879 (∘C) 676 40 132 103Top input 119875 (barg) 05a 05b 1 mdash mdashBottom input 119875 (barg) 043 0 3 19Top output 119875 (barg) minus081 minus01 19 08Bottom output 119875 (barg) minus061 0 22 08Number of trays 30 10 35 PackedaThe temperature of feed streambThe temperature of stream from scrubber
plus simulation software Unique features of this software arehandling of materials in solid state and broad property databank which are beneficial for the best design simulationand optimization of the processes [23] The software doesthe rigorous calculations for the equipment using a detailedmodel and determines the mass and energy in all streams ofthe process For the physical and thermodynamic propertiesof the wood a data bank prepared by NREL (NationalRenewable Energy Laboratory USA) [24] was introduced tothe software
Based on the results from simulation equipment sizingand optimization were performed using Aspen plus andAspenPEAAfterwards the costswere estimated for allmajorequipment with Aspen PEAThe cost for some units was esti-mated based on the literature ethanol dehydration unit [25]steam explosion equipment [25] and biogas upgrading andpressurizing [26] Basic assumptions for economic evaluationare similar to the previous studies [13] with the followingmodifications
(i) The capacity is reduced to 100000 ton of drymaterialsper year
(ii) Chemical engineering cost index of 2014 was used forthe cost estimations
(iii) The construction periods for scenarios 1 to 4 are 2036 21 and 30 weeks per Aspen PEA suggestion
The manufacturing costs of ethanol and biomethane werecalculated according to the method presented by Peters andTimmerhaus [27] however the credit of the byproducts wassubtracted from the manufacturing cost
24 Sensitivity Analysis A sensitivity analysis was performedto determine the most effective parameters (among the rawmaterials and byproducts) in the economy of the processFor the better comparison of four scenarios the gasolineequivalent prices of the products were calculated using thelower heating values of the fuels which are 361MJNm3for biomethane 212MJl for bioethanol and 320MJl forgasoline
3 Results and Discussion
Based on the experimental results [5] two scenarios for pro-duction of bioethanol and biogas usingNMMOpretreatmentwere developed The economy of these two scenarios wascompared with the economy of two similar scenarios withsteam explosion pretreatment
31 Mass and Energy Balances Four scenarios for the pro-duction of bioethanol and biogas were simulated by Aspenplus (Figures 2 3 5 and 7) Based on the simulation resultsthe required raw materials and utilities as well as productspecifications are shown in Table 3 Because of the better
BioMed Research International 7
Table 3 The amount of raw materialsproducts and utilities usedproduced in each scenario
Scenario 1 Scenario 2 Scenario 3 Scenario 4 Price (Ckg)Raw materials (tpy)1
Pinewood (wet) 105263 105263 105263 105263 006Nutrients 1100 200 1100 200 06pH control 200 1220 200 1220 0240152
Enzymes 1512 1512 1226NMMO 1536 1536 4
Products (tpy)3
Methane (m3y) 21387468 16538970 1154
Biogas (m3y) 5952956 5217778 0755
Solid residue (lignin) 51317 51248 56884 59112 004LP steam 26 61912 61920 0003Ethanol (m3y) 30015 22132 0857
CO2 21921 18480 005Sludge fromWWT 250 3879 232 3612 004
Utilities (tpy)3
Process water 166324 123815 121424 62264 00001LP steam6 30500 30500 0004HP steam8 32324 3154 89171 60000 0008Electricity (Mwh) 17964 18076 14086 14379 30
1tpy ton per year2Themain material for controlling pH in fermentation is NaOH solution (024 Ckg) In anaerobic digestion sodium carbonate (015 Ckg) is mainly added formaintaining the buffering capacity3tpy ton per year unless stated4The biomethane is sold at price of 115 Cm3 which excludes VAT and selling and distribution costs5The biogas is sold at price of 075 Cm3 which excludes VAT and selling and distribution costs6LP steam low pressure steam7The price unit is 085 Clit of bioethanol (999) The price excludes VAT and selling and distribution costs8HP steam high pressure steam
LP steam 2
Raw materials
LP steam HP steam
pH control
Feed handling
Water
Pretreatment
Nutrient Biogas (to upgrading)
Digestate
Water (purified)
Solid residue
Solid-state anaerobic digestion
Aerobic digestion
Waste water
Figure 8 BFD of scenario 4 steam explosion pretreatment for production of biomethane
efficiency of theNMMOpretreatment the amount of ethanoland biogas in scenarios 1 and 2 was higher compared toscenarios 3 and 4 Therefore better hydrolysis and digestionin scenarios 1 and 2 lead to production of less solid residuesAfter steam explosion the exhaust steam from the expansiontanks can be returned to the CHP plant to be reused inthe process This steam contains 015 volatile furans whichmust be removed before being reused Carbon dioxide isproduced in all of the processesThe purity of carbon dioxidefrom bioethanol process is over 99 and it can be soldas a byproduct however in the biomethane scenarios itcontributes to about 50 of the raw biogas and cannot besold
32 Total Project Investment Total project investments cal-culated by Aspen PEA for scenarios 1 to 4 were 440 697405 and 651 million C respectively The required capitalfor NMMO pretreatment was significantly higher than thatfor the steam explosion pretreatment (Table 4) Althoughethanol production required more operating units that ishydrolysis distillation and dehydration the facilities forbiogas production were more expensive than the equipmentrequired for ethanol production The digesters were moreexpensive since the anaerobic digestion requires longer reten-tion time of the materials (20 days) compared with 48 hoursfor the hydrolysis and fermentation in the ethanol production(Table 4) Additionally the capital for the biogas upgrading
8 BioMed Research International
0
5
10
15
20
25
Scenario 1 Scenario 2 Scenario 3 Scenario 4
Breakdown of the operating costs
General expensesFixed chargesDirect manufacturing costs-raw materials
Raw materialsTotal byproduct credit
Cos
t (m
illio
n euro
year
)
minus5
minus10
Figure 9 Breakdown of the operating costs for different scenarios
and pressurizing was more expensive compared with theequipment for distillation and dehydration of ethanol
33 Cost Distributions The breakdown of the operatingcosts is depicted in Figure 9 The direct manufacturing costsinclude the costs for raw materials operating labor anddirect supervisory utilities maintenance and repairs andoperating charges The fixed charges include 30 taxationon the plant income as well as the plant overhead Generalexpenses include the costs for research and development andfinancing (10 return rate) and administrative costs NMMOlignocellulosic feedstock and the enzymes are themost costlyrawmaterialsThe byproducts of bioethanol plants are biogassolid residue and carbon dioxide while solid residue is theonly byproduct of the biogas plants
34 Manufacturing Costs and Gasoline Equivalent Prices InSweden taxes are applied on the plant income as well as25 value added tax on the final price of the productsAdditionally two other taxes are applied on the fossil fuelsbut not on the biofuels which are taxes for energy andcarbon dioxide The amounts of these taxes for gasoline werecorrespondingly 297 and 238 SEKl in 2013 Therefore taxcontributes to 58 of gasoline price [4] The portion of eachof the taxes on the final prices of the biofuels is presentedin Table 5 The average price of E85 (fuel ethanol) [28] was114 Cl (985 SEKl converted based on the average Europrice in 2013 [29]) The manufacturing costs were calculatedwith considering all the parameters presented in Figure 9including 30 tax on the plant income The manufacturingcosts of ethanol for scenarios 1 and 3 excluding VAT andselling and distribution costs were calculated to be 064 or054 Cl respectivelyThe final price for bioethanol includingthe costs for selling and distribution and the taxes for scenar-ios 1 and 3 would be 093 Cl and 083 Cl respectively These
prices are still lower than the fuel ethanol as well as gasoline(Table 5) The manufacturing costs of the biomethane (97pressurized including plant income tax VAT and selling anddistribution costs) for scenarios 2 and 4 were calculated to be135 and 117 CNm3 methane respectively
The gasoline equivalent prices of the final productsready for selling at station are presented in Table 5 Thegasoline equivalent prices of all scenarios are lower thanthe average of gasoline price however the safe marginfor scenario 1 is lower than other processes Scenario 4presents the best product price while scenario 1 shows thehighest product price Despite the better efficiency of theNMMOpretreatment higher capital and higher rawmaterialexpenses of this process have led to higher manufacturingcosts for ethanol (scenario 1 compared with scenario 3) andbiogas (scenario 2 compared with scenario 4) Another pointis that the processes for production of biogas were not asprofitable as the ethanol processes since investment costs forbiomethane production are significantly higher than those ofthe bioethanol process
The gasoline equivalent expenses of E85 and biomethane100 are 4 and 16 lower than gasoline and the prices for thefour scenarios are 15ndash37 less than the fossil fuel Howeveronly addition of energy and carbon dioxide taxes to the fossilfuels helped the competition of biofuels in the fuel marketFurthermore there are other bonuses for biofuel vehiclessuch as discount on car insurance free parking spaces lowerannual registration taxes and exemption from Stockholmcongestion tax Note that the manufacturing cost must belower than the selling price to earn enough profit
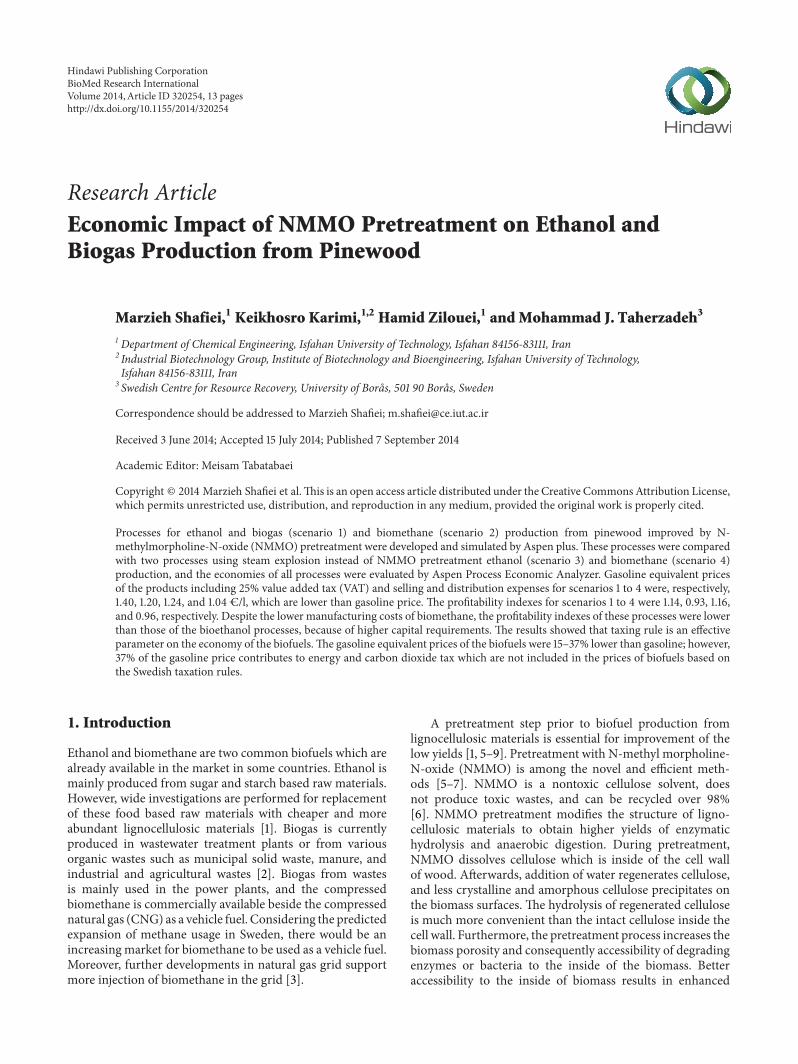
35 Sensitivity Analysis The effects of price of the mostimportant raw materials on the production cost of ethanoland methane are presented in Figure 10 While other rawmaterials for example nutrients and utilities did not signif-icantly affect the operating expenses (data not shown) theresults of sensitivity analysis indicate that NMMO price hadthe most significant effect on the manufacturing cost of theproducts (Figures 10(b) 10(e) and 10(g)) (scenarios 1 and 2)For example 50 increase in the price of NMMO resultsin 11 increase in the gasoline equivalent prices The nexttwo effective parameters are the price of the lignocellulosicfeedstock (Figures 10(a) 10(d) and 10(f)) and the enzymeprice (Figures 10(c) and 10(h)) Increasing 50 in the woodprice has led to 8 8 13 and 12 of the gasolineequivalent prices of scenarios 1 to 4 respectively About 50increase in the enzyme price for scenarios 1 and 3 has ledto 3 and 4 increase in the gasoline equivalent pricescorrespondingly The processes for production of bioethanolhad the least safe margin if they are compared with theaverage petrol price (165 Cl) in Sweden market (Figure 10)
The effects of byproduct prices on the manufacturingcost of the main products are presented in Figure 11 Thedata present the comparison of earning no profit from thebyproduct or 50 increase in the byproduct price with thebase cases For scenarios 1 and 3 the credit from biogas andsolid residue significantly affected the manufacturing costs(Figures 11(a) and 11(c)) For both scenarios 1 and 3 CO
2
BioMed Research International 9
02
04
06
08
1
0 002 004 006 008 01Pinewood price (eurokg)
Etha
nol (
eurolit
)
(a)
0 2 4 6 8 1002
04
06
08
10
NMMO price (eurokg)
Etha
nol (
eurolit
)(b)
0 1 2 2502
05 15
04
06
08
10
Enzyme price (eurokg)
Etha
nol (
eurolit
)
(c)
0 002 004 006 008 01
Pinewood price (eurokg)
03
05
07
09
11
13
3M
etha
ne (euro
m )
(d)
0 2 4 6 8 10
NMMO price (eurokg)
03
05
07
09
11
13
3M
etha
ne (euro
m )
(e)
0 002 004 006 008 01
Pinewood price (eurokg)
06
10
14
18
Gas
olin
e equ
ival
ent (
eurolit
)(f)
0 2 4 6 8 10NMMO price (eurokg)
04
08
12
16
20
Gas
olin
e equ
ival
ent (
eurolit
)
Scenario 1Scenario 2
Scenario 3Scenario 4
(g)
0 1 2 2505 15
Scenario 1Scenario 2
Scenario 3Scenario 4
Enzyme price (eurokg)
04
08
12
16
20
Gas
olin
e equ
ival
ent (
eurolit
)
(h)
Figure 10 Effects of the price of wood NMMO and enzymes on the manufacturing cost of ethanol ((a) (b) and (c)) methane ((d) (e))and the gasoline equivalent prices ((f) (g) and (h)) for scenarios 1 (998771) 2 (e) 3 (◼) and 4 (X) The dashed line corresponds to averagegasoline price in the market The empty shapes represent the base case values of manufacturing costs The plant income tax is included in thecalculation of the values but VAT and selling and distribution costs were not added The gasoline equivalent prices are the prices of readyproducts and include all expenses (cf Table 5)
had the least influence on the ethanol price The price ofsolid residue was more effective in the manufacturing costof methane in scenario 4 compared with scenario 2 (Figures11(b) and 11(d)) The reason was lower efficiency of steamexplosion pretreatment compared to NMMO pretreatmentwhich results in lower digestion yield (scenario 4) andproduction of more solid residues (Table 3)
36 Profitability of the Processes Discounted cash flow analy-sis for each scenario was performed using total capital invest-ment and the annual operating costs The costs include inter-ests and time value of money The payback period (payoutperiod) for each scenariowas calculated (Table 6) as themini-mum length of time to recover the original capital investmentThe payback period of the biogas plants was more than that
10 BioMed Research International
045
055
065
075
Biogas Solid residue
Etha
nol m
anuf
actu
ring
pric
e (euro
lit)
CO2
(a)
06
07
08
09
1
11
Solid residue
3M
etha
ne m
anuf
actu
ring
pric
e (euro
m )
(b)
045
055
065
075
Biogas
50 increase in the byproduct price
The base case value
Etha
nol m
anuf
actu
ring
pric
e (euro
lit)
Solid residue
No profit from byproduct
CO2
(c)
06
07
08
09
1
11
Solid residue
3M
etha
ne m
anuf
actu
ring
pric
e (euro
m )
50 increase in the byproduct price
The base case value
No profit from byproduct
(d)
Figure 11 Effect of byproduct price on the manufacturing cost of ethanol and methane for scenarios 1 (a) 2 (b) 3 (c) and 4 (d) The valuesare prices before addition of VAT and selling and distribution costs
of the bioethanol plant because of the higher capitals require-ments Net rate of return (NRR) shows the profitability of theprocesses andwas calculated by dividing the net present value(NPV) by the present value (PV) of cumulative outflowsTheNRR for ethanol production processes was positive whileprocesses for biomethane production had negative NRR(Table 6)
The relative profitability of the processes is presented byprofitability index (PI) (Table 6) PI shows the present valueof benefits relative to the present value of costs thus the PI ofa profitable project must be greater than one The processesfor ethanol production (scenarios 1 and 3) were profitable (PIgt 1) and the processes for production of biomethane were notprofitable (PI lt 1)
4 Conclusions
Both NMMO and steam explosion led to economically feasi-ble processes for ethanol production (PI gt 1) however noneof the biomethane production processes were profitable (PI lt1) Therefore production of biomethane as the only productfrom wood may not be economically profitable Howeverbiogas production from the waste streams of ethanol processconsiderably helps the economy of the process and reducesthe negative environmental impacts The processes usingsteam explosion pretreatment were more economically prof-itable compared to the processes with NMMO pretreatmentAlthough the pretreatment type significantly affects theyield of final product and consequently the economy of the
BioMed Research International 11
Table 4 Total project investment and its breakdown for the scenarios
Scenario 1 2 3 4Pretreatment NMMO NMMO Steam explosion Steam explosionProduct Ethanolbiogas Biomethane Ethanolbiogas BiomethaneInvestment cost (million C)
Feed handling 56 50 56 50Pretreatment 102 100 64 64Hydrolysis and fermentation 90 mdash 101 mdashDistillation and dehydration 78 mdash 77 mdashBiogas production mdash 219 mdash 217Biogas upgradingcompression mdash 218 mdash 215Water treatment 23 13 23 13Utility 45 26 44 25Storage 15 36 13 34Working capital 31 35 27 33
Total project investment 440 697 405 651
Table 5 The manufacturing cost of biofuels and the tax portion of the final prices
Cost (CL) or (Cm3) Product cost 30 tax on plant income Energy tax Carbondioxide tax 25 VAT1 Final Price
Final price(gasolineequivalent)
Gasoline2 070 mdash 034 028 033 165 165E853 082 mdash 005 004 023 114 159Biomethane 1004 126 mdash mdash mdash 031 157 139Manufacturing cost5
Bioethanol6 (scenario 1) 063 007 mdash mdash 0237 093 140Biomethane8 (scenario 2) 097 007 mdash mdash 0319 135 120Bioethanol6 (scenario 3) 050 010 mdash mdash 0237 083 124Biomethane8 (scenario 4) 077 009 mdash mdash 0319 117 104
1VAT is calculated as 25 of the product prices of biomethane which were 109 SEKm3 (126 CNm3) and ethanol which were 79 SEKL (082 + 005 + 004 =091 CL) Therefore VAT for biomethane = 126 lowast 025 = 031 CNm3 and VAT for E85 = 091 lowast 025 = 023 CL2Average of gasoline (95 octane) in 2013 [4] The gasoline includes 5 bioethanol3E85 is a blend of bioethanol and 15 gasoline During winter time the portion for gasoline increases to 25The portion of fossil fuel in E85 includes energyand CO2 tax4Biomethane 100 contains 100 methane from biological sources and is sold in Sweden along with CNG5Manufacturing cost includes selling and distribution expenses which were 006 CL for ethanol and 01 CNm3 for biomethane6The plant product is 999 bioethanol7It is assumed that the product will be sold to the market in the same price of E85 Thus VAT was assumed to be similar to VAT for E858The plant product is 97 biomethane9It is assumed that the product will be sold to the market in the same price of biomethane 100 Thus VAT was assumed to be similar to VAT for biomethane100
Table 6 The profitability parameters of the processes
Scenario 1 2 3 4Pretreatment NMMO NMMO Steam explosion Steam explosionProduct Ethanolbiogas Biomethane Ethanolbiogas BiomethanePayback period (year) 63 83 62 76Net return rate (NRR) () 146 minus63 167 minus30Profitability index (PI) 114 093 116 096
12 BioMed Research International
NMMOprocess higher capital as well as more expensive rawmaterials reduced the overall profitability of the processeswith NMMO pretreatment The technoeconomic study forproduction of biomethane or ethanol shows that the averagegasoline equivalent price of biomethane was 16 lowerthan that of ethanol and both were 18ndash39 lower than thetaxed gasoline The energy and carbon dioxide taxes on thegasoline significantly help this competition in favor of thebiofuels Application of cheaper cellulose solvents improvesthe economy of the process while maintaining high yields ofbiofuels
Conflict of Interests
The authors declare that there is no conflict of interestsregarding the publication of this paper
Authorsrsquo Contribution
All experiments and paper preparationwere done byMarziehShafiei and the rest of the authors supervised the experimentsand revised the paper
Acknowledgments
The authors are grateful for the financial support from theSwedish Energy Agency and Institute of Biotechnology andBioengineering Isfahan University of Technology
References
[1] M J Taherzadeh and K Karimi ldquoPretreatment of lignocel-lulosic wastes to improve ethanol and biogas production areviewrdquo International Journal of Molecular Sciences vol 9 no9 pp 1621ndash1651 2008
[2] J Yliopisto ldquoEvaluation of potential technologies andoperational scales reflecting market needs for low-costgas upgrading systemsrdquo Seventh framework programme themeenergy Biowaste as feedstock for 2nd generation 2009httpwwwvalorgassotonacukdeliverableshtm
[3] M Linne andO Jonsson Summary andAnalysis of the Potentialfor Production of Renewable Methane (Biogas and SNG) in Swe-den 2004 httpwwwbiogasmaxcoukmediasummary andanalysis april2005 022436100 1644 26042007pdf
[4] ldquoSa har byggs bensinpriset upprdquo httpwwwpreemsetem-platespage 791aspx
[5] M Shafiei K Karimi H Zilouei and M J TaherzadehldquoEnhanced ethanol and biogas production from pinewood byNMMO pretreatment and detailed biomass analysisrdquo BioMedResearch International vol 2014 Article ID 469378 10 pages2014
[6] M Shafiei K Karimi and M J Taherzadeh ldquoPretreatment ofspruce and oak byN-methylmorpholine-N-oxide (NMMO) forefficient conversion of their cellulose to ethanolrdquo BioresourceTechnology vol 101 no 13 pp 4914ndash4918 2010
[7] N Poornejad K Karimi and T Behzad ldquoImprovement ofsaccharification and ethanol production from rice straw byNMMO and [BMIM][OAc] pretreatmentsrdquo Industrial Cropsand Products vol 41 no 1 pp 408ndash413 2013
[8] A Goshadrou K Karimi and M Lefsrud ldquoCharacterizationof ionic liquid pretreated aspen wood using semi-quantitativemethods for ethanol productionrdquo Carbohydrate Polymers vol96 no 2 pp 440ndash449 2013
[9] N Poornejad K Karimi and T Behzad ldquoIonic liquid pretreat-ment of rice straw to enhance saccharification and bioethanolproductionrdquo Journal of Biomass to Biofuel vol 1 pp 8ndash15 2014
[10] A Aden and T Foust ldquoTechnoeconomic analysis of the dilutesulfuric acid and enzymatic hydrolysis process for the conver-sion of corn stover to ethanolrdquo Cellulose vol 16 no 4 pp 535ndash545 2009
[11] A Ekman O Wallberg E Joelsson and P Borjesson ldquoPos-sibilities for sustainable biorefineries based on agriculturalresiduesmdasha case study of potential straw-based ethanol produc-tion in Swedenrdquo Applied Energy vol 102 pp 299ndash308 2013
[12] M Shafiei K Karimi and M J Taherzadeh ldquoTechno-economical study of ethanol and biogas from spruce wood byNMMO-pretreatment and rapid fermentation and digestionrdquoBioresource Technology vol 102 no 17 pp 7879ndash7886 2011
[13] M Shafiei M M Kabir H Zilouei et al ldquoTechno-economicalstudy of biogas production improved by steam explosionpretreatmentrdquo Bioresource Technology C vol 148 pp 53ndash602013
[14] ldquoProduct benefits of Cellic CTec3rdquo httpbioenergynovozymescomencellulosic-ethanolCellicCTec3product-descriptionPagesdefaultaspxCellicCTec3product-descriptionPagesdefaultaspx
[15] J D Murphy and N Power ldquoTechnical and economic analysisof biogas production in Ireland utilising three different croprotationsrdquo Applied Energy vol 86 no 1 pp 25ndash36 2009
[16] LD BaereTheDrancoTechnology AUniqueDigestionTechnol-ogy for Solid Organic Waste 2010 httpwwwowsbewp-con-tentuploads201302The-DRANCO-technology-2012pdf
[17] M Abdal Private Communications Sepahan Biological Prod-ucts Company Isfahan Iran 2014
[18] M Sadeghi Private Communications Parsian Pooya PolymerCompany Isfahan Iran 2014
[19] A Sanches-Pereira and M F Gomez ldquoTowards a cleanervehicle fleet the dynamics of the Swedish biofuel systemrdquo inInternational Workshop Advances in Cleaner Production UNIPSao Paulo Brazil 2013
[20] ldquoCombined heat and power production in Swedenrdquohttpwwwfortumcomenenergy-productioncombined-heat-and-powerswedenpagesdefaultaspx
[21] L Borden and M S Arwidson ldquoProducts from the forestmdasha natural choicerdquo The Swedish Forest Industryrsquos Sustainability2008
[22] S Kumar ldquoHydrothermal processing of biomass for biofuelsrdquoBiofuel Research Journal vol 1 no 2 pp 34ndash43 2014
[23] ldquoOptimize design and operations with Aspen ONEEngineeringrdquo httpwwwaspentechcomproductsaspenone-engineering
[24] R J Wooley and V Putsche ldquoDevelopment of an Aspen Plusphysical property database for biofuels componentsrdquo Tech RepNRELMP-425-20685 National Renewable Energy LaboratoryUS Department of Energy Laboratory 1996
[25] A Aden M I Ruth K Ibsen et al ldquoLignocellulosic biomassto ethanol process design and economics utilizing co-currentdilute acid prehydrolysis and enzymatic hydrolysis for cornstoverrdquo NRELTP 510-32438 National Renewable Energy Lab-oratory US Department of Energy Laboratory 2002
BioMed Research International 13
[26] M Persson ldquoEvaluation of upgrading techniques forbiogasrdquo 2003 httpcdmunfcccintfilestorageE6TE6TUR2NNQW9O83ET10CX8HTE4WXR2OEvaluation20of20Upgrading20Techniques20for20Biogaspdft=WGd8bXpud2dpfDApZg3J-NNGYnJKCGkI9FnI
[27] M S Peters andKD Timmerhaus Plant Design and Economicsfor Chemical Engineers McGrawHill NewYork NY USA 1991
[28] Price history 2014 httpwwwjetsesv SEpg1334073843105privatePriserPrishistorikhtml
[29] Convert Euros to Swedish Krona 2014 httpwwwcurrencymeukconverteursek
Submit your manuscripts athttpwwwhindawicom
Hindawi Publishing Corporationhttpwwwhindawicom Volume 2014
Anatomy Research International
PeptidesInternational Journal of
Hindawi Publishing Corporationhttpwwwhindawicom Volume 2014
Hindawi Publishing Corporation httpwwwhindawicom
International Journal of
Volume 2014
Zoology
Hindawi Publishing Corporationhttpwwwhindawicom Volume 2014
Molecular Biology International
GenomicsInternational Journal of
Hindawi Publishing Corporationhttpwwwhindawicom Volume 2014
The Scientific World JournalHindawi Publishing Corporation httpwwwhindawicom Volume 2014
Hindawi Publishing Corporationhttpwwwhindawicom Volume 2014
BioinformaticsAdvances in
Marine BiologyJournal of
Hindawi Publishing Corporationhttpwwwhindawicom Volume 2014
Hindawi Publishing Corporationhttpwwwhindawicom Volume 2014
Signal TransductionJournal of
Hindawi Publishing Corporationhttpwwwhindawicom Volume 2014
BioMed Research International
Evolutionary BiologyInternational Journal of
Hindawi Publishing Corporationhttpwwwhindawicom Volume 2014
Hindawi Publishing Corporationhttpwwwhindawicom Volume 2014
Biochemistry Research International
ArchaeaHindawi Publishing Corporationhttpwwwhindawicom Volume 2014
Hindawi Publishing Corporationhttpwwwhindawicom Volume 2014
Genetics Research International
Hindawi Publishing Corporationhttpwwwhindawicom Volume 2014
Advances in
Virolog y
Hindawi Publishing Corporationhttpwwwhindawicom
Nucleic AcidsJournal of
Volume 2014
Stem CellsInternational
Hindawi Publishing Corporationhttpwwwhindawicom Volume 2014
Hindawi Publishing Corporationhttpwwwhindawicom Volume 2014
Enzyme Research
Hindawi Publishing Corporationhttpwwwhindawicom Volume 2014
International Journal of
Microbiology

2 BioMed Research International
yields of enzymatic hydrolysis and anaerobic digestion [5]One of the important features of NMMO pretreatment isthat physical removal of lignin and hemicellulose is notnecessary to obtain a high cellulose hydrolysis yield Themodifications made by NMMO pretreatment are so efficientthat the subsequent enzymatic hydrolysis yield is significantlyhigher than the yield aftermost of the other pretreatments forexample steam explosion
Another promising pretreatment process is steam explo-sion Although it has a lower efficiency compared withNMMO pretreatment it is a simple method that is wellinvestigated in laboratory and pilot scales and is suggested forindustrial scale applications [1]
Biofuel production from lignocellulosic materials is adeveloping technology and still challenging with technicaland economical bottlenecks Technoeconomic analysis helpsto overcome these problems using process simulation toolstogether with economic analysis [10] Several technoeco-nomic analyses were performed for bioethanol productionfrom lignocelluloses [10ndash12] The economics of biogas pro-duction from lignocellulosic materials were also studied [2 313] However no reference was detected for technoeconomiccomparison of NMMOand steam explosion pretreatment forboth bioethanol and biogas production from lignocellulosicmaterials
Significant improvements in the ethanol and biogas yieldsfromNMMOtreated pinewoodwere observed [5] In the cur-rent study based on the experimental results the economicsof the processes for bioethanol and biogas productions withNMMO pretreatment were compared with two processesusing continuous steam explosion pretreatment for similarproducts The processes were simulated and optimized usingAspen plus and the economics were evaluated with AspenProcess Economic Analyzer (PEA) A sensitivity analysis wasalso performed to determine the effective parameters
2 Methods
Four scenarios for production of bioethanol and biogas usingsteam explosion or NMMO pretreatment were developedThe process for each scenario was simulated by Aspen plusand then the economy was studied by Aspen PEA Theselected raw material was pinewood because of availabilityof the experimental results [5] however other lignocellulosicfeedstocks can be used with some minor modifications
21 Process Development This study includes four mainscenarios In the first two scenarios NMMO pretreatmentis used for improvement of ethanol and biogas production(scenario 1) and for only biogas production (scenario 2) Theother two scenarios are for the production of the similarproducts but steam explosion pretreatment is used instead ofNMMO pretreatment (scenarios 3 and 4)
211 Scenario 1 NMMO Pretreatment for Improvementof Ethanol and Biogas Production The raw materials areunloaded from trucks to storage area and conveyed forsize reduction All of the scenarios include similar units
for the feedstock handling area In scenario 1 (Figure 1)raw materials are reduced in size and then pretreated withNMMO for 3 hours at 120∘C (Figure 2) Then the materialsare regenerated by addition of hot water washed with waterto remove NMMO and then sent to the biofuel productionprocess An optimized evaporation unit is used for therecovery and concentration of NMMO (Table 1) [12]
In scenario 1 the wood is washed with water after thepretreatment and the water containing 70NMMO is sent toevaporation The evaporation concentrates NMMO to 85and it is reused in the pretreatment A makeup stream forNMMO is considered in the process to supply the amountof NMMO which is not recovered during the washing ofthe treated wood Based on the calculations the NMMOrecovery of 995 is required to have an economically feasibleprocess Efficient multistage countercurrent equipment forsolid washing is considered to provide this recovery Duringthe pretreatment addition of antioxidant agents preventedthe oxidation and degradation of NMMO
Ethanol production includes hydrolysis nonisothermalsimultaneous saccharification and fermentation (NSSF) dis-tillation and dehydration After pretreatment the raw mate-rials are hydrolyzed with Cellic CTec3 enzyme (Novozymes)for 24 hours It is claimed that this newly developed enzymehas a higher efficiency compared with the previous types ofthe Cellic enzymes [12 14] Because of improvements in theenzyme efficiency the enzyme is loaded at the rate of 18ww of cellulose [12] The hydrolysis temperature is set to45∘C for better stability Afterwards the hydrolysate is cooleddown to 37∘C for SSF fermentation for 24 hours [12] Fourmain fermenters and four hydrolysis reactors are designedwith volumes of 800m3 For each of the hydrolysis andfermentation reactors seed fermenters with relative volumeratio of 1 10 until volume of 80 l are used for inoculumpreparation All fermenters and auxiliary equipment aremade up of stainless steel 304
The distillation dehydration and wastewater treatment(WWT) units are similar to the systems presented by Shafieiet al [12] with modifications for the new raw material andlower capacity The distillation unit system (Figure 3 andTable 2) purifies ethanol to 955 For further purification to999 a molecular sieve unit is used The ethanol recoverywas assumed to be 96 in the distillation unit Afterwardsthe wastewater from the striper column is filtered for solidremoval and then sent to an anaerobic digester of UASB typefor biogas productionThis system removes 90 of the CODand the effluent is further purified using aerobic digestion[12] The biogas produced in this process is not sufficientto have an economically feasible upgrading therefore it issold to a nearby combined heat and power (CHP) plant Anamount of 6 biogas loss was assumed during the storage[15]
212 Scenario 2 NMMO Pretreatment for Improvement ofBiogas Production The block flow diagram (BFD) for sce-nario 2 is presented in Figure 4 Similar to scenario 1 unitsfor feed handling andNMMOpretreatmentwere assumed forthis scenario The treated materials are then conveyed to the
BioMed Research International 3
Raw materials
Enzyme Nutrients
pH control materials
Feed handling and
pretreatment
NMMO Water
Steam
Hydrolysis and
fermentation
Steam
Ethanol
Stillage
Water
Biogas
Beer
Vent vapors Distillation
and dehydration
Anaerobic and aerobic
digestion
Waste water
Solid residue
WaterCO2
Figure 1 Block flow diagram (BFD) of scenario 1 NMMO pretreatment for production of ethanol and biogas
Make-up NMMO
Recy
cled
NM
MO
Raw materials Preheater 1 Preheater 2 Pretreatment
Multistage solid wash
Pretreated materials
Evaporator 1 Evaporator 2Flas
h dr
um 1
Flas
h dr
um 2
Ejector Ejector
Knoc
kout
dr
um
Knoc
kout
dr
um
Com
pres
sors
Make-up water
Figure 2 PFD of NMMO pretreatment unit The optimized mechanical vapor recompression (MVR) system was used for the evaporators(scenarios 1 and 2)
solid-state biogas production unit presented by DRANCO(Germany) [16] (Figure 5) Seven digesters with volume of3200m3 made of acid resistant coated carbon steel are usedin the process The digesters are vertical cone bottom vesselsand are fed using screw pumps A portion of the outflow ismixedwith the pretreatedwood andnutrients are sent back tothe top of digesters so the overall retention time of materialsis 20 days [13 16] The digested materials are dewatered to30 solid content and sold as a byproduct for combustionMacrofilters and reverse osmosis system are used for waterpurification while 80 of the water is recycled to the process[17] The effluent water is treated using aerobic digestion[12] The produced biogas is upgraded to 97 with waterscrubbing technologywith regeneration and then pressurizedfor further application as fuel Methane losses are estimatedto be 15 in the upgrading process and 6during the storage[15]
213 Scenario 3 Steam Explosion Pretreatment for Improve-ment of Ethanol and Biogas Production TheBFD for scenario3 is presented in Figure 6The feedstock is handled in an areasimilar to the previous scenarios Afterwards the feedstockis conveyed to the pretreatment area where it is subjectedto continuous steam explosion pretreatment (Figure 7) Theprocess design was similar to the process presented by Shafieiet al [13] with some modifications for the new raw materialand lower capacity Briefly the system consists of three par-allel pretreatment units each of them has screw conveyorspresteamer flash vessel pretreatment reactor and expansiontank The treated materials are used for bioethanol produc-tion in a process similar to scenario 1 Moreover the dehydra-tion and wastewater treatment units are similar to scenario 1[12]The raw biogas is sold as a byproduct for heat and powergeneration
4 BioMed Research International
Co2 96Process waterVapor from fermentation
Steam
Beer
Con
dens
ers
Reflu
x dr
um
Scru
bber
Beer
colu
mn
Rect
ifier
colu
mn
ReboilerReboiler
Molecular sieve unit
Ethanol 999
Water to process
Stillage to wastewater treatment
Figure 3 PFD of distillation unit Beer is processed by a beer column a rectifier column and a molecular sieve unit and the product is fuelethanol (scenarios 1 and 3)
Steam
Raw materials
NMMO
pH control
Feed handling
Water
Pretreatment
Nutrient Biogas (to upgrading)
Digestate
Water (purified)
Solid residue
Solid-state anaerobic digestion
Aerobic digestion
Waste water
Figure 4 BFD of scenario 2 NMMO pretreatment for production of biomethane
Table 1 The process conditions for the equipment of NMMO pretreatment in Figure 2
Equipmentconditions Preheater 1 Preheater 2 Pretreatment Multistage
solid wash Evaporator 1 Flashdrum 1 Evaporator 2 Flash
drum 2 Compressor
Input 119879 (∘C) 20 90 120 120a 45b 873 798 798 90 100Output 119879 (∘C) 90 120 120 45a 62b 798 798 90 90 170Input 119875 (barg) 0 0 05 3 0 minus078 minus078 minus097 0Output 119875 (barg) 0 05 05 3 minus078 minus078 minus097 minus097 064aThe temperature of main streamsbTemperature of washing water
BioMed Research International 5
Anaerobic digester Biogasto upgrading system
NutrientspH control materials
Pretreated materials
Recycled water
To wastewater treatment
Belt press
Solid residue
Figure 5 PFD of solid-state biogas production unit (scenarios 2 and 4)
Raw materials
Enzyme Nutrients
pH control materials
Feed handling and
pretreatment
LP steam HP steam
Water
Hydrolysis and
fermentation
Steam
Ethanol
Stillage
Water
Biogas
Beer
Vent vapors Distillation
and dehydration
Anaerobic and aerobic
digestion
Waste water
Solid residue
WaterCO2
Figure 6 BFD of scenario 3 steam explosion pretreatment for production of ethanol and biogas
214 Scenario 4 Steam Explosion Pretreatment for Improve-ment of Biogas Production In scenario 4 (Figure 8) thefeedstock handling and pretreatment area are similar toscenario 3 However the materials are sent for solid-statebiogas production in a process similar to scenario 2 Thewater from the process is purified using macrofilters andreverse osmosis system and partially recycled to the processComplete recycling is not possible due to accumulationof some ions and chemicals in the process The biogas isupgraded and pressurized in a process similar to scenario 2[17 18]
22 Plant Location and Capacity Sweden was selected forthe plant location because of its large biofuel vehicle fleet inEurope [19] In order to support the economy of the biofuelproduction plant it is necessary to locate it nearby a CHPplant In such a way a part of capital costs for steam andelectricity production is reduced Several CHP plants arealready built in Sweden for production of energy from woodmunicipal waste and forest biomass Most of the CHP plantsin the main cities of Sweden are large enough to support theelectricity and steam requirement of the biofuel plant Forinstance each of the CHP plants in Stockholm area produces800ndash1700GW heat and 200ndash750GW electricity [20] Finally
the availability of raw material and transportation costswould affect the final decision for exact selection of the plantlocation
Wood is already used in Sweden for energy productionFor example in Brista plant in Stockholm 350000 ton peryear of wood chips is used [20] In this study the plantswere designed for utilization of 100000 tonyear pinewoodwhich have a half of the capacity of previous studies [12] Thewooden raw material required for this plant is around 1 ofthe total amount of 16 million m3 of sawn wood (spruce andpine) produced in Sweden [21]
Biogas the byproduct of scenarios 1 and 3 can be soldto the CHP plant for combustion Solid residue anotherbyproduct of the processes contains about 30 dry materialOver 70 of the dry material of solid residue is ligninand other main materials are cellulose hemicellulose andbiomass Solid residue may be further used in gasificationpyrolysis or combustion processes However presence ofwater in the solid residue is one of the major challenges forgasification and pyrolysis [22] Thus solid residue is sold tothe CHP plant for burning
23 Process Simulation and Economic Evaluation The mainequipment of the four processes was simulated by Aspen
6 BioMed Research International
Raw materialsPreheater
Water
Low pressure steam
Noncondensable gasses
Pretreatment
High pressure steam
Low pressure steam 2
Pretreated materials
Expansion tank
Figure 7 PFD of steam explosion pretreatment unit (scenarios 3 and 4)
Table 2 The process conditions for equipment of ethanol distillation in Figure 3
Equipmentconditions Beer column Scrubber column Rectifier column Molecular sieve unitTop input 119879 (∘C) 50a 40b 25 mdash mdashBottom input 119879 (∘C) 110 39 90 106Top output 119879 (∘C) 60 39 106 103Bottom output 119879 (∘C) 676 40 132 103Top input 119875 (barg) 05a 05b 1 mdash mdashBottom input 119875 (barg) 043 0 3 19Top output 119875 (barg) minus081 minus01 19 08Bottom output 119875 (barg) minus061 0 22 08Number of trays 30 10 35 PackedaThe temperature of feed streambThe temperature of stream from scrubber
plus simulation software Unique features of this software arehandling of materials in solid state and broad property databank which are beneficial for the best design simulationand optimization of the processes [23] The software doesthe rigorous calculations for the equipment using a detailedmodel and determines the mass and energy in all streams ofthe process For the physical and thermodynamic propertiesof the wood a data bank prepared by NREL (NationalRenewable Energy Laboratory USA) [24] was introduced tothe software
Based on the results from simulation equipment sizingand optimization were performed using Aspen plus andAspenPEAAfterwards the costswere estimated for allmajorequipment with Aspen PEAThe cost for some units was esti-mated based on the literature ethanol dehydration unit [25]steam explosion equipment [25] and biogas upgrading andpressurizing [26] Basic assumptions for economic evaluationare similar to the previous studies [13] with the followingmodifications
(i) The capacity is reduced to 100000 ton of drymaterialsper year
(ii) Chemical engineering cost index of 2014 was used forthe cost estimations
(iii) The construction periods for scenarios 1 to 4 are 2036 21 and 30 weeks per Aspen PEA suggestion
The manufacturing costs of ethanol and biomethane werecalculated according to the method presented by Peters andTimmerhaus [27] however the credit of the byproducts wassubtracted from the manufacturing cost
24 Sensitivity Analysis A sensitivity analysis was performedto determine the most effective parameters (among the rawmaterials and byproducts) in the economy of the processFor the better comparison of four scenarios the gasolineequivalent prices of the products were calculated using thelower heating values of the fuels which are 361MJNm3for biomethane 212MJl for bioethanol and 320MJl forgasoline
3 Results and Discussion
Based on the experimental results [5] two scenarios for pro-duction of bioethanol and biogas usingNMMOpretreatmentwere developed The economy of these two scenarios wascompared with the economy of two similar scenarios withsteam explosion pretreatment
31 Mass and Energy Balances Four scenarios for the pro-duction of bioethanol and biogas were simulated by Aspenplus (Figures 2 3 5 and 7) Based on the simulation resultsthe required raw materials and utilities as well as productspecifications are shown in Table 3 Because of the better
BioMed Research International 7
Table 3 The amount of raw materialsproducts and utilities usedproduced in each scenario
Scenario 1 Scenario 2 Scenario 3 Scenario 4 Price (Ckg)Raw materials (tpy)1
Pinewood (wet) 105263 105263 105263 105263 006Nutrients 1100 200 1100 200 06pH control 200 1220 200 1220 0240152
Enzymes 1512 1512 1226NMMO 1536 1536 4
Products (tpy)3
Methane (m3y) 21387468 16538970 1154
Biogas (m3y) 5952956 5217778 0755
Solid residue (lignin) 51317 51248 56884 59112 004LP steam 26 61912 61920 0003Ethanol (m3y) 30015 22132 0857
CO2 21921 18480 005Sludge fromWWT 250 3879 232 3612 004
Utilities (tpy)3
Process water 166324 123815 121424 62264 00001LP steam6 30500 30500 0004HP steam8 32324 3154 89171 60000 0008Electricity (Mwh) 17964 18076 14086 14379 30
1tpy ton per year2Themain material for controlling pH in fermentation is NaOH solution (024 Ckg) In anaerobic digestion sodium carbonate (015 Ckg) is mainly added formaintaining the buffering capacity3tpy ton per year unless stated4The biomethane is sold at price of 115 Cm3 which excludes VAT and selling and distribution costs5The biogas is sold at price of 075 Cm3 which excludes VAT and selling and distribution costs6LP steam low pressure steam7The price unit is 085 Clit of bioethanol (999) The price excludes VAT and selling and distribution costs8HP steam high pressure steam
LP steam 2
Raw materials
LP steam HP steam
pH control
Feed handling
Water
Pretreatment
Nutrient Biogas (to upgrading)
Digestate
Water (purified)
Solid residue
Solid-state anaerobic digestion
Aerobic digestion
Waste water
Figure 8 BFD of scenario 4 steam explosion pretreatment for production of biomethane
efficiency of theNMMOpretreatment the amount of ethanoland biogas in scenarios 1 and 2 was higher compared toscenarios 3 and 4 Therefore better hydrolysis and digestionin scenarios 1 and 2 lead to production of less solid residuesAfter steam explosion the exhaust steam from the expansiontanks can be returned to the CHP plant to be reused inthe process This steam contains 015 volatile furans whichmust be removed before being reused Carbon dioxide isproduced in all of the processesThe purity of carbon dioxidefrom bioethanol process is over 99 and it can be soldas a byproduct however in the biomethane scenarios itcontributes to about 50 of the raw biogas and cannot besold
32 Total Project Investment Total project investments cal-culated by Aspen PEA for scenarios 1 to 4 were 440 697405 and 651 million C respectively The required capitalfor NMMO pretreatment was significantly higher than thatfor the steam explosion pretreatment (Table 4) Althoughethanol production required more operating units that ishydrolysis distillation and dehydration the facilities forbiogas production were more expensive than the equipmentrequired for ethanol production The digesters were moreexpensive since the anaerobic digestion requires longer reten-tion time of the materials (20 days) compared with 48 hoursfor the hydrolysis and fermentation in the ethanol production(Table 4) Additionally the capital for the biogas upgrading
8 BioMed Research International
0
5
10
15
20
25
Scenario 1 Scenario 2 Scenario 3 Scenario 4
Breakdown of the operating costs
General expensesFixed chargesDirect manufacturing costs-raw materials
Raw materialsTotal byproduct credit
Cos
t (m
illio
n euro
year
)
minus5
minus10
Figure 9 Breakdown of the operating costs for different scenarios
and pressurizing was more expensive compared with theequipment for distillation and dehydration of ethanol
33 Cost Distributions The breakdown of the operatingcosts is depicted in Figure 9 The direct manufacturing costsinclude the costs for raw materials operating labor anddirect supervisory utilities maintenance and repairs andoperating charges The fixed charges include 30 taxationon the plant income as well as the plant overhead Generalexpenses include the costs for research and development andfinancing (10 return rate) and administrative costs NMMOlignocellulosic feedstock and the enzymes are themost costlyrawmaterialsThe byproducts of bioethanol plants are biogassolid residue and carbon dioxide while solid residue is theonly byproduct of the biogas plants
34 Manufacturing Costs and Gasoline Equivalent Prices InSweden taxes are applied on the plant income as well as25 value added tax on the final price of the productsAdditionally two other taxes are applied on the fossil fuelsbut not on the biofuels which are taxes for energy andcarbon dioxide The amounts of these taxes for gasoline werecorrespondingly 297 and 238 SEKl in 2013 Therefore taxcontributes to 58 of gasoline price [4] The portion of eachof the taxes on the final prices of the biofuels is presentedin Table 5 The average price of E85 (fuel ethanol) [28] was114 Cl (985 SEKl converted based on the average Europrice in 2013 [29]) The manufacturing costs were calculatedwith considering all the parameters presented in Figure 9including 30 tax on the plant income The manufacturingcosts of ethanol for scenarios 1 and 3 excluding VAT andselling and distribution costs were calculated to be 064 or054 Cl respectivelyThe final price for bioethanol includingthe costs for selling and distribution and the taxes for scenar-ios 1 and 3 would be 093 Cl and 083 Cl respectively These
prices are still lower than the fuel ethanol as well as gasoline(Table 5) The manufacturing costs of the biomethane (97pressurized including plant income tax VAT and selling anddistribution costs) for scenarios 2 and 4 were calculated to be135 and 117 CNm3 methane respectively
The gasoline equivalent prices of the final productsready for selling at station are presented in Table 5 Thegasoline equivalent prices of all scenarios are lower thanthe average of gasoline price however the safe marginfor scenario 1 is lower than other processes Scenario 4presents the best product price while scenario 1 shows thehighest product price Despite the better efficiency of theNMMOpretreatment higher capital and higher rawmaterialexpenses of this process have led to higher manufacturingcosts for ethanol (scenario 1 compared with scenario 3) andbiogas (scenario 2 compared with scenario 4) Another pointis that the processes for production of biogas were not asprofitable as the ethanol processes since investment costs forbiomethane production are significantly higher than those ofthe bioethanol process
The gasoline equivalent expenses of E85 and biomethane100 are 4 and 16 lower than gasoline and the prices for thefour scenarios are 15ndash37 less than the fossil fuel Howeveronly addition of energy and carbon dioxide taxes to the fossilfuels helped the competition of biofuels in the fuel marketFurthermore there are other bonuses for biofuel vehiclessuch as discount on car insurance free parking spaces lowerannual registration taxes and exemption from Stockholmcongestion tax Note that the manufacturing cost must belower than the selling price to earn enough profit
35 Sensitivity Analysis The effects of price of the mostimportant raw materials on the production cost of ethanoland methane are presented in Figure 10 While other rawmaterials for example nutrients and utilities did not signif-icantly affect the operating expenses (data not shown) theresults of sensitivity analysis indicate that NMMO price hadthe most significant effect on the manufacturing cost of theproducts (Figures 10(b) 10(e) and 10(g)) (scenarios 1 and 2)For example 50 increase in the price of NMMO resultsin 11 increase in the gasoline equivalent prices The nexttwo effective parameters are the price of the lignocellulosicfeedstock (Figures 10(a) 10(d) and 10(f)) and the enzymeprice (Figures 10(c) and 10(h)) Increasing 50 in the woodprice has led to 8 8 13 and 12 of the gasolineequivalent prices of scenarios 1 to 4 respectively About 50increase in the enzyme price for scenarios 1 and 3 has ledto 3 and 4 increase in the gasoline equivalent pricescorrespondingly The processes for production of bioethanolhad the least safe margin if they are compared with theaverage petrol price (165 Cl) in Sweden market (Figure 10)
The effects of byproduct prices on the manufacturingcost of the main products are presented in Figure 11 Thedata present the comparison of earning no profit from thebyproduct or 50 increase in the byproduct price with thebase cases For scenarios 1 and 3 the credit from biogas andsolid residue significantly affected the manufacturing costs(Figures 11(a) and 11(c)) For both scenarios 1 and 3 CO
2
BioMed Research International 9
02
04
06
08
1
0 002 004 006 008 01Pinewood price (eurokg)
Etha
nol (
eurolit
)
(a)
0 2 4 6 8 1002
04
06
08
10
NMMO price (eurokg)
Etha
nol (
eurolit
)(b)
0 1 2 2502
05 15
04
06
08
10
Enzyme price (eurokg)
Etha
nol (
eurolit
)
(c)
0 002 004 006 008 01
Pinewood price (eurokg)
03
05
07
09
11
13
3M
etha
ne (euro
m )
(d)
0 2 4 6 8 10
NMMO price (eurokg)
03
05
07
09
11
13
3M
etha
ne (euro
m )
(e)
0 002 004 006 008 01
Pinewood price (eurokg)
06
10
14
18
Gas
olin
e equ
ival
ent (
eurolit
)(f)
0 2 4 6 8 10NMMO price (eurokg)
04
08
12
16
20
Gas
olin
e equ
ival
ent (
eurolit
)
Scenario 1Scenario 2
Scenario 3Scenario 4
(g)
0 1 2 2505 15
Scenario 1Scenario 2
Scenario 3Scenario 4
Enzyme price (eurokg)
04
08
12
16
20
Gas
olin
e equ
ival
ent (
eurolit
)
(h)
Figure 10 Effects of the price of wood NMMO and enzymes on the manufacturing cost of ethanol ((a) (b) and (c)) methane ((d) (e))and the gasoline equivalent prices ((f) (g) and (h)) for scenarios 1 (998771) 2 (e) 3 (◼) and 4 (X) The dashed line corresponds to averagegasoline price in the market The empty shapes represent the base case values of manufacturing costs The plant income tax is included in thecalculation of the values but VAT and selling and distribution costs were not added The gasoline equivalent prices are the prices of readyproducts and include all expenses (cf Table 5)
had the least influence on the ethanol price The price ofsolid residue was more effective in the manufacturing costof methane in scenario 4 compared with scenario 2 (Figures11(b) and 11(d)) The reason was lower efficiency of steamexplosion pretreatment compared to NMMO pretreatmentwhich results in lower digestion yield (scenario 4) andproduction of more solid residues (Table 3)
36 Profitability of the Processes Discounted cash flow analy-sis for each scenario was performed using total capital invest-ment and the annual operating costs The costs include inter-ests and time value of money The payback period (payoutperiod) for each scenariowas calculated (Table 6) as themini-mum length of time to recover the original capital investmentThe payback period of the biogas plants was more than that
10 BioMed Research International
045
055
065
075
Biogas Solid residue
Etha
nol m
anuf
actu
ring
pric
e (euro
lit)
CO2
(a)
06
07
08
09
1
11
Solid residue
3M
etha
ne m
anuf
actu
ring
pric
e (euro
m )
(b)
045
055
065
075
Biogas
50 increase in the byproduct price
The base case value
Etha
nol m
anuf
actu
ring
pric
e (euro
lit)
Solid residue
No profit from byproduct
CO2
(c)
06
07
08
09
1
11
Solid residue
3M
etha
ne m
anuf
actu
ring
pric
e (euro
m )
50 increase in the byproduct price
The base case value
No profit from byproduct
(d)
Figure 11 Effect of byproduct price on the manufacturing cost of ethanol and methane for scenarios 1 (a) 2 (b) 3 (c) and 4 (d) The valuesare prices before addition of VAT and selling and distribution costs
of the bioethanol plant because of the higher capitals require-ments Net rate of return (NRR) shows the profitability of theprocesses andwas calculated by dividing the net present value(NPV) by the present value (PV) of cumulative outflowsTheNRR for ethanol production processes was positive whileprocesses for biomethane production had negative NRR(Table 6)
The relative profitability of the processes is presented byprofitability index (PI) (Table 6) PI shows the present valueof benefits relative to the present value of costs thus the PI ofa profitable project must be greater than one The processesfor ethanol production (scenarios 1 and 3) were profitable (PIgt 1) and the processes for production of biomethane were notprofitable (PI lt 1)
4 Conclusions
Both NMMO and steam explosion led to economically feasi-ble processes for ethanol production (PI gt 1) however noneof the biomethane production processes were profitable (PI lt1) Therefore production of biomethane as the only productfrom wood may not be economically profitable Howeverbiogas production from the waste streams of ethanol processconsiderably helps the economy of the process and reducesthe negative environmental impacts The processes usingsteam explosion pretreatment were more economically prof-itable compared to the processes with NMMO pretreatmentAlthough the pretreatment type significantly affects theyield of final product and consequently the economy of the
BioMed Research International 11
Table 4 Total project investment and its breakdown for the scenarios
Scenario 1 2 3 4Pretreatment NMMO NMMO Steam explosion Steam explosionProduct Ethanolbiogas Biomethane Ethanolbiogas BiomethaneInvestment cost (million C)
Feed handling 56 50 56 50Pretreatment 102 100 64 64Hydrolysis and fermentation 90 mdash 101 mdashDistillation and dehydration 78 mdash 77 mdashBiogas production mdash 219 mdash 217Biogas upgradingcompression mdash 218 mdash 215Water treatment 23 13 23 13Utility 45 26 44 25Storage 15 36 13 34Working capital 31 35 27 33
Total project investment 440 697 405 651
Table 5 The manufacturing cost of biofuels and the tax portion of the final prices
Cost (CL) or (Cm3) Product cost 30 tax on plant income Energy tax Carbondioxide tax 25 VAT1 Final Price
Final price(gasolineequivalent)
Gasoline2 070 mdash 034 028 033 165 165E853 082 mdash 005 004 023 114 159Biomethane 1004 126 mdash mdash mdash 031 157 139Manufacturing cost5
Bioethanol6 (scenario 1) 063 007 mdash mdash 0237 093 140Biomethane8 (scenario 2) 097 007 mdash mdash 0319 135 120Bioethanol6 (scenario 3) 050 010 mdash mdash 0237 083 124Biomethane8 (scenario 4) 077 009 mdash mdash 0319 117 104
1VAT is calculated as 25 of the product prices of biomethane which were 109 SEKm3 (126 CNm3) and ethanol which were 79 SEKL (082 + 005 + 004 =091 CL) Therefore VAT for biomethane = 126 lowast 025 = 031 CNm3 and VAT for E85 = 091 lowast 025 = 023 CL2Average of gasoline (95 octane) in 2013 [4] The gasoline includes 5 bioethanol3E85 is a blend of bioethanol and 15 gasoline During winter time the portion for gasoline increases to 25The portion of fossil fuel in E85 includes energyand CO2 tax4Biomethane 100 contains 100 methane from biological sources and is sold in Sweden along with CNG5Manufacturing cost includes selling and distribution expenses which were 006 CL for ethanol and 01 CNm3 for biomethane6The plant product is 999 bioethanol7It is assumed that the product will be sold to the market in the same price of E85 Thus VAT was assumed to be similar to VAT for E858The plant product is 97 biomethane9It is assumed that the product will be sold to the market in the same price of biomethane 100 Thus VAT was assumed to be similar to VAT for biomethane100
Table 6 The profitability parameters of the processes
Scenario 1 2 3 4Pretreatment NMMO NMMO Steam explosion Steam explosionProduct Ethanolbiogas Biomethane Ethanolbiogas BiomethanePayback period (year) 63 83 62 76Net return rate (NRR) () 146 minus63 167 minus30Profitability index (PI) 114 093 116 096
12 BioMed Research International
NMMOprocess higher capital as well as more expensive rawmaterials reduced the overall profitability of the processeswith NMMO pretreatment The technoeconomic study forproduction of biomethane or ethanol shows that the averagegasoline equivalent price of biomethane was 16 lowerthan that of ethanol and both were 18ndash39 lower than thetaxed gasoline The energy and carbon dioxide taxes on thegasoline significantly help this competition in favor of thebiofuels Application of cheaper cellulose solvents improvesthe economy of the process while maintaining high yields ofbiofuels
Conflict of Interests
The authors declare that there is no conflict of interestsregarding the publication of this paper
Authorsrsquo Contribution
All experiments and paper preparationwere done byMarziehShafiei and the rest of the authors supervised the experimentsand revised the paper
Acknowledgments
The authors are grateful for the financial support from theSwedish Energy Agency and Institute of Biotechnology andBioengineering Isfahan University of Technology
References
[1] M J Taherzadeh and K Karimi ldquoPretreatment of lignocel-lulosic wastes to improve ethanol and biogas production areviewrdquo International Journal of Molecular Sciences vol 9 no9 pp 1621ndash1651 2008
[2] J Yliopisto ldquoEvaluation of potential technologies andoperational scales reflecting market needs for low-costgas upgrading systemsrdquo Seventh framework programme themeenergy Biowaste as feedstock for 2nd generation 2009httpwwwvalorgassotonacukdeliverableshtm
[3] M Linne andO Jonsson Summary andAnalysis of the Potentialfor Production of Renewable Methane (Biogas and SNG) in Swe-den 2004 httpwwwbiogasmaxcoukmediasummary andanalysis april2005 022436100 1644 26042007pdf
[4] ldquoSa har byggs bensinpriset upprdquo httpwwwpreemsetem-platespage 791aspx
[5] M Shafiei K Karimi H Zilouei and M J TaherzadehldquoEnhanced ethanol and biogas production from pinewood byNMMO pretreatment and detailed biomass analysisrdquo BioMedResearch International vol 2014 Article ID 469378 10 pages2014
[6] M Shafiei K Karimi and M J Taherzadeh ldquoPretreatment ofspruce and oak byN-methylmorpholine-N-oxide (NMMO) forefficient conversion of their cellulose to ethanolrdquo BioresourceTechnology vol 101 no 13 pp 4914ndash4918 2010
[7] N Poornejad K Karimi and T Behzad ldquoImprovement ofsaccharification and ethanol production from rice straw byNMMO and [BMIM][OAc] pretreatmentsrdquo Industrial Cropsand Products vol 41 no 1 pp 408ndash413 2013
[8] A Goshadrou K Karimi and M Lefsrud ldquoCharacterizationof ionic liquid pretreated aspen wood using semi-quantitativemethods for ethanol productionrdquo Carbohydrate Polymers vol96 no 2 pp 440ndash449 2013
[9] N Poornejad K Karimi and T Behzad ldquoIonic liquid pretreat-ment of rice straw to enhance saccharification and bioethanolproductionrdquo Journal of Biomass to Biofuel vol 1 pp 8ndash15 2014
[10] A Aden and T Foust ldquoTechnoeconomic analysis of the dilutesulfuric acid and enzymatic hydrolysis process for the conver-sion of corn stover to ethanolrdquo Cellulose vol 16 no 4 pp 535ndash545 2009
[11] A Ekman O Wallberg E Joelsson and P Borjesson ldquoPos-sibilities for sustainable biorefineries based on agriculturalresiduesmdasha case study of potential straw-based ethanol produc-tion in Swedenrdquo Applied Energy vol 102 pp 299ndash308 2013
[12] M Shafiei K Karimi and M J Taherzadeh ldquoTechno-economical study of ethanol and biogas from spruce wood byNMMO-pretreatment and rapid fermentation and digestionrdquoBioresource Technology vol 102 no 17 pp 7879ndash7886 2011
[13] M Shafiei M M Kabir H Zilouei et al ldquoTechno-economicalstudy of biogas production improved by steam explosionpretreatmentrdquo Bioresource Technology C vol 148 pp 53ndash602013
[14] ldquoProduct benefits of Cellic CTec3rdquo httpbioenergynovozymescomencellulosic-ethanolCellicCTec3product-descriptionPagesdefaultaspxCellicCTec3product-descriptionPagesdefaultaspx
[15] J D Murphy and N Power ldquoTechnical and economic analysisof biogas production in Ireland utilising three different croprotationsrdquo Applied Energy vol 86 no 1 pp 25ndash36 2009
[16] LD BaereTheDrancoTechnology AUniqueDigestionTechnol-ogy for Solid Organic Waste 2010 httpwwwowsbewp-con-tentuploads201302The-DRANCO-technology-2012pdf
[17] M Abdal Private Communications Sepahan Biological Prod-ucts Company Isfahan Iran 2014
[18] M Sadeghi Private Communications Parsian Pooya PolymerCompany Isfahan Iran 2014
[19] A Sanches-Pereira and M F Gomez ldquoTowards a cleanervehicle fleet the dynamics of the Swedish biofuel systemrdquo inInternational Workshop Advances in Cleaner Production UNIPSao Paulo Brazil 2013
[20] ldquoCombined heat and power production in Swedenrdquohttpwwwfortumcomenenergy-productioncombined-heat-and-powerswedenpagesdefaultaspx
[21] L Borden and M S Arwidson ldquoProducts from the forestmdasha natural choicerdquo The Swedish Forest Industryrsquos Sustainability2008
[22] S Kumar ldquoHydrothermal processing of biomass for biofuelsrdquoBiofuel Research Journal vol 1 no 2 pp 34ndash43 2014
[23] ldquoOptimize design and operations with Aspen ONEEngineeringrdquo httpwwwaspentechcomproductsaspenone-engineering
[24] R J Wooley and V Putsche ldquoDevelopment of an Aspen Plusphysical property database for biofuels componentsrdquo Tech RepNRELMP-425-20685 National Renewable Energy LaboratoryUS Department of Energy Laboratory 1996
[25] A Aden M I Ruth K Ibsen et al ldquoLignocellulosic biomassto ethanol process design and economics utilizing co-currentdilute acid prehydrolysis and enzymatic hydrolysis for cornstoverrdquo NRELTP 510-32438 National Renewable Energy Lab-oratory US Department of Energy Laboratory 2002
BioMed Research International 13
[26] M Persson ldquoEvaluation of upgrading techniques forbiogasrdquo 2003 httpcdmunfcccintfilestorageE6TE6TUR2NNQW9O83ET10CX8HTE4WXR2OEvaluation20of20Upgrading20Techniques20for20Biogaspdft=WGd8bXpud2dpfDApZg3J-NNGYnJKCGkI9FnI
[27] M S Peters andKD Timmerhaus Plant Design and Economicsfor Chemical Engineers McGrawHill NewYork NY USA 1991
[28] Price history 2014 httpwwwjetsesv SEpg1334073843105privatePriserPrishistorikhtml
[29] Convert Euros to Swedish Krona 2014 httpwwwcurrencymeukconverteursek
Submit your manuscripts athttpwwwhindawicom
Hindawi Publishing Corporationhttpwwwhindawicom Volume 2014
Anatomy Research International
PeptidesInternational Journal of
Hindawi Publishing Corporationhttpwwwhindawicom Volume 2014
Hindawi Publishing Corporation httpwwwhindawicom
International Journal of
Volume 2014
Zoology
Hindawi Publishing Corporationhttpwwwhindawicom Volume 2014
Molecular Biology International
GenomicsInternational Journal of
Hindawi Publishing Corporationhttpwwwhindawicom Volume 2014
The Scientific World JournalHindawi Publishing Corporation httpwwwhindawicom Volume 2014
Hindawi Publishing Corporationhttpwwwhindawicom Volume 2014
BioinformaticsAdvances in
Marine BiologyJournal of
Hindawi Publishing Corporationhttpwwwhindawicom Volume 2014
Hindawi Publishing Corporationhttpwwwhindawicom Volume 2014
Signal TransductionJournal of
Hindawi Publishing Corporationhttpwwwhindawicom Volume 2014
BioMed Research International
Evolutionary BiologyInternational Journal of
Hindawi Publishing Corporationhttpwwwhindawicom Volume 2014
Hindawi Publishing Corporationhttpwwwhindawicom Volume 2014
Biochemistry Research International
ArchaeaHindawi Publishing Corporationhttpwwwhindawicom Volume 2014
Hindawi Publishing Corporationhttpwwwhindawicom Volume 2014
Genetics Research International
Hindawi Publishing Corporationhttpwwwhindawicom Volume 2014
Advances in
Virolog y
Hindawi Publishing Corporationhttpwwwhindawicom
Nucleic AcidsJournal of
Volume 2014
Stem CellsInternational
Hindawi Publishing Corporationhttpwwwhindawicom Volume 2014
Hindawi Publishing Corporationhttpwwwhindawicom Volume 2014
Enzyme Research
Hindawi Publishing Corporationhttpwwwhindawicom Volume 2014
International Journal of
Microbiology
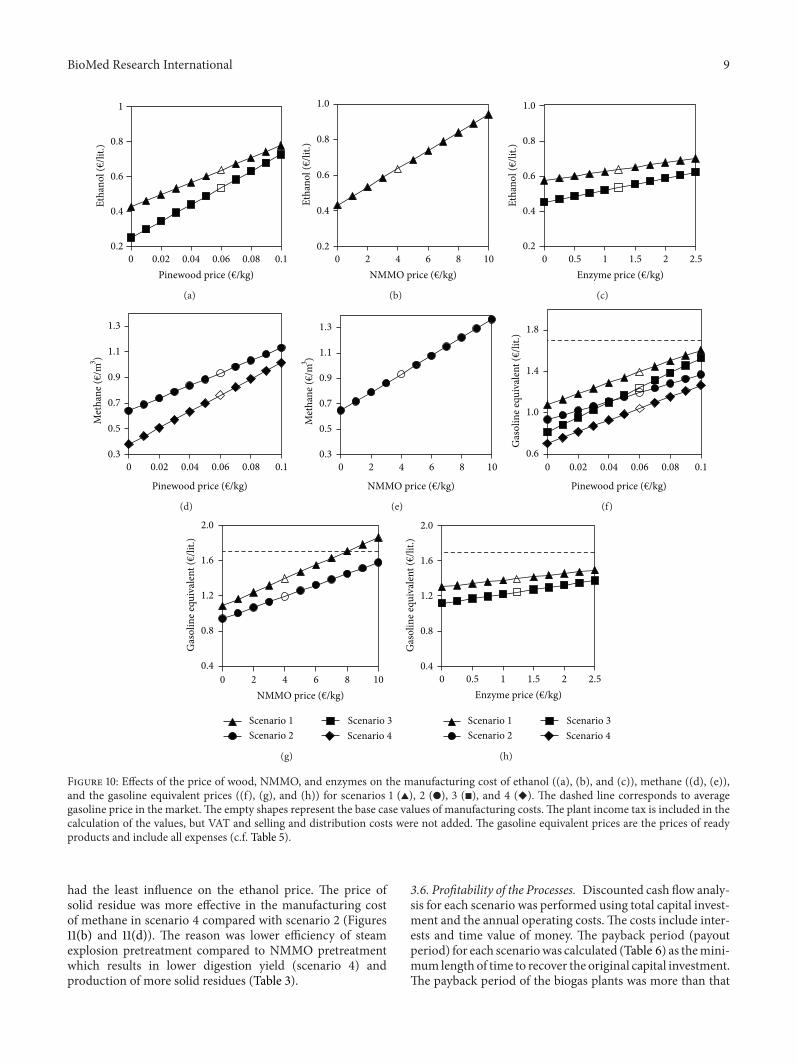
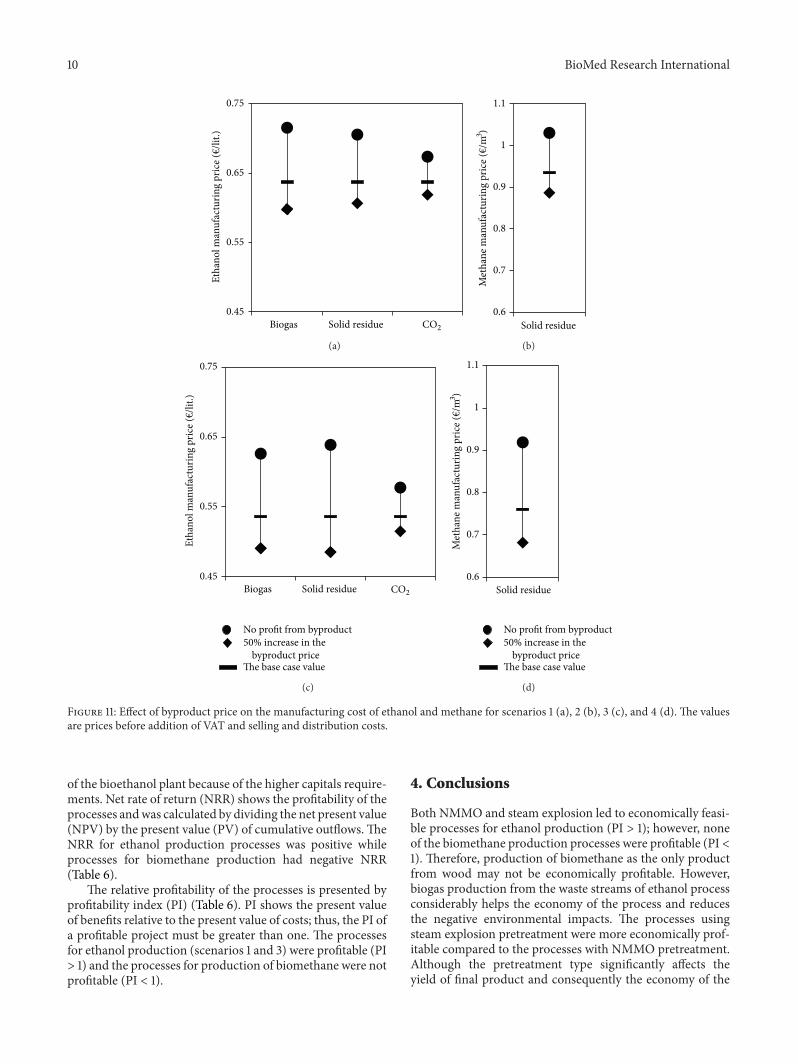