Embed Size (px)
Citation preview
Research ArticleContinuous Fixed-Bed Column Study and Adsorption Modeling:Removal of Lead Ion from Aqueous Solution byCharcoal Originated from Chemical Carbonization ofRubber Wood Sawdust
Swarup Biswas1 and Umesh Mishra2
1Department of Environmental Engineering, NIT Agartala, Tripura 799046, India2Department of Civil Engineering, NIT Agartala, Tripura 799046, India
Correspondence should be addressed to Swarup Biswas; [email protected]
Received 15 August 2015; Accepted 18 October 2015
Academic Editor: Wenshan Guo
Copyright © 2015 S. Biswas and U. Mishra. This is an open access article distributed under the Creative Commons AttributionLicense, which permits unrestricted use, distribution, and reproduction in any medium, provided the original work is properlycited.
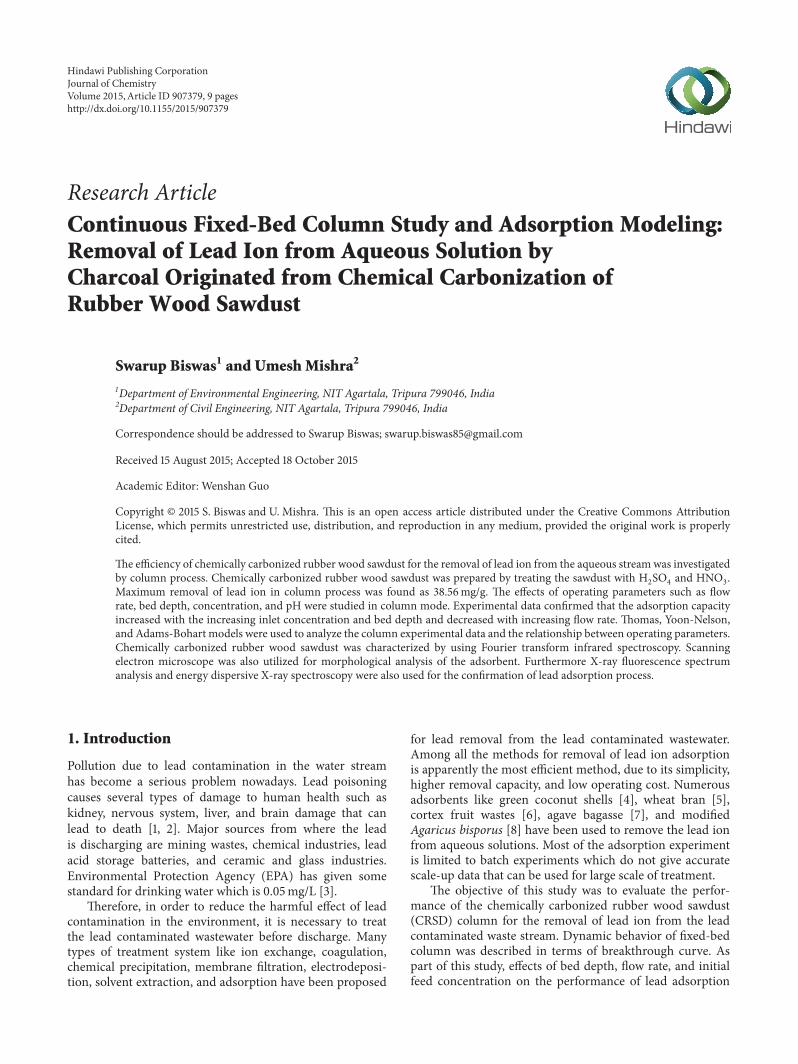
The efficiency of chemically carbonized rubber wood sawdust for the removal of lead ion from the aqueous streamwas investigatedby column process. Chemically carbonized rubber wood sawdust was prepared by treating the sawdust with H
2SO4and HNO
3.
Maximum removal of lead ion in column process was found as 38.56mg/g. The effects of operating parameters such as flowrate, bed depth, concentration, and pH were studied in column mode. Experimental data confirmed that the adsorption capacityincreased with the increasing inlet concentration and bed depth and decreased with increasing flow rate. Thomas, Yoon-Nelson,and Adams-Bohart models were used to analyze the column experimental data and the relationship between operating parameters.Chemically carbonized rubber wood sawdust was characterized by using Fourier transform infrared spectroscopy. Scanningelectron microscope was also utilized for morphological analysis of the adsorbent. Furthermore X-ray fluorescence spectrumanalysis and energy dispersive X-ray spectroscopy were also used for the confirmation of lead adsorption process.
1. Introduction
Pollution due to lead contamination in the water streamhas become a serious problem nowadays. Lead poisoningcauses several types of damage to human health such askidney, nervous system, liver, and brain damage that canlead to death [1, 2]. Major sources from where the leadis discharging are mining wastes, chemical industries, leadacid storage batteries, and ceramic and glass industries.Environmental Protection Agency (EPA) has given somestandard for drinking water which is 0.05mg/L [3].
Therefore, in order to reduce the harmful effect of leadcontamination in the environment, it is necessary to treatthe lead contaminated wastewater before discharge. Manytypes of treatment system like ion exchange, coagulation,chemical precipitation, membrane filtration, electrodeposi-tion, solvent extraction, and adsorption have been proposed
for lead removal from the lead contaminated wastewater.Among all the methods for removal of lead ion adsorptionis apparently the most efficient method, due to its simplicity,higher removal capacity, and low operating cost. Numerousadsorbents like green coconut shells [4], wheat bran [5],cortex fruit wastes [6], agave bagasse [7], and modifiedAgaricus bisporus [8] have been used to remove the lead ionfrom aqueous solutions. Most of the adsorption experimentis limited to batch experiments which do not give accuratescale-up data that can be used for large scale of treatment.
The objective of this study was to evaluate the perfor-mance of the chemically carbonized rubber wood sawdust(CRSD) column for the removal of lead ion from the leadcontaminated waste stream. Dynamic behavior of fixed-bedcolumn was described in terms of breakthrough curve. Aspart of this study, effects of bed depth, flow rate, and initialfeed concentration on the performance of lead adsorption
Hindawi Publishing CorporationJournal of ChemistryVolume 2015, Article ID 907379, 9 pageshttp://dx.doi.org/10.1155/2015/907379

2 Journal of Chemistry
onto CRSD were investigated. Different models such asThomas, Yoon-Nelson, and Adams-Bohart models were usedto compare the experimental data.
2. Materials and Methods
2.1. Preparation of Biomass. Adsorbent was prepared bychemical carbonization of the rubber wood sawdust whichwas collected from rubber wood processing industry,Nagechera, Tripura, India. 10 g of rubber wood sawdust wasadded to 11mL (98% m/m) of sulphuric acid and after 10minutes 6.6mL of concentrated nitric acid (65% m/m) wasadded to the mixture. Black slurry was transferred to theoven at 150∘C. After 24 hours of heating the black slurry wascentrifuged with distilled water to separate the carbonizedcharcoal and to make the pH neutral. Then carbonizedsawdust was dried at 110 ± 2∘C and screened for the desiredparticle size (0.5–1mm).
2.2. Analysis and Characterization. For the determination ofmoisture content of CRSD Karl Fisher instrument (1204Rof VMHI, Metrohm Ltd., USA) was used. Specific sur-face area and pore volume of CRSD were measured byBrunauer-Emmett-Teller (BET)method and for that purposeMicromeritics automatic surface area analyzer (Gemini 2360,Shimadzu, Japan) was utilized.The X-ray fluorescence (XRF)spectrum analysis (Model Phillips PW2404, PANalytical)was used to determine the percentage of elements presentin CRSD before and after adsorption of lead ion. Theconcentrations of the lead ion in synthetic solutions weredetermined by using atomic absorption spectrophotometer(Perkin Elmer Model AAS 700). For determination of pHthe portable pH meter (Hach) was utilized. Absorbancespectra were determined by usingUV-Vis spectrophotometer(Hach, DR5000). Functional groups of the adsorbent wereidentified by the Fourier transform infrared spectroscopy(FTIR) (Bruker 3000 Hyperion, Germany). Morphologicalanalysis of the adsorbent was done by using the scanningelectron microscope (SEM) (JELO JSM7600F) supported byEDS (energy dispersive X-ray spectroscopy) (Oxford AZtecenergy system).
2.3. Reagents. The chemicals used in the experiment wereof analytical reagent grade. Sulphuric acid (H
2SO4) and
nitric acid (HNO3) from Merck, India, were utilized for
the treatment of sawdust. A stock solution of 1000mg/Lwas prepared through dissolution of appropriate amount ofPb(NO
3)2(Merck, India) salt in deionized water. The stock
solution was diluted to obtain the required concentrationused in the experiment. For pH adjustment 0.1M caustic soda(NaOH) and hydrochloric acid solution (HCl) were used.
2.4. Column Data Analysis. Dynamic column studies werecarried out in a glass column of 2.54 cm internal diameterand 10 cm height. A peristaltic pump was used to maintainthe desired flow rate. In the bottom side 0.05 cm thickglass wool was placed to prevent any loss of adsorbent andwas to give mechanical support to the adsorbent bed. Total
Table 1: Characteristics of the adsorbent.
Parameters ValueMoisture content (%) 13.2Solubility in water (%) 0Solubility in 0.25MHCl (%) 0BET surface area (m2/g) 1400Average pore diameter (A) 42.6Total pore volume (cm3/g) 1.82
experiment was carried out at room temperature 30 ± 2∘C.Effects of process parameter like flow rates (10, 15, and20mL/min), bed depth (2, 5, and 7 cm), concentration (10,20, and 30mg/L), and pH (3.1, 5.2, and 6.4) were investigated.Samples were collected every half an hour from the bottom ofthe column and were tested to know the lead concentration.The column performance was investigated by calculatingthe breakthrough time and adsorption capacity. Adsorptioncapacity at 10% breakthrough was calculated according to [9]
𝑞𝐵= (𝑥
𝑚)𝐵
=𝑥𝐵
𝑚adsorbent= 𝑄V (𝐶0 −
𝐶𝐵
2)𝑡𝐵
𝑚adsorbent, (1)
where 𝐶0is influent concentration, 𝑥
𝐵is mass of metal ion
adsorbed in the column at breakthrough (mg), 𝑚adsorbentis mass of adsorbent in the column (g), 𝑄V is flow rate(mL/min), 𝐶
0is influent metal ion concentration (mg/L), 𝐶
𝐵
is breakthrough metal ion concentration (mg/L), and 𝑡𝐵is
time to breakthrough (min).
3. Results and Discussion
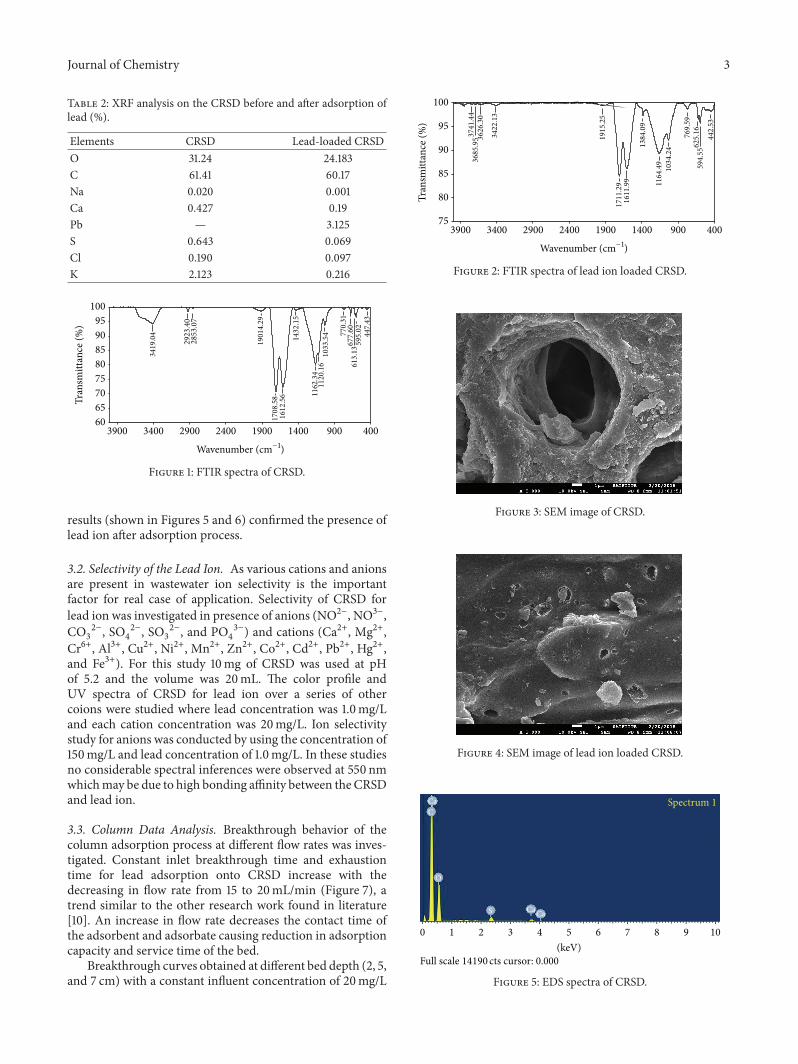
3.1. Characterizations of the Adsorbent. Characteristics ofCRSDwere illustrated in Table 1 where higher specific surfacearea and pore volume were observed which indicated theCRSD as an efficient adsorbent. The feasibility of the leadadsorption onto CRSD was checked by XRF analysis shownin Table 2. It was observed that after adsorption of leadion percentage of other elements such as Na, K, and Cawas decreased and 3.125% lead appeared. In this case otherelements may be involved in ion exchange process with thelead ion and their percentages were decreased. Identificationof the functional groups present in the adsorbent was carriedout by using FTIR analysis (Figures 1 and 2). The majorpeaks found in the CRSD were at 1708.58 cm−1, 1612.56 cm−1,and 1162.34 cm−1 which represented the presence of C=Ogroup, –COO− group, and C–O group. Another peak at3419 cm−1 represents the presence ofO–H starchwhich is dueto carboxyl group (O=C–OH and C–OH). After adsorptionthe shifting of the peaks was observed which also justifies thefeasibility of the adsorption process.
SEM micrograph (Figure 3) with higher magnificationconfirmed the large porous structure of CRSD. Adsorbenthaving large pore size has the higher adsorption capacity.Furthermore highly porous adsorbents which have organicfunctional groups have the higher metal capturing capacity.After adsorption of lead ion morphological structure of theCRSD was changed and this was shown in Figure 4. EDS
Journal of Chemistry 3
Table 2: XRF analysis on the CRSD before and after adsorption oflead (%).
Elements CRSD Lead-loaded CRSDO 31.24 24.183C 61.41 60.17Na 0.020 0.001Ca 0.427 0.19Pb — 3.125S 0.643 0.069Cl 0.190 0.097K 2.123 0.216
3419
.04
2923
.40
2853
.07
1901
4.29
1708
.58
1612
.56
1432
.15
1120
.16
1162
.34
1033
.54
677.
60770.
3161
3.13
595.
02 447.
43
6065707580859095
100
Tran
smitt
ance
(%)
3400 2900 2400 1900 1400 900 4003900
Wavenumber (cm−1)
Figure 1: FTIR spectra of CRSD.
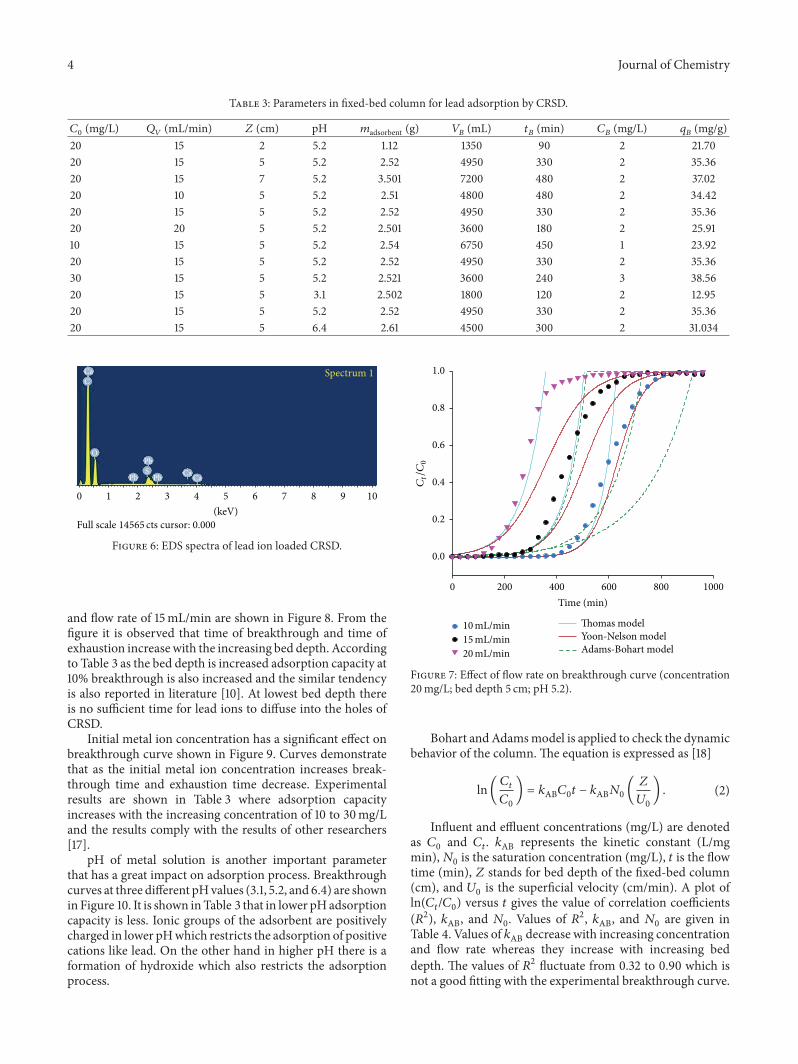
results (shown in Figures 5 and 6) confirmed the presence oflead ion after adsorption process.
3.2. Selectivity of the Lead Ion. As various cations and anionsare present in wastewater ion selectivity is the importantfactor for real case of application. Selectivity of CRSD forlead ion was investigated in presence of anions (NO2−, NO3−,CO3
2−, SO4
2−, SO3
2−, and PO4
3−) and cations (Ca2+, Mg2+,Cr6+, Al3+, Cu2+, Ni2+, Mn2+, Zn2+, Co2+, Cd2+, Pb2+, Hg2+,and Fe3+). For this study 10mg of CRSD was used at pHof 5.2 and the volume was 20mL. The color profile andUV spectra of CRSD for lead ion over a series of othercoions were studied where lead concentration was 1.0mg/Land each cation concentration was 20mg/L. Ion selectivitystudy for anions was conducted by using the concentration of150mg/L and lead concentration of 1.0mg/L. In these studiesno considerable spectral inferences were observed at 550 nmwhichmay be due to high bonding affinity between the CRSDand lead ion.
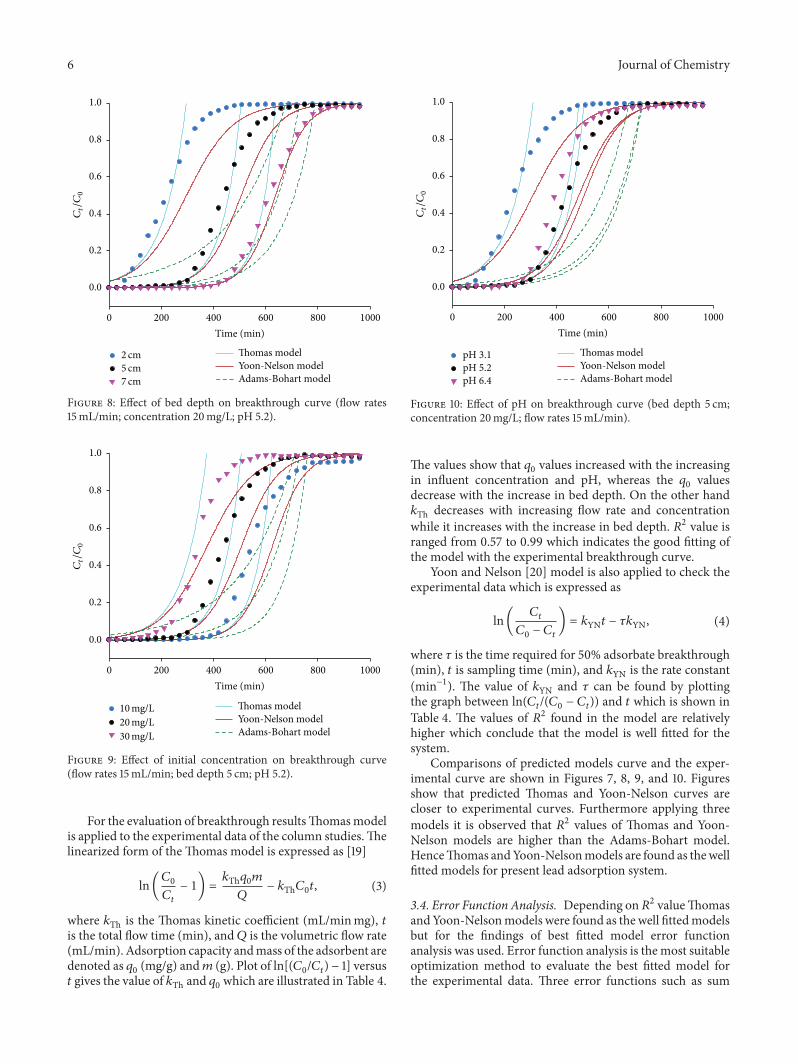
3.3. Column Data Analysis. Breakthrough behavior of thecolumn adsorption process at different flow rates was inves-tigated. Constant inlet breakthrough time and exhaustiontime for lead adsorption onto CRSD increase with thedecreasing in flow rate from 15 to 20mL/min (Figure 7), atrend similar to the other research work found in literature[10]. An increase in flow rate decreases the contact time ofthe adsorbent and adsorbate causing reduction in adsorptioncapacity and service time of the bed.
Breakthrough curves obtained at different bed depth (2, 5,and 7 cm) with a constant influent concentration of 20mg/L
3741
.44
3685
.95 36
26.3
0
3422
.13
1915
.25
1711
.29
1611
.99
1384
.09
1164
.49
1034
.24
769.
5962
5.16
594.
5544
2.53
3400 2900 2400 1900 1400 900 4003900
Wavenumber (cm−1)
75
80
85
90
95
100
Tran
smitt
ance
(%)
Figure 2: FTIR spectra of lead ion loaded CRSD.
Figure 3: SEM image of CRSD.
Figure 4: SEM image of lead ion loaded CRSD.
CaCaS
O
CaC
Spectrum 1
Full scale 14190 cts cursor: 0.000
1 2 3 4 5 6 7 8 9 100
(keV)
Figure 5: EDS spectra of CRSD.
4 Journal of Chemistry
Table 3: Parameters in fixed-bed column for lead adsorption by CRSD.
𝐶0(mg/L) 𝑄
𝑉(mL/min) 𝑍 (cm) pH 𝑚adsorbent (g) 𝑉
𝐵(mL) 𝑡
𝐵(min) 𝐶
𝐵(mg/L) 𝑞
𝐵(mg/g)
20 15 2 5.2 1.12 1350 90 2 21.7020 15 5 5.2 2.52 4950 330 2 35.3620 15 7 5.2 3.501 7200 480 2 37.0220 10 5 5.2 2.51 4800 480 2 34.4220 15 5 5.2 2.52 4950 330 2 35.3620 20 5 5.2 2.501 3600 180 2 25.9110 15 5 5.2 2.54 6750 450 1 23.9220 15 5 5.2 2.52 4950 330 2 35.3630 15 5 5.2 2.521 3600 240 3 38.5620 15 5 3.1 2.502 1800 120 2 12.9520 15 5 5.2 2.52 4950 330 2 35.3620 15 5 6.4 2.61 4500 300 2 31.034
Full scale 14565 cts cursor: 0.000
O
Pb
Pb
PbS
Ca
Ca
Ca
Spectrum 1
1 2 3 4 5 6 7 8 9 100
(keV)
C
Figure 6: EDS spectra of lead ion loaded CRSD.
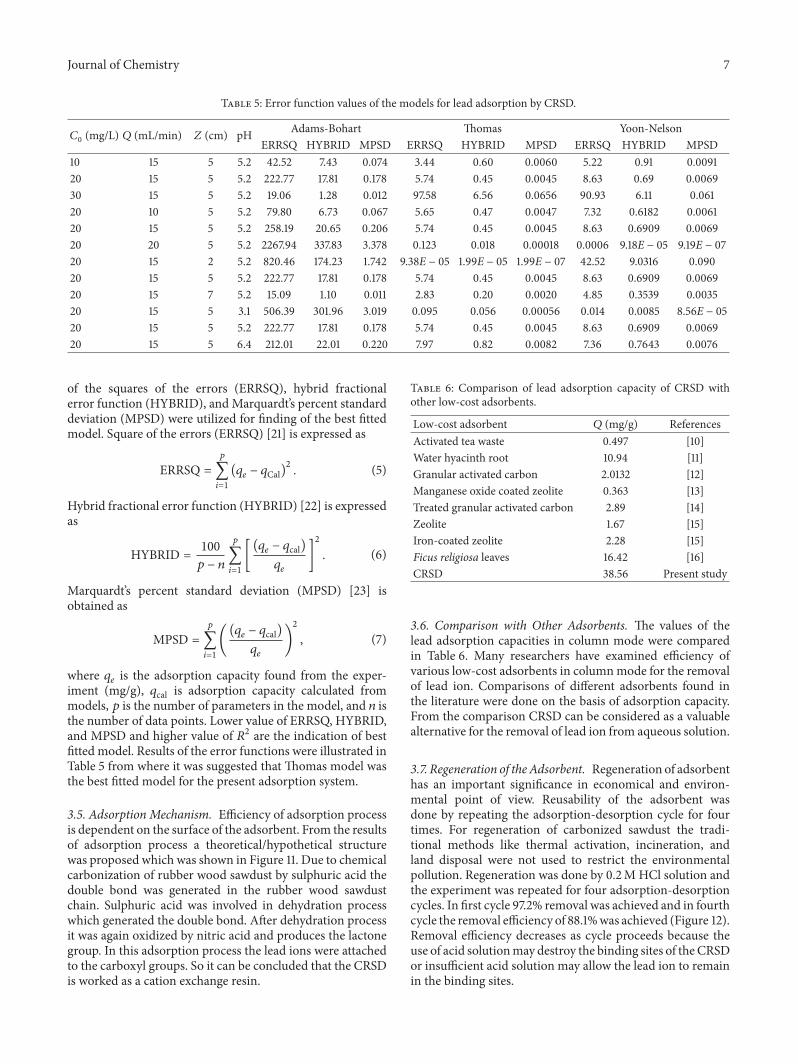
and flow rate of 15mL/min are shown in Figure 8. From thefigure it is observed that time of breakthrough and time ofexhaustion increasewith the increasing bed depth. Accordingto Table 3 as the bed depth is increased adsorption capacity at10% breakthrough is also increased and the similar tendencyis also reported in literature [10]. At lowest bed depth thereis no sufficient time for lead ions to diffuse into the holes ofCRSD.
Initial metal ion concentration has a significant effect onbreakthrough curve shown in Figure 9. Curves demonstratethat as the initial metal ion concentration increases break-through time and exhaustion time decrease. Experimentalresults are shown in Table 3 where adsorption capacityincreases with the increasing concentration of 10 to 30mg/Land the results comply with the results of other researchers[17].
pH of metal solution is another important parameterthat has a great impact on adsorption process. Breakthroughcurves at three different pHvalues (3.1, 5.2, and 6.4) are shownin Figure 10. It is shown inTable 3 that in lower pHadsorptioncapacity is less. Ionic groups of the adsorbent are positivelycharged in lower pHwhich restricts the adsorption of positivecations like lead. On the other hand in higher pH there is aformation of hydroxide which also restricts the adsorptionprocess.
Thomas modelYoon-Nelson modelAdams-Bohart model
10mL/min15mL/min20mL/min
200 400 600 800 10000Time (min)
0.0
0.2
0.4
0.6
0.8
1.0
Ct/C0
Figure 7: Effect of flow rate on breakthrough curve (concentration20mg/L; bed depth 5 cm; pH 5.2).
Bohart andAdamsmodel is applied to check the dynamicbehavior of the column. The equation is expressed as [18]
ln(𝐶𝑡
𝐶0
) = 𝑘AB𝐶0𝑡 − 𝑘AB𝑁0 (𝑍
𝑈0
) . (2)
Influent and effluent concentrations (mg/L) are denotedas 𝐶0and 𝐶
𝑡. 𝑘AB represents the kinetic constant (L/mg
min),𝑁0is the saturation concentration (mg/L), 𝑡 is the flow
time (min), 𝑍 stands for bed depth of the fixed-bed column(cm), and 𝑈
0is the superficial velocity (cm/min). A plot of
ln(𝐶𝑡/𝐶0) versus 𝑡 gives the value of correlation coefficients
(𝑅2), 𝑘AB, and 𝑁0. Values of 𝑅2, 𝑘AB, and 𝑁0 are given in
Table 4. Values of 𝑘AB decrease with increasing concentrationand flow rate whereas they increase with increasing beddepth. The values of 𝑅2 fluctuate from 0.32 to 0.90 which isnot a good fitting with the experimental breakthrough curve.

Journal of Chemistry 5
Table4:Parameterso
fAdams-Bo
hart,Th
omas,and
Yoon
-Nels
onmod
elun
derc
olum
nadsorptio
nprocess.
𝐶0(m
g/L)𝑄(m
L/min)𝑍(cm)
pHAd
ams-Bo
hart
Thom
asYo
on-N
elson
𝑘AB×10−4(L/m
gmin)𝑁0(m
g/L)𝑅2𝐾
Th×10−4(L/m
inmg)𝑞0(m
g/g)𝑅2𝐾
YN×10−2(m
in−1)𝜏(m
in)𝑅2
1015
55.2
12.3
4504.40
0.86
16.6
36884.55
0.96
1.66
624.58
0.96
2015
55.2
4.25
8634.85
0.74
7.360212
0.92
1.46
505.78
0.92
3015
55.2
1.67
1264
0.31
0.69
3.83
66794.92
0.87
1.15
374.2
0.87
2010
55.2
7.16089.58
0.90
9.85
50174.93
0.99
1.97
629.7
00.99
2015
55.2
4.25
8634.85
0.74
7.360212
0.92
1.46
505.78
0.92
2020
55.2
2.8
10939.5
30.50
6.15
57229.7
90.80
1.23
357.8
30.80
2015
25.2
2.4
20067.6
70.29
5.6
79297.6
70.57
1.12
296.04
0.57
2015
55.2
4.25
8634.85
0.74
7.360212
0.92
1.46
505.78
0.92
2015
75.2
4.3
6683.07
0.81
8.5
54629.7
70.98
1.70
637.53
0.99
2015
53.1
2.35
8030.06
0.32
5.55
37160.54
0.69
1.11
309.9
190.69
2015
55.2
4.25
8634.85
0.74
7.360212
0.92
1.46
505.78
0.92
2015
56.4
3.85
8604
.519
0.65
6.7
60470.99
0.86
1.34
485.78
0.86
6 Journal of Chemistry
Thomas model Yoon-Nelson model Adams-Bohart model
200 400 600 800 10000Time (min)
0.0
0.2
0.4
0.6
0.8
1.0
Ct/C0
2 cm5 cm7 cm
Figure 8: Effect of bed depth on breakthrough curve (flow rates15mL/min; concentration 20mg/L; pH 5.2).
200 400 600 800 10000Time (min)
Thomas modelYoon-Nelson modelAdams-Bohart model
10mg/L20mg/L30mg/L
0.0
0.2
0.4
0.6
0.8
1.0
Ct/C0
Figure 9: Effect of initial concentration on breakthrough curve(flow rates 15mL/min; bed depth 5 cm; pH 5.2).
For the evaluation of breakthrough resultsThomasmodelis applied to the experimental data of the column studies.Thelinearized form of theThomas model is expressed as [19]
ln(𝐶0
𝐶𝑡
− 1) =𝑘Th𝑞0𝑚
𝑄− 𝑘Th𝐶0𝑡, (3)
where 𝑘Th is the Thomas kinetic coefficient (mL/minmg), 𝑡is the total flow time (min), and 𝑄 is the volumetric flow rate(mL/min). Adsorption capacity andmass of the adsorbent aredenoted as 𝑞
0(mg/g) and𝑚 (g). Plot of ln[(𝐶
0/𝐶𝑡) − 1] versus
𝑡 gives the value of 𝑘Th and 𝑞0 which are illustrated in Table 4.
pH 3.1pH 5.2pH 6.4
200 400 600 800 10000Time (min)
Thomas modelYoon-Nelson modelAdams-Bohart model
0.0
0.2
0.4
0.6
0.8
1.0
Ct/C0
Figure 10: Effect of pH on breakthrough curve (bed depth 5 cm;concentration 20mg/L; flow rates 15mL/min).
The values show that 𝑞0values increased with the increasing
in influent concentration and pH, whereas the 𝑞0values
decrease with the increase in bed depth. On the other hand𝑘Th decreases with increasing flow rate and concentrationwhile it increases with the increase in bed depth. 𝑅2 value isranged from 0.57 to 0.99 which indicates the good fitting ofthe model with the experimental breakthrough curve.
Yoon and Nelson [20] model is also applied to check theexperimental data which is expressed as
ln(𝐶𝑡
𝐶0− 𝐶𝑡
) = 𝑘YN𝑡 − 𝜏𝑘YN, (4)
where 𝜏 is the time required for 50% adsorbate breakthrough(min), 𝑡 is sampling time (min), and 𝑘YN is the rate constant(min−1). The value of 𝑘YN and 𝜏 can be found by plottingthe graph between ln(𝐶
𝑡/(𝐶0− 𝐶𝑡)) and 𝑡 which is shown in
Table 4. The values of 𝑅2 found in the model are relativelyhigher which conclude that the model is well fitted for thesystem.
Comparisons of predicted models curve and the exper-imental curve are shown in Figures 7, 8, 9, and 10. Figuresshow that predicted Thomas and Yoon-Nelson curves arecloser to experimental curves. Furthermore applying threemodels it is observed that 𝑅2 values of Thomas and Yoon-Nelson models are higher than the Adams-Bohart model.HenceThomas andYoon-Nelsonmodels are found as thewellfitted models for present lead adsorption system.
3.4. Error Function Analysis. Depending on𝑅2 valueThomasandYoon-Nelsonmodels were found as the well fittedmodelsbut for the findings of best fitted model error functionanalysis was used. Error function analysis is the most suitableoptimization method to evaluate the best fitted model forthe experimental data. Three error functions such as sum
Journal of Chemistry 7
Table 5: Error function values of the models for lead adsorption by CRSD.
𝐶0(mg/L) 𝑄 (mL/min) 𝑍 (cm) pH Adams-Bohart Thomas Yoon-Nelson
ERRSQ HYBRID MPSD ERRSQ HYBRID MPSD ERRSQ HYBRID MPSD10 15 5 5.2 42.52 7.43 0.074 3.44 0.60 0.0060 5.22 0.91 0.009120 15 5 5.2 222.77 17.81 0.178 5.74 0.45 0.0045 8.63 0.69 0.006930 15 5 5.2 19.06 1.28 0.012 97.58 6.56 0.0656 90.93 6.11 0.06120 10 5 5.2 79.80 6.73 0.067 5.65 0.47 0.0047 7.32 0.6182 0.006120 15 5 5.2 258.19 20.65 0.206 5.74 0.45 0.0045 8.63 0.6909 0.006920 20 5 5.2 2267.94 337.83 3.378 0.123 0.018 0.00018 0.0006 9.18E − 05 9.19E − 0720 15 2 5.2 820.46 174.23 1.742 9.38E − 05 1.99E − 05 1.99E − 07 42.52 9.0316 0.09020 15 5 5.2 222.77 17.81 0.178 5.74 0.45 0.0045 8.63 0.6909 0.006920 15 7 5.2 15.09 1.10 0.011 2.83 0.20 0.0020 4.85 0.3539 0.003520 15 5 3.1 506.39 301.96 3.019 0.095 0.056 0.00056 0.014 0.0085 8.56E − 0520 15 5 5.2 222.77 17.81 0.178 5.74 0.45 0.0045 8.63 0.6909 0.006920 15 5 6.4 212.01 22.01 0.220 7.97 0.82 0.0082 7.36 0.7643 0.0076
of the squares of the errors (ERRSQ), hybrid fractionalerror function (HYBRID), and Marquardt’s percent standarddeviation (MPSD) were utilized for finding of the best fittedmodel. Square of the errors (ERRSQ) [21] is expressed as
ERRSQ =𝑝
∑
𝑖=1
(𝑞𝑒− 𝑞Cal)
2
. (5)
Hybrid fractional error function (HYBRID) [22] is expressedas
HYBRID = 100𝑝 − 𝑛
𝑝
∑
𝑖=1
[(𝑞𝑒− 𝑞cal)
𝑞𝑒
]
2
. (6)
Marquardt’s percent standard deviation (MPSD) [23] isobtained as
MPSD =𝑝
∑
𝑖=1
((𝑞𝑒− 𝑞cal)
𝑞𝑒
)
2
, (7)
where 𝑞𝑒is the adsorption capacity found from the exper-
iment (mg/g), 𝑞cal is adsorption capacity calculated frommodels, 𝑝 is the number of parameters in the model, and 𝑛 isthe number of data points. Lower value of ERRSQ, HYBRID,and MPSD and higher value of 𝑅2 are the indication of bestfitted model. Results of the error functions were illustrated inTable 5 from where it was suggested that Thomas model wasthe best fitted model for the present adsorption system.
3.5. Adsorption Mechanism. Efficiency of adsorption processis dependent on the surface of the adsorbent. From the resultsof adsorption process a theoretical/hypothetical structurewas proposed which was shown in Figure 11. Due to chemicalcarbonization of rubber wood sawdust by sulphuric acid thedouble bond was generated in the rubber wood sawdustchain. Sulphuric acid was involved in dehydration processwhich generated the double bond. After dehydration processit was again oxidized by nitric acid and produces the lactonegroup. In this adsorption process the lead ions were attachedto the carboxyl groups. So it can be concluded that the CRSDis worked as a cation exchange resin.
Table 6: Comparison of lead adsorption capacity of CRSD withother low-cost adsorbents.
Low-cost adsorbent 𝑄 (mg/g) ReferencesActivated tea waste 0.497 [10]Water hyacinth root 10.94 [11]Granular activated carbon 2.0132 [12]Manganese oxide coated zeolite 0.363 [13]Treated granular activated carbon 2.89 [14]Zeolite 1.67 [15]Iron-coated zeolite 2.28 [15]Ficus religiosa leaves 16.42 [16]CRSD 38.56 Present study
3.6. Comparison with Other Adsorbents. The values of thelead adsorption capacities in column mode were comparedin Table 6. Many researchers have examined efficiency ofvarious low-cost adsorbents in columnmode for the removalof lead ion. Comparisons of different adsorbents found inthe literature were done on the basis of adsorption capacity.From the comparison CRSD can be considered as a valuablealternative for the removal of lead ion from aqueous solution.
3.7. Regeneration of theAdsorbent. Regeneration of adsorbenthas an important significance in economical and environ-mental point of view. Reusability of the adsorbent wasdone by repeating the adsorption-desorption cycle for fourtimes. For regeneration of carbonized sawdust the tradi-tional methods like thermal activation, incineration, andland disposal were not used to restrict the environmentalpollution. Regeneration was done by 0.2M HCl solution andthe experiment was repeated for four adsorption-desorptioncycles. In first cycle 97.2% removal was achieved and in fourthcycle the removal efficiency of 88.1%was achieved (Figure 12).Removal efficiency decreases as cycle proceeds because theuse of acid solutionmay destroy the binding sites of theCRSDor insufficient acid solution may allow the lead ion to remainin the binding sites.

8 Journal of Chemistry
OH
O
OH
OH
OH
O
OHCOOH
Heat
O
OOH C
O
OH
+HNO3−NO2 −CO2 −H2O
(a)
O
OH O
OHO
O
OH
O
OH O
OHO
O
O
Pb+2
Pb+2
O
OH O
OOO
Pb+2
Pb+2
−
−
−
−+Pb2+
−H+ −2H+
O−
O−
+H2O
(b)
Figure 11: Proposed mechanism involved in the adsorption process: (a) oxidation by HNO3and (b) binding mechanism of lead ion.
AdsorptionDesorption
1st 3rd 4th2ndNumber of cycles
0
20
40
60
80
100
120
Rem
oval
effici
ency
(%)
Figure 12: Adsorption/desorption efficiency of lead ion onto CRSDduring different cycles (concentration 10mg/L, flow rate 15mL/min,and bed depth 5 cm).
4. Conclusions
The study concludes that removal of lead ion in a packedbed system using CRSD is an effective and feasible method.Behavior of breakthrough curve and the lead adsorptioncapacity is strongly influenced by flow rate, bed depth,influent concentration, and pH. Breakthrough time increaseswith a higher bed depth, a lower flow rate, and a lower influentconcentration. Adsorption capacities were high at the flowrate of 15mL/min, bed depth of 7 cm, influent concentrationof 30mg/L, and pH of 5.2. This column adsorption processcontributes a maximum adsorption capacity of 38.56mg/g.The prediction of breakthrough curves was obtained by usingAdams-Bohart, Thomas, and Yoon-Nelson model. Howeverthe entire breakthrough curve was best predicted byThomasmodel.
Conflict of Interests
The authors hereby declare no conflict of interests.
Acknowledgment
The authors are thankful to the Director of National Instituteof Technology Agartala for providing necessary researchfacilities.
References
[1] M. R. Awual and M. M. Hasan, “A novel fine-tuning meso-porous adsorbent for simultaneous lead(II) detection andremoval from wastewater,” Sensors and Actuators, B: Chemical,vol. 202, pp. 395–403, 2014.
[2] A. P. Lim and A. Z. Aris, “Continuous fixed-bed column studyand adsorption modeling: removal of cadmium (II) and lead(II) ions in aqueous solution by dead calcareous skeletons,”Biochemical Engineering Journal, vol. 87, pp. 50–61, 2014.
[3] U. Guyo, J. Mhonyera, and M. Moyo, “Pb(II) adsorptionfrom aqueous solutions by raw and treated biomass of maizestover—a comparative study,” Process Safety and EnvironmentalProtection, vol. 93, pp. 192–200, 2015.
[4] F. W. Sousa, A. G. Oliveira, J. P. Ribeiro, M. F. Rosa, D.Keukeleire, and R. F. Nascimento, “Green coconut shells appliedas adsorbent for removal of toxic metal ions using fixed-bedcolumn technology,” Journal of Environmental Management,vol. 91, no. 8, pp. 1634–1640, 2010.
[5] A. Ozer, “Removal of Pb (II) ions from aqueous solutionsby sulphuric acid-treated wheat bran,” Journal of HazardousMaterials, vol. 141, no. 3, pp. 753–761, 2007.
[6] K. Kelly-Vargas,M.Cerro-Lopez, S. Reyna-Tellez, E. R. Bandala,and J. L. Sanchez-Salas, “Biosorption of heavymetals in pollutedwater, using different waste fruit cortex,” Physics and Chemistryof the Earth, Parts A/B/C, vol. 37–39, pp. 26–29, 2012.
[7] L. H. Velazquez-Jimenez, A. Pavlick, and J. R. Rangel-Mendez,“Chemical characterization of raw and treated agave bagasseand its potential as adsorbent of metal cations from water,”Industrial Crops and Products, vol. 43, no. 1, pp. 200–206, 2013.
[8] Y. Long, D. Lei, J. Ni, Z. Ren, C. Chen, and H. Xu, “Packed bedcolumn studies on lead(II) removal from industrial wastewater

Journal of Chemistry 9
bymodifiedAgaricus bisporus,” Bioresource Technology, vol. 152,pp. 457–463, 2014.
[9] G. Tchobanologus, F. L. Burton, and H. D. Stensel, Eds.,Wastewater Engineering: Treatment and Reuse, Tata McGraw-Hill, New Delhi, India, 2003.
[10] M. K. Mondal, “Removal of Pb (II) ions from aqueous solutionusing activated tea waste: adsorption on a fixed-bed column,”Journal of Environmental Management, vol. 90, no. 11, pp. 3266–3271, 2009.
[11] T. Mitra, B. Singha, N. Bar, and S. K. Das, “Removal of Pb(II) ions from aqueous solution using water hyacinth root byfixed-bed column and ANN modeling,” Journal of HazardousMaterials, vol. 273, pp. 94–103, 2014.
[12] C. P. Dwivedi, J. N. Sahu, C. R. Mohanty, B. R. Mohan, and B.C. Meikap, “Column performance of granular activated carbonpacked bed for Pb (II) removal,” Journal of HazardousMaterials,vol. 156, no. 1–3, pp. 596–603, 2008.
[13] R. Han, W. Zou, H. Li, Y. Li, and J. Shi, “Copper(II) andlead(II) removal from aqueous solution in fixed-bed columnsby manganese oxide coated zeolite,” Journal of HazardousMaterials B, vol. 137, no. 2, pp. 934–942, 2006.
[14] J. Goel, K. Kadirvelu, C. Rajagopal, and V. K. Garg, “Removal oflead(II) by adsorption using treated granular activated carbon:batch and column studies,” Journal of Hazardous Materials B,vol. 125, no. 1–3, pp. 211–220, 2005.
[15] T. C. Nguyen, P. Loganathan, T. V. Nguyen, S. Vigneswaran, J.Kandasamy, and R. Naidu, “Simultaneous adsorption of Cd, Cr,Cu, Pb, and Zn by an iron-coated Australian zeolite in batchand fixed-bed column studies,” Chemical Engineering Journal,vol. 270, pp. 393–404, 2015.
[16] S.Qaiser, A. R. Saleemi, andM.Umar, “Biosorption of lead fromaqueous solution by Ficus religiosa leaves: batch and columnstudy,” Journal ofHazardousMaterials, vol. 166, no. 2-3, pp. 998–1005, 2009.
[17] J. Cruz-Olivares, C. Perez-Alonso, C. Barrera-Dıaz, F. Urena-Nunez, M. C. Chaparro-Mercado, and B. Bilyeu, “Modelingof lead (II) biosorption by residue of allspice in a fixed-bedcolumn,”Chemical Engineering Journal, vol. 228, pp. 21–27, 2013.
[18] W. Song, X. Xu, X. Tan et al., “Column adsorption of perchlorateby amine-crosslinked biopolymer based resin and its biological,chemical regeneration properties,” Carbohydrate Polymers, vol.115, pp. 432–438, 2015.
[19] S. Chen, Q. Yue, B. Gao, Q. Li, X. Xu, and K. Fu, “Adsorptionof hexavalent chromium from aqueous solution by modifiedcorn stalk: a fixed-bed column study,” Bioresource Technology,vol. 113, pp. 114–120, 2012.
[20] D. Bulgariu and L. Bulgariu, “Sorption of Pb (II) onto a mixtureof algae waste biomass and anion exchanger resin in a packed-bed column,”Bioresource Technology, vol. 129, pp. 374–380, 2013.
[21] A. Gunay, E. Arslankaya, and I. Tosun, “Lead removal fromaqueous solution by natural and pretreated clinoptilolite:adsorption equilibrium and kinetics,” Journal of HazardousMaterials, vol. 146, no. 1-2, pp. 362–371, 2007.
[22] S. Pal, D. Mal, and R. P. Singh, “Cationic starch: an effectiveflocculating agent,” Carbohydrate Polymers, vol. 59, no. 4, pp.417–423, 2005.
[23] A. C. A. de Lima, R. F. Nascimento, F. F. de Sousa, J. M. Filho,and A. C. Oliveira, “Modified coconut shell fibers: a green andeconomical sorbent for the removal of anions from aqueoussolutions,” Chemical Engineering Journal, vol. 185-186, pp. 274–284, 2012.

Submit your manuscripts athttp://www.hindawi.com
Hindawi Publishing Corporationhttp://www.hindawi.com Volume 2014
Inorganic ChemistryInternational Journal of
Hindawi Publishing Corporation http://www.hindawi.com Volume 2014
International Journal ofPhotoenergy
Hindawi Publishing Corporationhttp://www.hindawi.com Volume 2014
Carbohydrate Chemistry
International Journal of
Hindawi Publishing Corporationhttp://www.hindawi.com Volume 2014
Journal of
Chemistry
Hindawi Publishing Corporationhttp://www.hindawi.com Volume 2014
Advances in
Physical Chemistry
Hindawi Publishing Corporationhttp://www.hindawi.com
Analytical Methods in Chemistry
Journal of
Volume 2014
Bioinorganic Chemistry and ApplicationsHindawi Publishing Corporationhttp://www.hindawi.com Volume 2014
SpectroscopyInternational Journal of
Hindawi Publishing Corporationhttp://www.hindawi.com Volume 2014
The Scientific World JournalHindawi Publishing Corporation http://www.hindawi.com Volume 2014
Medicinal ChemistryInternational Journal of
Hindawi Publishing Corporationhttp://www.hindawi.com Volume 2014
Chromatography Research International
Hindawi Publishing Corporationhttp://www.hindawi.com Volume 2014
Applied ChemistryJournal of
Hindawi Publishing Corporationhttp://www.hindawi.com Volume 2014
Hindawi Publishing Corporationhttp://www.hindawi.com Volume 2014
Theoretical ChemistryJournal of
Hindawi Publishing Corporationhttp://www.hindawi.com Volume 2014
Journal of
Spectroscopy
Analytical ChemistryInternational Journal of
Hindawi Publishing Corporationhttp://www.hindawi.com Volume 2014
Journal of
Hindawi Publishing Corporationhttp://www.hindawi.com Volume 2014
Quantum Chemistry
Hindawi Publishing Corporationhttp://www.hindawi.com Volume 2014
Organic Chemistry International
ElectrochemistryInternational Journal of
Hindawi Publishing Corporation http://www.hindawi.com Volume 2014
Hindawi Publishing Corporationhttp://www.hindawi.com Volume 2014
CatalystsJournal of