Embed Size (px)
Citation preview
Research ArticleComparative Aquatic Toxicity of Gold Nanoparticles andIonic Gold Using a Species Sensitivity Distribution Approach
Tarryn L. Botha,1 Tanyn E. James,1 and Victor Wepener2
1Department of Zoology, University of Johannesburg, P.O. Box 534, Auckland Park 2006, South Africa2Unit for Environmental Sciences and Management, Water Research Group (Ecotoxicology), North-West University,Private Bag X6001, Potchefstroom 2520, South Africa
Correspondence should be addressed to Tarryn L. Botha; [email protected]
Received 22 May 2015; Accepted 23 June 2015
Academic Editor: Kangtaek Lee
Copyright © 2015 Tarryn L. Botha et al.This is an open access article distributed under the Creative CommonsAttribution License,which permits unrestricted use, distribution, and reproduction in any medium, provided the original work is properly cited.
Gold nanoparticles (nAu) are used in drug delivery systems allowing for targeted cellular distribution. The effects of increaseduse and release of nanoparticles into the environment are not well known. A species sensitivity distribution (SSD) allows for theecotoxicological hazard assessment of a chemical based on single species toxicity tests. Aquatic toxicity needs to be related to particlecharacterization in order to understand the effects. The behaviour of nAu in the medium changed as the concentration increased.The toxic potential of ionic gold andnAuwas expressed as a hazardous concentrationwhere 5%of specieswill be harmed (HC5).TheHC5 for nAu was much higher (42.78mg/L) compared to the ionic gold (2.44mg/L).The differences between the hazard potentialsof nAu and ionic gold were attributed to the nAu not releasing any Au ions into solution during the exposures and following anaggregation theory response. Exposures to ionic gold on the other hand followed a clear dose dependent response based on theconcentration of the ionic metal. Although SSDs present an indication of the relative hazard potential of nanoparticles, the trueworth can only be achieved once other nanoparticle characteristics and their behavior in the environment are also considered.
1. Introduction
In recent years, gold nanoparticles (nAu) have been studiedand developed within the biological and photothermal thera-peutic contexts.Themajor clinical interest is within the appli-cation of novel drug delivery systems and targeted deliveryinto cells [1–4] as well as microelectromechanical systems[5] and diagnostic systems [6]. Exposure of nanoparticlescan occur in different stages of the lifecycle of the product,from their synthesis, application (which can include ingestionor intravenously), and weathering to their waste disposal.Due to little research within this field there are currently noguidelines for their use; therefore, the previously mentionedexposure routes could build up in the environment [1, 7–10].
Tomanage environmental resources such aswater quality,laboratory toxicity tests are used worldwide and are deemedas the first step in a tiered approach to set up guidelinesfor acceptablemaximumconcentrations of specific pollutants[11–14]. Bioassays are employed to find toxicity which couldcome from complex mixtures and are a complementary tool
to assess toxic effects overcoming certain limitations andare relatively rapid, cost effective, and simple to perform[15–17]. Bioassays can detect synergistic, antagonistic, andadditive effects and also explain both point and diffusesources of aquatic pollution since they are site specific [15, 18–20]. Several different bioassays are used simultaneously atdifferent trophic levels of different biological complexity tosufficiently assess whether a potential hazard exists [11, 21]since no single test is suitable to measure all ecological risksdue to different sensitivities by organisms [17, 22–24].
Species sensitivity distributions (SSDs) are being inte-grated into ecological risk assessments to evaluate the toxicityof particular chemicals [25]. An SSD is a distribution ofstatistical data approximated from a set of toxicity data andobserved as a function of accumulative distribution [26, 27].Species sensitivity distributions are used to calculate theconcentration at which a specified proportion of species willbe affected. The SSD provides a plot of logarithmic toxicityendpoints, specifically LC50 (the lethal concentration oftoxicant that causes 50% death of test organisms at a specific
Hindawi Publishing CorporationJournal of NanomaterialsVolume 2015, Article ID 986902, 16 pageshttp://dx.doi.org/10.1155/2015/986902
2 Journal of Nanomaterials
period of time) against rank-assigned percentiles for eachendpoint value to which a statistical distribution is fitted [28].A resulting hazard concentration (HCp) is produced from theSSD which is expressed as the percentage (𝑝) of all speciesthat are presumed to become affected [28, 29]. Toxicologicaldatabases are key factors in the derivation of water qualityguidelines; thus SSDs are more commonly used in ecologicalrisk assessments and generating water quality guidelines[28, 30]. The application of SSDs to evaluate the hazard ofnanoparticles is fairly new since the database for nanoparticletoxicity data is relatively small compared to bulk chemicalequivalents. Adam et al. [31] and Garner et al. [32] madeuse of SSDs to compare the relative toxicity of nanoparticlesfor which data are available, for example, CuO, ZnO, TiO
2,
and carbon nanotubes.Many nanoparticle ecotoxicity studieshighlight the importance of physicochemical nanoparticlecharacterization in the exposure media to be able to linkexposure to effect [11, 33–35]. However there are very limiteddata for nAu.Therefore the aim of this studywas to determinethe comparative toxicity of aquatic organisms exposed to nAuand ionic gold using an SSD approach. The study also aimedto link mortality to the nAu particle characteristics.
2. Materials and Methods
2.1. Gold Nanoparticle and Ionic Gold Stock Solutions. ThenAu stock solution (14 ± 2 nm nAu with product codeTMU14G, batch numbers 20130304FKP49b, 20130308FKP52,and 20140905BM001)was prepared by standard citrate reduc-tion techniques according toMurphy et al. [36] and Fren [37]and was sterilized using the filtration method. Gold used forionic exposures was purchased in powder form from Aldrich(USA) as gold(III) chloride and was dissolved in standardOECD medium to a stock solution concentration of 1 g/L ofAu3+ prior to the preparation of exposure concentrations.
2.2. Preparation of Environmental Media as Diluent for nAuSuspensions of Varying Concentrations. The reconstitutedwater forDaphnia toxicity testingwas performed bymaking astandard OECD [38] medium (NaHCO
3, CaSO
4⋅2H2O, KCl,
and MgSO4⋅7H2O). The standard OECD medium [38] for
fish toxicity testing contained CaCl2⋅2H2O, MgSO
4⋅7H2O,
NaHCO3, and KCl. The reconstituted water media were
aerated for 24 hours prior to use [39].The nAu stock solutionwas placed in an ultrasonicator bath and sonicated for twohours prior to use. To make up the required exposureconcentrations, relevant volumes of the nAu stock wereadded to the environmental media water.
2.3. Physicochemical Water Quality. Physicochemical waterquality parameters were measured according to standardtest protocols [36]. Measurements were taken at the startof the test and at 24-hour (h) intervals until the tests wereconcluded. The pH, electrical conductivity (EC), total dis-solved solids (TDS), oxygen saturation (% O
2), and dissolved
oxygen (DO) concentration (mg/L) were measured using ahandheld Eutech pH 110 RS232C meter, Eutech CON 110RS232C conductivity and TDS meter, and Eutech DO6 DO
meter. The oxygen saturation was maintained above 60% forthe duration of the test by bubbling compressed air into theexposure beakers.
2.4. Nanoparticle Exposure Concentration. Total gold con-centrations were determined at the start of the toxicitybioassay (0 h) as well as at the conclusion of the assay (48 hor 96 h where relevant) to verify nominal concentrationsin both ionic and nAu exposures. Samples (11mL) wereacidified with 3mL Suprapur 30% hydrochloric acid (Merck)and 1mL 65% HNO
3to ensure that all of the gold was
in ionic form. Inductively coupled plasma atom emissionspectroscopy (ICP-OES) (Spectro Arcos FSH12) techniqueswere used to analyse the water samples.
2.5. Characterization of nAu Particles. Based on the recom-mendations by von der Kammer et al. [42], Stone et al.[43], and Klaine et al. [35], the following characteristics weredetermined: concentration, size distribution, surface charge,surface functionality, and agglomeration patterns. Dynamiclight scattering (Malvern Zetasizer Nano series, NanoZS)was used to measure the hydrodynamic size distributionand zeta potential of the nAu in solution. Fourier trans-form infrared spectrometry (FTIR) (Perkin Elmer FTIR-spectrometer, Spectrum 100) was used to determine thenAu surface functionality and provide insight into possiblereasons of particle aggregation. These measurements weretaken at 0 h as well as at the conclusion of the test; that is,for fish this was after 96 h while for Daphnia this was 48hours. Transmission electronmicroscopy (TEM) (FEI TecnaiG2) was used to quantify nAu diameter and nAu surfacemorphology as well as show particle aggregation patterns.One drop of nAumedium was dropped onto a carbon coatedcopper grid and allowed to settle for a fewminutes.The excesswater was removed using a filter paper by touching only theedge of the droplet and the grid was allowed to dry beforeexamination at high resolution (200 kV).
2.6. Daphnia pulex and Daphnia magna 48-Hour AcuteImmobilisation Test. The arthropods Daphnia pulex and D.magna were used for acute testing. Adults were kept in 2.5 Ltanks in Daphnia media which were replaced three timesper week and kept at a temperature of 20∘C. Five millilitersof Daphnia food was suspended in the Daphnia media ateach water cycle change. Prior to testing approximately thirtyadults were transferred to a new tank and neonates less than24 hrs old were used for the test.
For nAu a concentration range of 0.5mg/L, 2mg/L,5mg/L, 10mg/L, 15mg/L, 20mg/L, 25mg/L, 35mg/L, and45mg/L was used. A separate dispersant control (the citratebuffer in which the nAu particles were dispersed) was madeup in the same concentration range as the nAu.The ionic goldexposure concentration range was 0.0005mg/L, 0.005mg/L,0.5mg/L, 1mg/L, 2mg/L, and 5mg/L. A positive controlconsisting of 1 g/L potassium dichromate solution was alsoconducted. The test organisms were not fed during the assay.
Twenty-one neonates were used for each concentrationand tests were carried out in triplicate with each of the three
Journal of Nanomaterials 3
50mL beakers per concentration containing seven organ-isms. A 16 h light and 8 h dark cycle was applied for theduration of the test and the temperature was maintained at20 ± 2
∘C. After each 24 h exposure period, the number ofimmobilized Daphnia, that is, any animal that was immobi-lized for more than 15 seconds, was counted. Any abnormalbehaviour was also noted. The test was concluded after 48 h.
2.7. Fish 96-Hour Acute Lethality Test. Acute toxicity testswere conducted using two standard toxicity test fish species,that is,Danio rerio (zebrafish) and Poecilia reticulata (guppy),and four indigenous fish species, that is, Labeobarbusaeneus (smallmouth yellowfish), Pseudocrenilabrus philan-der (southern mouthbrooder), Tilapia sparrmanii (bandedtilapia), andOreochromismossambicus (Mozambique tilapia).All fish were maintained and cultured in the research lab-oratories of the University of Johannesburg. The fish acutelethality test [36] was performed on 14-day-old juveniles.Similar to the Daphnia exposures a concentration rangeof 5mg/L, 10mg/L, 15mg/L, 20mg/L, 25mg/L, 30mg/L,35mg/L, 40mg/L, 45mg/L, 50mg/L, 100mg/L, and 200mg/Lwas used for nAu. A range of 50mg/L, 100mg/L, and200mg/L was used to conduct a solvent (dispersant) controlassay on the citric buffer dispersant. A concentration rangeof 1mg/L, 2mg/L, 5mg/L, and 10mg/L was used for the ionicgold (in the form of chloroauric acid) bioassay. Potassiumdichromate (1 g/L) was used as a positive control. Threereplicates of seven fish per concentration were conducted in500mL beakers containing exposure medium. A 16 h lightand 8 h dark cycle was maintained for the duration of thetest and the temperature was maintained between 21∘C and25∘C. The physicochemical water quality parameters weretaken at the start of the test and again at 24 h intervals untilthe test was concluded after 96 h. The oxygen saturation wasmaintained above 60% for the duration of the test. If morethan 10% of the juveniles died in the control the test wasdiscarded and repeated. At 24 h intervals mortalities wererecorded. Mortality was regarded if no visible movement wasseen including gill movement. All dead fish were removedfrom the exposure beaker.
2.8. Statistical Analysis
2.8.1. Acute Toxicity. Data from the acute bioassays wereanalysed to calculate LC50/EC50 values using the Probitor Trimmed Spearman-Karber methods where appropriate[44]. To determine whether there were any significant differ-ences between the LC50 values for the different species, thefollowing formula was used [45]: 𝑓
1.2= antilog√((log𝑓
1)2+
(log𝑓2)2), where 𝑓 is the factor for 95% confidence limits of
the LC50 and is calculated by dividing the upper confidencelimit by the LC50. If the ratio of the higher LC50 to thelower LC50 exceeds the value for 𝑓
1.2for both the upper
and lower 95% confidence limits the LC50s are considered tobe significantly different. The nominal concentrations wereused to determine the LC50 values. In the absence of chronicdata, the lowest observed effect concentration (LOEC) andno observed effect concentration (NOEC) can be useful in
deriving water quality criteria. The NOEC was taken as themaximum concentration of the test materials that producedno significant harmful effect on the test organisms. TheLOEC was determined as the lowest concentration that hasa significant harmful effect on test organisms.
2.8.2. Species Sensitivity Distributions. The results obtainedfrom the bioassays were used to compare the tolerancesof standard test species and indigenous arthropod and fishspecies using an SSD approach [27].The SSDs were producedusing the CADDIS SSD Generator [44]. Separate distribu-tion models were constructed with the acute toxicity datacollected for a range of species for nAu and ionic gold fromwhich the average hazard concentration (HCp) endpointwas extrapolated. The HC5 (hazard concentration where 5%of species are affected) was determined for freshwater fishand arthropods with exposure durations from 48 to 96 hrs.The comparisons in sensitivity were drawn between toxicresponses of indigenous organisms and the standard testorganisms. The taxonomic groups were analysed separatelyfor the SSD model to illustrate the difference in tolerancebetween the taxa. A cumulative SSDmodel of all data for fishand arthropod’s endpoints was also constructed for both nAuand ionic gold to ascertain the hazard threshold values.
3. Results
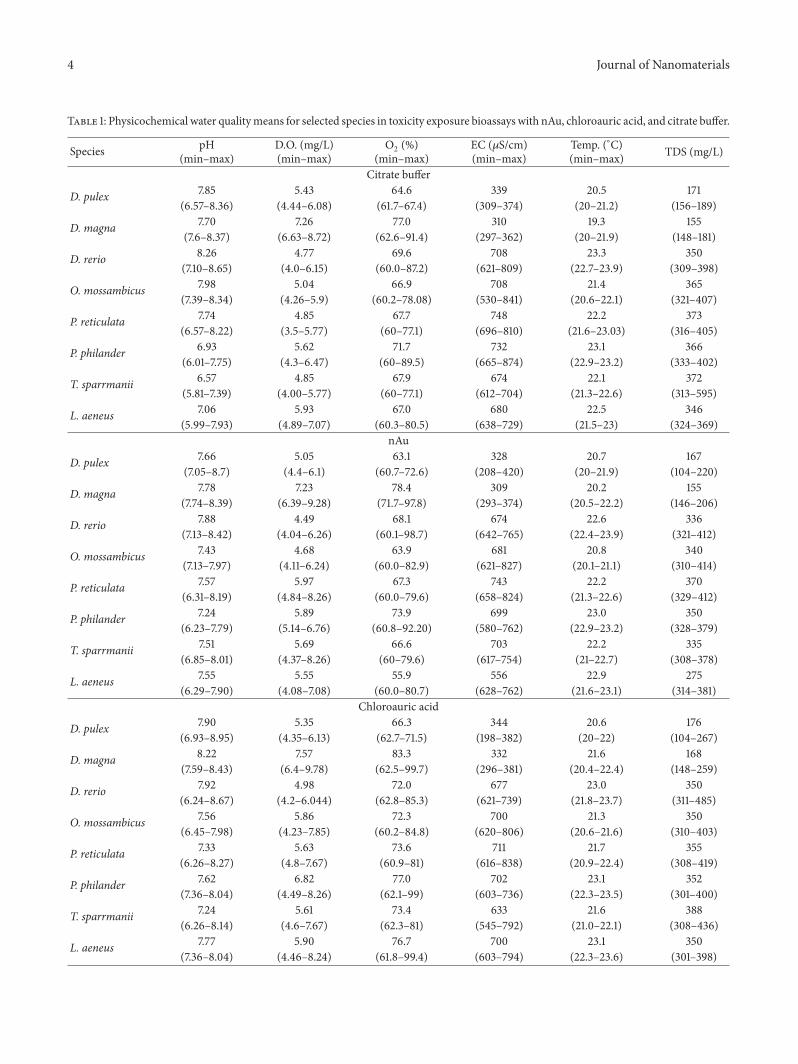
3.1. Physicochemical Water Parameters. The physicochemi-cal water parameters were maintained within the OECDguidelines [38] as shown in Table 1. The temperature rangedbetween 20 and 23.9∘C across all exposures; the pH wasmaintained between 7 and 8 but had a minimum of 6.24 anda maximum of 8.95 for chloroauric acid exposures. The DOconcentration ranged between 4.44mg/L and 9.78mg/L andas previously discussed the oxygen percentage (O
2%) was
well maintained above 60% according to standard protocol.The Daphnia medium had a lower EC and TDS whencompared to the fish medium. This was expected as thereconstituted water is made up of different salts at higherconcentrations. The EC ranged between 198 and 420 𝜇S/cmfor the Daphnia medium and 621 and 809𝜇S/cm for the fishmedium. The TDS ranged between 104 and 267mg/L for theDaphnia medium, while for the fish medium the range wasbetween 309 and 485mg/L.
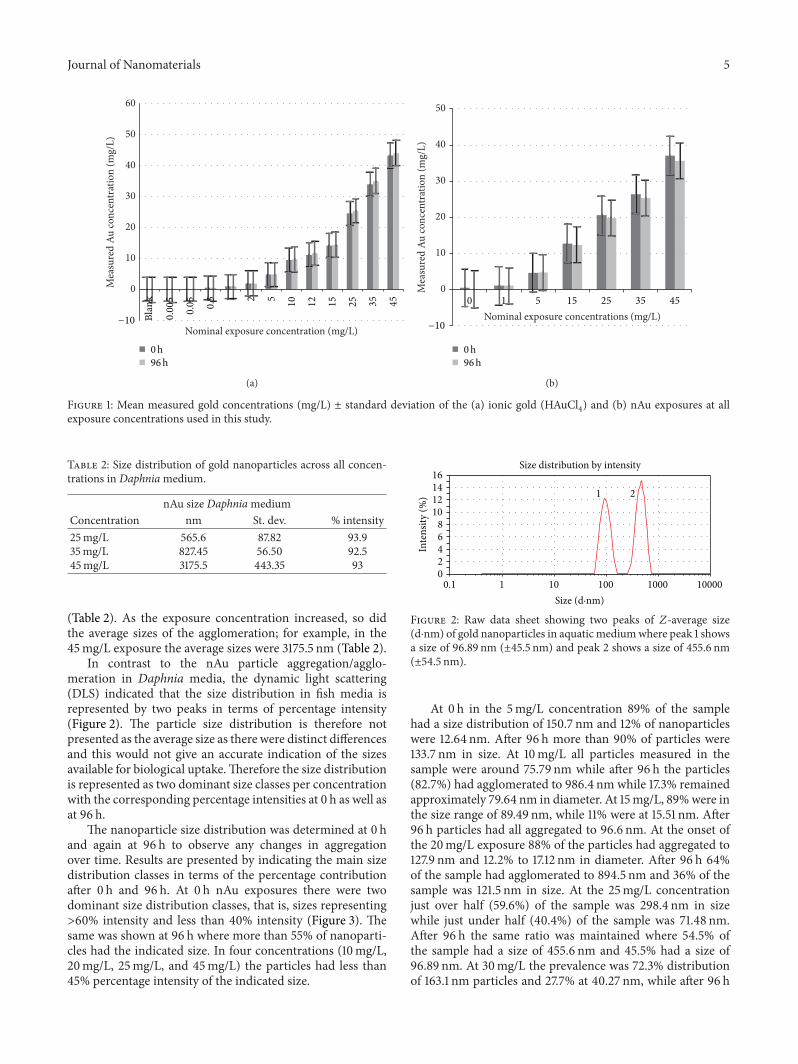
3.2. Nanoparticle Exposure Concentration. To verify the con-centrations added to each exposure group, total gold concen-trations were measured. The nominal ionic gold concentra-tions and measured concentrations were in close agreement(Figure 1). After a 48 h and 96 h period the concentrationswere maintained within the start concentration limits. Thetotal gold concentrations in the nAu exposures showed upto a 20% difference between nominal and measured goldconcentrations.
3.3. Particle Size Distribution. The largest proportion of nAu(i.e., >90%) in the Daphnia medium across all exposureconcentrations showed agglomerations greater than 566 nm
4 Journal of Nanomaterials
Table 1: Physicochemical water qualitymeans for selected species in toxicity exposure bioassays with nAu, chloroauric acid, and citrate buffer.
Species pH(min–max)
D.O. (mg/L)(min–max)
O2 (%)(min–max)
EC (𝜇S/cm)(min–max)
Temp. (∘C)(min–max) TDS (mg/L)
Citrate buffer
D. pulex 7.85 5.43 64.6 339 20.5 171(6.57–8.36) (4.44–6.08) (61.7–67.4) (309–374) (20–21.2) (156–189)
D. magna 7.70 7.26 77.0 310 19.3 155(7.6–8.37) (6.63–8.72) (62.6–91.4) (297–362) (20–21.9) (148–181)
D. rerio 8.26 4.77 69.6 708 23.3 350(7.10–8.65) (4.0–6.15) (60.0–87.2) (621–809) (22.7–23.9) (309–398)
O. mossambicus 7.98 5.04 66.9 708 21.4 365(7.39–8.34) (4.26–5.9) (60.2–78.08) (530–841) (20.6–22.1) (321–407)
P. reticulata 7.74 4.85 67.7 748 22.2 373(6.57–8.22) (3.5–5.77) (60–77.1) (696–810) (21.6–23.03) (316–405)
P. philander 6.93 5.62 71.7 732 23.1 366(6.01–7.75) (4.3–6.47) (60–89.5) (665–874) (22.9–23.2) (333–402)
T. sparrmanii 6.57 4.85 67.9 674 22.1 372(5.81–7.39) (4.00–5.77) (60–77.1) (612–704) (21.3–22.6) (313–595)
L. aeneus 7.06 5.93 67.0 680 22.5 346(5.99–7.93) (4.89–7.07) (60.3–80.5) (638–729) (21.5–23) (324–369)
nAu
D. pulex 7.66 5.05 63.1 328 20.7 167(7.05–8.7) (4.4–6.1) (60.7–72.6) (208–420) (20–21.9) (104–220)
D. magna 7.78 7.23 78.4 309 20.2 155(7.74–8.39) (6.39–9.28) (71.7–97.8) (293–374) (20.5–22.2) (146–206)
D. rerio 7.88 4.49 68.1 674 22.6 336(7.13–8.42) (4.04–6.26) (60.1–98.7) (642–765) (22.4–23.9) (321–412)
O. mossambicus 7.43 4.68 63.9 681 20.8 340(7.13–7.97) (4.11–6.24) (60.0–82.9) (621–827) (20.1–21.1) (310–414)
P. reticulata 7.57 5.97 67.3 743 22.2 370(6.31–8.19) (4.84–8.26) (60.0–79.6) (658–824) (21.3–22.6) (329–412)
P. philander 7.24 5.89 73.9 699 23.0 350(6.23–7.79) (5.14–6.76) (60.8–92.20) (580–762) (22.9–23.2) (328–379)
T. sparrmanii 7.51 5.69 66.6 703 22.2 335(6.85–8.01) (4.37–8.26) (60–79.6) (617–754) (21–22.7) (308–378)
L. aeneus 7.55 5.55 55.9 556 22.9 275(6.29–7.90) (4.08–7.08) (60.0–80.7) (628–762) (21.6–23.1) (314–381)
Chloroauric acid
D. pulex 7.90 5.35 66.3 344 20.6 176(6.93–8.95) (4.35–6.13) (62.7–71.5) (198–382) (20–22) (104–267)
D. magna 8.22 7.57 83.3 332 21.6 168(7.59–8.43) (6.4–9.78) (62.5–99.7) (296–381) (20.4–22.4) (148–259)
D. rerio 7.92 4.98 72.0 677 23.0 350(6.24–8.67) (4.2–6.044) (62.8–85.3) (621–739) (21.8–23.7) (311–485)
O. mossambicus 7.56 5.86 72.3 700 21.3 350(6.45–7.98) (4.23–7.85) (60.2–84.8) (620–806) (20.6–21.6) (310–403)
P. reticulata 7.33 5.63 73.6 711 21.7 355(6.26–8.27) (4.8–7.67) (60.9–81) (616–838) (20.9–22.4) (308–419)
P. philander 7.62 6.82 77.0 702 23.1 352(7.36–8.04) (4.49–8.26) (62.1–99) (603–736) (22.3–23.5) (301–400)
T. sparrmanii 7.24 5.61 73.4 633 21.6 388(6.26–8.14) (4.6–7.67) (62.3–81) (545–792) (21.0–22.1) (308–436)
L. aeneus 7.77 5.90 76.7 700 23.1 350(7.36–8.04) (4.46–8.24) (61.8–99.4) (603–794) (22.3–23.6) (301–398)
Journal of Nanomaterials 5
0
10
20
30
40
50
60M
easu
red
Au co
ncen
trat
ion
(mg/
L)
Nominal exposure concentration (mg/L)−10 Bl
ank
0.005
0.05
0.5 1 2 5
10
12
15
25
35
45
0h96h
(a)
0
10
20
30
40
50
Mea
sure
d Au
conc
entr
atio
n (m
g/L)
Nominal exposure concentrations (mg/L)−10
0 1 5 15 25 35 45
0h96h
(b)
Figure 1: Mean measured gold concentrations (mg/L) ± standard deviation of the (a) ionic gold (HAuCl4) and (b) nAu exposures at all
exposure concentrations used in this study.
Table 2: Size distribution of gold nanoparticles across all concen-trations in Daphniamedium.
nAu size DaphniamediumConcentration nm St. dev. % intensity25mg/L 565.6 87.82 93.935mg/L 827.45 56.50 92.545mg/L 3175.5 443.35 93
(Table 2). As the exposure concentration increased, so didthe average sizes of the agglomeration; for example, in the45mg/L exposure the average sizes were 3175.5 nm (Table 2).
In contrast to the nAu particle aggregation/agglo-meration in Daphnia media, the dynamic light scattering(DLS) indicated that the size distribution in fish media isrepresented by two peaks in terms of percentage intensity(Figure 2). The particle size distribution is therefore notpresented as the average size as there were distinct differencesand this would not give an accurate indication of the sizesavailable for biological uptake.Therefore the size distributionis represented as two dominant size classes per concentrationwith the corresponding percentage intensities at 0 h as well asat 96 h.
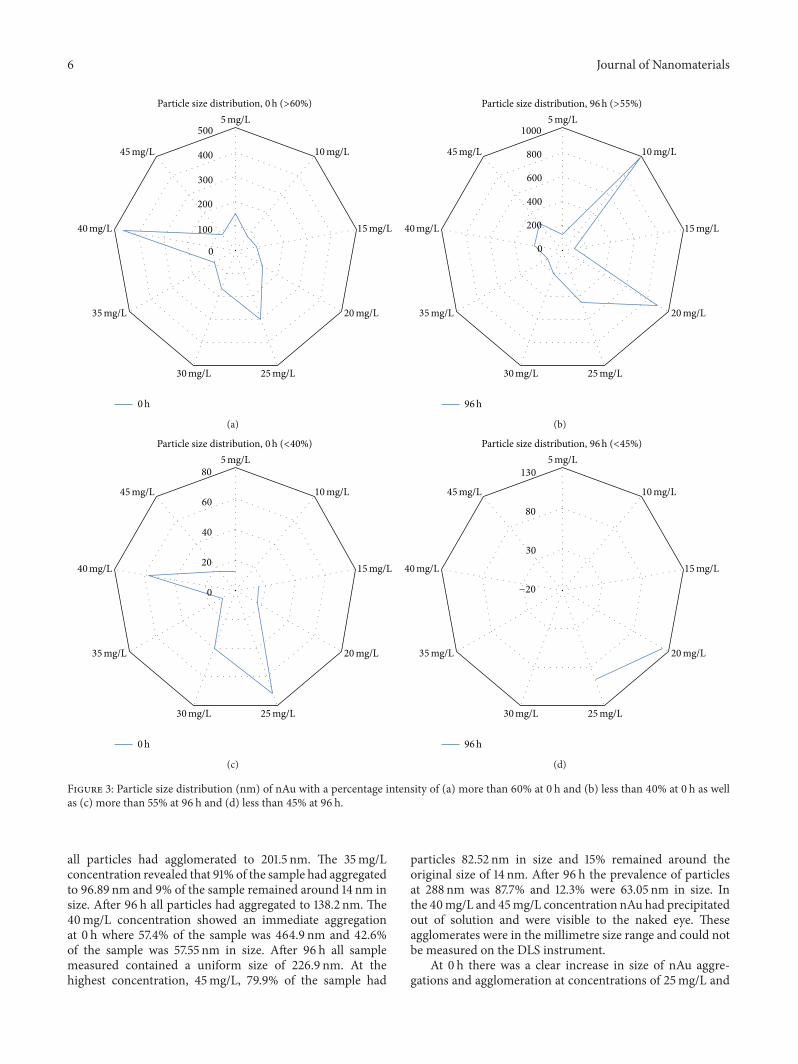
The nanoparticle size distribution was determined at 0 hand again at 96 h to observe any changes in aggregationover time. Results are presented by indicating the main sizedistribution classes in terms of the percentage contributionafter 0 h and 96 h. At 0 h nAu exposures there were twodominant size distribution classes, that is, sizes representing>60% intensity and less than 40% intensity (Figure 3). Thesame was shown at 96 h where more than 55% of nanoparti-cles had the indicated size. In four concentrations (10mg/L,20mg/L, 25mg/L, and 45mg/L) the particles had less than45% percentage intensity of the indicated size.
16
14
12
10
8
6
4
2
0
0.1 1 10 100 1000 10000
Inte
nsity
(%) 1 2
Size distribution by intensity
Size (d·nm)
Figure 2: Raw data sheet showing two peaks of 𝑍-average size(d⋅nm) of gold nanoparticles in aquatic mediumwhere peak 1 showsa size of 96.89 nm (±45.5 nm) and peak 2 shows a size of 455.6 nm(±54.5 nm).
At 0 h in the 5mg/L concentration 89% of the samplehad a size distribution of 150.7 nm and 12% of nanoparticleswere 12.64 nm. After 96 h more than 90% of particles were133.7 nm in size. At 10mg/L all particles measured in thesample were around 75.79 nm while after 96 h the particles(82.7%) had agglomerated to 986.4 nm while 17.3% remainedapproximately 79.64 nm in diameter. At 15mg/L, 89%were inthe size range of 89.49 nm, while 11% were at 15.51 nm. After96 h particles had all aggregated to 96.6 nm. At the onset ofthe 20mg/L exposure 88% of the particles had aggregated to127.9 nm and 12.2% to 17.12 nm in diameter. After 96 h 64%of the sample had agglomerated to 894.5 nm and 36% of thesample was 121.5 nm in size. At the 25mg/L concentrationjust over half (59.6%) of the sample was 298.4 nm in sizewhile just under half (40.4%) of the sample was 71.48 nm.After 96 h the same ratio was maintained where 54.5% ofthe sample had a size of 455.6 nm and 45.5% had a size of96.89 nm. At 30mg/L the prevalence was 72.3% distributionof 163.1 nm particles and 27.7% at 40.27 nm, while after 96 h
6 Journal of Nanomaterials
500
400
300
200
100
0
5mg/L
10mg/L
15mg/L
20mg/L
25mg/L30mg/L
35mg/L
40mg/L
45mg/L
0h
Particle size distribution, 0h (>60%)
(a)
5mg/L
10mg/L
15mg/L
20mg/L
25mg/L30mg/L
35mg/L
40mg/L
45mg/L
1000
800
600
400
200
0
96h
Particle size distribution, 96h (>55%)
(b)
5mg/L
10mg/L
15mg/L
20mg/L
25mg/L30mg/L
35mg/L
40mg/L
45mg/L
80
60
40
20
0
0h
Particle size distribution, 0h (<40%)
(c)
5mg/L
10mg/L
15mg/L
20mg/L
25mg/L30mg/L
35mg/L
40mg/L
45mg/L
130
80
30
−20
96h
Particle size distribution, 96h (<45%)
(d)
Figure 3: Particle size distribution (nm) of nAu with a percentage intensity of (a) more than 60% at 0 h and (b) less than 40% at 0 h as wellas (c) more than 55% at 96 h and (d) less than 45% at 96 h.
all particles had agglomerated to 201.5 nm. The 35mg/Lconcentration revealed that 91% of the sample had aggregatedto 96.89 nm and 9% of the sample remained around 14 nm insize. After 96 h all particles had aggregated to 138.2 nm. The40mg/L concentration showed an immediate aggregationat 0 h where 57.4% of the sample was 464.9 nm and 42.6%of the sample was 57.55 nm in size. After 96 h all samplemeasured contained a uniform size of 226.9 nm. At thehighest concentration, 45mg/L, 79.9% of the sample had
particles 82.52 nm in size and 15% remained around theoriginal size of 14 nm. After 96 h the prevalence of particlesat 288 nm was 87.7% and 12.3% were 63.05 nm in size. Inthe 40mg/L and 45mg/L concentration nAu had precipitatedout of solution and were visible to the naked eye. Theseagglomerates were in the millimetre size range and could notbe measured on the DLS instrument.
At 0 h there was a clear increase in size of nAu aggre-gations and agglomeration at concentrations of 25mg/L and
Journal of Nanomaterials 7
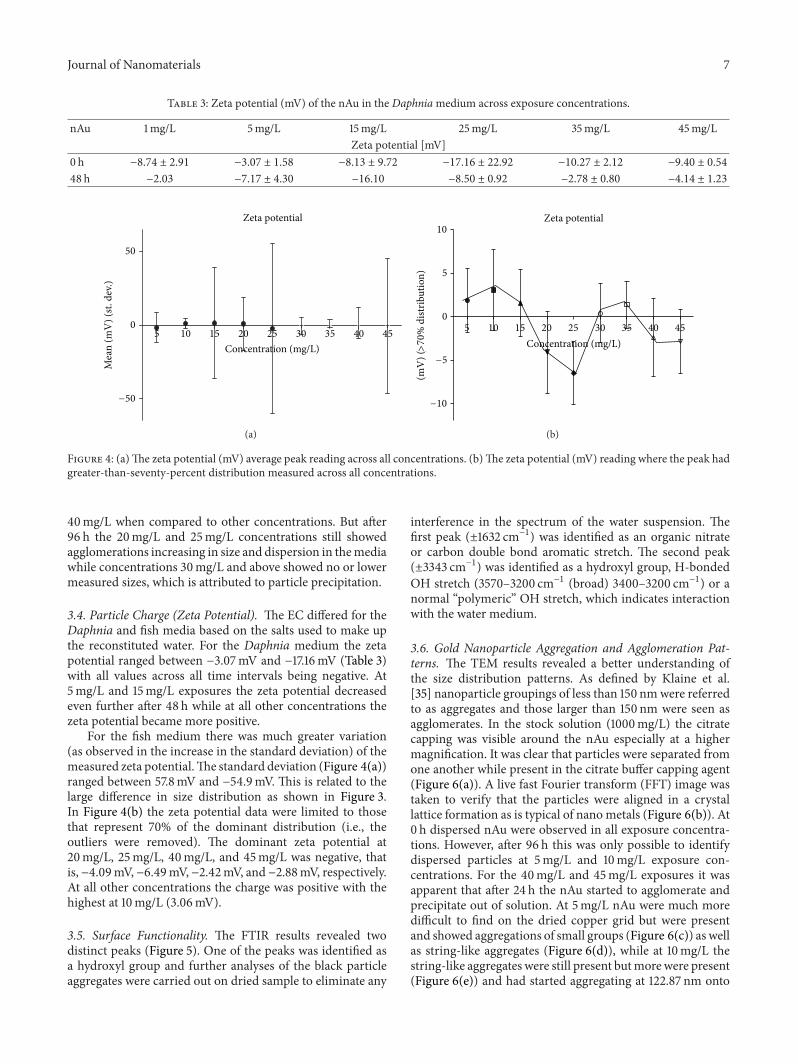
Table 3: Zeta potential (mV) of the nAu in the Daphniamedium across exposure concentrations.
nAu 1mg/L 5mg/L 15mg/L 25mg/L 35mg/L 45mg/LZeta potential [mV]
0 h −8.74 ± 2.91 −3.07 ± 1.58 −8.13 ± 9.72 −17.16 ± 22.92 −10.27 ± 2.12 −9.40 ± 0.54
48 h −2.03 −7.17 ± 4.30 −16.10 −8.50 ± 0.92 −2.78 ± 0.80 −4.14 ± 1.23
Zeta potential
50
0
−50
5 10 15 20 25 30 35 40 45
Concentration (mg/L)
Mea
n (m
V) (
st. d
ev.)
(a)
5 10 15 20 25 30 35 40 45
Concentration (mg/L)
10
5
0
−5
−10
Zeta potential
(mV
) (>70
% d
istrib
utio
n)(b)
Figure 4: (a)The zeta potential (mV) average peak reading across all concentrations. (b)The zeta potential (mV) reading where the peak hadgreater-than-seventy-percent distribution measured across all concentrations.
40mg/L when compared to other concentrations. But after96 h the 20mg/L and 25mg/L concentrations still showedagglomerations increasing in size and dispersion in themediawhile concentrations 30mg/L and above showed no or lowermeasured sizes, which is attributed to particle precipitation.
3.4. Particle Charge (Zeta Potential). The EC differed for theDaphnia and fish media based on the salts used to make upthe reconstituted water. For the Daphnia medium the zetapotential ranged between −3.07mV and −17.16mV (Table 3)with all values across all time intervals being negative. At5mg/L and 15mg/L exposures the zeta potential decreasedeven further after 48 h while at all other concentrations thezeta potential became more positive.
For the fish medium there was much greater variation(as observed in the increase in the standard deviation) of themeasured zeta potential.The standard deviation (Figure 4(a))ranged between 57.8mV and −54.9mV. This is related to thelarge difference in size distribution as shown in Figure 3.In Figure 4(b) the zeta potential data were limited to thosethat represent 70% of the dominant distribution (i.e., theoutliers were removed). The dominant zeta potential at20mg/L, 25mg/L, 40mg/L, and 45mg/L was negative, thatis, −4.09mV, −6.49mV, −2.42mV, and −2.88mV, respectively.At all other concentrations the charge was positive with thehighest at 10mg/L (3.06mV).
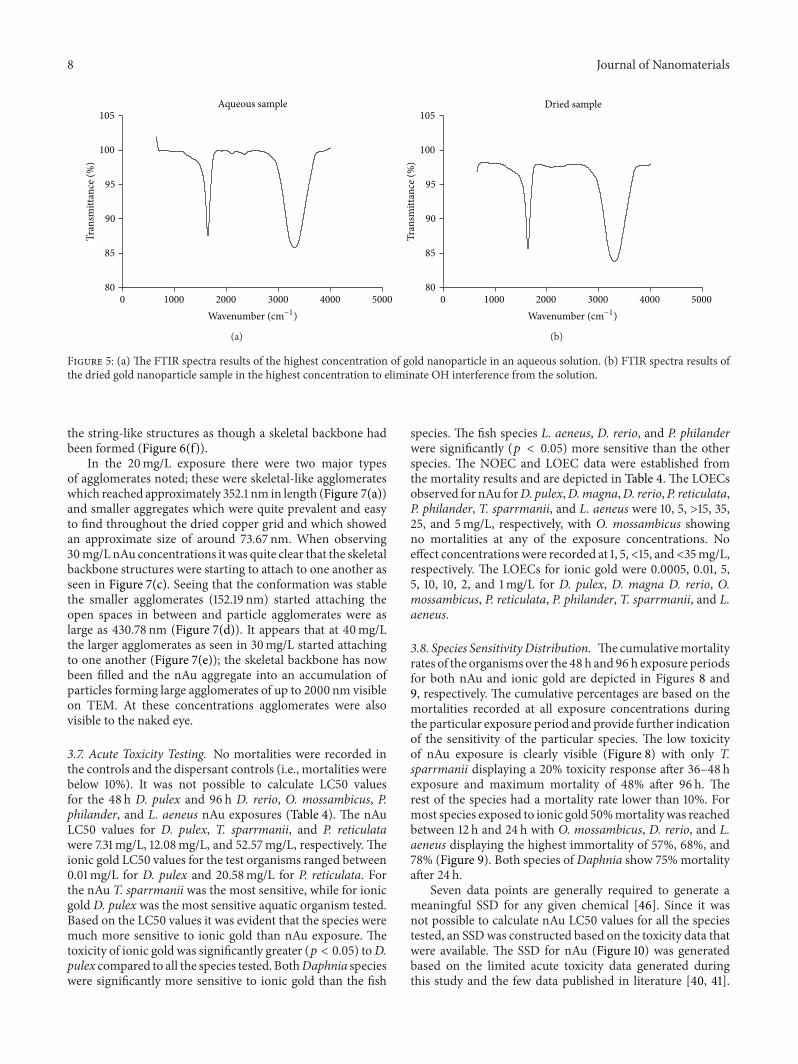
3.5. Surface Functionality. The FTIR results revealed twodistinct peaks (Figure 5). One of the peaks was identified asa hydroxyl group and further analyses of the black particleaggregates were carried out on dried sample to eliminate any
interference in the spectrum of the water suspension. Thefirst peak (±1632 cm−1) was identified as an organic nitrateor carbon double bond aromatic stretch. The second peak(±3343 cm−1) was identified as a hydroxyl group, H-bondedOH stretch (3570–3200 cm−1 (broad) 3400–3200 cm−1) or anormal “polymeric” OH stretch, which indicates interactionwith the water medium.
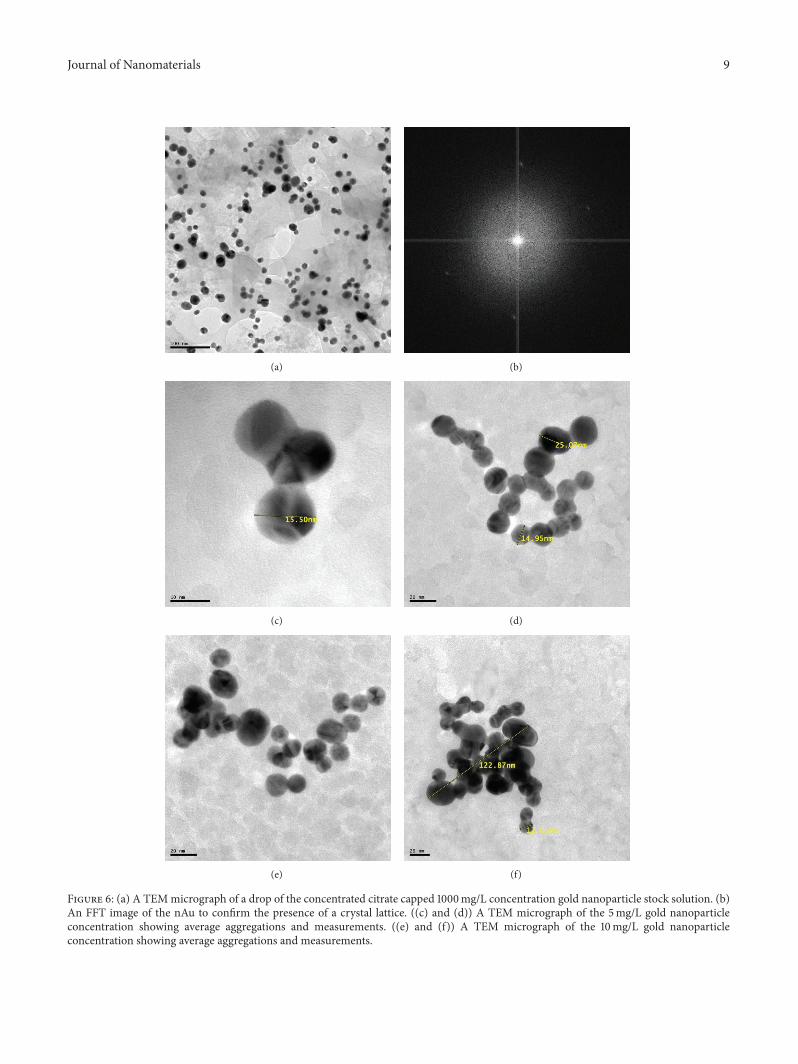
3.6. Gold Nanoparticle Aggregation and Agglomeration Pat-terns. The TEM results revealed a better understanding ofthe size distribution patterns. As defined by Klaine et al.[35] nanoparticle groupings of less than 150 nmwere referredto as aggregates and those larger than 150 nm were seen asagglomerates. In the stock solution (1000mg/L) the citratecapping was visible around the nAu especially at a highermagnification. It was clear that particles were separated fromone another while present in the citrate buffer capping agent(Figure 6(a)). A live fast Fourier transform (FFT) image wastaken to verify that the particles were aligned in a crystallattice formation as is typical of nanometals (Figure 6(b)). At0 h dispersed nAu were observed in all exposure concentra-tions. However, after 96 h this was only possible to identifydispersed particles at 5mg/L and 10mg/L exposure con-centrations. For the 40mg/L and 45mg/L exposures it wasapparent that after 24 h the nAu started to agglomerate andprecipitate out of solution. At 5mg/L nAu were much moredifficult to find on the dried copper grid but were presentand showed aggregations of small groups (Figure 6(c)) as wellas string-like aggregates (Figure 6(d)), while at 10mg/L thestring-like aggregates were still present butmorewere present(Figure 6(e)) and had started aggregating at 122.87 nm onto
8 Journal of Nanomaterials
105
100
95
90
85
80
0 1000 2000 3000 4000 5000
Tran
smitt
ance
(%)
Wavenumber (cm−1)
Aqueous sample
(a)
105
100
95
90
85
80
0 1000 2000 3000 4000 5000
Tran
smitt
ance
(%)
Wavenumber (cm−1)
Dried sample
(b)
Figure 5: (a) The FTIR spectra results of the highest concentration of gold nanoparticle in an aqueous solution. (b) FTIR spectra results ofthe dried gold nanoparticle sample in the highest concentration to eliminate OH interference from the solution.
the string-like structures as though a skeletal backbone hadbeen formed (Figure 6(f)).
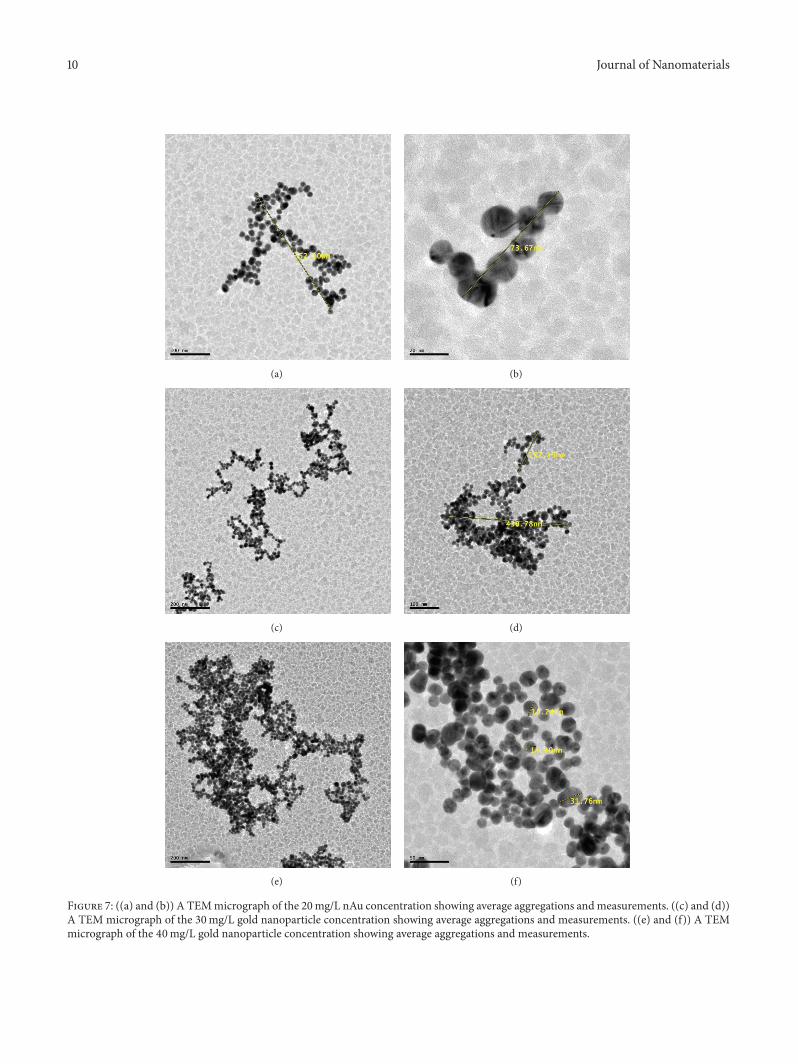
In the 20mg/L exposure there were two major typesof agglomerates noted; these were skeletal-like agglomerateswhich reached approximately 352.1 nm in length (Figure 7(a))and smaller aggregates which were quite prevalent and easyto find throughout the dried copper grid and which showedan approximate size of around 73.67 nm. When observing30mg/L nAu concentrations it was quite clear that the skeletalbackbone structures were starting to attach to one another asseen in Figure 7(c). Seeing that the conformation was stablethe smaller agglomerates (152.19 nm) started attaching theopen spaces in between and particle agglomerates were aslarge as 430.78 nm (Figure 7(d)). It appears that at 40mg/Lthe larger agglomerates as seen in 30mg/L started attachingto one another (Figure 7(e)); the skeletal backbone has nowbeen filled and the nAu aggregate into an accumulation ofparticles forming large agglomerates of up to 2000 nm visibleon TEM. At these concentrations agglomerates were alsovisible to the naked eye.
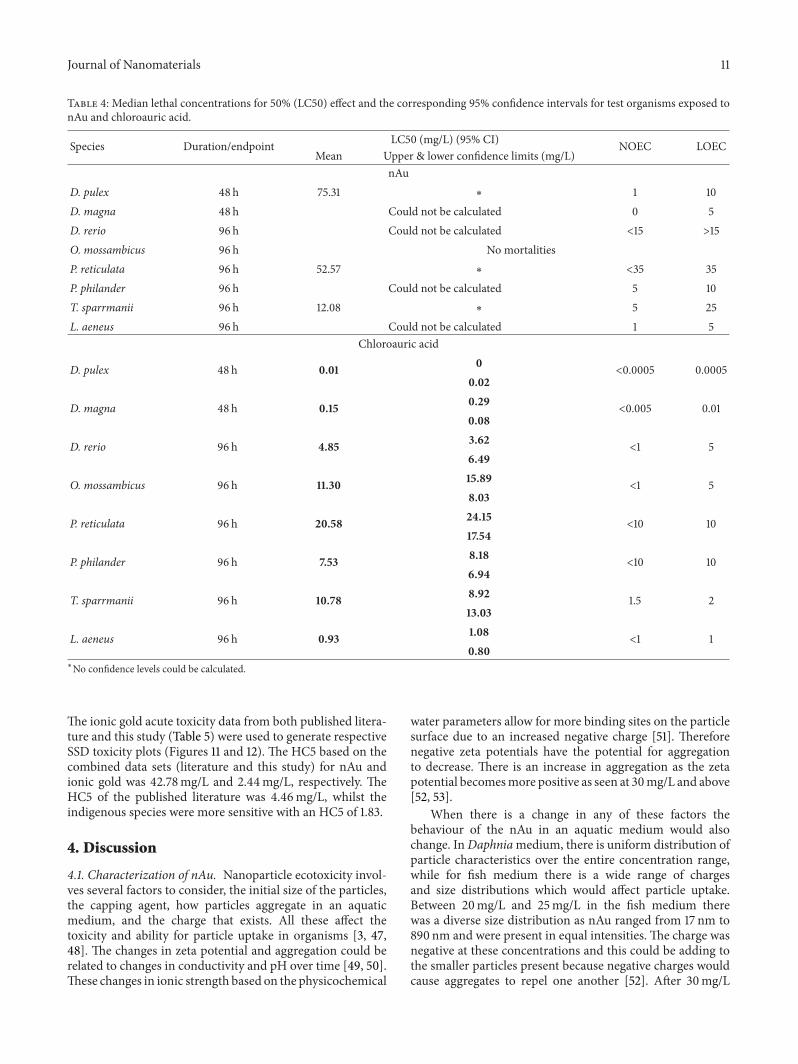
3.7. Acute Toxicity Testing. No mortalities were recorded inthe controls and the dispersant controls (i.e., mortalities werebelow 10%). It was not possible to calculate LC50 valuesfor the 48 h D. pulex and 96 h D. rerio, O. mossambicus, P.philander, and L. aeneus nAu exposures (Table 4). The nAuLC50 values for D. pulex, T. sparrmanii, and P. reticulatawere 7.31mg/L, 12.08mg/L, and 52.57mg/L, respectively. Theionic gold LC50 values for the test organisms ranged between0.01mg/L for D. pulex and 20.58mg/L for P. reticulata. Forthe nAu T. sparrmanii was the most sensitive, while for ionicgold D. pulex was the most sensitive aquatic organism tested.Based on the LC50 values it was evident that the species weremuch more sensitive to ionic gold than nAu exposure. Thetoxicity of ionic gold was significantly greater (𝑝 < 0.05) toD.pulex compared to all the species tested. BothDaphnia specieswere significantly more sensitive to ionic gold than the fish
species. The fish species L. aeneus, D. rerio, and P. philanderwere significantly (𝑝 < 0.05) more sensitive than the otherspecies. The NOEC and LOEC data were established fromthe mortality results and are depicted in Table 4. The LOECsobserved for nAu forD. pulex,D.magna,D. rerio,P. reticulata,P. philander, T. sparrmanii, and L. aeneus were 10, 5, >15, 35,25, and 5mg/L, respectively, with O. mossambicus showingno mortalities at any of the exposure concentrations. Noeffect concentrationswere recorded at 1, 5,<15, and<35mg/L,respectively. The LOECs for ionic gold were 0.0005, 0.01, 5,5, 10, 10, 2, and 1mg/L for D. pulex, D. magna D. rerio, O.mossambicus, P. reticulata, P. philander, T. sparrmanii, and L.aeneus.
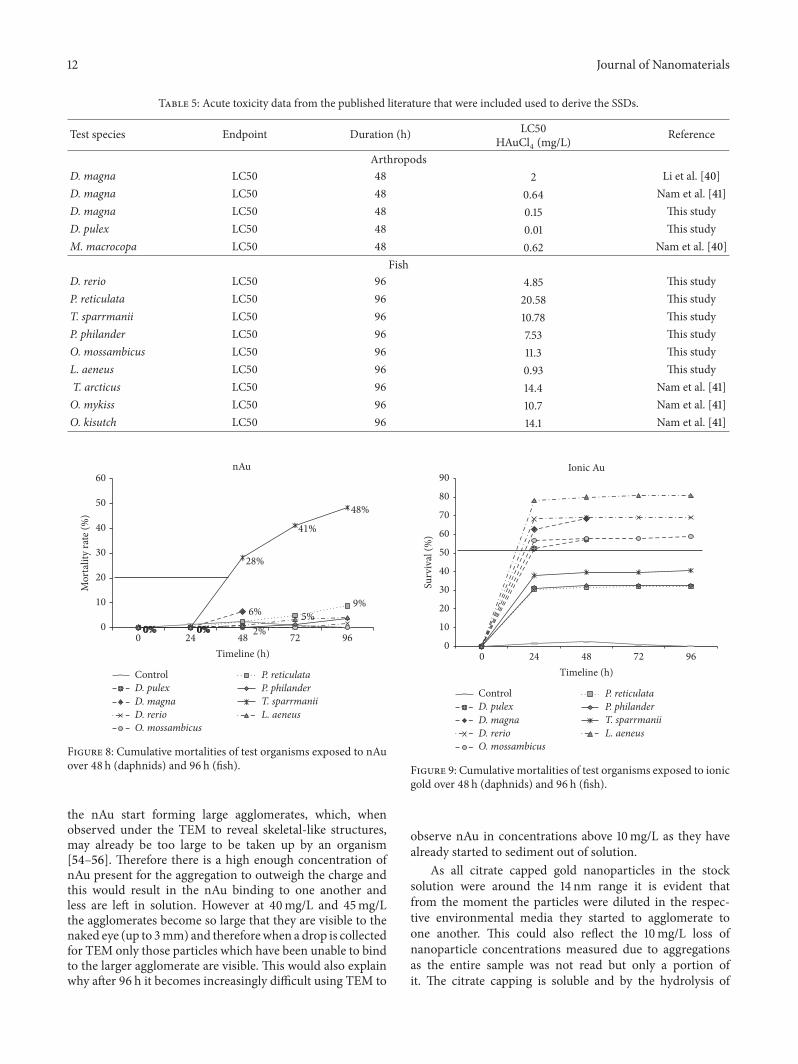
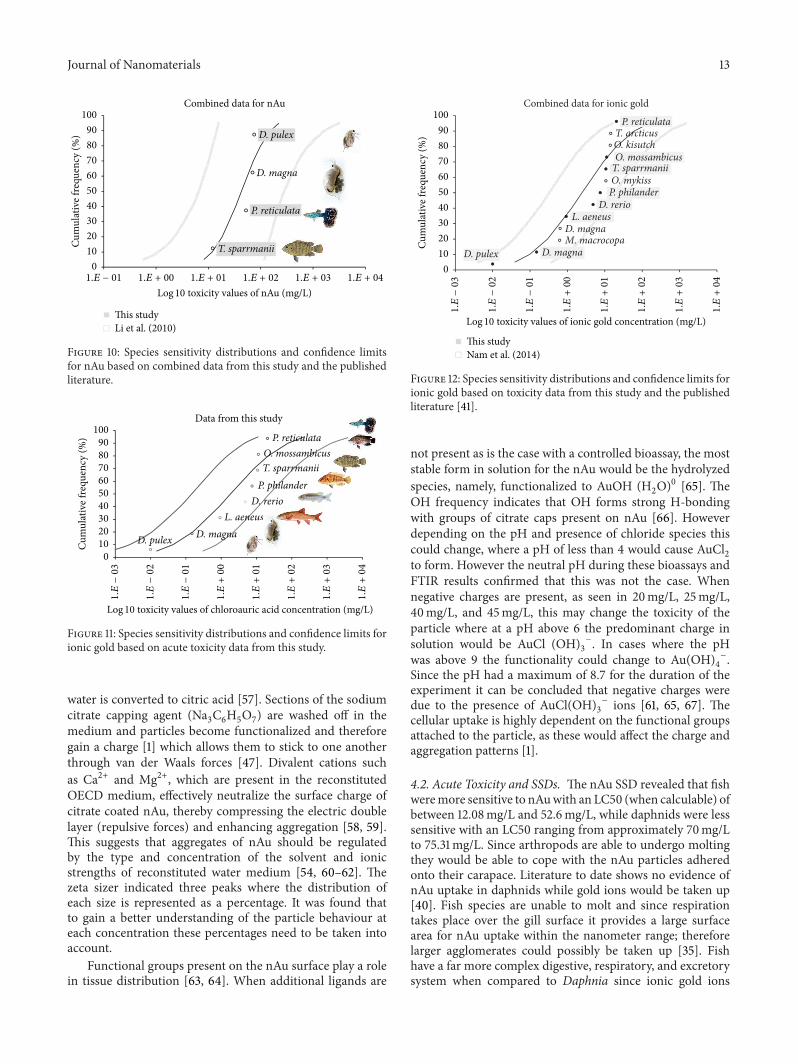
3.8. Species SensitivityDistribution. Thecumulativemortalityrates of the organisms over the 48 h and 96 h exposure periodsfor both nAu and ionic gold are depicted in Figures 8 and9, respectively. The cumulative percentages are based on themortalities recorded at all exposure concentrations duringthe particular exposure period and provide further indicationof the sensitivity of the particular species. The low toxicityof nAu exposure is clearly visible (Figure 8) with only T.sparrmanii displaying a 20% toxicity response after 36–48 hexposure and maximum mortality of 48% after 96 h. Therest of the species had a mortality rate lower than 10%. Formost species exposed to ionic gold 50%mortalitywas reachedbetween 12 h and 24 h with O. mossambicus, D. rerio, and L.aeneus displaying the highest immortality of 57%, 68%, and78% (Figure 9). Both species of Daphnia show 75% mortalityafter 24 h.
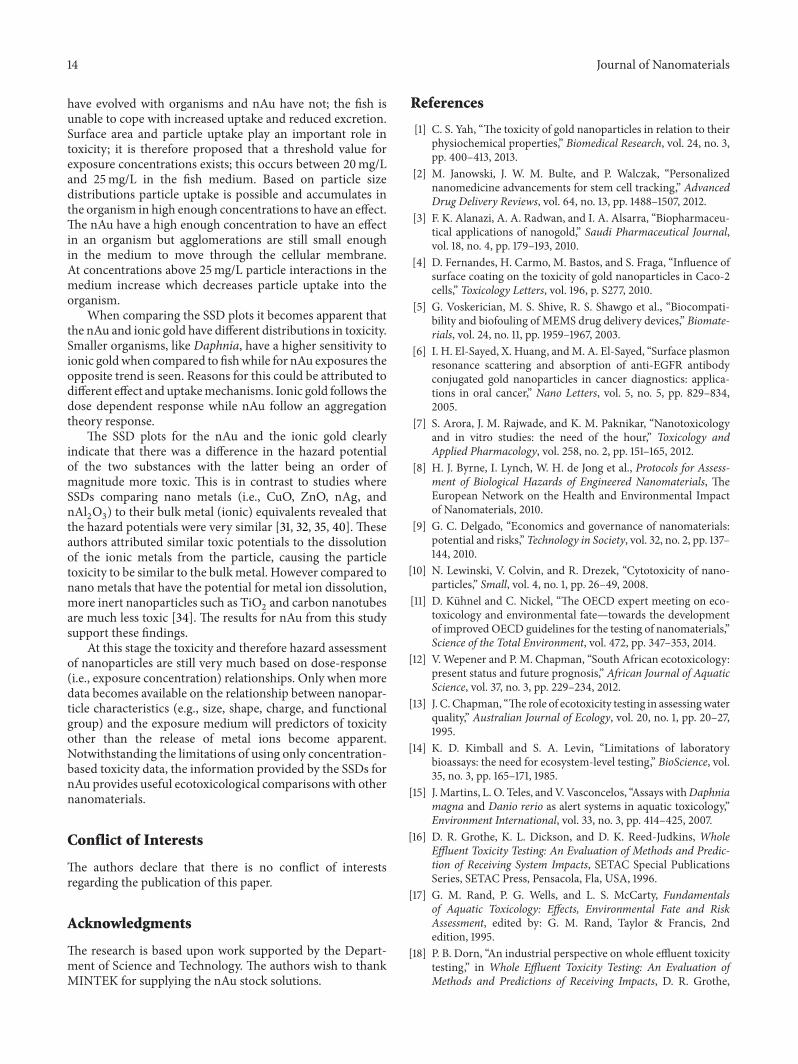
Seven data points are generally required to generate ameaningful SSD for any given chemical [46]. Since it wasnot possible to calculate nAu LC50 values for all the speciestested, an SSDwas constructed based on the toxicity data thatwere available. The SSD for nAu (Figure 10) was generatedbased on the limited acute toxicity data generated duringthis study and the few data published in literature [40, 41].
Journal of Nanomaterials 9
(a) (b)
(c) (d)
(e) (f)
Figure 6: (a) A TEMmicrograph of a drop of the concentrated citrate capped 1000mg/L concentration gold nanoparticle stock solution. (b)An FFT image of the nAu to confirm the presence of a crystal lattice. ((c) and (d)) A TEM micrograph of the 5mg/L gold nanoparticleconcentration showing average aggregations and measurements. ((e) and (f)) A TEM micrograph of the 10mg/L gold nanoparticleconcentration showing average aggregations and measurements.
10 Journal of Nanomaterials
(a) (b)
(c) (d)
(e) (f)
Figure 7: ((a) and (b)) A TEMmicrograph of the 20mg/L nAu concentration showing average aggregations andmeasurements. ((c) and (d))A TEM micrograph of the 30mg/L gold nanoparticle concentration showing average aggregations and measurements. ((e) and (f)) A TEMmicrograph of the 40mg/L gold nanoparticle concentration showing average aggregations and measurements.
Journal of Nanomaterials 11
Table 4: Median lethal concentrations for 50% (LC50) effect and the corresponding 95% confidence intervals for test organisms exposed tonAu and chloroauric acid.
Species Duration/endpoint LC50 (mg/L) (95% CI) NOEC LOECMean Upper & lower confidence limits (mg/L)
nAuD. pulex 48 h 75.31 ∗ 1 10D. magna 48 h Could not be calculated 0 5D. rerio 96 h Could not be calculated <15 >15O. mossambicus 96 h No mortalitiesP. reticulata 96 h 52.57 ∗ <35 35P. philander 96 h Could not be calculated 5 10T. sparrmanii 96 h 12.08 ∗ 5 25L. aeneus 96 h Could not be calculated 1 5
Chloroauric acid
D. pulex 48 h 0.01 0<0.0005 0.0005
0.02
D. magna 48 h 0.15 0.29<0.005 0.01
0.08
D. rerio 96 h 4.85 3.62<1 5
6.49
O. mossambicus 96 h 11.30 15.89<1 5
8.03
P. reticulata 96 h 20.58 24.15<10 10
17.54
P. philander 96 h 7.53 8.18<10 10
6.94
T. sparrmanii 96 h 10.78 8.92 1.5 213.03
L. aeneus 96 h 0.93 1.08<1 1
0.80∗No confidence levels could be calculated.
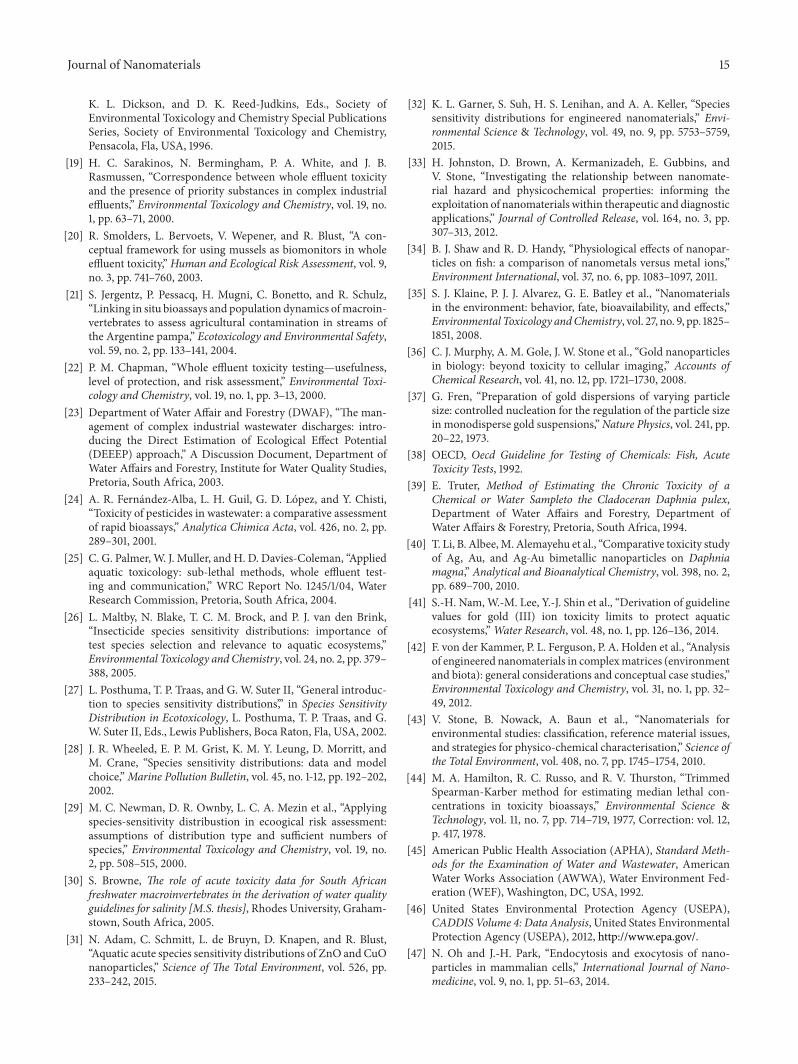
The ionic gold acute toxicity data from both published litera-ture and this study (Table 5) were used to generate respectiveSSD toxicity plots (Figures 11 and 12). The HC5 based on thecombined data sets (literature and this study) for nAu andionic gold was 42.78mg/L and 2.44mg/L, respectively. TheHC5 of the published literature was 4.46mg/L, whilst theindigenous species were more sensitive with an HC5 of 1.83.
4. Discussion
4.1. Characterization of nAu. Nanoparticle ecotoxicity invol-ves several factors to consider, the initial size of the particles,the capping agent, how particles aggregate in an aquaticmedium, and the charge that exists. All these affect thetoxicity and ability for particle uptake in organisms [3, 47,48]. The changes in zeta potential and aggregation could berelated to changes in conductivity and pH over time [49, 50].These changes in ionic strength based on the physicochemical
water parameters allow for more binding sites on the particlesurface due to an increased negative charge [51]. Thereforenegative zeta potentials have the potential for aggregationto decrease. There is an increase in aggregation as the zetapotential becomesmore positive as seen at 30mg/L and above[52, 53].
When there is a change in any of these factors thebehaviour of the nAu in an aquatic medium would alsochange. InDaphniamedium, there is uniform distribution ofparticle characteristics over the entire concentration range,while for fish medium there is a wide range of chargesand size distributions which would affect particle uptake.Between 20mg/L and 25mg/L in the fish medium therewas a diverse size distribution as nAu ranged from 17 nm to890 nm and were present in equal intensities. The charge wasnegative at these concentrations and this could be adding tothe smaller particles present because negative charges wouldcause aggregates to repel one another [52]. After 30mg/L
12 Journal of Nanomaterials
Table 5: Acute toxicity data from the published literature that were included used to derive the SSDs.
Test species Endpoint Duration (h) LC50HAuCl4 (mg/L) Reference
ArthropodsD. magna LC50 48 2 Li et al. [40]D. magna LC50 48 0.64 Nam et al. [41]D. magna LC50 48 0.15 This studyD. pulex LC50 48 0.01 This studyM. macrocopa LC50 48 0.62 Nam et al. [40]
FishD. rerio LC50 96 4.85 This studyP. reticulata LC50 96 20.58 This studyT. sparrmanii LC50 96 10.78 This studyP. philander LC50 96 7.53 This studyO. mossambicus LC50 96 11.3 This studyL. aeneus LC50 96 0.93 This studyT. arcticus LC50 96 14.4 Nam et al. [41]O. mykiss LC50 96 10.7 Nam et al. [41]O. kisutch LC50 96 14.1 Nam et al. [41]
0% 0%6%
0% 0% 2%5%
9%
0% 0%
28%
41%
48%
0
10
20
30
40
50
60
0 24 48 72 96
Mor
talit
y ra
te (%
)
Timeline (h)
nAu
ControlD. pulexD. magnaD. rerioO. mossambicus
P. reticulataP. philanderT. sparrmaniiL. aeneus
Figure 8: Cumulative mortalities of test organisms exposed to nAuover 48 h (daphnids) and 96 h (fish).
the nAu start forming large agglomerates, which, whenobserved under the TEM to reveal skeletal-like structures,may already be too large to be taken up by an organism[54–56]. Therefore there is a high enough concentration ofnAu present for the aggregation to outweigh the charge andthis would result in the nAu binding to one another andless are left in solution. However at 40mg/L and 45mg/Lthe agglomerates become so large that they are visible to thenaked eye (up to 3mm) and thereforewhen a drop is collectedfor TEM only those particles which have been unable to bindto the larger agglomerate are visible. This would also explainwhy after 96 h it becomes increasingly difficult using TEM to
0
10
20
30
40
50
60
70
80
90
0 24 48 72 96
Surv
ival
(%)
Timeline (h)
Ionic Au
ControlD. pulexD. magnaD. rerioO. mossambicus
P. reticulataP. philanderT. sparrmaniiL. aeneus
Figure 9: Cumulative mortalities of test organisms exposed to ionicgold over 48 h (daphnids) and 96 h (fish).
observe nAu in concentrations above 10mg/L as they havealready started to sediment out of solution.
As all citrate capped gold nanoparticles in the stocksolution were around the 14 nm range it is evident thatfrom the moment the particles were diluted in the respec-tive environmental media they started to agglomerate toone another. This could also reflect the 10mg/L loss ofnanoparticle concentrations measured due to aggregationsas the entire sample was not read but only a portion ofit. The citrate capping is soluble and by the hydrolysis of
Journal of Nanomaterials 13
100
90
80
70
60
50
40
30
20
10
0
Cum
ulat
ive f
requ
ency
(%)
1.E − 01 1.E + 00 1.E + 01 1.E + 02 1.E + 03 1.E + 04
This studyLi et al. (2010)
Combined data for nAu
D. pulex
D. magna
P. reticulata
T. sparrmanii
Log 10 toxicity values of nAu (mg/L)
Figure 10: Species sensitivity distributions and confidence limitsfor nAu based on combined data from this study and the publishedliterature.
P. philanderT. sparrmaniiO. mossambicus
P. reticulata
D. pulex D. magnaL. aeneus
D. rerio
Data from this study
iderrr
ussssss
1.E
−03
1.E
−02
1.E
−01
1.E
+00
1.E
+01
1.E
+02
1.E
+03
1.E
+04
100
90
80
70
60
50
40
30
20
10
0
Cum
ulat
ive f
requ
ency
(%)
Log 10 toxicity values of chloroauric acid concentration (mg/L)
Figure 11: Species sensitivity distributions and confidence limits forionic gold based on acute toxicity data from this study.
water is converted to citric acid [57]. Sections of the sodiumcitrate capping agent (Na
3C6H5O7) are washed off in the
medium and particles become functionalized and thereforegain a charge [1] which allows them to stick to one anotherthrough van der Waals forces [47]. Divalent cations suchas Ca2+ and Mg2+, which are present in the reconstitutedOECD medium, effectively neutralize the surface charge ofcitrate coated nAu, thereby compressing the electric doublelayer (repulsive forces) and enhancing aggregation [58, 59].This suggests that aggregates of nAu should be regulatedby the type and concentration of the solvent and ionicstrengths of reconstituted water medium [54, 60–62]. Thezeta sizer indicated three peaks where the distribution ofeach size is represented as a percentage. It was found thatto gain a better understanding of the particle behaviour ateach concentration these percentages need to be taken intoaccount.
Functional groups present on the nAu surface play a rolein tissue distribution [63, 64]. When additional ligands are
L. aeneusD. rerio
P. philanderO. mykissT. sparrmaniiO. mossambicusO. kisutchT. arcticus
P. reticulata
D. pulex D. magnaM. macrocopaD. magna
Combined data for ionic gold
1.E
−03
1.E
−02
1.E
−01
1.E
+00
1.E
+01
1.E
+02
1.E
+03
1.E
+04
100
90
80
70
60
50
40
30
20
10
0
Cum
ulat
ive f
requ
ency
(%)
This studyNam et al. (2014)
Log 10 toxicity values of ionic gold concentration (mg/L)
Figure 12: Species sensitivity distributions and confidence limits forionic gold based on toxicity data from this study and the publishedliterature [41].
not present as is the case with a controlled bioassay, the moststable form in solution for the nAu would be the hydrolyzedspecies, namely, functionalized to AuOH (H
2O)0 [65]. The
OH frequency indicates that OH forms strong H-bondingwith groups of citrate caps present on nAu [66]. Howeverdepending on the pH and presence of chloride species thiscould change, where a pH of less than 4 would cause AuCl
2
to form. However the neutral pH during these bioassays andFTIR results confirmed that this was not the case. Whennegative charges are present, as seen in 20mg/L, 25mg/L,40mg/L, and 45mg/L, this may change the toxicity of theparticle where at a pH above 6 the predominant charge insolution would be AuCl (OH)3
−. In cases where the pHwas above 9 the functionality could change to Au(OH)4
−.Since the pH had a maximum of 8.7 for the duration of theexperiment it can be concluded that negative charges weredue to the presence of AuCl(OH)3
− ions [61, 65, 67]. Thecellular uptake is highly dependent on the functional groupsattached to the particle, as these would affect the charge andaggregation patterns [1].
4.2. Acute Toxicity and SSDs. The nAu SSD revealed that fishweremore sensitive to nAuwith an LC50 (when calculable) ofbetween 12.08mg/L and 52.6mg/L, while daphnids were lesssensitive with an LC50 ranging from approximately 70mg/Lto 75.31mg/L. Since arthropods are able to undergo moltingthey would be able to cope with the nAu particles adheredonto their carapace. Literature to date shows no evidence ofnAu uptake in daphnids while gold ions would be taken up[40]. Fish species are unable to molt and since respirationtakes place over the gill surface it provides a large surfacearea for nAu uptake within the nanometer range; thereforelarger agglomerates could possibly be taken up [35]. Fishhave a far more complex digestive, respiratory, and excretorysystem when compared to Daphnia since ionic gold ions
14 Journal of Nanomaterials
have evolved with organisms and nAu have not; the fish isunable to cope with increased uptake and reduced excretion.Surface area and particle uptake play an important role intoxicity; it is therefore proposed that a threshold value forexposure concentrations exists; this occurs between 20mg/Land 25mg/L in the fish medium. Based on particle sizedistributions particle uptake is possible and accumulates inthe organism in high enough concentrations to have an effect.The nAu have a high enough concentration to have an effectin an organism but agglomerations are still small enoughin the medium to move through the cellular membrane.At concentrations above 25mg/L particle interactions in themedium increase which decreases particle uptake into theorganism.
When comparing the SSD plots it becomes apparent thatthe nAu and ionic gold have different distributions in toxicity.Smaller organisms, like Daphnia, have a higher sensitivity toionic goldwhen compared to fishwhile for nAu exposures theopposite trend is seen. Reasons for this could be attributed todifferent effect and uptakemechanisms. Ionic gold follows thedose dependent response while nAu follow an aggregationtheory response.
The SSD plots for the nAu and the ionic gold clearlyindicate that there was a difference in the hazard potentialof the two substances with the latter being an order ofmagnitude more toxic. This is in contrast to studies whereSSDs comparing nano metals (i.e., CuO, ZnO, nAg, andnAl2O3) to their bulk metal (ionic) equivalents revealed that
the hazard potentials were very similar [31, 32, 35, 40]. Theseauthors attributed similar toxic potentials to the dissolutionof the ionic metals from the particle, causing the particletoxicity to be similar to the bulkmetal. However compared tonano metals that have the potential for metal ion dissolution,more inert nanoparticles such as TiO
2and carbon nanotubes
are much less toxic [34]. The results for nAu from this studysupport these findings.
At this stage the toxicity and therefore hazard assessmentof nanoparticles are still very much based on dose-response(i.e., exposure concentration) relationships. Only when moredata becomes available on the relationship between nanopar-ticle characteristics (e.g., size, shape, charge, and functionalgroup) and the exposure medium will predictors of toxicityother than the release of metal ions become apparent.Notwithstanding the limitations of using only concentration-based toxicity data, the information provided by the SSDs fornAu provides useful ecotoxicological comparisons with othernanomaterials.
Conflict of Interests
The authors declare that there is no conflict of interestsregarding the publication of this paper.
Acknowledgments
The research is based upon work supported by the Depart-ment of Science and Technology. The authors wish to thankMINTEK for supplying the nAu stock solutions.
References
[1] C. S. Yah, “The toxicity of gold nanoparticles in relation to theirphysiochemical properties,” Biomedical Research, vol. 24, no. 3,pp. 400–413, 2013.
[2] M. Janowski, J. W. M. Bulte, and P. Walczak, “Personalizednanomedicine advancements for stem cell tracking,” AdvancedDrug Delivery Reviews, vol. 64, no. 13, pp. 1488–1507, 2012.
[3] F. K. Alanazi, A. A. Radwan, and I. A. Alsarra, “Biopharmaceu-tical applications of nanogold,” Saudi Pharmaceutical Journal,vol. 18, no. 4, pp. 179–193, 2010.
[4] D. Fernandes, H. Carmo, M. Bastos, and S. Fraga, “Influence ofsurface coating on the toxicity of gold nanoparticles in Caco-2cells,” Toxicology Letters, vol. 196, p. S277, 2010.
[5] G. Voskerician, M. S. Shive, R. S. Shawgo et al., “Biocompati-bility and biofouling of MEMS drug delivery devices,” Biomate-rials, vol. 24, no. 11, pp. 1959–1967, 2003.
[6] I. H. El-Sayed, X. Huang, andM. A. El-Sayed, “Surface plasmonresonance scattering and absorption of anti-EGFR antibodyconjugated gold nanoparticles in cancer diagnostics: applica-tions in oral cancer,” Nano Letters, vol. 5, no. 5, pp. 829–834,2005.
[7] S. Arora, J. M. Rajwade, and K. M. Paknikar, “Nanotoxicologyand in vitro studies: the need of the hour,” Toxicology andApplied Pharmacology, vol. 258, no. 2, pp. 151–165, 2012.
[8] H. J. Byrne, I. Lynch, W. H. de Jong et al., Protocols for Assess-ment of Biological Hazards of Engineered Nanomaterials, TheEuropean Network on the Health and Environmental Impactof Nanomaterials, 2010.
[9] G. C. Delgado, “Economics and governance of nanomaterials:potential and risks,” Technology in Society, vol. 32, no. 2, pp. 137–144, 2010.
[10] N. Lewinski, V. Colvin, and R. Drezek, “Cytotoxicity of nano-particles,” Small, vol. 4, no. 1, pp. 26–49, 2008.
[11] D. Kuhnel and C. Nickel, “The OECD expert meeting on eco-toxicology and environmental fate—towards the developmentof improved OECD guidelines for the testing of nanomaterials,”Science of the Total Environment, vol. 472, pp. 347–353, 2014.
[12] V. Wepener and P. M. Chapman, “South African ecotoxicology:present status and future prognosis,” African Journal of AquaticScience, vol. 37, no. 3, pp. 229–234, 2012.
[13] J. C. Chapman, “The role of ecotoxicity testing in assessingwaterquality,” Australian Journal of Ecology, vol. 20, no. 1, pp. 20–27,1995.
[14] K. D. Kimball and S. A. Levin, “Limitations of laboratorybioassays: the need for ecosystem-level testing,” BioScience, vol.35, no. 3, pp. 165–171, 1985.
[15] J.Martins, L. O. Teles, andV.Vasconcelos, “Assays withDaphniamagna and Danio rerio as alert systems in aquatic toxicology,”Environment International, vol. 33, no. 3, pp. 414–425, 2007.
[16] D. R. Grothe, K. L. Dickson, and D. K. Reed-Judkins, WholeEffluent Toxicity Testing: An Evaluation of Methods and Predic-tion of Receiving System Impacts, SETAC Special PublicationsSeries, SETAC Press, Pensacola, Fla, USA, 1996.
[17] G. M. Rand, P. G. Wells, and L. S. McCarty, Fundamentalsof Aquatic Toxicology: Effects, Environmental Fate and RiskAssessment, edited by: G. M. Rand, Taylor & Francis, 2ndedition, 1995.
[18] P. B. Dorn, “An industrial perspective on whole effluent toxicitytesting,” in Whole Effluent Toxicity Testing: An Evaluation ofMethods and Predictions of Receiving Impacts, D. R. Grothe,
Journal of Nanomaterials 15
K. L. Dickson, and D. K. Reed-Judkins, Eds., Society ofEnvironmental Toxicology and Chemistry Special PublicationsSeries, Society of Environmental Toxicology and Chemistry,Pensacola, Fla, USA, 1996.
[19] H. C. Sarakinos, N. Bermingham, P. A. White, and J. B.Rasmussen, “Correspondence between whole effluent toxicityand the presence of priority substances in complex industrialeffluents,” Environmental Toxicology and Chemistry, vol. 19, no.1, pp. 63–71, 2000.
[20] R. Smolders, L. Bervoets, V. Wepener, and R. Blust, “A con-ceptual framework for using mussels as biomonitors in wholeeffluent toxicity,” Human and Ecological Risk Assessment, vol. 9,no. 3, pp. 741–760, 2003.
[21] S. Jergentz, P. Pessacq, H. Mugni, C. Bonetto, and R. Schulz,“Linking in situ bioassays and population dynamics ofmacroin-vertebrates to assess agricultural contamination in streams ofthe Argentine pampa,” Ecotoxicology and Environmental Safety,vol. 59, no. 2, pp. 133–141, 2004.
[22] P. M. Chapman, “Whole effluent toxicity testing—usefulness,level of protection, and risk assessment,” Environmental Toxi-cology and Chemistry, vol. 19, no. 1, pp. 3–13, 2000.
[23] Department of Water Affair and Forestry (DWAF), “The man-agement of complex industrial wastewater discharges: intro-ducing the Direct Estimation of Ecological Effect Potential(DEEEP) approach,” A Discussion Document, Department ofWater Affairs and Forestry, Institute for Water Quality Studies,Pretoria, South Africa, 2003.
[24] A. R. Fernandez-Alba, L. H. Guil, G. D. Lopez, and Y. Chisti,“Toxicity of pesticides in wastewater: a comparative assessmentof rapid bioassays,” Analytica Chimica Acta, vol. 426, no. 2, pp.289–301, 2001.
[25] C. G. Palmer, W. J. Muller, and H. D. Davies-Coleman, “Appliedaquatic toxicology: sub-lethal methods, whole effluent test-ing and communication,” WRC Report No. 1245/1/04, WaterResearch Commission, Pretoria, South Africa, 2004.
[26] L. Maltby, N. Blake, T. C. M. Brock, and P. J. van den Brink,“Insecticide species sensitivity distributions: importance oftest species selection and relevance to aquatic ecosystems,”Environmental Toxicology and Chemistry, vol. 24, no. 2, pp. 379–388, 2005.
[27] L. Posthuma, T. P. Traas, and G. W. Suter II, “General introduc-tion to species sensitivity distributions’,” in Species SensitivityDistribution in Ecotoxicology, L. Posthuma, T. P. Traas, and G.W. Suter II, Eds., Lewis Publishers, Boca Raton, Fla, USA, 2002.
[28] J. R. Wheeled, E. P. M. Grist, K. M. Y. Leung, D. Morritt, andM. Crane, “Species sensitivity distributions: data and modelchoice,”Marine Pollution Bulletin, vol. 45, no. 1-12, pp. 192–202,2002.
[29] M. C. Newman, D. R. Ownby, L. C. A. Mezin et al., “Applyingspecies-sensitivity distribustion in ecoogical risk assessment:assumptions of distribution type and sufficient numbers ofspecies,” Environmental Toxicology and Chemistry, vol. 19, no.2, pp. 508–515, 2000.
[30] S. Browne, The role of acute toxicity data for South Africanfreshwater macroinvertebrates in the derivation of water qualityguidelines for salinity [M.S. thesis], Rhodes University, Graham-stown, South Africa, 2005.
[31] N. Adam, C. Schmitt, L. de Bruyn, D. Knapen, and R. Blust,“Aquatic acute species sensitivity distributions of ZnO and CuOnanoparticles,” Science of The Total Environment, vol. 526, pp.233–242, 2015.
[32] K. L. Garner, S. Suh, H. S. Lenihan, and A. A. Keller, “Speciessensitivity distributions for engineered nanomaterials,” Envi-ronmental Science & Technology, vol. 49, no. 9, pp. 5753–5759,2015.
[33] H. Johnston, D. Brown, A. Kermanizadeh, E. Gubbins, andV. Stone, “Investigating the relationship between nanomate-rial hazard and physicochemical properties: informing theexploitation of nanomaterials within therapeutic and diagnosticapplications,” Journal of Controlled Release, vol. 164, no. 3, pp.307–313, 2012.
[34] B. J. Shaw and R. D. Handy, “Physiological effects of nanopar-ticles on fish: a comparison of nanometals versus metal ions,”Environment International, vol. 37, no. 6, pp. 1083–1097, 2011.
[35] S. J. Klaine, P. J. J. Alvarez, G. E. Batley et al., “Nanomaterialsin the environment: behavior, fate, bioavailability, and effects,”Environmental Toxicology andChemistry, vol. 27, no. 9, pp. 1825–1851, 2008.
[36] C. J. Murphy, A. M. Gole, J. W. Stone et al., “Gold nanoparticlesin biology: beyond toxicity to cellular imaging,” Accounts ofChemical Research, vol. 41, no. 12, pp. 1721–1730, 2008.
[37] G. Fren, “Preparation of gold dispersions of varying particlesize: controlled nucleation for the regulation of the particle sizein monodisperse gold suspensions,”Nature Physics, vol. 241, pp.20–22, 1973.
[38] OECD, Oecd Guideline for Testing of Chemicals: Fish, AcuteToxicity Tests, 1992.
[39] E. Truter, Method of Estimating the Chronic Toxicity of aChemical or Water Sampleto the Cladoceran Daphnia pulex,Department of Water Affairs and Forestry, Department ofWater Affairs & Forestry, Pretoria, South Africa, 1994.
[40] T. Li, B. Albee,M. Alemayehu et al., “Comparative toxicity studyof Ag, Au, and Ag-Au bimetallic nanoparticles on Daphniamagna,” Analytical and Bioanalytical Chemistry, vol. 398, no. 2,pp. 689–700, 2010.
[41] S.-H. Nam,W.-M. Lee, Y.-J. Shin et al., “Derivation of guidelinevalues for gold (III) ion toxicity limits to protect aquaticecosystems,”Water Research, vol. 48, no. 1, pp. 126–136, 2014.
[42] F. von der Kammer, P. L. Ferguson, P. A. Holden et al., “Analysisof engineered nanomaterials in complexmatrices (environmentand biota): general considerations and conceptual case studies,”Environmental Toxicology and Chemistry, vol. 31, no. 1, pp. 32–49, 2012.
[43] V. Stone, B. Nowack, A. Baun et al., “Nanomaterials forenvironmental studies: classification, reference material issues,and strategies for physico-chemical characterisation,” Science ofthe Total Environment, vol. 408, no. 7, pp. 1745–1754, 2010.
[44] M. A. Hamilton, R. C. Russo, and R. V. Thurston, “TrimmedSpearman-Karber method for estimating median lethal con-centrations in toxicity bioassays,” Environmental Science &Technology, vol. 11, no. 7, pp. 714–719, 1977, Correction: vol. 12,p. 417, 1978.
[45] American Public Health Association (APHA), Standard Meth-ods for the Examination of Water and Wastewater, AmericanWater Works Association (AWWA), Water Environment Fed-eration (WEF), Washington, DC, USA, 1992.
[46] United States Environmental Protection Agency (USEPA),CADDIS Volume 4: Data Analysis, United States EnvironmentalProtection Agency (USEPA), 2012, http://www.epa.gov/.
[47] N. Oh and J.-H. Park, “Endocytosis and exocytosis of nano-particles in mammalian cells,” International Journal of Nano-medicine, vol. 9, no. 1, pp. 51–63, 2014.
16 Journal of Nanomaterials
[48] K. T. Kim, S. J. Klaine, J. Cho, S.-H. Kim, and S. D. Kim,“Oxidative stress responses of Daphnia magna exposed to TiO
2
nanoparticles according to size fraction,” Science of the TotalEnvironment, vol. 408, no. 10, pp. 2268–2272, 2010.
[49] B. Fadeel and A. E. Garcia-Bennett, “Better safe than sorry:understanding the toxicological properties of inorganic nano-particles manufactured for biomedical applications,” AdvancedDrug Delivery Reviews, vol. 62, no. 3, pp. 362–374, 2010.
[50] A. M. Schrand, M. F. Rahman, S. M. Hussain, J. J. Schlager,D. A. Smith, and A. F. Syed, “Metal-based nanoparticlesand their toxicity assessment,” Wiley Interdisciplinary Reviews:Nanomedicine and Nanobiotechnology, vol. 2, no. 5, pp. 544–568, 2010.
[51] W. Cui, J. Li, Y. Zhang, H. Rong, W. Lu, and L. Jiang, “Effects ofaggregation and the surface properties of gold nanoparticles oncytotoxicity and cell growth,”Nanomedicine: NBM, vol. 8, no. 1,pp. 46–53, 2011.
[52] H. Weinberg, A. Galyean, and M. Leopold, “Evaluating engi-neered nanoparticles in natural waters,” TrAC Trends in Analyt-ical Chemistry, vol. 30, no. 1, pp. 72–83, 2011.
[53] R. J. Griffitt, J. Luo, J. Gao, J.-C. Bonzongo, and D. S. Barber,“Effects of particle composition and species on toxicity ofmetallic nanomaterials in aquatic organisms,” EnvironmentalToxicology and Chemistry, vol. 27, no. 9, pp. 1972–1978, 2008.
[54] A. Elsaesser and C. V. Howard, “Toxicology of nanoparticles,”Advanced Drug Delivery Reviews, vol. 64, no. 2, pp. 129–137,2012.
[55] R. N. Grass, L. K. Limbach, E. K. Athanassiou, and W. J. Stark,“Exposure of aerosols and nanoparticle dispersions to in vitrocell cultures: a reviewon the dose relevance of size,mass, surfaceand concentration,” Journal of Aerosol Science, vol. 41, no. 12, pp.1123–1142, 2010.
[56] L. Treuel, M. Malissek, J. S. Gebauer, and R. Zellner, “Theinfluence of surface composition of nanoparticles on theirinteractions with serum albumin,” ChemPhysChem, vol. 11, no.14, pp. 3093–3099, 2010.
[57] A. Tabrizi, F. Ayhan, andH.Ayhan, “Gold nanopartice synthesisand characterisation,” Hacettepe Journal of Biology and Chem-istry, vol. 37, no. 3, pp. 217–226, 2009.
[58] M. Baalousha, Y. Nur, I. Romer, M. Tejamaya, and J. R. Lead,“Effect of monovalent and divalent cations, anions and fulvicacid on aggregation of citrate-coated silver nanoparticles,”Science of the Total Environment, vol. 454-455, pp. 119–131, 2013.
[59] M.Delay, T.Dolt, A.Woellhaf, R. Sembritzki, andF.H. Frimmel,“Interactions and stability of silver nanoparticles in the aqueousphase: influence of natural organic matter (NOM) and ionicstrength,” Journal of Chromatography A, vol. 1218, no. 27, pp.4206–4212, 2011.
[60] I. Romer, T. A. White, M. Baalousha, K. Chipman, M. R.Viant, and J. R. Lead, “Aggregation and dispersion of silvernanoparticles in exposure media for aquatic toxicity tests,”Journal of Chromatography A, vol. 1218, no. 27, pp. 4226–4233,2011.
[61] J. Farkas, P. Christian, J. A. G. Urrea et al., “Effects of silverand gold nanoparticles on rainbow trout (Oncorhynchusmykiss)hepatocytes,” Aquatic Toxicology, vol. 96, no. 1, pp. 44–52, 2010.
[62] D. G. Abradelo, R. Cao, and R. Cea, “Self-aggregation of bilayerferrocenyl termini gold nanoparticles,” Inorganic ChemistryCommunications, vol. 10, no. 5, pp. 511–513, 2007.
[63] G. M. Fent, S. W. Casteel, D. Y. Kim, R. Kannan, K. Katti, andN. Chanda, “Biodistribution of maltose and gum arabic hybrid
gold nanoparticles after intravenous injection in juvenile swine,”Nanomedicine: Nanotechnology, Biology, and Medicine, vol. 5,no. 2, pp. 128–135, 2009.
[64] Y.-J. Gu, J. Cheng, C.-C. Lin, Y. W. Lam, S. H. Cheng, and W.-T. Wong, “Nuclear penetration of surface functionalized goldnanoparticles,” Toxicology and Applied Pharmacology, vol. 237,no. 2, pp. 196–204, 2009.
[65] B. H. Stuart, Modern Infrared Spectroscopy, Analytical Chem-istry by Open Learning Series, John Wiley & Sons, 1995.
[66] R. Pal, S. Panigrahi, D. Bhattacharyya, and A. S. Chakraborti,“Characterization of citrate capped gold nanoparticle-quercetincomplex: experimental and quantum chemical approach,” Jour-nal of Molecular Structure, vol. 1046, pp. 153–163, 2013.
[67] A. Lapresta-Fernandez, A. Fernandez, and J. Blasco, “Nanoe-cotoxicity effects of engineered silver and gold nanoparticles inaquatic organisms,” Trends in Analytical Chemistry, vol. 32, pp.40–59, 2012.

Submit your manuscripts athttp://www.hindawi.com
ScientificaHindawi Publishing Corporationhttp://www.hindawi.com Volume 2014
CorrosionInternational Journal of
Hindawi Publishing Corporationhttp://www.hindawi.com Volume 2014
Polymer ScienceInternational Journal of
Hindawi Publishing Corporationhttp://www.hindawi.com Volume 2014
Hindawi Publishing Corporationhttp://www.hindawi.com Volume 2014
CeramicsJournal of
Hindawi Publishing Corporationhttp://www.hindawi.com Volume 2014
CompositesJournal of
NanoparticlesJournal of
Hindawi Publishing Corporationhttp://www.hindawi.com Volume 2014
Hindawi Publishing Corporationhttp://www.hindawi.com Volume 2014
International Journal of
Biomaterials
Hindawi Publishing Corporationhttp://www.hindawi.com Volume 2014
NanoscienceJournal of
TextilesHindawi Publishing Corporation http://www.hindawi.com Volume 2014
Journal of
NanotechnologyHindawi Publishing Corporationhttp://www.hindawi.com Volume 2014
Journal of
CrystallographyJournal of
Hindawi Publishing Corporationhttp://www.hindawi.com Volume 2014
The Scientific World JournalHindawi Publishing Corporation http://www.hindawi.com Volume 2014
Hindawi Publishing Corporationhttp://www.hindawi.com Volume 2014
CoatingsJournal of
Advances in
Materials Science and EngineeringHindawi Publishing Corporationhttp://www.hindawi.com Volume 2014
Smart Materials Research
Hindawi Publishing Corporationhttp://www.hindawi.com Volume 2014
Hindawi Publishing Corporationhttp://www.hindawi.com Volume 2014
MetallurgyJournal of
Hindawi Publishing Corporationhttp://www.hindawi.com Volume 2014
BioMed Research International
MaterialsJournal of
Hindawi Publishing Corporationhttp://www.hindawi.com Volume 2014
Nano
materials
Hindawi Publishing Corporationhttp://www.hindawi.com Volume 2014
Journal ofNanomaterials