Embed Size (px)
Citation preview

Research ArticleChemical Functionalization and Characterizationof Cellulose Extracted from Wheat Straw Using AcidHydrolysis Methodologies
Chemar J. Huntley,1 Kristy D. Crews,1 and Michael L. Curry1,2
1Department of Materials Science and Engineering, Tuskegee University, Tuskegee, AL 36088, USA2Department of Chemistry, Tuskegee University, Tuskegee, AL 36088, USA
Correspondence should be addressed to Michael L. Curry; [email protected]
Received 17 September 2014; Revised 15 December 2014; Accepted 15 December 2014
Academic Editor: Cornelia Vasile
Copyright © 2015 Chemar J. Huntley et al. This is an open access article distributed under the Creative Commons AttributionLicense, which permits unrestricted use, distribution, and reproduction in any medium, provided the original work is properlycited.
Thenonuniformdistribution of cellulose intomany compositematerials is attributed to the hydrogen bonding observed by the threehydroxyl groups located on each glucosemonomer. As an alternative, chemical functionalization is performed to disrupt the stronghydrogen bonding behavior without significant altering of the chemical structure or lowering of the thermal stability. In this report,we use wheat straw as the biomass source for the extraction of cellulose and, subsequently, chemical modification via the Albright-Goldman and Jones oxidation reactions. X-ray diffraction analyses reveal that upon oxidation a slight change in the cellulosepolymorphic structure (CI to CII) can be observed when compared to its unmodified counterpart. Scanning electron microscopyanalyses show that the oxidized cellulose structure exhibits fiber-like crystals with lengths and diameters on the micrometer scale.Thermal analyses (differential scanning calorimetry and thermogravimetric analysis) show an increase in the thermal stability forthe modified cellulose at extremely high temperatures (>300∘C).
1. Introduction
Interests in the use of cellulose in the development ofrenewable and sustainable technology that is carbon neutral,nonpetroleum based, and biodegradable and has minimalnegative impacts on the environment have increased in everylab across the globe. Although cellulose has unique physic-ochemical properties and has been used as reinforcementcomponents in composites, the hydrophilic nature of cellu-lose introduces severe limitations for its use in technologicalapplications. More specifically, this is due to the nonuniformdistribution of the cellulose crystals into the polymer matrix,which is triggered by negative surface charges and theintroduction of void areas caused by inaccurate cellulosedispersion and incompatibility between the two phases [1].Furthermore, in addition to the elimination of defects asso-ciated with the hierarchical structure, cellulose extractionmethodologies, such as the use of strong mineral acids, cansignificantly influence the dispersion and stabilization of
cellulose crystals obtained from various biomass sources [2].Literature reports indicated that the use of sulfuric acid isthe most effective hydrolysis process in terms of cellulosestability and dispersibility; however, it is known to producethe most stable cellulose particles with a correspondingnegative surface charge via esterification reactions [3]. Onesolution for decreasing inaccurate dispersion of cellulosecrystals into polymer matrices due to the induced negativesurface charges and incompatibility, as well as aggregation,is through chemical functionalization [1]. That is, throughcontrolling the nature of the surface interactions between thecellulose crystals and host matrix, the incompatibility andlow dispersibility of the cellulose crystals throughout the hostmatrix can be modified.
In the case of cellulose functionalization, the reactivitynature is primarily dependent upon the hydroxyl groups.However, cellulose reactions are governed by hydrogen bond-ing and steric hindrance [4], as well, and, in return, alongwiththe polymer-analogous concept, assist in determining the
Hindawi Publishing CorporationInternational Journal of Polymer ScienceVolume 2015, Article ID 293981, 9 pageshttp://dx.doi.org/10.1155/2015/293981

2 International Journal of Polymer Science
Table 1: The cellulose, hemicellulose, and lignin content of variousagricultural waste materials.
Agricultural wastematerial
Cellulose(%)
Hemicellulose(%)
Lignin(%)
Nut shells 25–30 25–30 30–40Corn cobs 45 35 15Grasses 25–40 35–50 10–30Paper 85–99 0 0–15Leaves 15–20 80–85 0Newspaper 40–55 25–40 18–30Cotton seed hairs 80–95 5–20 0Wheat straw 35–40 30–35 10–15
best functionalization techniques. The polymer-analogousconcept was introduced by Staudinger and Daumiller andstates that macromolecules are capable of undergoing similarreactions to that of low-molecular compounds. Still, thesupramolecular structure stimulates the determination of thedegree of conversion, functional group distributions, and therate of reaction, essential for parameter determination infunctionalization techniques [5].
One form of cellulose functionalization reaction essen-tial in introducing carbonyl groups at the C2, C3, andC6 positions of cellulose is oxidation. Numerous oxidationreactions exist, yet interest in the Albright-Goldman andJones oxidation reactions has been limited. The Albright-Goldman oxidation specifically targets sterically hinderedfunctional groups present in the cellulose supramolecularstructure, but both oxidation techniques are capable of pro-ducing aldehydes, carboxylic acids (more present in the Jonesoxidation), and ketones [6].Thus, in order to understand howthese nonconventional techniques affect the common sterichindrances of cellulose when compared to other oxidationmethods (i.e., TEMPO-mediated oxidation) [2], detailedstudies should be undertaken. Therefore, the aims of thisreport are to (1) chemically functionalize cellulose in orderto introduce aldehydes and ketones on the primary and sec-ondary alcoholswithout anymajor structural rearrangementsusing the Albright-Goldman and Jones oxidation reactions,(2) decrease the hydrophilic nature of the polymer, and (3)increase the thermal stability.
2. Experimental
2.1. Materials. ACS reagent grade agents purchased fromSigma-Aldrich were used as received. Acetic acid, ace-tone, nitric acid, sodium chlorite, sodium hydroxide, andsulfuric acid for cellulose synthesis were purchased fromSigma-Aldrich. For cellulose modification, acetic anhydride,ammonium hydroxide, dimethyl sulfoxide, silver nitrate, andsodium dichromate were purchased from Sigma-Aldrich.Wheat straw was purchased from Georgia. Table 1 givesinsight into the cellulose, hemicellulose, and lignin contentof wheat straw versus other agricultural waste materials.
Crystalline cellulose
Acetic acid pretreatment
Wheat straw
Nitric acid hydrolysis
Sulfuric acid hydrolysis
Centrifugation
Sonication
Centrifugation, solvent exchange, and drying
Albright-Goldman oxidation (dimethyl sulfoxide and acetic anhydride)
Oxidized cellulose
Bleaching treatment at 70∘CNaClO2 + acetate buffer
Figure 1: The isolation and chemical functionalization methodol-ogy for the crystalline cellulose isolated from wheat straw.
2.2. Isolation of Crystalline Cellulose. In this paper, solu-tions were prepared in the following concentrations: 90wt.%acetic acid, 9 wt.% sodium chlorite, 58 vol.% acetic acid and42 vol.% sodium hydroxide buffer solution, 32 vol.% nitricacid, and 32 vol.% sulfuric acid. Wheat straw was subjectedto fractionation by refluxing in the presence of an aceticacid solution for phenolic and hemicellulose hydrolysis at aduration of 2 hours (see Figure 1). Subsequently, the mixturewas filtered using Buchner filtration with Whatman # 1 filterpaper and washed with hot distilled water to rid the wheatstraw of remaining acid. Bleaching was carried out usinga sodium chlorite solution in an acetic acid and sodiumhydroxide buffer system at approximately 78∘C for 2 hours,producing the strong oxidizing agent chlorous acid. Thisbleaching step ensured the release of cellulose from lignin andremaining hemicellulose. The product was filtered using thepreviously stated filtration method. The resulting cellulosewas treated with the 32wt.% strong acid solutions—nitricand sulfuric acids—for 24 hours, specifically targeting thevoids of the amorphous regions. Afterwards, purificationand neutralization of the resulting crystalline cellulose wereperformed by centrifuging 3–6 times at 2500 rpm for 30minutes with the addition of fresh distilled water after eachtime. To avoid aggregation, the product was sonicated onan ice bath for 4 hours, centrifuged 3 additional times withthe prior conditions, and allowed to settle for 24 hours. Thedistilled water was decanted from the product and replaced

International Journal of Polymer Science 3
with acetone for drying. Centrifugation was performed at1000 RPM for 10 minutes. Afterwards, fresh acetone wasadded.The process was repeated 3 times and allowed to settlefor 24 hours. Samples were dried at approximately 70∘C in avacuum oven.
2.3. Chemical Functionalization and Tollens’ Test. A solventexchange from acetone to 10.00mL of dimethyl sulfoxide wascompleted for samples of 1.00 to 2.00 grams of cellulose. TheAlbright-Goodman oxidation was performed according toAlbright and Goldman [7]. Using a test tube, a small amountof dried, oxidized cellulose was mixed with a Tollens’ reagentof 50mL of 0.1M silver nitrate, ammonium hydroxide, and25mL of 0.8M sodium hydroxide [8].
2.4. Characterization of Crystalline Cellulose
2.4.1. Fourier Transform Infrared Spectroscopy. Fourier trans-form infrared (FTIR) spectra were collected for the modifiedand neat cellulose. FTIR analyseswere performed using a Shi-madzu 8400S FTIR spectrometer.The data was collected andanalyzed using IRSolution software and reported literaturefindings for crystalline cellulose.
2.4.2. X-Ray Diffraction Spectroscopy. Crystal structures ofthe formed cellulose were analyzed using a Rigaku D/MAX2200 X-ray diffractometer with a diffracted beam graphitemonochromatic running on Cu K𝛼 radiation. Analysis wasperformed from 0∘ to 80∘ of 2𝜃 angle at a rate of 5 degrees perminute and a sample width of 0.02.
2.4.3. SEM Imaging of Cellulose Crystals. Electron micro-scopy images of cellulose were carried out using a Zeiss EVO50VP scanning electronmicroscope.The crystalline cellulosewas analyzed by sputter coating with copper using a 550Xsputter coating device. The Zeiss EVO 50VP was operated atan acceleration voltage of 20 kV. For each sample, differentparts of the grid were used to determine both average shapeand size distributions.
2.4.4. Tollens’ Test. Tollens’ test, or the silver mirror test,was synthesized by the German chemist Bernhard Tollens.The test verifies the presence of aldehydes by using silver(I) to reduce sugar, subsequently leading to the oxidationof an aldehyde to a carboxylic acid. As a result, a grey orsilver precipitate is produced after a series of color changes.However, in the presence of a ketone, a precipitate is notproduced, and the solution remains colorless. The reagentsinvolved in the mixture are aqueous silver nitrate withaqueous sodium hydroxide [9].
2.5. Thermal and Stability Characterization ofCellulose Extract
2.5.1. Modulated Differential Scanning Calorimeter. Initialidentification of the decomposition temperature and meltingpoint of cellulose from wheat straw was analyzed using
a TA Instrument Q2000 Differential Scanning Calorimeter.Samples of 10–13mg were pressed in Hermetic pans andperformed from 30∘C to 400∘C at a rate of 5 degrees perminute.
2.5.2. Thermogravimetric Analysis. Thermal stability of thecellulose was determined using TA Instrument Q500 Ther-mogravimetric Analyzer. Analysis was performed on samplesof 10–15mg in an oxygen atmosphere from 30∘C to 550∘C ata rate of 5 degrees per minute.
3. Results and Discussion
3.1. X-Ray Diffraction Analysis (XRD). The polymorphicstructure of the nonmodified and modified cellulose crys-tals extracted via sulfuric and nitric acid hydrolyses wasdetermined using XRD analysis (see Figures 2(a)–2(d)). Ascan be observed in Figure 2(a), cellulose extracted undernitric acid conditions and modified using the Albright-Goldman reaction method exhibits crystalline properties ofcellulose I
𝛼and I𝛽(CI𝛼and CI
𝛽), as well as cellulose II (CII)
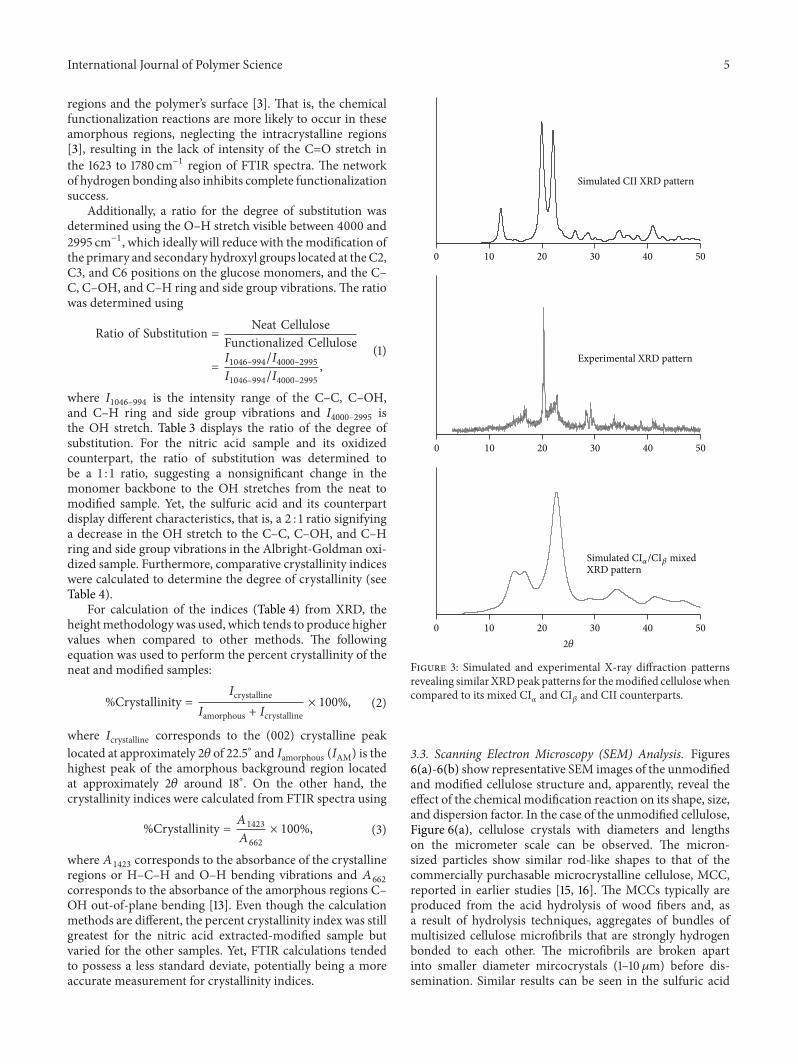
polymorphs. Figure 2(b) exhibits XRD peaks around 15∘, 22∘,and 35∘ 2𝜃 indicating that the nitric acid extracted cellulosecrystals adopt a CI structural formation [10]. However, uponoxidation of the nitric acid cellulose crystals, a new, sharpXRD peak can be observed at around 20.3∘ 2𝜃; this peakcorresponds to the formation of a CII polymorphic cellulosecrystal structure [10]. Using XRD data simulation software,further support was provided for the presence of the CIIpolymorph based on the appearance of the new XRD peakat 20.3∘ 2𝜃 (see Figure 3) [11]. Hence, although completeconversion between the polymorphic structures remainsincomplete [12] and CII structures are generally obtainedusing mercerization techniques with set parameters [5], thepresence of the CII crystal structure proves significant for apossible CI to CII conversionmechanismunder theAlbright-Goldman oxidation reaction.
However, in the case of cellulose extraction under sulfuricacid conditions, modified samples of cellulose using theAlbright-Goldman method reveal a different crystal orien-tation effect when compared to the unmodified nitric andsulfuric acid extracted andmodified nitric acid extracted cel-lulose crystals. The majority of the crystalline peaks presentwhen compared to the unmodified sample are clearly lowerin intensity. That is, XRD peaks located at 7.5∘, 11.7∘, 15∘, 23∘,and 35∘ 2𝜃 for the sulfuric acid extracted cellulose are nolonger distinct, observable features within the XRD spectrumof the cellulose that has been extracted using sulfuric acidhydrolysis and modified through the Albright-Goldmanreaction mechanism. This could be explained through thesacrifice in structure integrity due to the thermodynamicnature of the initial surface groups’ alterations during theacid hydrolysis process; however, further investigations arewarranted to determine the exact mechanism promoting thestructural difference.
3.2. Fourier Transform Infrared Spectroscopy (FTIR) andTollens’ Test. To monitor the structural change in peripheral

4 International Journal of Polymer Science
0
100
200
300
400
500
600
3 6 9 12 15 18 21 24 27 30 33 36 39 42 45 48
Albright-Goldman oxidized nitric acid
Inte
nsity
(a.u
.)
2𝜃
(a)
0
500
1000
1500
2000
2500
3 6 9 12 15 18 21 24 27 30 33 36 39 42 45 48
Inte
nsity
(a.u
.)
Nitric acid
2𝜃
(b)
05
10152025303540
3 6 9 12 15 18 21 24 27 30 33 36 39 42 45 48
Inte
nsity
(a.u
.)
Albright-Goldman oxidation sulfuric acid
2𝜃
(c)
0
500
1000
1500
2000
2500
3 6 9 12 15 18 21 24 27 30 33 36 39 42 45 48
Sulfuric acid
Inte
nsity
(a.u
.)
2𝜃
(d)
Figure 2: X-ray diffraction patterns of nitric acid extracted cellulose (a-b) and sulfuric acid extracted cellulose (c-d) and their Albright-Goldman modified counterparts.
OHgroups occurrence after theAlbright-Goldman oxidationreaction, the presence and absence of distinct functionalgroups were determined using FTIR analysis (see Table 2).Based on the arrangement of the polymer and history andsource of the waste product, chemical modification tends tooccur quicker on the surface of crystallites and disorderedregions [13]. In Figures 4(a)-4(b), sulfuric and nitric acidsamples display similar results. OH stretches are observed inthe 4000–2995 cm−1 range with a broader peak and greaterintensity apparent in the Albright-Goldman oxidized (sulfu-ric and nitric acids extracted modified) cellulose, suggestingthe scission of the hydrogen bonds [13]. However, it isnoted that the modified cellulose shown in Figure 4(a) showsa shift in its OH-stretching vibrations to a slightly lowerwavenumber. Onemay speculate that this could be due to theincomplete removal of hemicelluloses or even lignin duringthe extraction process, but verification of the removal ofthese impurities can be proven through the lack of peaksobservance at 1735 cm−1, 1600 cm−1, 1515 cm−1, 1426 cm−1,and 1384–1346 cm−1. Furthermore, the modified extractedcellulose FTIR spectra in both the nitric and sulfuric acidscases, Figures 4(a) and 4(b), respectively, reveal that the inten-sity of the C=O, H–O–CH
2, H–O–H bending of absorbed
water around 1640–1623 cm−1 is greater in comparison to
the unmodified cellulose systems [8, 14].That is, upon chemi-cal functionalization a greater amount of water is absorbed, aswell as the introduction of the C=O onto the primary and/orsecondary hydroxyl groups on the structure. This can beexplained by the possible replacement of the OH groups forthe unmodified acid extracted cellulose when compared tothemodified. Since partial substitution of the O-H functionalgroups are replaced with either nitro or sulfate groups duringthe acid hydrolysis process, and CHO
2or CO
2groups in
the case of the modified, a change may be induced in thehydrophilic nature of the cellulose structure comparatively[13].
Further support for partial oxidation of the cellulosestructure during the modification can be seen using Tollens’test; see Figure 5. This qualitative test is used to verifythe presence of aldehydes, which will occur on carbon 6(C6) of the cellulose structure. In short, in the presence ofaldehydes, Tollens’ reagent will go through a specific colorchange (Figures 5(a)–5(c))—golden yellow, brown, and darkand cloudy gray—before the formation of silver apparentlyforms on the walls of the test tubes (see Figures 5(a)–5(d))[15]. Hence, the presence of C=O stretches in the modifiedcellulose buttresses the theory that the functionalizationreagents are able to only penetrate the disordered, amorphous
International Journal of Polymer Science 5
regions and the polymer’s surface [3]. That is, the chemicalfunctionalization reactions are more likely to occur in theseamorphous regions, neglecting the intracrystalline regions[3], resulting in the lack of intensity of the C=O stretch inthe 1623 to 1780 cm−1 region of FTIR spectra. The networkof hydrogen bonding also inhibits complete functionalizationsuccess.
Additionally, a ratio for the degree of substitution wasdetermined using the O–H stretch visible between 4000 and2995 cm−1, which ideally will reduce with the modification ofthe primary and secondary hydroxyl groups located at theC2,C3, and C6 positions on the glucose monomers, and the C–C, C–OH, and C–H ring and side group vibrations. The ratiowas determined using
Ratio of Substitution = Neat CelluloseFunctionalized Cellulose
=
𝐼1046–994/𝐼4000–2995𝐼1046–994/𝐼4000–2995
,
(1)
where 𝐼1046–994 is the intensity range of the C–C, C–OH,
and C–H ring and side group vibrations and 𝐼4000–2995 is
the OH stretch. Table 3 displays the ratio of the degree ofsubstitution. For the nitric acid sample and its oxidizedcounterpart, the ratio of substitution was determined tobe a 1 : 1 ratio, suggesting a nonsignificant change in themonomer backbone to the OH stretches from the neat tomodified sample. Yet, the sulfuric acid and its counterpartdisplay different characteristics, that is, a 2 : 1 ratio signifyinga decrease in the OH stretch to the C–C, C–OH, and C–Hring and side group vibrations in the Albright-Goldman oxi-dized sample. Furthermore, comparative crystallinity indiceswere calculated to determine the degree of crystallinity (seeTable 4).
For calculation of the indices (Table 4) from XRD, theheightmethodologywas used, which tends to produce highervalues when compared to other methods. The followingequation was used to perform the percent crystallinity of theneat and modified samples:
%Crystallinity =𝐼crystalline
𝐼amorphous + 𝐼crystalline× 100%, (2)
where 𝐼crystalline corresponds to the (002) crystalline peaklocated at approximately 2𝜃 of 22.5∘ and 𝐼amorphous (𝐼AM) is thehighest peak of the amorphous background region locatedat approximately 2𝜃 around 18∘. On the other hand, thecrystallinity indices were calculated from FTIR spectra using
%Crystallinity =𝐴1423
𝐴662
× 100%, (3)
where 𝐴1423
corresponds to the absorbance of the crystallineregions or H–C–H and O–H bending vibrations and 𝐴
662
corresponds to the absorbance of the amorphous regions C–OH out-of-plane bending [13]. Even though the calculationmethods are different, the percent crystallinity index was stillgreatest for the nitric acid extracted-modified sample butvaried for the other samples. Yet, FTIR calculations tendedto possess a less standard deviate, potentially being a moreaccurate measurement for crystallinity indices.
0 10 20 30 40 50
0 10 20 30 40 50
0 10 20 30 40 50
XRD pattern
Simulated CII XRD pattern
Experimental XRD pattern
2𝜃
Simulated CI𝛼/CI𝛽 mixed
Figure 3: Simulated and experimental X-ray diffraction patternsrevealing similar XRDpeak patterns for themodified cellulose whencompared to its mixed CI
𝛼
and CI𝛽
and CII counterparts.
3.3. Scanning Electron Microscopy (SEM) Analysis. Figures6(a)-6(b) show representative SEM images of the unmodifiedand modified cellulose structure and, apparently, reveal theeffect of the chemical modification reaction on its shape, size,and dispersion factor. In the case of the unmodified cellulose,Figure 6(a), cellulose crystals with diameters and lengthson the micrometer scale can be observed. The micron-sized particles show similar rod-like shapes to that of thecommercially purchasable microcrystalline cellulose, MCC,reported in earlier studies [15, 16]. The MCCs typically areproduced from the acid hydrolysis of wood fibers and, asa result of hydrolysis techniques, aggregates of bundles ofmultisized cellulose microfibrils that are strongly hydrogenbonded to each other. The microfibrils are broken apartinto smaller diameter mircocrystals (1–10𝜇m) before dis-semination. Similar results can be seen in the sulfuric acid

6 International Journal of Polymer Science
Table 2: The peak wavenumber and the corresponding bonds of cellulose [14].
Peak wavenumber(cm−1) Bonds Modified Nonmodified
4000–2995 OH-stretching Observed Observed2883 C–H symmetrical stretching Observed Observed17351384–1346 Hemicellulose Not observed Not observed
1640–1623 C=O, H–O–CH2, and H–O–Hbending of absorbed water Observed Observed (nitric)
Not observed (sulfuric)160015151426
Lignin aromatic Skeletonvibration Not observed Not observed
1423 H–C–H and O–H bendingvibration Observed Observed
1314 CH2 rocking vibration at C6 Observed Observed
1046–994 C–C, C–OH, and C–H ring andside group vibrations Observed Observed
1205–895 COC, CCO, and CCHdeformation and stretching Observed Observed
662 C–OH out-of-plane bending Observed Observed
0
20
40
60
80
100
120
5001000150020002500300035004000
Albright-Goldman oxidizedNitric acid
OH-stretching
Inte
nsity
(a.u
.)
Wavenumber (cm−1)
absorbed water
in-plane bending vibration
CH2rocking
vibrationat C6
and side group vibrations
of-planebending
COC,CCO,
and CCHdeformation
andstretching
C–H symmetricalstretching
C=O, H–O–CH2, andH–O–H bending of
H–C–H and O–C–H
C–C, C–OH, and C–H ring
C–OH out-
(a)
0
20
40
60
80
100
120
5001000150020002500300035004000
Albright-Goldman oxidizedSulfuric acid
Inte
nsity
(a.u
.)
Wavenumber (cm−1)
CH2rocking
vibrationat C6
COC,CCO,
and CCHdeformation
andstretching
and sidegroup vibrations
C–H symmetricalstretching
in-plane bending vibrationH–C–H and O–C–H
C–C, C–OH, andC–H ring
of-planebending
C–OH out-
OH-stretching absorbed water
C=O, H–O–CH2, andH–O–H bending of
(b)
Figure 4: Fourier transform infrared spectroscopy (FTIR) spectra of nitric acid (a) and sulfuric acid (b) extracted cellulose and its Albright-Goldman modified counterparts.
The first color change
(a)
The second color change
(b)
The third color change
(c)
Silver formation
(d)
Figure 5: Tollens’ test.

International Journal of Polymer Science 7
Table 3: The ratio of the OH stretch to the C–C, C–OH, and C–H ring and side group vibrations.
Sample Bonds Intensity range Ratio of the nonmodified tomodified
Albright-Goldmanoxidized (nitric acid)
OH-stretching 33.06
1 : 1C–C, C–OH, and C–H ring and
side group vibrations 74.23
Nitric acid OH-stretching 19.97C–C, C–OH, and C–H ring and
side group vibrations 43.95
Albright-Goldmanoxidized (sulfuric acid)
OH-stretching 21.62
2 : 1C–C, C–OH, and C–H ring and
side group vibrations 51.97
Sulfuric acid OH-stretching 6.05C–C, C–OH, and C–H ring and
side group vibrations 22.26
Table 4: The crystallinity indices for the neat nitric and sulfuric acid extracted samples and their Albright-Goldman oxidized counterparts.
Characterizationtechnique Nitric acid Albright-Goldman (nitric acid) Sulfuric acid Albright-Goldman
(sulfuric acid)FTIR 43.61% ± 0.01 98.57% ± 0.01 29.76% ± 0.03 59.43% ± 1.11XRD 71.88% ± 4.19 92.52% ± 2.26 70.58% ± 1.18 69.65% ± 5.39
hydrolysis of cellulose extracted from wheat straw. That is,due to the strong hydrogen bonding and extraction process,the presence of aggregation is apparent. However, there areindividual MCC fibers present.
In contrast, Figure 6(b) shows a smoother clump of inter-twined hydrolyzed cellulose microfibrils after modificationusing the Albright-Goldman oxidation reaction. A diameterless than 5 𝜇m can be measured for all of the individualmicrofibrils and exhibits a rod-like shape with increasedstrain definition in the individual cellulosemicrofibrils struc-tural orientation compared to the unmodified counterpart.This could be attributed to the disruption of the stronghydrogen bonding typically observed in the unmodifiedcellulose cases. That is, upon modification, the removal ofthe OH groups has allowed the cellulose crystals increasedmobility in the absence of the force driven through that ofhydrogen bonding. Yet, further analysis of how the Albright-Goldman oxidation reagents affect the appearance of thecrystalline regions is necessary.
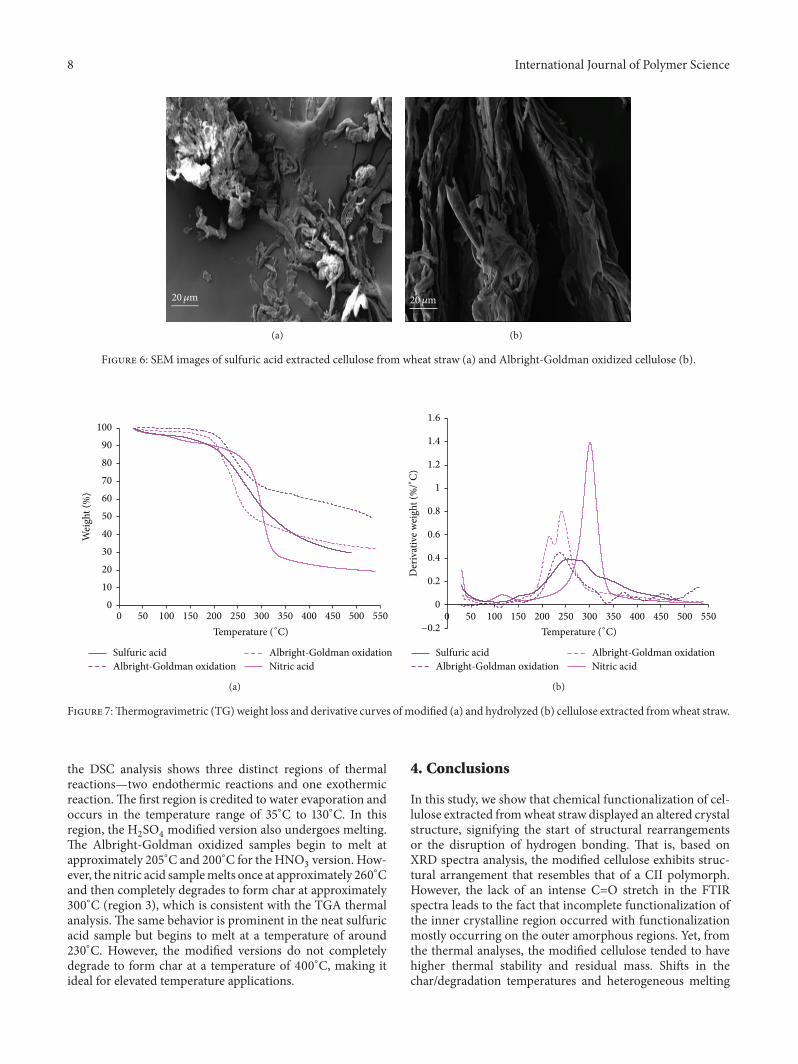
3.4. Thermogravimetric (TGA) and Modulated DifferentialScanning Calorimetry Analyses (DSC). The TGA curves inFigure 7 show the thermal decomposition temperature ofnitric and sulfuric hydrolyzed (HNO
3and H
2SO4) cellulose
and cellulose samples that have undergone the Albright-Goldman oxidation reaction. Under both conditions, nitricor sulfuric cellulose modified using the Albright-Goldmanoxidation reaction exhibits a more thermally stable structureas compared to that of the unmodified hydrolyzed cellulosesamples. The HNO
3modified samples apparently reveal a
two-step decomposition reaction at temperatures around200∘C and 250∘C, whereas the nitric acid sample begins todecompose around 300∘C. It is well known that under the
HNO3conditions nitro groups can be substituted onto the
structure of the cellulose and, based on bonding energies,could cause the release of intermediates during the heatingstages [17].The typical bonding energies for formedO–N andO–S bonds are around 55 and 87 J/mol, respectively [18].
Furthermore, the derivative curve (Figure 6(b)) demon-strates the thermal rate of decomposition of neat nitric andsulfuric acid cellulose samples and the modified versionsvia the Albright-Goldman oxidation reaction. In region I,which is below 150∘C, the nitric acid sample displays a slightpeak attributed to water uptake, as previously observed inFigure 7(a). However, the neat H
2SO4and oxidized samples
do not portray this peak. In region II—from 150∘C to 550∘C—the greatest rate of decomposition is observed for all thesamples. The nitric-modified sample begins to decomposeslightly above 200∘C at rate of 0.6/∘C; however, a seconddecomposition occurs at approximately 250∘C, suggestingthat the sample loses mass over a broad temperature range.On the other hand, the nitric acid sample does not decomposeuntil a slightly higher temperature (approximately 300∘C)than that of the modified version, but the sample loses themajority of its mass at this point, therefore, rendering thenitric acid sample thermally unfavorable. H
2SO4modified
cellulose begins to decompose at approximately 240∘C withseveralmore decomposition peaks occurring at elevated tem-peratures (from 375 to 550 degrees Celsius). In comparison tothe acid hydrolyzed andmodified nitric celluloses, theH
2SO4
modified cellulose exhibits the greatest amount of residueat elevated temperatures which is ideal for high-temperatureapplications.
Further support for the TGA analysis of sulfuric acidmodified cellulose exhibiting the greatest thermal stabilitycan be observed in the DSC analysis, Figure 8. In this case,
8 International Journal of Polymer Science
20𝜇m
(a)
20𝜇m
(b)
Figure 6: SEM images of sulfuric acid extracted cellulose from wheat straw (a) and Albright-Goldman oxidized cellulose (b).
0102030405060708090
100
0 50 100 150 200 250 300 350 400 450 500 550
Wei
ght (
%)
Sulfuric acidAlbright-Goldman oxidation
Albright-Goldman oxidationNitric acid
Temperature (∘C)
(a)
Sulfuric acidAlbright-Goldman oxidation
Albright-Goldman oxidationNitric acid
0
0.2
0.4
0.6
0.8
1
1.2
1.4
1.6
0 50 100 150 200 250 300 350 400 450 500 550Temperature (∘C)−0.2
Der
ivat
ive w
eigh
t (%
/∘C)
(b)
Figure 7:Thermogravimetric (TG) weight loss and derivative curves ofmodified (a) and hydrolyzed (b) cellulose extracted fromwheat straw.
the DSC analysis shows three distinct regions of thermalreactions—two endothermic reactions and one exothermicreaction.The first region is credited to water evaporation andoccurs in the temperature range of 35∘C to 130∘C. In thisregion, the H
2SO4modified version also undergoes melting.
The Albright-Goldman oxidized samples begin to melt atapproximately 205∘C and 200∘C for the HNO
3version. How-
ever, the nitric acid samplemelts once at approximately 260∘Cand then completely degrades to form char at approximately300∘C (region 3), which is consistent with the TGA thermalanalysis. The same behavior is prominent in the neat sulfuricacid sample but begins to melt at a temperature of around230∘C. However, the modified versions do not completelydegrade to form char at a temperature of 400∘C, making itideal for elevated temperature applications.
4. Conclusions
In this study, we show that chemical functionalization of cel-lulose extracted fromwheat straw displayed an altered crystalstructure, signifying the start of structural rearrangementsor the disruption of hydrogen bonding. That is, based onXRD spectra analysis, the modified cellulose exhibits struc-tural arrangement that resembles that of a CII polymorph.However, the lack of an intense C=O stretch in the FTIRspectra leads to the fact that incomplete functionalization ofthe inner crystalline region occurred with functionalizationmostly occurring on the outer amorphous regions. Yet, fromthe thermal analyses, the modified cellulose tended to havehigher thermal stability and residual mass. Shifts in thechar/degradation temperatures and heterogeneous melting

International Journal of Polymer Science 9
0
0.2
0 50 100 150 200 250 300 350 400 450
Hea
t flow
(W/g
)
Albright-Goldman oxidationSulfuric acid
Nitric acidAlbright-Goldman oxidation
Exo. up 1
2
3
−1.2
−1
−0.8
−0.6
−0.4
−0.2
Temperature (∘C)
Figure 8: Modulated differential scanning calorimetry of function-alized and hydrolyzed cellulose extracted from wheat straw.
peaks also demonstrate the altered thermal behavior of thefunctionalized cellulose and its nonfunctionalized counter-part. However, the Jones oxidized samples were unable tobe examined due to the lack of separation from the reducedchromium complex. To that end, it has been concluded inthis study that the Albright-Goldman oxidation reaction canbe used to chemically functionalize the cellulose withoutsignificant degradation of the cellulose structure or loweringof its thermal stability.
Conflict of Interests
The authors declare that there is no conflict of interestsregarding the publication of this paper.
Acknowledgments
The authors gratefully acknowledge the National ScienceFoundation under Grant nos. NSF EPS-1158862, NSF HRD-1137681, and NSF IGERT on Sustainable Electronics DGE-1144843 for support of this research. The Department ofMaterials Science and Engineering and Department ofChemistry and Chemistry Center for Synthesis and Charac-terization are also recognized.
References
[1] J. Kim, G. Montero, Y. Habibi et al., “Dispersion of cellulosecrystallites by nonionic surfactants in a hydrophobic polymermatrix,” Polymer Engineering and Science, vol. 49, no. 10, pp.2054–2061, 2009.
[2] A. Dufresne, Nanocellulose: From Nature to High PerformanceTailored Materials, Walter de Gruyter, 2012.
[3] D. Klemm, B. Heublein, H.-P. Fink, and A. Bohn, “Cellulose:fascinating biopolymer and sustainable raw material,” Ange-wandte Chemie International Edition, vol. 44, no. 22, pp. 3358–3393, 2005.
[4] D. T. Company, 2013, http://www.dharmatrading.com/cellu-lose.html.
[5] A. Buleon and H. Chanzy, “Single crystals of cellulose IVII:preparation and properties,” Journal of Polymer Science: PolymerPhysics Edition, vol. 18, no. 6, pp. 1209–1217, 1980.
[6] G. Tojo andM. I. Fernandez,Oxidation of Alcohols to Aldehydesand Ketones: A Guide to Current Common Practice, Springer,New York, NY, USA, 2006.
[7] J. D. Albright and L. Goldman, “Dimethyl sulfoxide-acid anhy-dride mixtures for the oxidation of alcohols,” Journal of theAmerican Chemical Society, vol. 89, no. 10, pp. 2416–2423, 1967.
[8] T. Kondo and C. Sawatari, “A Fourier transform infra-redspectroscopic analysis of the character of hydrogen bonds inamorphous cellulose,” Polymer, vol. 37, no. 3, pp. 393–399, 1996.
[9] NC State University, “Tollen’s Test (Silver Mirror)”.[10] E. N. J. Ford, S. K. Mendon, S. F. Thames, and J. W. Rawlins,
“X-ray diffraction of cotton treated with neutralized vegetableoil-based macromolecular crosslinkers,” Cellulose, vol. 9, no. 11,pp. 18–23, 2010.
[11] A. D. French, “Idealized powder diffraction patterns for cellu-lose polymorphs,” Cellulose, vol. 21, no. 2, pp. 885–896, 2014.
[12] Cellulose, 2014, http://www.wiley-vch.de/books/biopoly/pdfv06/bpol6010 275 287.pdf.
[13] D. Ciolacu, F. Ciolacu, and V. I. Popa, “Amorphous cellulose—structure and characterization,” Cellulose Chemistry and Tech-nology, vol. 45, no. 1-2, pp. 13–21, 2011.
[14] M. Fan,D.Dai, andB.Huang, “Fourier transform infrared spec-troscopy for natural fibres,” in Fourier Transform—MaterialsAnalysis, InTech, 2012.
[15] H. Chemar, K. Crews, A. Abdalla, A. Russell, and M. Curry,“Influence of strong acid hydrolysis processing on the thermalstability and crystallinity of cellulose isolated fromwheat straw,”International Journal of Chemical Engineering, In press.
[16] R. J. Moon, A. Martini, J. Nairn, J. Simonsen, and J. Young-blood, “Cellulose nanomaterials review: structure, propertiesand nanocomposites,” Chemical Society Reviews, vol. 40, no. 7,pp. 3941–3994, 2011.
[17] R. P. Swatloski, S. K. Spear, J. D. Holbrey, and R. D. Rogers, “Dis-solution of cellose with ionic liquids,” Journal of the AmericanChemical Society, vol. 124, no. 18, pp. 4974–4975, 2002.
[18] Michigan State University, Standard Bond Energies and BondDissociation Energies, http://www.cem.msu.edu/∼reusch/Org-Page/bndenrgy.htm.

Submit your manuscripts athttp://www.hindawi.com
ScientificaHindawi Publishing Corporationhttp://www.hindawi.com Volume 2014
CorrosionInternational Journal of
Hindawi Publishing Corporationhttp://www.hindawi.com Volume 2014
Polymer ScienceInternational Journal of
Hindawi Publishing Corporationhttp://www.hindawi.com Volume 2014
Hindawi Publishing Corporationhttp://www.hindawi.com Volume 2014
CeramicsJournal of
Hindawi Publishing Corporationhttp://www.hindawi.com Volume 2014
CompositesJournal of
NanoparticlesJournal of
Hindawi Publishing Corporationhttp://www.hindawi.com Volume 2014
Hindawi Publishing Corporationhttp://www.hindawi.com Volume 2014
International Journal of
Biomaterials
Hindawi Publishing Corporationhttp://www.hindawi.com Volume 2014
NanoscienceJournal of
TextilesHindawi Publishing Corporation http://www.hindawi.com Volume 2014
Journal of
NanotechnologyHindawi Publishing Corporationhttp://www.hindawi.com Volume 2014
Journal of
CrystallographyJournal of
Hindawi Publishing Corporationhttp://www.hindawi.com Volume 2014
The Scientific World JournalHindawi Publishing Corporation http://www.hindawi.com Volume 2014
Hindawi Publishing Corporationhttp://www.hindawi.com Volume 2014
CoatingsJournal of
Advances in
Materials Science and EngineeringHindawi Publishing Corporationhttp://www.hindawi.com Volume 2014
Smart Materials Research
Hindawi Publishing Corporationhttp://www.hindawi.com Volume 2014
Hindawi Publishing Corporationhttp://www.hindawi.com Volume 2014
MetallurgyJournal of
Hindawi Publishing Corporationhttp://www.hindawi.com Volume 2014
BioMed Research International
MaterialsJournal of
Hindawi Publishing Corporationhttp://www.hindawi.com Volume 2014
Nano
materials
Hindawi Publishing Corporationhttp://www.hindawi.com Volume 2014
Journal ofNanomaterials


![RAMP Annual Symposium 2016 - University of Rochester Symposium...with selective chemical functionalization [ACS Nano 2011 5 3867-3877] needed to give chemical ... to unravel the basic](https://img.dokumen.tips/doc/110x75/5f04366e7e708231d40cde86/ramp-annual-symposium-2016-university-of-rochester-symposium-with-selective.jpg)