Embed Size (px)
Citation preview
Asian Pacific Journal of Cancer Prevention, Vol 16, 2015 6729
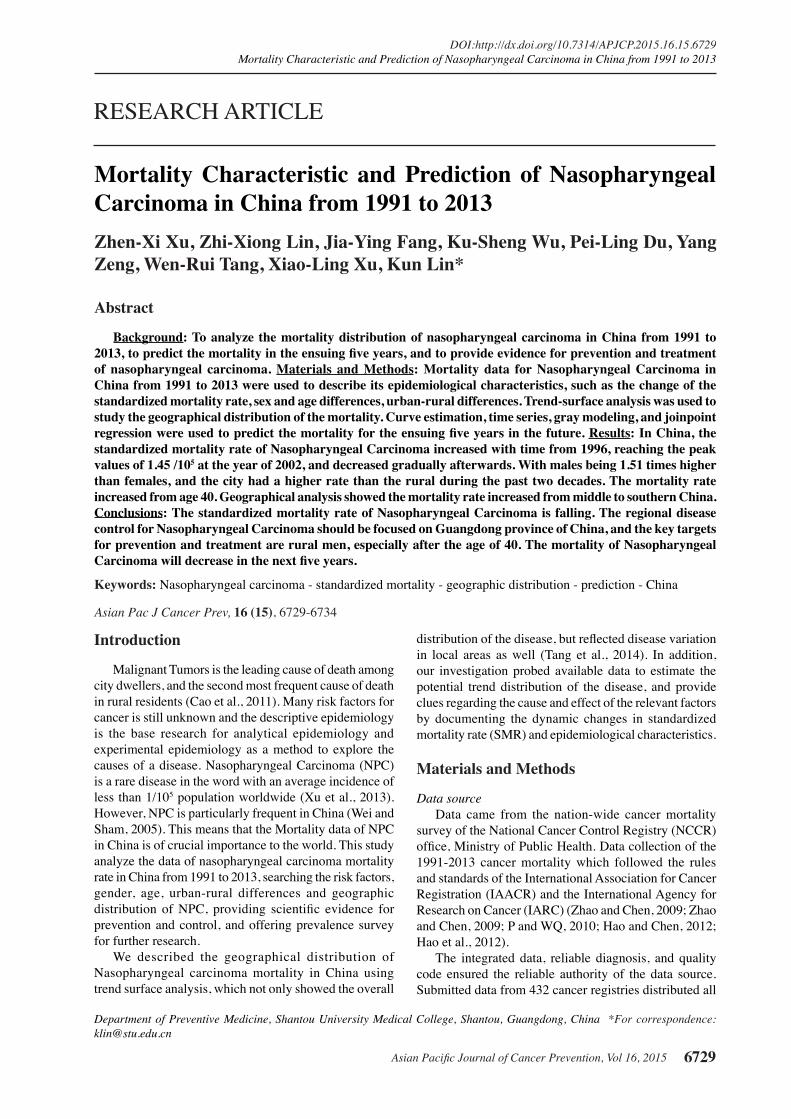
DOI:http://dx.doi.org/10.7314/APJCP.2015.16.15.6729Mortality Characteristic and Prediction of Nasopharyngeal Carcinoma in China from 1991 to 2013
Asian Pac J Cancer Prev, 16 (15), 6729-6734
Introduction
Malignant Tumors is the leading cause of death among city dwellers, and the second most frequent cause of death in rural residents (Cao et al., 2011). Many risk factors for cancer is still unknown and the descriptive epidemiology is the base research for analytical epidemiology and experimental epidemiology as a method to explore the causes of a disease. Nasopharyngeal Carcinoma (NPC) is a rare disease in the word with an average incidence of less than 1/105 population worldwide (Xu et al., 2013). However, NPC is particularly frequent in China (Wei and Sham, 2005). This means that the Mortality data of NPC in China is of crucial importance to the world. This study analyze the data of nasopharyngeal carcinoma mortality rate in China from 1991 to 2013, searching the risk factors, gender, age, urban-rural differences and geographic distribution of NPC, providing scientific evidence for prevention and control, and offering prevalence survey for further research.
We described the geographical distribution of Nasopharyngeal carcinoma mortality in China using trend surface analysis, which not only showed the overall
Department of Preventive Medicine, Shantou University Medical College, Shantou, Guangdong, China *For correspondence: [email protected]
Abstract
Background: To analyze the mortality distribution of nasopharyngeal carcinoma in China from 1991 to 2013, to predict the mortality in the ensuing five years, and to provide evidence for prevention and treatment of nasopharyngeal carcinoma. Materials and Methods: Mortality data for Nasopharyngeal Carcinoma in China from 1991 to 2013 were used to describe its epidemiological characteristics, such as the change of the standardized mortality rate, sex and age differences, urban-rural differences. Trend-surface analysis was used to study the geographical distribution of the mortality. Curve estimation, time series, gray modeling, and joinpoint regression were used to predict the mortality for the ensuing five years in the future. Results: In China, the standardized mortality rate of Nasopharyngeal Carcinoma increased with time from 1996, reaching the peak values of 1.45 /105 at the year of 2002, and decreased gradually afterwards. With males being 1.51 times higher than females, and the city had a higher rate than the rural during the past two decades. The mortality rate increased from age 40. Geographical analysis showed the mortality rate increased from middle to southern China. Conclusions: The standardized mortality rate of Nasopharyngeal Carcinoma is falling. The regional disease control for Nasopharyngeal Carcinoma should be focused on Guangdong province of China, and the key targets for prevention and treatment are rural men, especially after the age of 40. The mortality of Nasopharyngeal Carcinoma will decrease in the next five years. Keywords: Nasopharyngeal carcinoma - standardized mortality - geographic distribution - prediction - China
RESEARCH ARTICLE
Mortality Characteristic and Prediction of Nasopharyngeal Carcinoma in China from 1991 to 2013Zhen-Xi Xu, Zhi-Xiong Lin, Jia-Ying Fang, Ku-Sheng Wu, Pei-Ling Du, Yang Zeng, Wen-Rui Tang, Xiao-Ling Xu, Kun Lin*
distribution of the disease, but reflected disease variation in local areas as well (Tang et al., 2014). In addition, our investigation probed available data to estimate the potential trend distribution of the disease, and provide clues regarding the cause and effect of the relevant factors by documenting the dynamic changes in standardized mortality rate (SMR) and epidemiological characteristics.
Materials and Methods
Data source Data came from the nation-wide cancer mortality
survey of the National Cancer Control Registry (NCCR) office, Ministry of Public Health. Data collection of the 1991-2013 cancer mortality which followed the rules and standards of the International Association for Cancer Registration (IAACR) and the International Agency for Research on Cancer (IARC) (Zhao and Chen, 2009; Zhao and Chen, 2009; P and WQ, 2010; Hao and Chen, 2012; Hao et al., 2012).
The integrated data, reliable diagnosis, and quality code ensured the reliable authority of the data source. Submitted data from 432 cancer registries distributed all

Zhen-Xi Xu et al
Asian Pacific Journal of Cancer Prevention, Vol 16, 20156730
over the country covering 43231554 males and 42238968 females, constituting 6.40% of the nation in 2009 were check and evaluated by NCCR base on “Guideline for Chinese Cancer Registration” and referring to relevant data quality criterion of “Cancer Incidence in Five Continents Volume XI” by IARC/IACR. A goodness of fit test of regional samples and national samples presented that the overall have not statistically significant difference and had a better demographic representation.
Statistical analysisThe crude rate (CR) of NPC is used in comparative
study of sex, area, and age groups. The standardized mortality rate (SMR) calculated by using the Chinese standard population (CASR) from 1982 is applied to dynamic statistical analysis.
MethodsStandardized mortality of different gender from
national registered data of malignant tumors from 1991 to 2013, were used for binary polynomial regression to fit the first to fourth order regression equations, where z stands for standardized mortality, x stands for longitude and y stands for latitude. After subjective judgment on R-square test, F-test, goodness of fit order by order test, we chose the proper equation for trend surface analysis to describe the geographic distribution of NPC mortality for different gender. The trend surface analysis and contour maps were performed by SAS9.1.3 software.
Our primary objective is to estimate the trend of NPC mortality in China from the period of 1991 to 2013,and the second aim is to predict the trend in the ensuing 5 years. With curve estimation, time series modeling, gray modeling (GM) and joinpoint regression, we could predict epidemic trends of NPC, which could provide public health agencies with scientific guidance for implement disease prevention and management. Statistical analysis was executed by SPSS20.0, DPS 7.05 and Joinpoint 4.1.0.
The curve estimation function in the SPSS was an exploratory tool for selecting an optimal model to predict an independent variable (SMR) by a single dependent variable (time). From the 11 different models (linear, logarithmic, inverse, quadratic, cubic, power, compound, S-curve, logistic, growth, and exponential models), the final model was chosen according to their relative goodness of fit.
The autoregressive integrated moving average model(ARIMA) put forward by statisticians Box and Jenkins in the seventies was fitted to time series data either to better understand the data or to predict future points in the series. The Box-Jenkins models were applied in some cases where data show evidence of non-stationarity, where an initial differencing step (corresponding to the “integrated” part of the model) can be applied to remove the non-stationarity. The model is generally referred to as an ARIMA(p,d,q) model where parameters p, d, and q are non-negative integers that refer to the order of the autoregressive, integrated, and moving average parts of the model respectively. The ARIMA in SPSS software could transform the target time-series data into its square root and automatically detect outliers(Shi et al., 2014). We
manually entered ARIMA without expert modeler, settings p, d, and q at different parameters and finally selected the (1,0,0) model for estimation and forecast.
Grey-box models can estimate both continuous-time and discrete-time values depending on the window size of observation. Simulation results of several kinds of grey model show that the modified grey models have higher performances not only on model fitting but also on forecasting. Thus we obtained the NPC standardized mortality from the past 23 years and these real data points was enough to estimate the value of unknown since grey model requires only a limited amount of data. We imported the number 1 to 23 as the time dependent variable and the SMR as the independent variable to construct models in DPS software.
Joinpiont regression was a population-based cancer statistics tools offered by the American nation cancer institute (NCI). Cancer trends reported in NCI publications are calculated using the Joinpoint regression program to analyze rates and trends. The software enabled the user to test whether an apparent change in trends was statistically significant or not. Annual percent change (APC) was one way to characterize trends in NPC mortality as years went by. Joinpoint computed the NPC mortality trend in segments whose start and end are determined to best fit the data; sometimes it is useful to summarize the trend over a fixed predetermined interval with the calculation of the average annual percent Change (AAPC). This meant that the NPC mortality was assumed to change at a constant percentage of the rate of the previous year.
Results
Time-dependent changes in Mortality Rates of Nasopharyngeal Carcinoma
Base on the fluctuating mortality rate among Chinese in recent decades, it can be found that the standardize nasopharyngeal carcinoma death rate was increased with time from 1996, reaching the peak values of 1.45 /105 at the year of 2002, and decreased gradually afterwards( Figure 1).
Differences between the urban and rural Nasopharyngeal Carcinoma mortality
Comparing the NPC standard mortality in urban and rural areas, the city dwellers had a higher rate than the rural residents during the past two decades (Especially in 1999,the crude rate was 2.58/105 in the city, 1.49 times that of the rate in the country). However, the difference smoothed as time went by, and once reversed in 2010 (The rural mortality was at 2.08/105, an excess of 23.08% that of the corresponding period in urban areas). These changes of mortality are consistent with the Joinpoint Regression analysis result in which the trends of urban NPC mortality will continue to reduce while the rural trended to increase during the first decade of 21st century.
Gender and age-group characteristics of Nasopharyngeal Carcinoma mortality
Since the National Central Cancer Registry of China provided real-time surveillance information on NPC, it

Asian Pacific Journal of Cancer Prevention, Vol 16, 2015 6731
DOI:http://dx.doi.org/10.7314/APJCP.2015.16.15.6729Mortality Characteristic and Prediction of Nasopharyngeal Carcinoma in China from 1991 to 2013
represents a distinct difference regarding gender, with males always having higher rate than females, and mortality being 1.51 times higher on average in men than women from 1991 to 2013. The NPC age-standardized mortality for men was 1.51/105 in 2009, while in women the mortality was 0.57/105.
Age-specific mortality rates of NPC remained a low level in the 0 to 35 years age group, and increased slowly from 35~ years old group, forming a wave crest at the ages of 70 to 75 years old group, reaching the highest in over 85 age group. Urban and rural mortality rose to 5.93/105 and 5.69/105 in the 70 to 75 age group, respectively. In the over 85 years age group, the mortality peaked at 6.97/105 in urban areas, while it peaked at 6.64/105 in the country in the 80~84 age group. In the urban areas, female mortality peaked in the over 85 years age group (4.46/105), whereas in countryside, mortality reached the highest in the 80 to 84 age group (4.22/105). Both urban and rural male mortality was the highest in the over 85 years age group (10.87/105 and 10.62/105) (Figure 2).
Geographical distribution of nasopharyngeal carcinoma mortality
Base on the data collected by the National Central Cancer Registry, which was from various monitoring points all over the country, and after comparing different multi-order equation, a final second-order trend surface equation was found most meaningful to describe the male NPC mortality distribution (R2=0.4170, F=9.44, P<0.0001): z=-20.1918+1.2180x-2.4677y-0.0049x2 -0.0042xy+0.0399y2, where z stands for the standardized mortality ratio of Nasopharyngeal Carcinoma for various cities/towns, x stands for longitude of the cities/towns, and y stands for latitude.
Also, another meaningful second-order equation was computed for NPC mortality trends in women (R2=0.4640, F=5.89, P=0.0005): z=-178.1450+3.1927x-0.1619y-0.0111x2-0.0198xy+0.0356y2. There two equations indicated that the variation (41.7% and 46.4%) of male and female NPC mortality rate might be explained by geographical environment factors. These two contour maps of NPC mortality rates generated by their optimized equations showed a special NPC distribution pattern in China (Figure 3 and Figure 4). Combine with actual geographical frontier of China, the contour maps showed mortality rates increased gradually from the middle region of China (Qianxi city) to northern and southern China. Unlike slightly elevated to the northern area, a substantial increase was observed in the south China, reaching the peak in Sihui, Guangzhou and Zhongshan cities. In the long strip lower-lying land of the central China, mortality rate gradually falling towards the east direction, forming a lowest valley-shape zone.
Estimation and forecastingIt’s imprecise to use a single data mode to calculate the
next unknown quantities out of the limited statistic that had been collected, and the obtained results of each mode might be obviously different. Suppose that other factors influencing NPC such as society, economy, lifestyle and environment remained constant. After searching for
Figure 4. Geographical Distribution of the Standardized Mortality Rates of Female Nasopharynx Cancer in China
Figure 1. Change in Time-Specific Standardized Mortalities Rates of Nasopharynx Cancer by Joinpoint Analysis by Area in China From 1991-2013
Figure 2. Change in Age-Specific Mortalities of Nasopharynx Cancer among Urban and Rural Areas, and Different Sex in China from 1991 to 2013
0
2
4
6
8
10
12
15-‐ 20-‐ 25-‐ 30-‐ 35-‐ 40-‐ 45-‐ 50-‐ 55-‐ 60-‐ 65-‐ 70-‐ 75-‐ 80-‐ 85-‐
urbane
rural
urban male
urban female rural male
rural female
Age -‐group/Year
Morta
lity ra
te/1/1
0 5
Figure 3. Geographical Distribution of the Standardized Mortality Rates of Male Nasopharynx Cancer in China

Zhen-Xi Xu et al
Asian Pacific Journal of Cancer Prevention, Vol 16, 20156732
several statistical models, finally we found four adequate models to predict the mortality in the years ahead. With the mortality data from 1991-2013, we forecast the condition in the coming years, with accuracy represented by fitted
error value and the 95% confidence interval (CI). These four models are:
Curve estimation: The cubic curve fitted the trend best (R2 =0.60, F=12.1, p<0.01), The equation is: y=
0
25.0
50.0
75.0
100.0
New
ly d
iagn
osed
with
out
trea
tmen
t
New
ly d
iagn
osed
with
tre
atm
ent
Pers
iste
nce
or r
ecur
renc
e
Rem
issi
on
Non
e
Chem
othe
rapy
Radi
othe
rapy
Conc
urre
nt c
hem
orad
iatio
n
10.3
0
12.8
30.025.0
20.310.16.3
51.7
75.051.1
30.031.354.2
46.856.3
27.625.033.130.031.3
23.738.0
31.3
Table 3. APC and AAPC of Age-standardized Rates for NPC in China from 1991-2013Trends APCa/AAPCb Urban Rural Overall
Segment 1 Years 1991-1996 1991-1995 1991-1996 APC (95%CI) -5.4(-11.7, -1.4) -4.2 (-12.9,5.2) -3.0(-7.6,1.9)Segment 2 Years 1996-1999 1995-2010 1996-2002 APC (95%CI) 15.0(-15.7,56.6) 3.4 c (2.0,4.8) 7.3 c (2.2,12.6)Segment 3 Years 1999-2013 2010-2013 2002-2013 APC (95%CI) -2.1c (-3.5, -0.6) -6.2 (-19.1,8.9) -4.6 c (-6.0,-3.2)Last5 Obs Years 2009-2013 2009-2013 2009-2013 AAPC (95%CI) -2.1c (-3.5, -1.0) -3.9 (-13.2,6.6) -4.6 c (-6.0,-3.2)Full Range Years 1991-2013 1991-2013 1991-2013 AAPC (95%CI) -0.7(-4.8,3.6) 0.6 (-19.7,3.2) -1.1 (-2.8,-0.6)*APCa-annual percent change; AAPCb-average annual percent change; c-significantly different from zero at alpha=0.05(p<0.05)
Table 2. Predicted Mortalities for NPC, by 4 Models, in China During 2014-2018 (1/105) ARIMA GM Overall Year Cubic (1,0,0) (1,1) Joinpoint X
_±SD 95%CI
Cubic2014 0.58 0.80 0.83 0.83 0.76±0.12 (0.57,0.95)2015 0.40 0.82 0.79 0.79 0.70±0.20 (0.38,1.02)2016 0.19 0.83 0.76 0.75 0.63±0.30 (0.16,1.11)2017 -0.05 0.83 0.72 0.72 0.55±0.41 (-0.09,1.20)2018 -0.31 0.83 0.69 0.69 0.47±0.53 (-0.36,1.31)X_±SD 0.16±0.35 0.82±0.01 0.76±0.06 0.76±0.06
95%CI (-0.28,0. 60) (0.81,0.84) (0.69,0.83) (0.69,0.82)
Table 1. The Modeled Mortality for NPC, by 4 models, in China from 1991 to 2013 (1/105)Year Observed Cubic ARIMA (1,0,0) GM (1,1) Joinpoint
(X) SMR(Y) Modeled Fitted Modeled Fitted Modeled Fitted Modeled Fitted SMR Error% SMR Error% SMR Error% SMR Error%
1991 1.15 1.04 -9.58 1.21 5.25 1.03 -10.68 1.10 -4.321992 1.02 1.03 0.65 1.15 12.30 0.94 -8.37 1.07 7.411993 1.09 1.03 -5.30 1.04 -4.60 0.97 -11.01 1.04 -1.841994 0.86 1.04 21.60 0.85 -0.87 1.00 16.95 1.01 21.291995 1.12 1.06 -5.39 1.11 -0.94 1.04 -7.48 0.98 -9.861996 0.91 1.08 19.23 1.12 23.31 1.07 17.99 0.95 7.891997 0.98 1.11 13.23 0.94 -4.09 1.11 13.04 1.02 -3.071998 1.17 1.14 -2.36 1.00 -14.25 1.15 -1.79 1.09 -12.541999 1.17 1.17 0.18 1.15 -1.39 1.18 1.53 1.17 -6.532000 1.25 1.20 -4.43 1.15 -8.17 1.22 -2.26 1.26 -6.572001 1.36 1.22 -10.41 1.21 -11.35 1.27 -7.29 1.35 -7.682002 1.45 1.24 -14.41 1.3 -10.59 1.31 -10.03 1.44 -7.152003 1.29 1.26 -2.31 1.37 6.20 1.35 4.83 1.38 11.632004 1.34 1.27 -5.34 1.24 -7.46 1.40 4.32 1.32 2.992005 1.22 1.27 3.89 1.27 4.10 1.26 3.16 1.26 8.202006 1.22 1.26 2.94 1.18 -3.28 1.20 -1.50 1.20 3.282007 1.16 1.23 6.19 1.17 0.86 1.15 -1.09 1.14 3.452008 1.08 1.19 10.53 1.12 3.70 1.10 1.44 1.09 5.562009 1.04 1.14 9.62 1.06 1.92 1.05 0.58 1.04 4.812010 1.06 1.07 1.13 1.02 -3.51 1.00 -5.53 0.99 -1.622011 0.98 0.98 0.39 1.03 5.59 0.95 -2.25 0.95 1.492012 0.94 0.87 -7.41 0.97 3.37 0.91 -2.98 0.91 1.242013 0.78 0.74 -5.30 0.93 19.60 0.87 11.79 0.86 17.03Overall models Cubic ARIMA (0,1,0) GM (1,1) Joinpoint
Fitted Median 0.18 -0.87 -1.50 1.49 Error Interquartile Range 11.50 9.85 11.61 13.94 95%CI (-3.24, 4.74) (-3.27, 4.64) (-3.48,3.77) (-2.14, 5.19)
*SMR-standardized mortality rates, age-standardized by Chinese standard population from 1982

Asian Pacific Journal of Cancer Prevention, Vol 16, 2015 6733
DOI:http://dx.doi.org/10.7314/APJCP.2015.16.15.6729Mortality Characteristic and Prediction of Nasopharyngeal Carcinoma in China from 1991 to 2013
1.060-0.027x+0.07x2 +0.0003x3, where x stands for the year, and y stands for mortality rate (Tables 1 and 2).
Time series: An autoregressive integrated moving average (ARIMA) was built base on the above mortality data for prediction (R2 =0.66, p=0.69) (Tables 1 and 2).
Gray model (GM): Depending on the principle and theory of the gray model, X (i) means the standardized mortality rate of NPC, t means the year. We base on the data from last ten years to fine a GM (1, 1) model to perform the predetermination, with fitting parameters: a=0.0378, b=1.4156. The equation is: X(t+1) =-27.8402-
0.0462t+29.1802 (C=0.2714, p=1.000, Qmin=-0.0386) (Tables 1 and 2).
Joinpoint regression: We used joinpoint regression analysis to identify points where a statistically significant change over time in linear slope of the trend occurred, and found out two turning points in 1996 and 2002. Though the mortality fluctuated as time went by, the general trend declined slightly at the speed of -1.1% on average annual percent changes (Tables 1, 2 and 3).
Discussion
Based on our analysis, the ARIMA model and Cubic model had a more accurate prediction than GM model and Joinpoint model. Our data demonstrated that the SMR of NPC in China had been steadily declining and it would continue to drop in the next few years. NPC was one of the few cancers that had a reducing mortality rate against the major background in which a variety of tumors showed a trend of escalation in recent decades. The downturn of NPC mortality might result from the widely used of Epstein-Barr virus (EBV) serology for population screening since 1970s(Yin et al., 2008). Also, tobacco control regulation set up by national legislature in recent years might contribute to a better survival. But above all, the application of Intensity-Modulated Radiotherapy(IMRT) in recent years could not be a negligible factor for the improvement of survival.Comparing to the urban areas, mortality of rural areas remained lower but showing an increasing trend.
The mortality of NPC was higher in males than in females in both urban and rural areas. The crude mortality rate was 2.82/105 for male, and 1.14/105 for females in 2009. There might be higher rate to correctly diagnose NPC in the city due to the advanced medical technology that the countryside did not have. The advantages of rural regions lay in better natural environment, but the urbanization during the past decade have narrowed down the difference between town and countryside.
Trend-surface analysis on the registries shows that the tendencies of NPC mortality in China increased from central to the south of China. Geographical distribution in mortality is most likely related to ethnicity, environment, health behaviors, and relevant risk factors. South China is the prevalent region of NPC, especially in Guangdong province, where Sihui, Guangzhou and Zhongshan cities have the highest NPC mortality in China. The presently known shared biologic predisposition play a major role in the pathogenesis of NPC. Also, it has been pointed that trace elements content of the soil is related to the
pathological process of tumor and high nickle and low selenium might be relevant factors of NPC. Salted fish, one of the most popular foods in south China which content an great amount of nitrosamine indicates that dieting history is also one of the cause of tumor(Lin et al., 2002).
People over the age of 40 should actively prevent NPC (Chen and Liu, 2002). We showed that nasopharyngeal carcinoma mortality increased rapidly in people over the age of 40, reaching the highest in the 80 to 84 age group. NPC patients without specific symptoms would easily result in missed diagnosis. Metastasis and recurrence were the main causes of death for patients after radical treatment.
Usually, mortality is highly related to incidence. Exploration of NPC etiology was one of the important approaches to reduce incidence and death rates of NPC. Risk factors such as mongoloid race, Epstein-Barr Virus infection had been brought to light. Many other possible factors still await further observation and study, such as the role of androgen in the development mechanisms of NPC.
Nasopharyngeal carcinoma was the result of synergy of the genetic factors, environment, diet and lifestyle (Cao et al., 2011), but the exact mechanism was still in the air. We hope further research would cast new light on predisposing factor of the NPC so that primary prevention strategy would be applied to reduce the mortality by cutting the risk factors of NPC. The present situation allow us to prevent and control NPC by employing some methods. Healthy eating, no smoking and doing more exercise should be actively promoted (Qiu et al., 2013), especially for rural men over the age of 40.
Awareness of NPC early symptom amongst the health professionals and a timely treatment to patients are necessary. Popular medical science publicity and education should been launched in the endemic areas. Those lifestyle interventions will decrease the occurrence (Chen et al., 2008) of nasopharyngeal carcinoma and reducing the global burden of NPC.
Acknowledgements
The study was supported by grants from the Tumor Research Center of Collaboration and Innovation, STUMC the Guangdong Provincial Key Laboratory of Infectious Diseases and Molecular Immunopathology, China and National Science Foundation of China (NO.81470152).
References
Cao SM, Simons MJ, Qian CN (2011). The prevalence and prevention of nasopharyngeal carcinoma in China. Chin J Cancer, 30, 114-9.
Chen CZ, Li DR, Chen ZJ, et al (2008). [Long-term efficacy of prophylactic upper neck irradiation for stage N0 nasopharyngeal carcinoma]. Ai Zheng, 27, 295-8.
Chen JY, Liu WW (2002). Analysis of 8 years follow up information of malignant tumor in industrial system of Guangzhou. Ai Zheng, 21, 1254-8.
China health statistics yearbook (2005). Beijing: Peking Union Medical College Publication House.
China health statistics yearbook (2006). Beijing: Peking Union Medical College Publication House.

Zhen-Xi Xu et al
Asian Pacific Journal of Cancer Prevention, Vol 16, 20156734
0
25.0
50.0
75.0
100.0
New
ly d
iagn
osed
with
out
trea
tmen
t
New
ly d
iagn
osed
with
tre
atm
ent
Pers
iste
nce
or r
ecur
renc
e
Rem
issi
on
Non
e
Chem
othe
rapy
Radi
othe
rapy
Conc
urre
nt c
hem
orad
iatio
n
10.3
0
12.8
30.025.0
20.310.16.3
51.7
75.051.1
30.031.354.2
46.856.3
27.625.033.130.031.3
23.738.0
31.3
0
25.0
50.0
75.0
100.0
New
ly d
iagn
osed
with
out
trea
tmen
t
New
ly d
iagn
osed
with
tre
atm
ent
Pers
iste
nce
or r
ecur
renc
e
Rem
issi
on
Non
e
Chem
othe
rapy
Radi
othe
rapy
Conc
urre
nt c
hem
orad
iatio
n
10.3
0
12.8
30.025.0
20.310.16.3
51.7
75.051.1
30.031.354.2
46.856.3
27.625.033.130.031.3
23.738.0
31.3
China health statistics yearbook (2007). Beijng: Peking Union Medical College Publication House.
China health statistics yearbook (2008). Beijing: Peking Union Medical College Publication House.
China health statistics yearbook (2014). Beijing: Peking Union Medical College Publication House.
Hao J, Chen WQ (2012). Chinese cancer registry annual report 2012, Beijing,China., Military Medical Sciences Press.
Hao J, Zhao P, Chen WQ (2012). Chinese cancer registry annual report 2011, Beijing,China., Military Medical Sciences Press.
Lin K, Shen W, Shen Z, et al (2002). Dietary exposure and urinary excretion of total N-nitroso compounds, nitrosamino acids and volatile nitrosamine in inhabitants of high- and low-risk areas for esophageal cancer in southern China. J Intern du Cancer, 102, 207-11.
P Z, WQ C 2010. Chinese cancer registry annual report 2010, Beijing,China, Military Medical Sciences Press.
Qiu WL, Lin PJ, Ruan FQ, et al (2013). Requests for health education from Chinese cancer patients during their recovery period: a Cross-Sectional Study. J Cancer Education, 28, 428-34.
Shi X-J, Au WW, Wu K-S, et al (2014). Mortality Characteristics and Prediction of Female Breast Cancer in China from 1991 to 2011. Asian Pac J Cancer Prev, 15, 2785-91.
Tang W-R, Fang J-Y, Wu K-S, et al (2014). Epidemiological Characteristics and Prediction of Esophageal Cancer Mortality in China from 1991 to 2012. Asian Pac J Cancer Prev, 15, 6929-34.
Wei WI, Sham JST (2005). Nasopharyngeal carcinoma. The Lancet, 365, 2041-54.
Xu ZJ, Zheng RS, Zhang SW, et al (2013). Nasopharyngeal carcinoma incidence and mortality in China in 2009. Chin J Cancer, 32, 453-60.
Yin WB, Yu ZH, Xu GZ, et al 2008. Radidtion oncology, beijing,china, peking union medical college press.
Zhao P, Chen WQ 2009. Chinese cancer registry annual report 2008, beijing,China., Military medical sciences press.