Embed Size (px)
Citation preview

RESEARCH AND POLICY NOTES 2
Martin Čihák and Jaroslav Heřmánek:Stress Testing the Czech Banking System: Where Are We? Where Are We Going?
RESEARCH AND POLICY NOTES
Stress Testing the Czech Banking System: Where Are We? Where Are We Going?
Martin Čihák Jaroslav Heřmánek
2/2005

CNB Research and Policy Notes The Research and Policy Notes of the Czech National Bank (CNB) are intended to disseminate the results of the CNB’s research projects as well as the other research activities of both the staff of the CNB and collaborating outside contributors. The Notes aim to present topics related to strategic issues or specific aspects of monetary policy and financial stability in a less technical manner than the CNB Working Paper Series. The Notes are refereed internationally. The referee process is managed by the CNB Research Department. The Notes are circulated to stimulate discussion. The views expressed are those of the authors and do not necessarily reflect the official views of the CNB. Printed and distributed by the Czech National Bank. Available at http://www.cnb.cz.
Reviewed by: Michal Hlaváček (Czech National Bank) Jarmila Musilová (Czech National Bank) Richard Podpiera (International Monetary Fund) Project Coordinator: Aleš Čapek © Czech National Bank, November 2005 Martin Čihák, Jaroslav Heřmánek

Stress Testing the Czech Banking System: Where Are We? Where Are We Going?
Martin Čihák and Jaroslav Heřmánek*
Abstract This note summarizes the various outputs from the CNB research project Stress Testing for Banking Supervision. Previous research notes in this project presented the key stress testing concepts and discussed the design of stress tests in general terms. Since then, the project has generated outputs that were presented, for example, in the CNB’s first Financial Stability Report. The note describes the current status of the project by presenting the latest stress test results and by comparing the methodology of these tests with those presented by other central banks. Finally, the note suggests further steps to improve the stress testing program at the CNB, such as strengthening credit risk modeling, including by engaging commercial banks in the exercise. The note is accompanied by an appendix presenting one of the project’s outputs, namely a survey of stress testing practices in commercial banks.
JEL Codes: G21, G28, E44. Keywords: Banking system, stress tests.
* Martin Čihák, International Monetary Fund ([email protected]); Jaroslav Heřmánek. Czech National Bank ([email protected]). This work was supported by Czech National Bank Research Project No. B6/2003. We would like to thank, without implicating, Michal Hlaváček, Jarmila Musilová, and Richard Podpiera for their useful comments on an earlier draft. Eva Komárková contributed to Appendix I.
2 Martin Čihák, Jaroslav Heřmánek
Introduction and Summary of Conclusions
This note is the final report from the CNB’s research project Stress Testing for Banking Supervision. The objective of the project was to review methods of system-focused stress testing and discuss issues relating to the design of such stress tests for the domestic banking sector. The note follows up on previous reports issued in this project, namely Čihák (2004a) and Čihák (2004b). The note addresses the two questions in the heading, i.e. what is the current status of the stress testing work program at the CNB, and what steps should be taken to develop the program further.
The note consists of four sections and an appendix. The first section summarizes the various outputs under this grant. The second section presents the most recent output, namely the results of the latest stress tests for the Czech banking sector. The third section tries to “benchmark” this output by comparing the stress tests as presented in the CNB’s Financial Stability Report (FSR) with those contained in similar reports by other central banks. This is used as a background for the last, fourth section, which discusses steps to improve the stress tests at the CNB. The note is accompanied by an appendix which contains the results of a survey of stress tests in Czech commercial banks.
The note shows that the project delivered what was envisaged, namely a review of the relevant literature and a discussion of stress test design in the Czech conditions. It also led to the CNB’s first-ever stress tests, which—as the note shows—were similar in terms of methodology to such exercises presented by other central banks. The results of the tests show a system that is generally resilient, but also one that has declining pre-shock and after-shock capital adequacy and that faces several potential challenges. Going forward, the note suggests (i) improving the links between the exercise and macroeconomic analysis; (ii) strengthening credit risk modeling, including by (iii) engaging commercial banks in the stress testing exercise; (iv) including additional types of shocks; (v) strengthening some other analytical tools that are complementary to stress testing; (vi) in the medium to long term, broadening the scope of the exercise to include non-bank financial institutions. The note provides a detailed list of recommendations with suggested timeframes for implementation.
1. Outputs from the Project
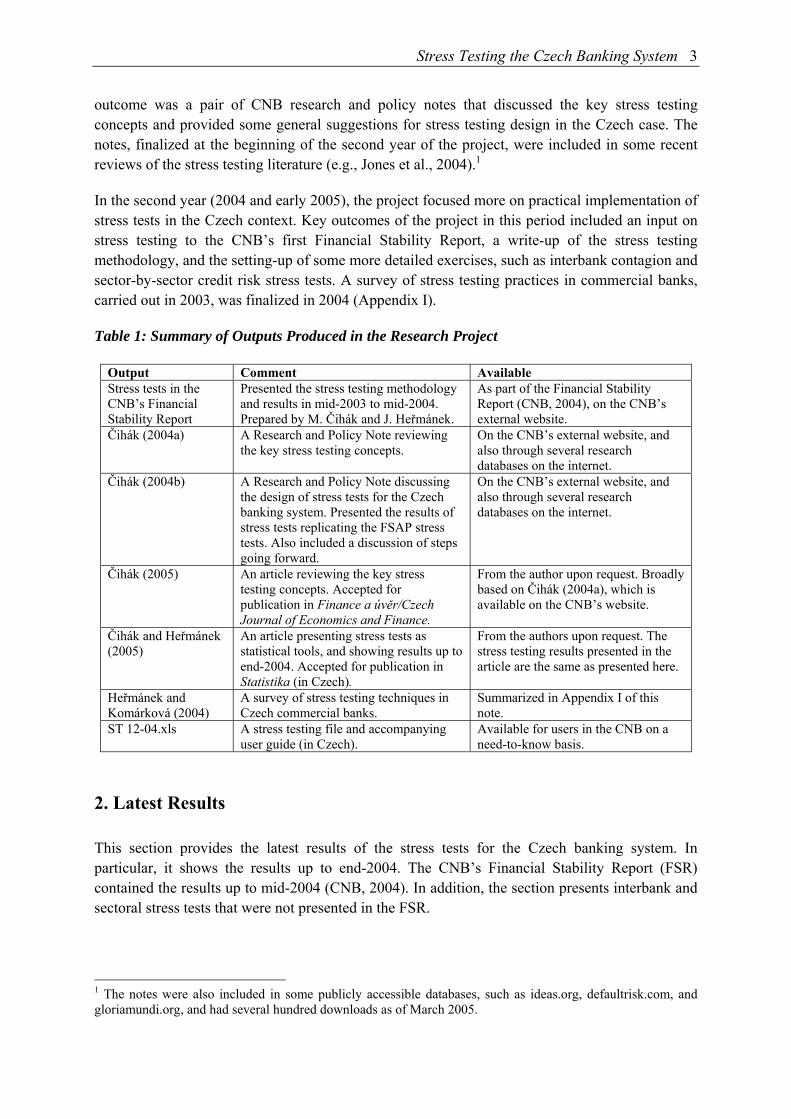
The Stress Testing project resulted in a number of outputs (Table 1), which fall into two categories, reflecting the two broad purposes of the project. First, the project was designed to have a learning aspect for the CNB, as this area of analysis has not been developed so far. Therefore, some of the outputs from the project are focused on surveying the existing literature and extracting the key lessons. Second, the intention from the outset was to employ some of the research output directly in operational work in the financial sector. In particular, it was expected that this research project would lead to the design and implementation of basic stress tests for the Czech banking system. Some outputs from the project were therefore geared towards this goal.
In the first year (2003), the project focused on reviewing the key theoretical concepts and the work done in this area by international financial institutions, central banks, and others. The key
Stress Testing the Czech Banking System 3
outcome was a pair of CNB research and policy notes that discussed the key stress testing concepts and provided some general suggestions for stress testing design in the Czech case. The notes, finalized at the beginning of the second year of the project, were included in some recent reviews of the stress testing literature (e.g., Jones et al., 2004).1
In the second year (2004 and early 2005), the project focused more on practical implementation of stress tests in the Czech context. Key outcomes of the project in this period included an input on stress testing to the CNB’s first Financial Stability Report, a write-up of the stress testing methodology, and the setting-up of some more detailed exercises, such as interbank contagion and sector-by-sector credit risk stress tests. A survey of stress testing practices in commercial banks, carried out in 2003, was finalized in 2004 (Appendix I).
Table 1: Summary of Outputs Produced in the Research Project
2. Latest Results
This section provides the latest results of the stress tests for the Czech banking system. In particular, it shows the results up to end-2004. The CNB’s Financial Stability Report (FSR) contained the results up to mid-2004 (CNB, 2004). In addition, the section presents interbank and sectoral stress tests that were not presented in the FSR.
1 The notes were also included in some publicly accessible databases, such as ideas.org, defaultrisk.com, and gloriamundi.org, and had several hundred downloads as of March 2005.
Output Comment Available Stress tests in the CNB’s Financial Stability Report
Presented the stress testing methodology and results in mid-2003 to mid-2004. Prepared by M. Čihák and J. Heřmánek.
As part of the Financial Stability Report (CNB, 2004), on the CNB’s external website.
Čihák (2004a) A Research and Policy Note reviewing the key stress testing concepts.
On the CNB’s external website, and also through several research databases on the internet.
Čihák (2004b) A Research and Policy Note discussing the design of stress tests for the Czech banking system. Presented the results of stress tests replicating the FSAP stress tests. Also included a discussion of steps going forward.
On the CNB’s external website, and also through several research databases on the internet.
Čihák (2005) An article reviewing the key stress testing concepts. Accepted for publication in Finance a úvěr/Czech Journal of Economics and Finance.
From the author upon request. Broadly based on Čihák (2004a), which is available on the CNB’s website.
Čihák and Heřmánek (2005)
An article presenting stress tests as statistical tools, and showing results up to end-2004. Accepted for publication in Statistika (in Czech).
From the authors upon request. The stress testing results presented in the article are the same as presented here.
Heřmánek and Komárková (2004)
A survey of stress testing techniques in Czech commercial banks.
Summarized in Appendix I of this note.
ST 12-04.xls A stress testing file and accompanying user guide (in Czech).
Available for users in the CNB on a need-to-know basis.
4 Martin Čihák, Jaroslav Heřmánek
When interpreting all stress tests, it is necessary to take into account their various theoretical and practical limits. First, system-wide stress tests are designed to assess the stability of the system as a whole and not that of individual institutions. Stress tests do not cover risks that are specific to individual institutions, such as asset quality, operational or legal risks, or fraud. Second, even at the aggregate level, stress tests provide only approximate results, because, like any model, they are only an imitation of reality. The tests look at banks as largely passive objects, and do not take into account banks’ and supervisors’ responses to external shocks. Some sources of risk (e.g., risk resulting from changes in prices of stocks held by banks) were not explicitly evaluated in the scenarios, since preliminary analysis suggests that these factors play a relatively limited role in the Czech banking system. Modeling of other sources of risk, such as the risk of liquidity runs on banks, was deferred until more detailed data are available on previous liquidity runs (see Section 4).
2.1 Basic tests
Stress tests were run for end-2004 data, using the same scenarios as introduced in CNB (2004) (Figure 1 and Table 2). The results of these tests were compared with the results of tests performed using the same methodology for end-December 2003 and end-June 2004 (Table 3).2 Capital adequacy declined during this period (by 1.9 percentage points between end-2003 and end-2004).3 The results of the stress tests suggest that banks’ overall exposure to the basic risks also declined, but the decline was smaller than the decline in the capital adequacy ratio. As a result, the overall decline in the after-shock capital adequacy ratio between end-2003 and end-2004 (by 1.5 percentage points in Scenario I and by 1.3 percentage points in Scenario II) was lower than for the pre-shock CAR. The after-shock CAR remains above 8 percent, the regulatory minimum for individual banks.
For some banks, the after-shock CAR could decline below 8 percent, but reaching this minimum again would require a relatively small capital injection by their owners, altogether less than 0.1 percent of GDP (Scenario I) and 0.5 percent of GDP (Scenario II).
The relative importance of the individual risk factors did not change substantially between end-2003 and end-2004. Within the overall decline in risks, exposure to interest risk relatively increased, while exposure to credit risk relatively declined.
Some differences can be observed in the risk developments in the individual bank groups. Large and medium-sized banks saw a decline in their after-shock CAR between mid-2004 and end-2004, while small banks experienced an increase in the same period.
Table 3 also includes an illustrative impact of the stress tests on dividends. In the example of Table 3, we show the impacts of the assumed shocks on dividends, assuming that dividends would otherwise (i.e., in the absence of any shocks) be the same in each bank as they were in the last 2 The results for previous periods, presented in Čihák (2004b) and CNB (2004), are only broadly comparable due to differences in methodology. 3 The immediate reason for the decline in the pre-shock CAR was the fact that several banks used profits from previous periods to pay dividends. One of the reviewers, Michal Hlaváček, suggested modeling the impact of shocks in dividend policy on the capital adequacy of banks. This would require modeling the behavior of the banks’ owners, which is quite complex, but not impossible, and could be an interesting topic for future work.

Stress Testing the Czech Banking System 5
year.4 The impact on dividends is quite substantial: a 54 percent decline for Scenario I and 95 percent decline for Scenario II.
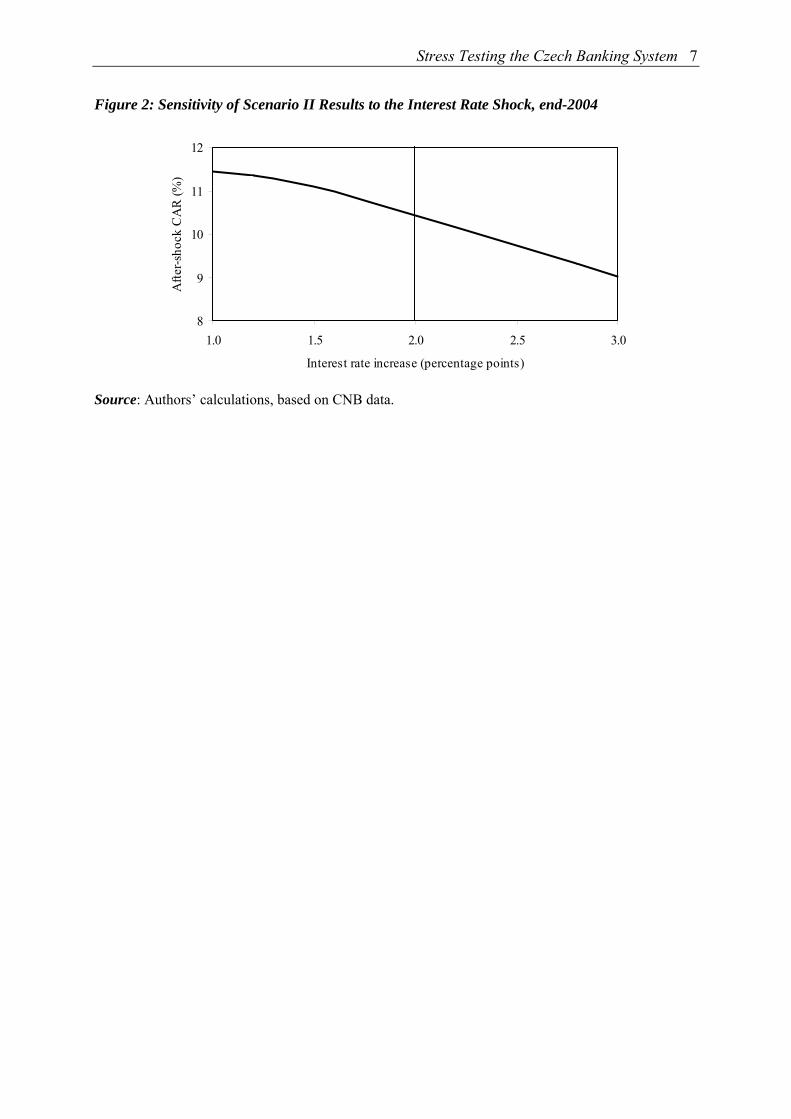
Figure 2 illustrates the sensitivity of the after-shock CAR in Scenario II with respect to the size of the interest rate shock. For example, if the interest rate increased by 3 percentage points instead of the 2 percentage points assumed in Scenario II, the after-shock CAR would be about 9 percent instead of 10.4 percent in Scenario II. (Table 2).
2.2 Additional tests
In addition to the simple stress tests, more complex tests were calculated for other types of risks. These include a stress test for interbank contagion, which tries to assess the risk of a failure of one bank impacting on other banks through their exposures in the interbank market, and sector-by-sector credit stress tests.
A matrix of uncollateralized interbank exposures was composed, as proposed in Čihák (2004b). The results of tests based on this matrix suggest that the risk of interbank contagion is relatively low. In particular, two forms of the test were carried out. First, a “pure” contagion test was conducted, which assumes a failure in an individual bank and asks what its impact on other banks would be. The test found that a failure of a large net borrower in the interbank market could lead to a failure in another, smaller bank. However, this failure would not lead to any further, second-round failures through interbank exposures, i.e., the risk of a “domino” effect is limited. Moreover, the assumed failure of the large bank is unlikely. This was confirmed by the “macro” stress test, which tests for contagion in a system exposed to a set of shocks in the macroeconomic stress test scenario. In particular, Scenarios I and II, described in Table 2, did not lead to bank-to-bank contagion effects caused by interbank exposures.5
Credit stress tests were also carried on a sector-by-sector basis to find out which sectors represent the exposures with the biggest potential impact on the banking sector. For illustrative purposes, we present here basic tests that asked for each sector what would happen to the banks’ capital adequacy if either 50 percent or all performing loans in the sector were to become nonperforming as a result of a severe sector-specific shock. Admittedly, these are drastic shocks, but not completely outside the historical experience on a bank-by-bank basis: there are twelve banks with an NPL ratio of 90–100 percent for one or more sectors, and, conversely, for nine of the fifteen sectors there is at least one bank with an NPL to total loan ratio in the 90–100 percent range.6 It was assumed that the additional NPLs would require an average provisioning rate of 50 percent.7
4 If a bank had dividends last year, this calculation assumes that the dividends are used to absorb the shock (i.e. the impact of the shock is deducted from the dividends). If the shock is bigger than can be absorbed by the dividends, the dividends are completely wiped out and the rest of the impact is absorbed by capital. If the bank had no dividends, the whole shock is absorbed by capital. 5 The most recent stress tests are for end-2004, but the latest interbank contagion test is for mid-2004. 6 The number underscores the high variability on a bank-by-bank basis. On aggregate, the sectoral NPL ratios also vary (Table 4). Based on the past, high NPLs would seem more likely in sectors such as hospitality (with an NPL ratio of about 18 percent) than in sectors such as insurance (with an NPL ratio close to zero). 7 This parameter can be easily changed in the stress testing file. The 50 percent figure was chosen for convenience, as well as because it is not far from the actual provisioning rate for existing NPLs, which stands at about 58 percent.

6 Martin Čihák, Jaroslav Heřmánek
The sectoral stress tests (Table 4), performed on end-2004 data, suggest that banks’ exposures are quite dispersed across sectors, and, as a result, even such relatively drastic shocks as assumed here could mostly be absorbed by the system. For all the sectors of economic activity, the capital adequacy of the system stays above 10 percent. The only exception is the wide “other activities” category, which includes household lending (accounting for roughly 31 percentage points of the category’s 38 percent share) and a range of various services activities. In the sectoral breakdown by residency/legal status, loans to nonresidents amount to only a very small exposure: even if all loans to such borrowers became nonperforming, the banking system would remain well capitalized. The same applies to loans to domestic public companies and resident foreign-controlled companies. The biggest exposures are to domestic private companies and households. However, the large number of individual exposures in these sectors, and the low NPL ratios so far, especially in the case of households, make it very unlikely that all loans in these sectors would become nonperforming.
It may be realistic to assume sectoral scenarios that are less “concentrated,” i.e. cover several sectors in Table 4. Therefore, the additional calculations also included stress tests that impact on a range of sectors at the same time, even though not as drastically as assumed above. For example, a scenario was calculated in which a substantial sudden appreciation of the CZK undercuts a number of sectors simultaneously, in particular the export-oriented sectors. However, the impact of this scenario on banks’ capital adequacy is small for reasons already obvious from Table 4: even if all loans to manufacturing—one of the most export-oriented sectors—became non-performing, the banking system’s CAR would still be above 10 percent.
Figure 1: Summary of Stress Testing Results, 2003–2004 (Capital adequacy, in percent)
8
9
10
11
12
13
14
15
December 2003 June 2004 December 2004
Pre-shockAfter Scenario IAfter Scenario II
Source: Authors’ calculations, based on CNB data.
Stress Testing the Czech Banking System 7
Figure 2: Sensitivity of Scenario II Results to the Interest Rate Shock, end-2004
8
9
10
11
12
1.0 1.5 2.0 2.5 3.0
Interest rate increase (percentage points)
Afte
r-sho
ck C
AR
(%)
Source: Authors’ calculations, based on CNB data.

Table 2: Methodology of the Stress Tests Risk Sizes of Shocks Motivation of the Selected Shock Sizes Notes on Methodology Factor Scenario
I Scenario II
Interest rate shock
Interest rate increase of 1 pct point
Interest rate increase of 2 pct points
The FSAP missions generally applied interest rate shocks from 0.5 to 3 percentage points. The 2 percentage point shock was recommended by the Basel Committee for Banking Supervision. The same shock size is also contained in the U.S. Federal Reserve supervisory guidelines. The FSAP mission for the Czech Republic applied an interest rate shock of 1.5 percentage points.
It is assumed that the reference rates increase, which leads to an increase in interest rates on loans and deposits. Also, the value of bonds in banks’ portfolios decreases.
Exchan-ge rate shock
Exchange rate deprec-iates by 15 percent
Exchange rate deprec-iates by 20 percent
Basel Committee documents use exchange rate movements of 8 percent; for options, the committee suggests considering swings of at least 25 percent. The Derivatives Policy Group (1995) recommended using exchange rate shocks of at least 6 percent among the main world currencies and 20 percent for all other currencies. Exchange rate shocks used by FSAP missions were generally in the range of 10 to 50 percent. The Czech Republic FSAP included a depreciation of the effective exchange rate by 16.5 percent, which corresponded to 3 standard deviations (about 1 percent confidence level assuming log-normal distribution). Maximum 3-month changes in the past were about 20 percent (depreciation) and 10 percent (appreciation).
It is assumed that the CZK depreciates against all other currencies. We measure both the direct impact of this change on banks through the currency structure of their assets, liabilities, and off-balance sheet positions, and the indirect impact through changes in the ability of borrowers to repay FX credits. This indirect effect is presented as a part of the impact of the credit shock.
Credit shock
An increase in NPLs of 30 percent
An increase in the NPL to total loan ratio of 3 pct. points.
Most FSAP missions assumed an increase in NPLs of 5–30 percent; the Czech Republic FSAP assumed an increase in the NPL to total loan ratio of 7.8 percentage points (the same as in 1997–1999), which in 2001 implied an increase in the volume of NPLs of 63 percent. The assumed increased here is at or above the interval used by the FSAP missions. This has two reasons. First, in this increase we try to reflect the indirect impact of the increase in interest rates and exchange rate depreciation on credit quality. Second, we try to capture the potential risk arising from the rapidly growing loans to households. These loans so far have a very low delinquency rate (thanks to which overall NPLs declined to 5 percent of total loans from 22 percent in 1999, and are around the historical minimum), but with the rapid growth rate, even a small deterioration in credit quality can lead to a rapid percentage increase in NPLs, given their presently low level.
To capture the fact that credit risk can be proportional to total credit rather than to NPLs (which is likely given the changing structure of credit), Scenario II expresses the increase in NPLs in terms of their ratio to total loans. An increase in this ratio of 3 percentage points implies an increase in NPLs of 60 percent (for mid-2004 data).
Notes: For Basel Committee documents, see www.bis.org. For other details on scenario design, see Čihák, M. (2004b).

Stress Testing the Czech Banking System 9
Table 3: Summary of Stress Testing Results, 2003–2004 (In percent, unless stated otherwise)
December 2003 June 2004 December 2004
CAR pre-test 1 14.5 13.6 12.6 o/w large banks 13.5 12.3 11.2 o/w medium banks 16.9 17.9 16.8 o/w small banks 19.5 16.1 18.9
Scenario ITotal impact of shocks (percentage points) -2.9 -2.7 -2.3Interest rate shock -1.5 -1.5 -1.6Exchange rate shock 0.7 0.9 1.0Credit shock -2.1 -2.0 -1.7… o/w indirect effect of exchange rate shock -1.3 -1.2 -1.1Use of profits (percentage points) 2 2.0 1.9 1.7CAR after-test 13.5 12.8 12.0 o/w large banks 13.3 12.3 11.2 o/w medium banks 14.6 15.8 15.2 o/w small banks 16.5 13.9 17.0Capital injection (percent of GDP) 3 0.05 0.06 0.04Impact on dividends 4 -63.0 -65.6 -53.9
Scenario IITotal impact of shocks (percentage points) -5.4 -5.3 -5.0Interest rate shock -3.0 -3.1 -3.3Exchange rate shock 1.0 1.2 1.4Credit shock -3.4 -3.4 -3.1… o/w indirect effect of exchange rate shock -1.7 -1.7 -1.5Use of profits (percentage points) 2 2.6 2.4 2.8CAR after-test 11.7 10.7 10.4 o/w large banks 11.8 10.5 10.2 o/w medium banks 12.8 14.0 13.5 o/w small banks 14.8 12.1 15.5Capital injection (percent of GDP) 3 0.4 0.4 0.5Impact on dividends 4 -88.0 -97.8 -95.3
Source: Authors' calculations, based on CNB data.1 CAR stands for capital adequacy, defined as per the CNB's regulations.2 Both scenarios assume that in the absence of shocks, each bank would have the same profit (loss) as was its average forthe last 5 years, and that it would use any profits as a first line of defence before letting CAR decline. 3 Capital needed for each bank in the system to have after-shock CAR of at least 8 percent.4 In percent of dividends of the last calendar year.

10 Martin Čihák, Jaroslav Heřmánek
Table 4: Sector-by-Sector Credit Stress Tests, end-2004 (All data in percent)
Shock I Shock II
CARCapital inject. CAR
Capital inject.
Total, sectors by production 100.0 4.9 ... ... ... ...Agriculture, hunting, fishing 2.2 8.5 12.8 0.0 12.7 0.0Forestry and logging 0.1 12.8 12.8 0.0 12.8 0.0Mining of minerals 0.6 1.9 12.8 0.0 12.8 0.0Manufacturing 15.3 8.6 12.2 0.0 10.1 0.4Electricity, gas, and water 3.1 0.0 12.6 0.0 12.5 0.0Construction 1.6 10.8 12.8 0.0 12.8 0.0Trade and maintenance 11.3 9.2 12.5 0.0 11.7 0.2Accommodation and hospitality 0.5 17.9 12.8 0.0 12.8 0.0Transport and storage 2.1 5.1 12.8 0.0 12.8 0.0Communications 0.9 1.4 12.8 0.0 12.8 0.0Financial intermediation except insurance 10.6 1.2 12.5 0.0 11.0 0.4Insurance 0.4 0.3 12.8 0.0 12.8 0.0Leasing of machines and appliances 10.1 2.0 11.9 0.2 10.6 0.7Other business activities 2.9 6.4 12.6 0.0 12.4 0.0Other activities 38.3 3.7 9.2 1.5 2.4 4.3
Total, sectors by residency/legal status 100.0 4.9 ... ... ... ...Residents 96.6 4.6 -2.6 5.1 ... ...
Nonfinancial enterprises 45.9 6.6 7.3 1.2 -2.2 4.6Public 2.6 3.3 12.8 0.0 12.7 0.0Private, domestic 31.1 8.2 9.9 0.5 3.9 2.3Private, foreign controlled 12.3 3.3 12.0 0.1 11.0 0.6
Financial institutions 8.1 1.6 12.5 0.0 11.9 0.2Government institutions 11.5 0.1 12.1 0.1 9.9 0.8Households 31.2 4.2 10.3 1.2 5.7 3.5
With trading license 2.9 12.4 12.8 0.0 12.7 0.0Other households 28.3 3.4 10.7 1.2 6.6 3.2
Nonresidents 3.4 13.2 12.6 0.0 12.3 0.1Nonfinancial enterprises 3.2 13.7 12.6 0.0 12.3 0.1Government institutions 0.0 0.0 12.8 0.0 12.8 0.0Households 0.1 5.2 12.8 0.0 12.8 0.0
Trading license 0.0 0.1 12.8 0.0 12.8 0.0Other households 0.1 7.8 12.8 0.0 12.8 0.0
Share of total
credit
NPLs to total credit
in sector
Source: Authors, based on data from the CNB. Notes: Shock I ... 50% of PLs in the sector become NPLs; 50% provisioning on the additional NPLs.
Shock II ... All loans in the sector become NPLs; 50% provisioning on the additional NPLs. Capital inject. ... capital needed (in percent of GDP) for each bank to have an after-shock CAR of at least 8%. The NPL ratio for the total of all sectors differs slightly from the ratio obtained from the aggregate data. This is due to different data sources for the two variables. Work on reconciling the two series is ongoing in the CNB. The results for Shock II for all loans to residents are not shown because of low plausibility of such a drastic shock.
Stress Testing the Czech Banking System 11
3. Survey of Stress Tests in Financial Stability Reports
To better answer the title-page questions—where we stand in terms of stress testing, and what can be done going forward—a survey was done of the stress tests presented by central banks in their recent financial stability reports (FSRs). The number of central banks publishing FSRs has grown substantially (from two in the mid-1990s to about forty at end-2004),8 and a larger proportion of FSRs now include summaries of stress tests (the share having increased from zero in the mid-1990s to more than one half at end-2004). This indicates not only that financial stability issues are gaining more prominence in central banks’ work programs, but also that stress testing has become an increasingly important analytical tool in financial stability work.
This section is based on a review of 36 recent FSRs, focusing on the features of their stress tests.9 It also compares these stress tests with those presented in CNB’s FSR. This review is based on publicly available information contained in the FSRs published by central banks. This has the advantage that the information can be easily verified. The disadvantage is that it may under-represent the work done in this area by central banks. Many central banks carry out financial stability work without publishing an FSR, and even banks that publish FSRs may do other work that does not get published in the FSR.
Table 6 compares the stress tests in FSRs in various countries. The fact that an analysis does not include stress tests or that the stress tests do not explicitly include certain risks does not mean that the risks are not discussed and analyzed in the FSR. For example, even when an FSR does not contain an explicit stress test for exchange rate risk, the report would typically include a discussion of the open positions in foreign currency. Similarly, when a central bank does not publish an FSR or does not include stress tests in its FSR, it may still carry out stress tests for internal purposes, without publishing the results.
There is substantial cross-country variation in the sizes and ranges of the shocks covered and in the methodologies applied. This reflects differences in the financial systems and the risks that they face, as well as differences in the quality and structure of the available data. Nonetheless, the stress tests in the FSRs show several common features:
− In most cases, the interest in stress tests was spurred by a Financial Sector Assessment Program (FSAP) mission. In some cases, recent stability report(s) have included a summary of the FSAP stress tests (Austria, Netherlands), and it is likely that the central bank will continue with its own stress testing program, broadly along FSAP lines. In other cases (Denmark, Norway), the FSR has included “FSAP-style” stress tests even before the country has undergone an FSAP.
8 In some cases, the name of the report is slightly different, e.g. Financial Stability Review. In several countries, a similar report is also published by a separate regulatory agency. 9 Included in the survey were FSRs from Australia, Austria, Belgium, Brazil, Canada, Chile, Denmark, Euro Area, Estonia, Finland, France, Germany, Hungary, Hong Kong, Indonesia, Iceland, Indonesia, Ireland, Italy, Israel, Latvia, Luxembourg, Netherlands, New Zealand, Norway (2 issuers), Philippines, Poland, Portugal, Slovak Republic, Slovenia, Spain, Sweden, Switzerland, and the UK (2 issuers).

12 Martin Čihák, Jaroslav Heřmánek
− The stress tests tend to have a wide coverage of the banking sector, covering either all or virtually all banks in terms of market share. Other parts of the financial sector are covered only exceptionally.10
− Virtually all the presented stress tests are based on bank-by-bank data. This can be understood as recognition that stress tests done on aggregate data risk missing some potentially important risks arising from concentration of risks in weaker institutions.
− Credit risk is covered in almost all the stress tests. Interest rate risk is covered in most of them. Exchange rate risk is covered in some, but in many cases it is analyzed only in terms of open positions, without an explicit stress test.
− Most stress tests are simple sensitivity analysis calculations. Some include scenario analysis, based on historical or hypothetical scenarios. Only a few stress tests are based on an econometric model. When models are used, they tend to be relatively rudimentary compared to those used in other central bank work, such as inflation forecasting. Inclusion of indirect exchange rate effects and contagion is rare. When the latter is done, it is a basic exercise based on net interbank market exposures.
− Virtually all the surveyed FSRs have been positive in their overall assessment of the financial sector, suggesting that it is stable. This mirrors the fact that FSRs in general tend to have overall positive findings. Stress tests, in those FSRs that present them, tend to confirm this conclusion by finding that the system is robust and capable of withstanding substantial shocks. The fact that the findings are generally positive has several possible explanations. First, financial systems across the globe have recently enjoyed a period of positive developments and relative stability. Second, there is a selection bias: countries with bigger weaknesses in their financial systems are more likely to refrain from publishing FSRs. Third, there may be a bias in the FSRs themselves, if the publishing institutions hold back from publishing negative or deteriorating results.
Based on the cross-country comparison, it seems that the stress tests presented in the CNB’s FSR do not lag behind the stress tests presented so far in other central banks’ FSRs. However, this should not be a reason for satisfaction. The stress tests presented in most FSRs are very rudimentary, as central banks are still only at the beginning of their work in this area.
Table 5: Stress Tests in Selected European Financial Stability Reports Percent of FSRs CNB’s FSR Stress tests included 55 Yes Stress tests follow those in a recent FSAP 50 Yes Credit risk stress test included 55 Yes Interest rate risk stress tests included 45 Yes Exchange rate risk stress tests included 33 Yes Other risks included 33 Yes Scenario analysis included 38 Yes Contagion analysis included 10 Yes Credit risk based on a macromodel or other detailed model
8 No
Source: Author’s calculations, based on a sample of 36 FSRs publicly available as of end-2004.
10 For example, the German FSR includes stress tests for the insurance sector.
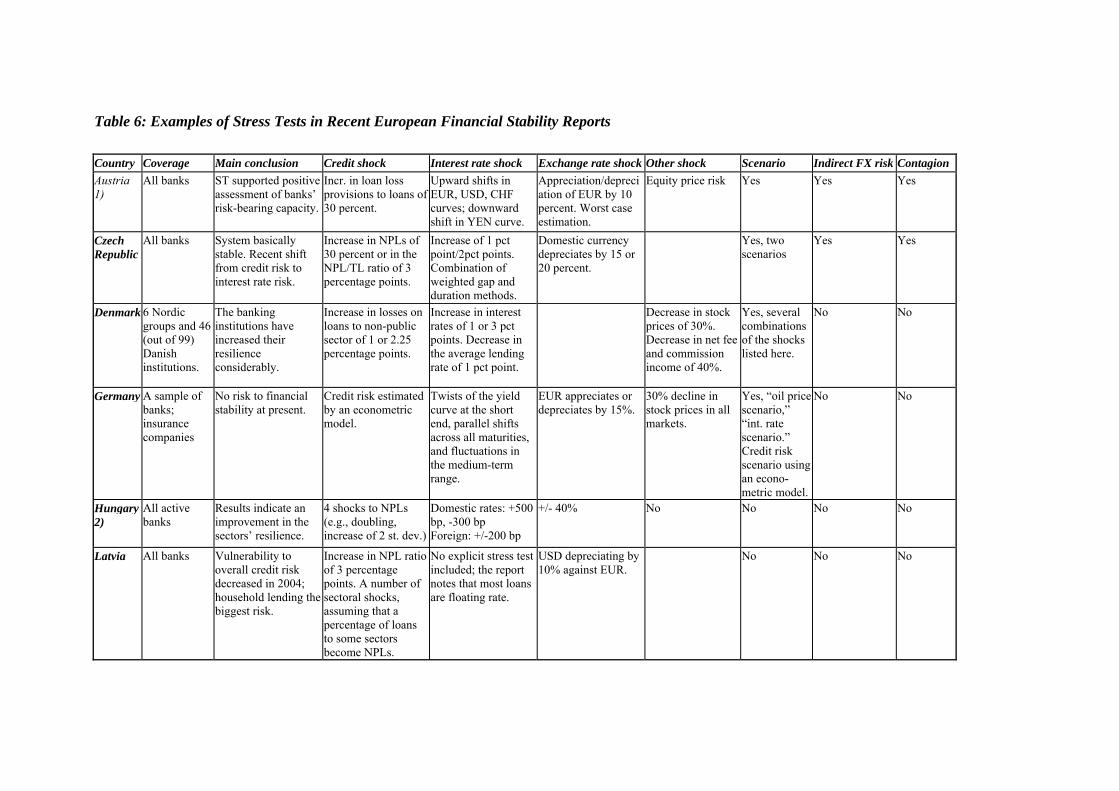
Table 6: Examples of Stress Tests in Recent European Financial Stability Reports Country Coverage Main conclusion Credit shock Interest rate shock Exchange rate shock Other shock Scenario Indirect FX risk Contagion Austria 1)
All banks ST supported positive assessment of banks’ risk-bearing capacity.
Incr. in loan loss provisions to loans of 30 percent.
Upward shifts in EUR, USD, CHF curves; downward shift in YEN curve.
Appreciation/depreciation of EUR by 10 percent. Worst case estimation.
Equity price risk Yes Yes Yes
Czech Republic
All banks System basically stable. Recent shift from credit risk to interest rate risk.
Increase in NPLs of 30 percent or in the NPL/TL ratio of 3 percentage points.
Increase of 1 pct point/2pct points. Combination of weighted gap and duration methods.
Domestic currency depreciates by 15 or 20 percent.
Yes, two scenarios
Yes Yes
Denmark 6 Nordic groups and 46 (out of 99) Danish institutions.
The banking institutions have increased their resilience considerably.
Increase in losses on loans to non-public sector of 1 or 2.25 percentage points.
Increase in interest rates of 1 or 3 pct points. Decrease in the average lending rate of 1 pct point.
Decrease in stock prices of 30%. Decrease in net fee and commission income of 40%.
Yes, several combinations of the shocks listed here.
No No
Germany A sample of banks; insurance companies
No risk to financial stability at present.
Credit risk estimated by an econometric model.
Twists of the yield curve at the short end, parallel shifts across all maturities, and fluctuations in the medium-term range.
EUR appreciates or depreciates by 15%.
30% decline in stock prices in all markets.
Yes, “oil price scenario,” “int. rate scenario.” Credit risk scenario using an econo-metric model.
No No
Hungary 2)
All active banks
Results indicate an improvement in the sectors’ resilience.
4 shocks to NPLs (e.g., doubling, increase of 2 st. dev.)
Domestic rates: +500 bp, -300 bp Foreign: +/-200 bp
+/- 40% No No No No
Latvia All banks Vulnerability to overall credit risk decreased in 2004; household lending the biggest risk.
Increase in NPL ratio of 3 percentage points. A number of sectoral shocks, assuming that a percentage of loans to some sectors become NPLs.
No explicit stress test included; the report notes that most loans are floating rate.
USD depreciating by 10% against EUR.
No No No

Country Coverage Main conclusion Credit shock Interest rate shock Exchange rate shock Other shock Scenario Indirect FX risk Contagion Poland All banks The system exhibits
high stability. Three shocks: (i) satisfactory and special mention loans migrate to doubtful; (ii) substandard and doubtful migrate to loss; and (iii) bankruptcy of three largest borrowers.
Not a stress test, but an analysis of gains/losses on interest-sensitive instruments, and the maturity of debt securities.
Not a stress test, but an analysis of VaR and open positions.
Equity price risk and property market risks analyzed (but without a stress test)
No No
Nether- lands 1)
Major fin. institutions (84% banks, 54% insur.c., 50% pens.f.)
Banks are sufficiently shock-resistant.
+/-50 bps change in credit spreads (larger for insurance and pensions)
+/-100 bps parallel move; 50 bps flattening/steepening of yield curves (larger for ins&pen)
+/-10% change in the exchange rate of EUR vs. other currencies
+/-15% change in all relevant stock indices; 25% increase in market volatilities
Yes, “domestic crisis of confidence,” “dollar crisis”
No Yes
Norway All banks / seven largest conglome-rates.
Short-term stability outlook satisfactory. However, increased vulnerability of household sector.
Decline in economic growth, increased unemployment.
Interest rates unchanged, but interest burden of real sector increased appreciably.
A fall in property prices reduces mortgage values, causing a rise in loss given default.
Yes, all tied to credit risk.
No No
Sweden Four major banks
The major banks have improved their potential for coping with shocks.
Failure of the largest counterparty, assumed recovery ratio of 25 percent.
Increase in interest rates of 1 pct point, and 30 percent fall in the stock market.
No No Yes
1) The latest FSR contained the stress tests carried out by (or in collaboration with) an FSAP mission. 2) Based on end-2003 FSR. The subsequent two FSRs present only the “stress CAR,” which shows a bank’s financial position in a situation where all NPLs are written off. Source: Authors, based on central banks’ recent financial stability reports. Austrian National Bank: Financial Stability Report 7, June 2004. Danmarks Nationalbank: Financial Stability 2003. Deutsche Bundesbank: Report on the Stability of the German Financial System, Monthly Report, October 2004. De Nederlandsche Bank: Overview of Financial Stability in the Netherlands, December 2004, Issue No. 1. Hungarian National Bank: Report on Financial Stability, June 2003. National Bank of Poland: Financial Stability Review, First Half of 2004. Norges Bank: Financial Stability, 2004:1, June 2004. Sveriges Riksbank: Financial Stability Report, 2004:2.

Stress Testing the Czech Banking System 15
4. Steps Going Forward
This research project has concentrated on developing basic system-focused stress tests that cover the key banking sector risks and can be implemented on a regular basis. Such stress tests have been published in the CNB’s first Financial Stability Report and—as illustrated in Section 3—are comparable with similar exercises presented by other central banks. However, central banks are still only at the beginning of their work in this area, and many are working on improvements in their stress testing methodology. It is therefore imperative to develop stress testing at the CNB further.
Going forward, there are several important areas for improvement in the stress tests. Table 7 provides a detailed list of recommendations in tabular form, with a proposed timeline for implementation. The table is based on recommendations made under this project in the first half of 2004 (Čihák, 2004b). Many of the short-term recommendations have already been implemented within this research project. However, there is still some substantial work that remains for possible follow-up projects.
More generally, the remaining work related to stress testing can be grouped into five broad themes: (i) strengthening the links between the stress tests and macroeconomic analysis; (ii) improving credit risk modeling; (iii) widening the coverage of the exercise to include financial institutions other than banks; (iv) including shocks going beyond the basic risks covered so far; and (v) strengthening the other financial sector analysis tools that serve as preconditions for stress tests. These major areas are discussed in more detail below.
4.1 Links to macroeconomic analysis
Ideally, the stress testing scenarios should be based on an explicit macroeconometric model (Jones et al., 2004). Using such a model should in principle provide a forward-looking and internally consistent framework for analyzing key linkages between the financial system and the real economy. Box 1 lists some general considerations when using such macro models.
The basic stress tests presented in CNB (2004) and in Section 2 of this note are not based on an explicit macroeconomic model. As shown in Table 2, the stress testing scenarios used so far were derived using a pragmatic approach that combined a review of shocks used in scenarios by other institutions, and by taking into account the historical shocks in the Czech economy.
The lack of a formal model in the existing stress tests does not mean that these exercises completely disregard macroeconomic relationships. The design of the scenarios has been informed by an assessment of the macroeconomic risks, and the sizes of the shocks in the tests take into account the historical volatility in the risk factors. Nonetheless, it might be useful to support the stress testing exercise by a more explicit macroeconomic model. The objective of using such a model is to link a particular set of shocks to key macro and financial variables in a consistent and forward-looking framework. This does not necessarily require a large research effort, but can leverage on existing expertise and research. The key reason for using this approach is to bring in the discipline and consistency of an empirically-based model and an explicit focus on the link between the macroeconomy and the main vulnerabilities.

16 Martin Čihák, Jaroslav Heřmánek
To avoid duplication of effort, and to leverage on work already done at the central bank, it might be useful to generate stress test scenarios using the CNB’s existing model apparatus, as suggested in Čihák (2004b). The model could be used to determine the relative sizes of the shocks to the risk factors and to assess the likelihood of the scenarios (ideally using stochastic simulations based on the model). However, there are some practical issues with using the CNB’s existing models for the analysis:
− The CNB uses different models for medium-term and short-term forecasts. A disadvantage of the model used for the medium-term forecasts is that it is not sufficiently detailed; also, instead of GDP, it contains only the GDP gap. The disadvantages of the model used for short-term forecasts are the short-term nature of the model and the low transparency of the forecast.
− The CNB’s existing macro-models do not explicitly incorporate the financial sector. In particular, they do not contain links between the macro variables and credit quality. Without such links, it would be difficult to include credit risk and therefore to generate a consistent scenario. It is therefore necessary either to adjust the model, or to create another model linking the macroeconomic model and credit quality.
Given these practical problems in using the existing macroeconomic apparatus, it seems more realistic to develop a separate model linking macroeconomic variables and credit quality rather than trying to adjust the macro model. The survey of stress testing practices in other central banks carried out for Section 3 suggests that even macro models in advanced country central banks do not include the financial sector in sufficient detail to allow direct use of their results in stress tests. In this context, developing a smaller, separate model seems a more viable option.
Babouček and Jančar (2005) analyze the link between system-wide asset quality and macroeconomic factors by estimating a VAR model for the NPL ratio and a number of other variables. They use standard impulse response analysis for testing numerous empirical hypotheses. The authors also present a simple extreme value “stress-testing” of the quality of the banking sector’s aggregate loan portfolio. Based on their model, the authors conclude that the Czech banking sector has reached noticeable stability with respect to macroeconomic shocks.
The Babouček and Jančar (2005) model is very useful for further work. It fills an important gap between the CNB’s macroeconomic modeling and bank-by-bank stress testing. The model is particularly useful because it incorporates the basic stress testing variables—the interest rate, the exchange rate, and asset quality. It allows for simple testing of the consistency of stress testing scenarios. In particular, the relative sizes of shocks in the two scenarios used in our stress tests so far (Scenario I and Scenario II) seem consistent with the results of the model.
The Babouček and Jančar (2005) approach is in line with similar studies done on this topic in other countries.11 Nonetheless, the model also has several problems, some of which are easier to overcome than others. First, the model suffers from some econometric problems, related mostly to structural breaks. Second, it looks only at aggregate credit, not at the sectoral structure of credit. Third, the key variable of the model, i.e. the aggregate ratio of NPLs to total loans, does not have
11 See, for example, Gerlach, Peng, and Shu (2004) and Peng, Lai, Leung, and Shu (2003).

Stress Testing the Czech Banking System 17
a straightforward relationship to financial sector soundness. A higher value typically means less soundness, but it also depends on provisioning and capitalization, and on the concentration of the exposures in individual banks. Therefore, the exercise needs to be linked to the bank-by-bank stress tests that take provisioning and capitalization into account.
It is important to strengthen the links between the stress tests and macroeconomic analysis as suggested above, so that the stress tests are better justified. However, the following two considerations also need to be borne in mind:
− The exact size of shocks in stress test scenarios will always be subject to some uncertainty, simply because the future is unknown, and particularly because the macroeconomic models may not be able, because of their limitations, to simulate well the impacts of the large shocks that are of interest in stress tests.12 To acknowledge and recognize this uncertainty to some extent, the existing stress tests include two different scenarios, reflecting two different levels of stressfulness.
− Using the same scenarios for comparisons over time can somewhat decrease the dependence on having “exact scenarios.” Stress tests should not be seen as forecasts, but rather as ways to measure exposures and compare them with the shock absorption capacity in the system. If stress tests are run on a regular basis for a long time, they can still offer useful information about changes in the structure and overall pool of risks, even if their scenarios are not “exact.”
Box 1: Simulations Using Macro Models: Some Considerations Using a model to simulate a range of macroeconomic scenarios raises a series of questions, such as: • What are the baseline assumptions? The baseline assumption could be no change from the latest data, or the central forecast, or the most likely scenario from the most recent forecasting exercise. • What policy responses are assumed? Depending on the model, different policy reaction functions may be embedded in the model (such as a Taylor rule), or an assumption of no change in policies may be used. Assuming no policy response will typically imply a larger macroeconomic effect of any shock. • What is the time horizon of the simulations? If a quarterly model is available, it may be possible to produce forecasts over the next six to eight quarters. When applying the scenarios to individual balance sheets, however, a shorter time horizon is desirable if no reaction by institutions is assumed. • Which variables are assumed fixed, and which are shocked? Many macroeconomic models use a large number of exogenous variables. Implementing a particular scenario requires judgment as to which variables are assumed constant. Changing a large number of exogenous variables may make the scenario unnecessarily complex, with little benefit in terms of realism. • What size of shocks should be used? Shocks can be calibrated on historical experience (e.g., the largest change over the chosen time horizon seen in the last ten years), or can be set on the basis of a hypothetical scenario (e.g., a 20 percent fall in the exchange rate). Historical experience may be more intuitive and easier to justify, but major structural changes may invalidate the historical calibration.
Source: Adapted from Jones et al. (2004).
12 First, macroeconomic models are typically linear, which may be a good approximation for small changes, but less so for large changes. Second, macroeconomic models may not well capture the feedback from financial instability back to macroeconomic policies and developments. This may compromise the stability of the coefficient estimates from the macroeconomic model in the case of large shocks.

18 Martin Čihák, Jaroslav Heřmánek
The above discussion focused on the link between the macroeconomic factors and credit risk, because credit risk is the area where the main difficulty lies in using the current macroeconomic models. However, there are, of course, other important linkages between the stress tests and the macroeconomy, and some of them deserve further attention. For example, for interest rate risk, it would be useful to work on the linkages between public debt and its implications for financial stability. One specific question related to this area is to what extent do changes in the duration of government debt influence interest rate risk in the banking sector. The current stress testing file allows for a simple calculation to this effect, but it may be useful to take it a step further.
4.2 Improvements in credit risk modeling
Credit risk is where the current stress testing exercise would benefit most from improvements. The current exercise is mechanistic. In particular, it assumes that the increase will for each bank be proportional to the existing stock of NPLs or PLs, or a combination of the two. The improvements discussed in the previous section would help to better justify the aggregated size of the shock; however, they would not help to address the bank-by-bank distribution.
Ideally, modeling of credit risk should be based on an assessment of borrowers’ capacity to repay. In principle, this should provide a more direct assessment of the risks than using NPLs, which are lagged and may depend on regulatory conventions. On a cross-country level, some justification for this view can be found in IMF (2003), which finds, using a panel data estimate for 47 developed and emerging market countries over a period of 10 years, that the corporate sector’s financial leverage can be used as a leading indicator of NPLs. In particular, the paper found that, on average, a 10 percentage point increase in corporate leverage is associated with a 1.8 percentage point rise in NPLs relative to total loans after one year.13
An important step in this direction would be to estimate a bankruptcy prediction model on a company level to link companies’ bankruptcies to a number of risk factors. Much research has been undertaken on the development of such models world-wide. A particularly popular class of such models is the multiple-determinant analysis (MDA) models, which link a firm’s bankruptcy to a number of financial ratios. A classical example of such model is the Altman model (Altman, 1968), which introduces a formula (the so-called Z-score) designed to represent a firm’s creditworthiness as a weighted average of five financial indicators, namely (i) earnings before interest and taxation, as a ratio to total assets; (ii) retained earnings to total assets; (iii) total turnover to total assets; (iv) working capital to total assets; and (v) market value of equity to liabilities. Other MDA models differ in a number of respects, such as the type of financial ratios used, but the framework is very similar (see, for example, Marais, 1980, and Taffler, 1984). The models are typically estimated using a probit or logit regression on company-by-company data. The models are extensively used in practice by, for example, credit rating agencies, banking institutions and other financial analysts.14
Several authors have attempted to apply the Altman analysis to the Czech conditions. One form of such analysis can be found in Buchtíková (1999), who carried out a discriminant analysis of 11 13 The explanatory power of the equation was low, however, with R-square of only 0.14, reflecting most likely the importance of country-specific factors. 14 For a comprehensive review of bankruptcy prediction models, see Altman and Narayanan (1997).
Stress Testing the Czech Banking System 19
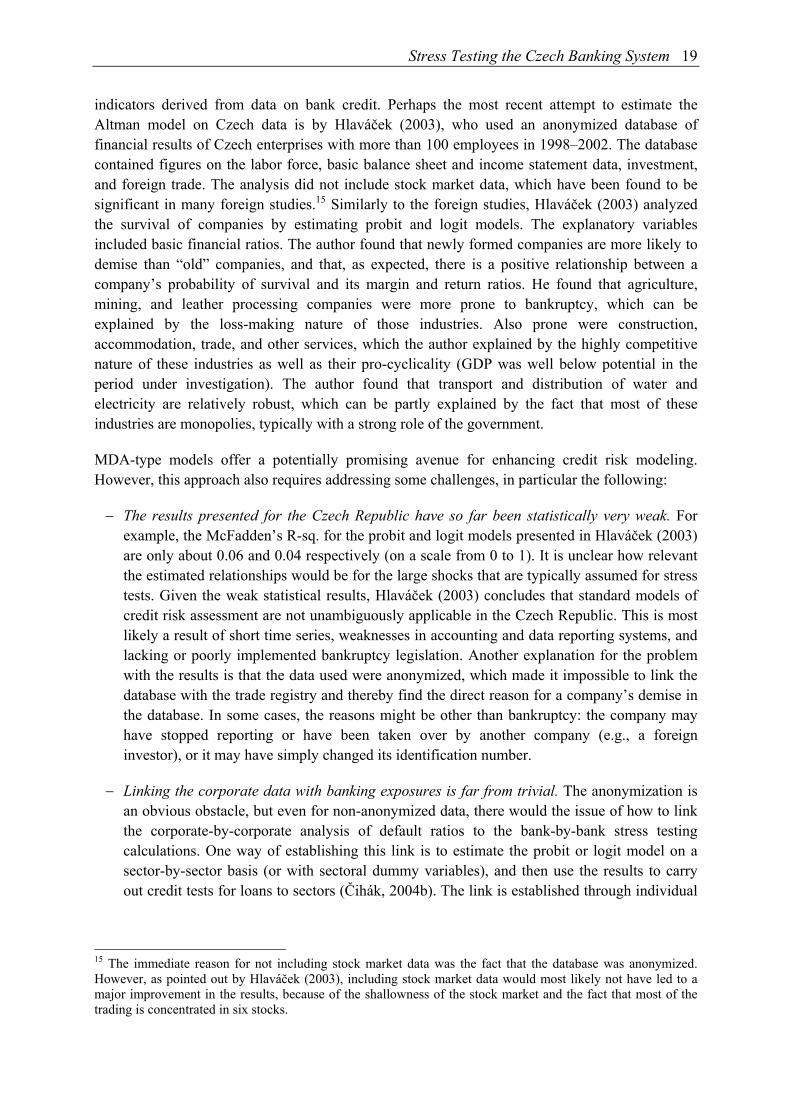
indicators derived from data on bank credit. Perhaps the most recent attempt to estimate the Altman model on Czech data is by Hlaváček (2003), who used an anonymized database of financial results of Czech enterprises with more than 100 employees in 1998–2002. The database contained figures on the labor force, basic balance sheet and income statement data, investment, and foreign trade. The analysis did not include stock market data, which have been found to be significant in many foreign studies.15 Similarly to the foreign studies, Hlaváček (2003) analyzed the survival of companies by estimating probit and logit models. The explanatory variables included basic financial ratios. The author found that newly formed companies are more likely to demise than “old” companies, and that, as expected, there is a positive relationship between a company’s probability of survival and its margin and return ratios. He found that agriculture, mining, and leather processing companies were more prone to bankruptcy, which can be explained by the loss-making nature of those industries. Also prone were construction, accommodation, trade, and other services, which the author explained by the highly competitive nature of these industries as well as their pro-cyclicality (GDP was well below potential in the period under investigation). The author found that transport and distribution of water and electricity are relatively robust, which can be partly explained by the fact that most of these industries are monopolies, typically with a strong role of the government.
MDA-type models offer a potentially promising avenue for enhancing credit risk modeling. However, this approach also requires addressing some challenges, in particular the following:
− The results presented for the Czech Republic have so far been statistically very weak. For example, the McFadden’s R-sq. for the probit and logit models presented in Hlaváček (2003) are only about 0.06 and 0.04 respectively (on a scale from 0 to 1). It is unclear how relevant the estimated relationships would be for the large shocks that are typically assumed for stress tests. Given the weak statistical results, Hlaváček (2003) concludes that standard models of credit risk assessment are not unambiguously applicable in the Czech Republic. This is most likely a result of short time series, weaknesses in accounting and data reporting systems, and lacking or poorly implemented bankruptcy legislation. Another explanation for the problem with the results is that the data used were anonymized, which made it impossible to link the database with the trade registry and thereby find the direct reason for a company’s demise in the database. In some cases, the reasons might be other than bankruptcy: the company may have stopped reporting or have been taken over by another company (e.g., a foreign investor), or it may have simply changed its identification number.
− Linking the corporate data with banking exposures is far from trivial. The anonymization is an obvious obstacle, but even for non-anonymized data, there would the issue of how to link the corporate-by-corporate analysis of default ratios to the bank-by-bank stress testing calculations. One way of establishing this link is to estimate the probit or logit model on a sector-by-sector basis (or with sectoral dummy variables), and then use the results to carry out credit tests for loans to sectors (Čihák, 2004b). The link is established through individual
15 The immediate reason for not including stock market data was the fact that the database was anonymized. However, as pointed out by Hlaváček (2003), including stock market data would most likely not have led to a major improvement in the results, because of the shallowness of the stock market and the fact that most of the trading is concentrated in six stocks.
20 Martin Čihák, Jaroslav Heřmánek
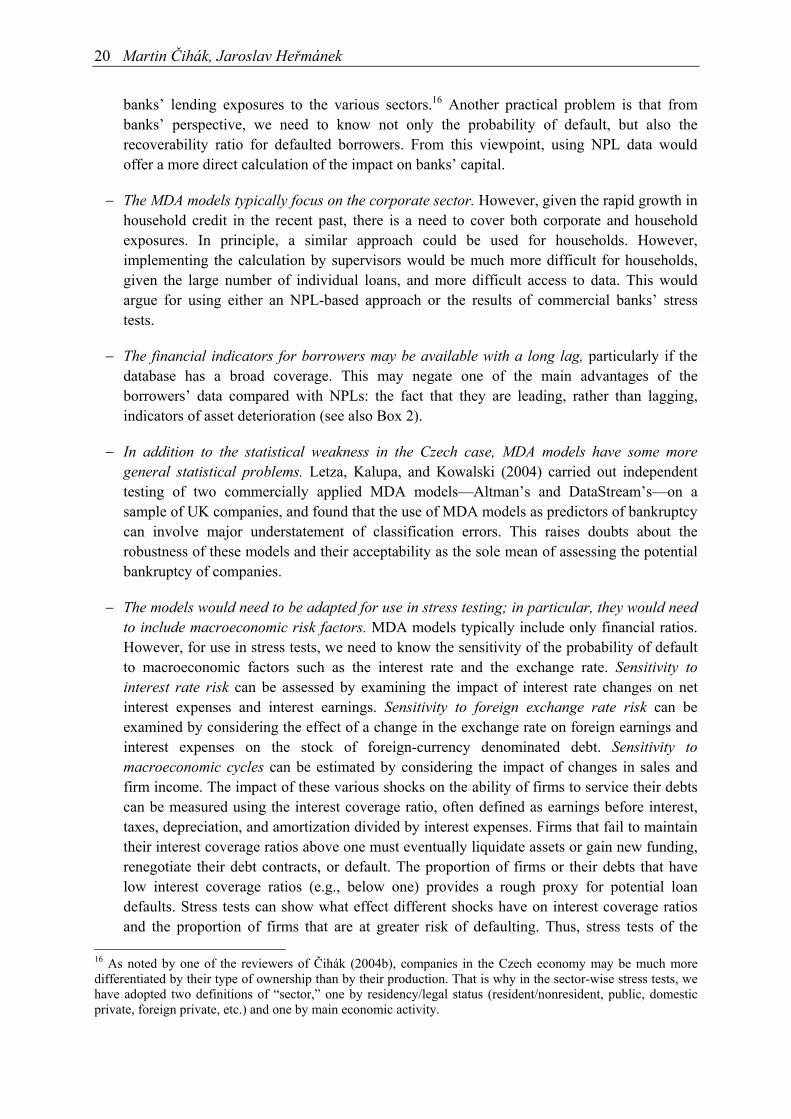
banks’ lending exposures to the various sectors.16 Another practical problem is that from banks’ perspective, we need to know not only the probability of default, but also the recoverability ratio for defaulted borrowers. From this viewpoint, using NPL data would offer a more direct calculation of the impact on banks’ capital.
− The MDA models typically focus on the corporate sector. However, given the rapid growth in household credit in the recent past, there is a need to cover both corporate and household exposures. In principle, a similar approach could be used for households. However, implementing the calculation by supervisors would be much more difficult for households, given the large number of individual loans, and more difficult access to data. This would argue for using either an NPL-based approach or the results of commercial banks’ stress tests.
− The financial indicators for borrowers may be available with a long lag, particularly if the database has a broad coverage. This may negate one of the main advantages of the borrowers’ data compared with NPLs: the fact that they are leading, rather than lagging, indicators of asset deterioration (see also Box 2).
− In addition to the statistical weakness in the Czech case, MDA models have some more general statistical problems. Letza, Kalupa, and Kowalski (2004) carried out independent testing of two commercially applied MDA models—Altman’s and DataStream’s—on a sample of UK companies, and found that the use of MDA models as predictors of bankruptcy can involve major understatement of classification errors. This raises doubts about the robustness of these models and their acceptability as the sole mean of assessing the potential bankruptcy of companies.
− The models would need to be adapted for use in stress testing; in particular, they would need to include macroeconomic risk factors. MDA models typically include only financial ratios. However, for use in stress tests, we need to know the sensitivity of the probability of default to macroeconomic factors such as the interest rate and the exchange rate. Sensitivity to interest rate risk can be assessed by examining the impact of interest rate changes on net interest expenses and interest earnings. Sensitivity to foreign exchange rate risk can be examined by considering the effect of a change in the exchange rate on foreign earnings and interest expenses on the stock of foreign-currency denominated debt. Sensitivity to macroeconomic cycles can be estimated by considering the impact of changes in sales and firm income. The impact of these various shocks on the ability of firms to service their debts can be measured using the interest coverage ratio, often defined as earnings before interest, taxes, depreciation, and amortization divided by interest expenses. Firms that fail to maintain their interest coverage ratios above one must eventually liquidate assets or gain new funding, renegotiate their debt contracts, or default. The proportion of firms or their debts that have low interest coverage ratios (e.g., below one) provides a rough proxy for potential loan defaults. Stress tests can show what effect different shocks have on interest coverage ratios and the proportion of firms that are at greater risk of defaulting. Thus, stress tests of the
16 As noted by one of the reviewers of Čihák (2004b), companies in the Czech economy may be much more differentiated by their type of ownership than by their production. That is why in the sector-wise stress tests, we have adopted two definitions of “sector,” one by residency/legal status (resident/nonresident, public, domestic private, foreign private, etc.) and one by main economic activity.

Stress Testing the Czech Banking System 21
corporate sector can provide a useful indicator of the sensitivity of the underlying credit quality of bank loans to a variety of shocks.
The stress tests presented by other central banks in their FSRs (see Section 3) offer only limited guidance for improvements in this area. In most cases, central banks use similar simplified approaches as used in the Czech FSR. Here are some central bank experiences:
− Austria. Arpa et al. (2000) estimate the effect of macroeconomic factors (real GDP, real estate prices, inflation, and real interest rates) on risk provisions and on earnings for Austrian banks. Kalirai and Scheicher (2002) model loan loss provisions in Austria as a function of various macroeconomic indicators, and then use the model to conduct a series of sensitivity tests.
− Norway. Norges Bank is one of the most advanced central banks in this respect. Frøyland and Larsen (2002) model losses for Norwegian banks on household loans as a function of household debt, wealth, and unemployment. They also model losses on loans to enterprises as a function of risk-weighted debt and collateral. Andreeva (2004) models the loan loss ratio (to assets) of loans to Norwegian enterprises as a function of bankruptcy probabilities and a variety of economic factors, including the unemployment rate and the real interest rate. Norges Bank’s experience with corporate sector credit risk modeling is reviewed in Box 2.
− UK. Benito et al. (2001) extend the Bank of England’s macro model by incorporating household and corporate balance sheets. They then perform a stress test by incorporating a fall in housing prices and a rise in interest rates, examining their impact on a variety of indicators, including mortgage arrears.
Box 2: Credit Risk Models Used at Norges Bank Norges Bank uses two models to analyze financial exposures in the enterprise sector. First, its SEBRA model predicts bankruptcy probabilities based on annual accounts of all limited companies (Eklund, Larsen, and Bernhardsen, 2001). The main disadvantage of the SEBRA model is that new information comes in only once a year, with a lag of nine months after the closing of the annual accounts. For example, the SEBRA model in mid-2004 was based on 2002 annual accounts. Second, Norges Bank calculates Moody’s KMV model for listed companies based primarily on market information, and uses these results to predict default probabilities for non-listed enterprises. The model is based on some key variables from the annual accounts, which are combined with developments and the volatility of equity prices for listed companies in the same industry and country as the enterprise in question. The KMV database in question is limited to large unlisted companies, but the KMV model has the advantage over the SEBRA model that it is based on current market data. The SEBRA model’s use of a larger number of accounting variables compensates for the KMV model’s advantage of using updated market information. However, the use of more recent market information improves the KMV model’s prediction capabilities. In a recent FSR, Norges Bank mentioned that it plans to develop the SEBRA model by including in it some market indicators.
Based on the above discussion, a multi-pronged strategy would seem appropriate. First, the work on the NPL-based econometric model should continue, following up on Babouček and Jančar (2005). It would need to incorporate the comments mentioned above, in particular so as to be better linked to the existing stress testing exercise. Second, work on the MDA model should also continue, focusing on the macroeconomic factors and linking them to a consistent scenario. Third,

22 Martin Čihák, Jaroslav Heřmánek
the CNB should seriously consider engaging commercial banks in the stress testing exercise (see the next sub-section).
4.3 Involving commercial banks
Involving commercial banks in the stress testing exercise, if done properly, would be a useful way of carrying out the underlying calculations in much more detail. It would lead to major improvements in the sophistication of the underlying calculations, more so than would be feasible in-house. That is why some FSAPs and some central banks have requested commercial banks to do the number crunching.
Banks are increasingly carrying out stress tests themselves. Internationally, the number of banks conducting regular stress tests has been growing as banks have increasingly recognized such tests as a useful tool in assisting risk management, and also as they prepare for the introduction of Basel II, which includes a requirement for banks to carry out regular stress tests.
In the Czech case, the survey of stress testing practices carried out in 2003 based on information as of end-2002 (Appendix I) suggested that banks generally have a good modeling framework for market risk and have regular exercises, even though most of them use VaR-type models rather than stress tests. For credit risk, banks apparently do not use scenarios and shocks to risk factors. The stress tests do not allow for correlation between market risk and credit risk. Also, banks have so far—with a few exceptions—not been using more sophisticated methods such as Monte Carlo simulations. The sophistication and use of stress tests is likely to have evolved since then, as banks have improved their risk management systems and have been preparing for the implementation of Basel II. To this end, the survey of stress testing practices (Appendix I) should be repeated next year to update on the status of stress testing in commercial banks.
This approach requires that the participating banks use the same scenarios (supplied by the central bank) and are capable of carrying out stress tests with the same methodology and report the results to the central bank in a way that allows for aggregation. To get commercial banks on board, the methodology of the stress tests should be designed in a way that does not place major additional requirements on banks. The central bank would need to explain to the banks the advantages of the stress testing exercise, including the fact that they can compare their own result with the overall results for the system.
Involving commercial banks does not mean that the central bank would not have to do any work. The central bank should still run, at least for some time, a simpler stress testing exercise such as the one currently in place, so as to be able to cross-check the results from commercial banks for overall consistency. At the same time, involving commercial banks in most of the data crunching would allow the central bank to focus more on methodological issues such as developing macroeconomic modeling, so as to make the stress testing scenarios more credible. Some stress testing modules may have to be done by the central bank. For example, only the central bank would have data for carrying out the interbank contagion stress test.

Stress Testing the Czech Banking System 23
One concern with involving commercial banks is ensuring the integrity of the exercise. If the calculations are outsourced to commercial banks, how can the central bank ensure that the exercise is implemented properly and that correct results are reported back to the central bank? It might be argued that in the absence of other incentives, some banks may be tempted to “fake” the exercise by not doing the required calculations or by reporting biased results to the central bank. This potential concern can be addressed by a combination of steps, in particular by (i) issuing guidelines for commercial banks’ stress testing, as some central banks and supervisory agencies have done; (ii) conducting, as part of both on- and off-site supervision, regular reviews of stress test methodologies and their implementation in individual banks; (iii) continuing to run the simpler in-house stress testing exercises in the central bank, as mentioned earlier, to cross-check the results from individual banks; (iv) following up on major discrepancies between the central bank’s and commercial banks’ stress tests; and (iv) sharing with commercial banks the overall results of the exercise, thereby giving them something back for their participation in the exercise.
Implementation of stress tests at the individual bank level would have to be coordinated with the implementation of Basel II and International Financial Reporting Standards (IFRS), which is likely to have impacts on the structure of the calculations and the availability of the underlying data. Stress testing is also an issue being discussed in the Committee of European Banking Supervisors (CEBS). It is therefore also important to follow the results of that work.
4.4 Other shocks
The stress testing model has so far not included some shocks that are not as important as credit, interest rate, and exchange rate shocks, but might still be substantial in some banks. Given the rapid growth of mortgage lending and other real-estate related activities, it would be particularly useful to include a test for movements in real estate prices. Mechanically, this is relatively straightforward to implement, and the basic data for this test have been collected. Again, the more difficult part is linking this exercise to a macroeconomic model. Norges Bank may serve as an example. Their latest FSR includes an estimate of an econometric model explaining housing prices as being influenced by the housing stock, the unemployment rate, banks’ after-tax lending rate, total wage income in the economy, and an indicator of household expectations.
The impact of a stock market shock on banks is negligible given that their exposures are relatively small. For this reason, the shock was not even included in the scenarios reported in the FSR. Nonetheless, the issue should be re-evaluated at a later stage and the shock included if the impact becomes substantive.
The basic stress tests already include interbank contagion risk, based on a sheet that contains a matrix of net uncollateralized exposures in the interbank market. However, some further work on this exercise is needed (e.g., the matrix does not cover all exposures among banks, only the large exposures). It would be useful to repeat the exercise and see whether there are substantial changes over time.
4.5 Strengthening other financial stability work
Stress tests are only a part of the analytical toolkit for financial sector analysis. The toolkit also includes the analysis of macro-level indicators, financial sector indicators (particularly those

24 Martin Čihák, Jaroslav Heřmánek
describing its structure and soundness), and market-based indicators. It also includes various qualitative tools, such as assessment of the technical infrastructure and the institutional, legal, and regulatory framework for the financial sector.
The first FSR (CNB, 2004) underscores the CNB’s recent achievements in the area of financial sector analysis. Nonetheless, improvements are possible and could usefully support the further development of stress testing proposed here.
One example of possible improvements is the compilation and analysis of financial soundness indicators and other financial sector variables. The FSR illustrated that a wide range of financial sector indicators is available. Nonetheless, improvements are possible. While the core financial soundness indicators (FSIs) (IMF, 2004) are generally easily available, some of the encouraged FSIs seem more difficult to obtain. Also, work may be needed to ensure that the indicators are internationally comparable; the analysis could then include more cross-country elements. In this context, it is helpful that the Czech Republic is one of the countries participating in the Coordinated Compilation Exercise, aimed at compiling internationally comparable sets of financial soundness indicators. It might be useful to have a particular look at FSIs that are close to stress tests, such as nonperforming loans net of provisions as a ratio of capital. Compared to the more frequently used ratio of gross NPLs to total loans, this indicator provides a more direct assessment of the potential impact of loan quality on solvency. Moreover, unlike stress tests, this indicator is amenable to cross-country comparisons.
Another example could be work on early warning systems (EWS). EWS are complementary to stress tests: while stress tests assess what would happen to the financial sector under certain extreme scenarios, early warning systems attempt to detect signals of crisis under the existing scenario. EWS can to some extent be used as an input in stress tests, as explained in Čihák (2004b). Some recent work on EWS for Czech banks is available (Hanousek and Podpiera, 2000; Derviz and Podpiera, 2004); however, it has yet to be linked to stress testing.
Finally, the CNB could make more use of surveys. One example would be to organize a regular survey of senior loan officers on bank lending practices. Such surveys have been organized by the U.S. Fed on a quarterly basis since 1967, and have recently started in the ECB and the Hungarian National Bank, also on a quarterly basis. A regular lending survey can shed light on what role non-price factors play in the credit supply. With its help, important additional information can be gained on the stability of the financial sector and the role of the banks in the economy. Another survey is the survey of stress testing practices in commercial banks, mentioned earlier, which was conducted for data as of end-2002, and would benefit from an update during the next 12 months. Of course, any surveys need to be carefully reviewed with a view to limiting any unnecessary regulatory burden.
Even with the various improvements proposed above and in Table 7, stress tests will always have limitations. Even the best stress tests are only approximations of reality, and rough approximations at that. Some of the limitations are inherent to macroprudential analysis, and it might be useful to recognize these limitations explicitly. In particular, stress tests and the related macroprudential tools are designed to assess the stability of the system as a whole, and will not be able cover risks that are specific to individual institutions, such as asset quality, operational or legal risks, or fraud. A disclaimer to this effect might be included in the FSR.

Stress Testing the Czech Banking System 25
4.6 Widening the coverage to include non-bank financial institutions
The stress tests conducted under this project have focused on banks, reflecting the dominance of banks in the Czech financial system, as well as practical reasons (detailed data for banks are readily available). As noted in Section 3, the stress tests in other central banks’ FSRs also mostly focus on banks. Nonetheless, research and other work is ongoing on stress tests for other market participants, in particular insurers. In the medium to long term, it would be useful to broaden the coverage of the stress tests beyond banking to cover all systemically important parts of the financial system.
In the next step, the simple stress tests could be modified and extended to insurance companies. Stress testing of insurance company balance sheets and income statements is not as well-developed as stress testing of banks. This is due in part to the history of stress testing, and also to regulatory impetus. Furthermore, insurance companies are generally considered to represent a lower level of systemic risk than banks, mainly due to the different character of their liabilities, which often have a longer duration than those of banks. However, distress in the insurance sector can have important systemic implications, including through ownership relations with the banking sector and its impact on confidence in the financial sector as a whole. The IAIS (2003) issued a guidance paper on stress testing by insurers. This document provides a broad set of principles for stress testing that companies should follow, recognizing the importance of stress testing as a risk management tool.
Because insurance companies have a different balance sheet structure to banks, stress testing of their balance sheets presents unique challenges. Insurance companies face underwriting risk, catastrophe risk, and risks on technical claims provisions. On the asset side, more or less similarly to banks, they also face market risk, credit risk, liquidity risk, operational risk, group risk, and systemic risk, albeit in differing degrees to those faced by banks and other financial institutions. The complexity of the contracts underlying insurance company balance sheets can create difficulties in revaluing liabilities, and a full-fledged stress test would require detailed data on a contract-by-contract basis to enable an accurate assessment of the impact of changes in risk factors. Stochastic techniques are sometimes used by insurers to assess their resilience to shocks. Such techniques are complex, and account for the probability of a range of possible outcomes. For the system-focused stress tests carried out by supervisors, simple deterministic tests (e.g., shifts in loss ratios or gauging the effect of specified catastrophic events) can reveal useful information about resilience to shocks.
The results of insurance company stress tests are often expressed in terms of their impact on the solvency margin. The required solvency margin is the minimum level of capital and reserves (or surplus of assets over liabilities) required by the supervisor, which is intended to ensure with a high probability the insurer’s ability to meet its obligations on an ongoing basis. If the financial position of an insurance company deteriorates below the required solvency margin, a series of corrective actions need to be initiated by the supervisor. The numerical estimate of the impact of a stress test can be expressed as a percent of the required solvency margin, to indicate the potential severity of the shock.17
17 It must be noted, however, that the current solvency system in most European countries, based on EU Solvency I, is outdated and often misleading. It does not take into account the asset side and mismatch risks for life insurers, and may substantially underestimate capital needs as compared to risk-based models. Solvency II is being prepared, but it will take some time before it is implemented.

26 Martin Čihák, Jaroslav Heřmánek
Aggregating the results of stress tests of insurance company balance sheets with the results for banks (e.g., within a conglomerate, or aggregating the results for the two sectors) would be desirable. However, it often proves complicated because of differences in the accounting and regulatory treatment of assets and liabilities. Differences in the definition of capital and the market valuation of investments may be particularly acute. A separate presentation of the results is therefore more common (e.g., in the FSRs for Germany and the Netherlands) than an integrated presentation with banking stress tests.

Table 7: Summary of Recommendations, Requirements, Suggested Timeframes, and Steps Taken RECOMMENDATIONS REQUIREMENTS TIMEFRAME STEPS TAKEN General Macroeconomic risks. Regularly reassess the main macroeconomic risks facing the banking sector, including cross-sector and cross-border risks.
- Regularly, in the context of the financial stability report.
Done in the first FSR, issued in 2004. Needs to be reviewed continuously.
Links to the macro. Improve the regression estimates relating credit quality to macroeconomic shocks. Attempt to select consistent scenarios with the help of the existing macroeconomic models.
- 6–12 months This work has been brought forward by Babouček and Jančar (2005), but more work is clearly needed.
Treatment of profits. Initially, assume zero baseline profits and express the impacts in terms of capital. Take past profits into account when interpreting the results. Later, use a conservative assumption based on past profits (e.g. “baseline” profits at 50 percent of last three years’ average); combine with an autonomous shock to non-interest income or net interest income.
No data requirements. For second stage, develop a formula best capturing “baseline profits.”
Start in the next 6 months. As regards “baseline” profits, consider in 12–24 months.
This was addressed in the stress test scenarios presented in the first FSR and in this note. Profits recognized as the first line of defense. Also, the summary of results included a presentation of the impacts in terms of profits.
Scenario vs. sensitivity analysis. Combine sensitivity analysis with scenario analysis.
- Start in the next 6 months.
This is already done in the FSR and here.
Types of scenarios. Use hypothetical scenarios (perhaps using the CNB’s macromodel). For illustrative purposes, also use historical scenarios (e.g. 1997–1999) as relevant.
For the hypothetical scenarios, need to conduct stochastic simulations based on the CNB’s macromodel.
Start in the next 6 months.
Scenarios already used in the FSR and here. CNB macromodel not used.
Early Warning System. Consider developing an early warning model to complement the stress testing exercise. Namely, try estimating a logit/probit model that includes capital adequacy as an explanatory variable for bank failure.
Requires an estimate based on data on past bank failures and descriptive variables for banks.
Short/medium term.
Some work done in this area (Hanousek and Podpiera, 2000, Derviz and Podpiera, 2004). Needs to be integrated with stress tests.
Internal ST models. As the first step, devote more attention to banks’ internal ST in on-site visits. Later on, consider issuing guidelines on ST in banks and including banks’ internal models in the CNB’s ST exercise.
- Medium/long term.
The first survey was done as part of this project (Appendix I). The survey should be updated in the next 12 months. More systematic feedback from on-site visits would be useful. Start working on the guidance note. Including actual ST results by banks should be an important medium/long-term goal.

RECOMMENDATIONS REQUIREMENTS TIMEFRAME STEPS TAKEN Consolidation and cross-sector risks. At a later stage, consider including in the stress tests risks arising from other parts of the financial system.
At present, collect/obtain better information on risks arising from insurance and pension sectors. Contact Securities Commission to coordinate on this.
Long term. Remains to be done.
Organization Frequency. Conduct a standard set of stress tests on a quarterly basis. More elaborate analysis (e.g. interbank contagion) could be conducted less frequently.
- Start the exercise in the next 6 months.
Regular stress tests started within this project.
Software/Hardware. For the time being, use MS Excel files, supported by econometric estimates from E-Views. Later on, automate the process using programs in either Microsoft Access or Excel.
Requires easy access to and knowledge of E-Views. No hardware implications envisaged.
Start in the next 6 months.
Done. MS Excel used as the primary software so far.
Who to run the stress tests? Routine operation by bank supervisors. Research-oriented staff to provide input by estimating the sensitivity coefficients and other inputs in the stress testing models.
Requires closer cooperation between supervisors and research staff.
Start in the next 6 months
Stress tests run by Financial Stability Unit staff and IMF/MFD expert. User guide prepared to make it easier for other users to replicate the tests.
Dissemination and presentation. Detailed results in internal reports for CNB management. Summary of results in FSR.
Using foreign experience, develop standard reporting formats for the internal reports and the FSR.
Start in the next 6 months.
Done.
Credit Risk Size of the shock. For the time being, a 30 percent increase in NPLs. Later on, a 3 standard deviation increase in NPLs based on past changes. Link to a plausible scenario with shocks to GDP and other main factors of NPLs.
- - A simple shock used for the time being. Linking to econometric model remains to be done.
Data on corporate borrowers. Link the statistical office’s database on individual companies and the Central Credit Registry database.
Obtain access to the statistical office’s database on individual companies and the Central Credit Registry database.
12–24 months Remains to be done.
Household credit. Strengthen monitoring of potential vulnerabilities arising from the rapid development of banks’ exposures to households.
More data needed on household credit, from the credit registry or internally. Also, perform targeted on-site examinations of banks’ risk management practices in this area.
9–12 months Remains to be done.
Indirect FX risk. Collect and analyze migration of loan quality and corporate debt indicators, in particular those relating to indirect foreign exchange risk.
Collect indicators relating to indirect foreign exchange risk (e.g. NPLs by currency denomination).
9–12 months For the time being, indirect FX risk modeled in a very simple way. Remains to be done.

RECOMMENDATIONS REQUIREMENTS TIMEFRAME STEPS TAKEN Concentration risks. Consider including concentration risks in the calculations.
Review if the current large exposure reports allow for aggregation of large exposures across banks.
9–12 months Remains to be done.
Survey lending practices. Consider organizing surveys of lending practices and publishing aggregate results.
Need to design the questionnaires. ECB or US Fed can be used as example.
9–12 months This is a new recommendation, not included in Čihák (2004).
Discrepancies in sectoral data. Work on minimizing the discrepancies between the aggregate data and the sectoral data used for the sectoral credit risk stress tests.
Long term. This is a new recommendation, not included in Čihák (2004).
Market Risks in General Worst case finder. For market risks, consider explicitly identifying a “worst case scenario,” i.e. the combination of risk factors that, for a given level of plausibility, minimizes the value of a portfolio.
A software tool can be programmed (even in Excel) to identify such worst case scenarios.
9–12 months Remains to be done.
Interest Rate Risk 1) Size of the shock. Upward parallel shift in the yield curve by 3 standard deviations. Reassess from time to time using the observed interest rate volatility.
- - Done. Needs to be reassessed.
Method. In the first step, follow the simplified method based on residual maturity data plus weights as proposed by the Basel Committee. At the same time, work on improving the interest rate reporting formats to better capture the interest rate risk resulting from banks’ interest rate positions.
Improve the interest rate reporting formats to better capture the potential interest rate risk resulting from banks’ interest rate positions.
9–12 months A combination of gap and duration method used. Further work needed.
Maturity by currency. Consideration could be given to differentiating the interest rate stress test by currency. That would require residual maturity data for each currency and specifying separate shocks to each of the currencies, based on past correlation patterns.
Would require residual maturity data for each currency.
9–12 months Remains to be done.
Exchange Rate Risk 1) Size of the shock. Depreciation by 3 standard deviations (1 percent confidence level). Consider including other sizes of shocks for sensitivity calculations.
- - Done. Needs to be reassessed.
Foreign exchange (FX) options. Consider using the delta method for calculating FX options.
Would require estimating the deltas based on past exchange rate developments.
6–9 months Remains to be done.
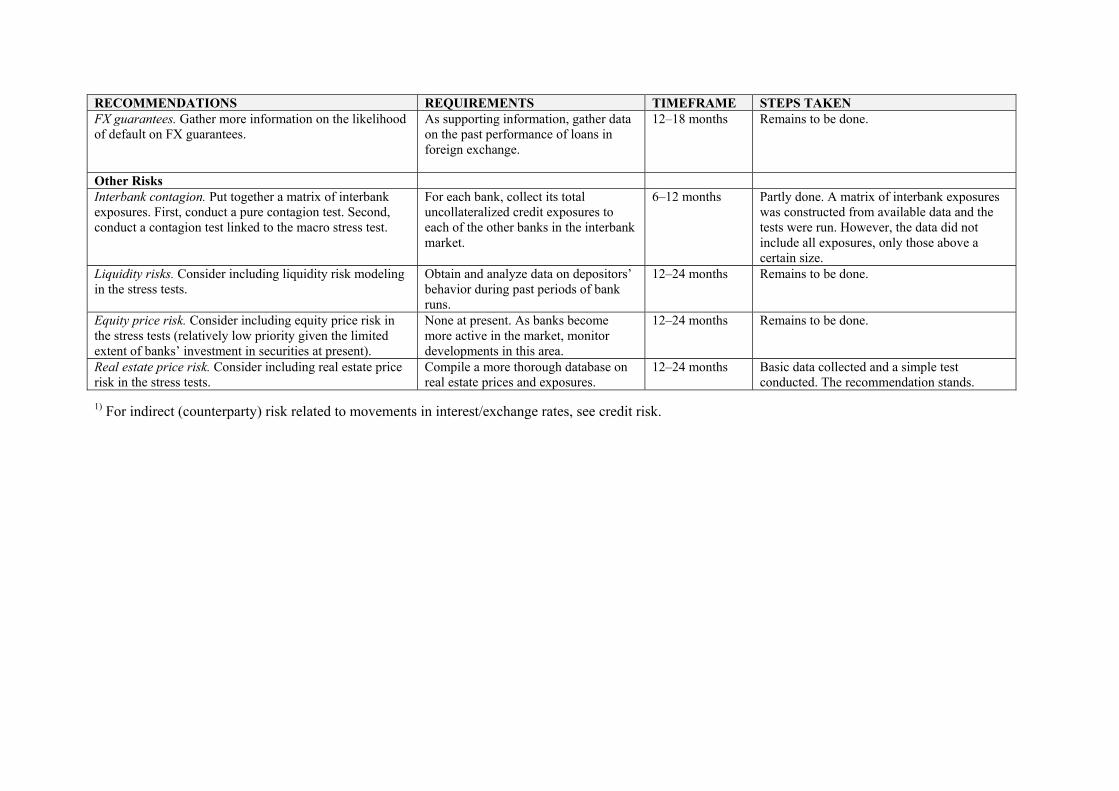
RECOMMENDATIONS REQUIREMENTS TIMEFRAME STEPS TAKEN FX guarantees. Gather more information on the likelihood of default on FX guarantees.
As supporting information, gather data on the past performance of loans in foreign exchange.
12–18 months Remains to be done.
Other Risks Interbank contagion. Put together a matrix of interbank exposures. First, conduct a pure contagion test. Second, conduct a contagion test linked to the macro stress test.
For each bank, collect its total uncollateralized credit exposures to each of the other banks in the interbank market.
6–12 months Partly done. A matrix of interbank exposures was constructed from available data and the tests were run. However, the data did not include all exposures, only those above a certain size.
Liquidity risks. Consider including liquidity risk modeling in the stress tests.
Obtain and analyze data on depositors’ behavior during past periods of bank runs.
12–24 months Remains to be done.
Equity price risk. Consider including equity price risk in the stress tests (relatively low priority given the limited extent of banks’ investment in securities at present).
None at present. As banks become more active in the market, monitor developments in this area.
12–24 months Remains to be done.
Real estate price risk. Consider including real estate price risk in the stress tests.
Compile a more thorough database on real estate prices and exposures.
12–24 months Basic data collected and a simple test conducted. The recommendation stands.
1) For indirect (counterparty) risk related to movements in interest/exchange rates, see credit risk.

Stress Testing the Czech Banking System 31
References
ALTMAN, E. (1968): “Financial Ratios, Discriminant Analysis and the Prediction of Corporate Bankruptcy,” Journal of Finance, Vol. 23, No. 4.
ALTMAN, E., AND P. NARAYANAN (1997): “An International Survey of Business Failure Classification Models,” Financial Markets, Institutions, and Instruments, Vol. 6, No. 2.
ANDREEVA, O. (2004): “Aggregate Bankruptcy Probabilities and Their Role in Explaining Banks’ Loan Losses,” Bank of Norway Working Paper ANO 2004/2, February (Oslo: Bank of Norway). Available at http://www.norges-bank.no/publikasjoner/arbeidsnotater/pdf/arb-2004-02.pdf.
ARPA, M., I. GIULINI, A. ITTNER, AND F. PAUER (2000): “The Influence of Macroeconomic Developments on Austrian Banks: Implications for Banking Supervision,” BIS Papers, No. 1 (Basel: Bank for International Settlements). Available at http://www.bis.org/publ/ bispap01c.pdf.
AUSTRIAN NATIONAL BANK (1999): “Stress Testing,” Guidelines on Market Risk, Vol. 5 (Vienna: Austrian National Bank). See also http://www.oenb.at/en/img/band5ev40 _tcm16-0475.pdf.
BABOUČEK, I. ET AL. (2002): “Bankovní regulace a dohled [Banking Regulation and Supervision],” Prague: Bankovní institut vysoká škola.
BABOUČEK, I., AND M. JANČAR (2005): “A VAR Analysis of the Effects of Macroeconomic Shocks to the Quality of the Aggregate Loan Portfolio of the Czech Banking Sector,” CNB WP 1/2005.
BENITO, A., J. WHITLEY, AND G. YOUNG (2001): “Analysing Corporate and Household Sector Balance Sheets,” Financial Stability Review, Issue 11, December 2001 (London: Bank of England). Available at
http://www.bankofengland.co.uk/publications/fsr/2001/fsr11art5.pdf.
BLASCHKE, W., M. JONES, G. MAJNONI, AND S. MARTINEZ PERIA (2001): “Stress Testing of Financial Systems: An Overview of Issues, Methodologies, and FSAP Experiences,” IMF Working Paper 01/88 (Washington, DC: International Monetary Fund).
BUCHTÍKOVÁ, A. (1999): “Empirická analýza financování podniků a úvěrových aktivit bank v ČR v letech 1995–1997 [An Empirical Analysis of Corporate Financing and Bank Lending in the Czech Republic, 1995–1997],” Czech National Bank Working Paper No. 14. Available at http://www.cnb.cz/.
CZECH NATIONAL BANK (CNB) (2004): “Financial Stability Report 2004,” Available at http://www.cnb.cz/pdf/FS_2004.pdf.
ČIHÁK, M. (2004a): “Stress Testing: A Review of Key Concepts,” CNB Internal Research and Policy Note, No. 2/2004. Available at www.cnb.cz/en/pdf/IRPN_2_2004.pdf.
ČIHÁK, M. (2004b): “Designing Stress Tests for the Czech Banking System,” CNB Internal Research and Policy Note, No. 3/2004. Available at www.cnb.cz/en/pdf/IRPN_3_2004.pdf.
32 Martin Čihák, Jaroslav Heřmánek
ČIHÁK, M. (2005): “Stress Testing of Banking Systems,” accepted for publication in Finance a úvěr/Czech Journal of Economics and Finance.
ČIHÁK, M., AND J. HEŘMÁNEK (2005): “Zátěžové testy českého bankovního sektoru [Stress Tests of the Czech Banking Sector],” submitted to Statistika.
DERIVATIVES POLICY GROUP (1995): “A Framework for Voluntary Oversight of the OTC Derivatives Activities of Securities Firm Affiliates to Promote Confidence and Stability in Financial Markets,” March. See also
http://riskinstitute.ch/137790.htm.
DERVIZ, A., AND N. KADLČÁKOVÁ (2001): “Methodological Problems of Quantitative Credit Risk Modeling in the Czech Economy,” CNB Working Paper No. 39, Prague 2001.
DERVIZ, A., AND J. PODPIERA (2004): “Predicting Bank CAMELS and S&P Ratings: The Case of the Czech Republic,” Czech National Bank Working Paper No. 1/2004.
EKLUND, T., K. LARSEN, AND E. BERNHARDSEN (2001): “Model for Analysing Credit Risk in the Enterprise Sector,” Norges Bank Economic Bulletin 3/2001.
FRØYLAND, E., AND K. LARSEN (2002): “How Vulnerable are Financial Institutions to Macroeconomic Changes? An Analysis Based on Stress Testing,” Bank of Norway Economic Bulletin, Vol. LXXIII, No. 3, October (Oslo: Bank of Norway). Available at http://www.norges-bank.no/english/publications/economic_bulletin/2002-03/froyland.pdf.
GERLACH, S., W. PENG, AND CH. SHU (2004): “Macroeconomic Conditions and Banking Performance in Hong Kong: A Panel Data Study,” Hong Kong Monetary Authority Research Memorandum, April 2004. Available at http://www.info.gov.hk/hkma/eng/research/RM_macro_and_banking.pdf.
GOLDSTEIN, M., G.L. KAMINSKY, AND C.M. REINHART (2000): “Assessing Financial Vulnerability: An Early Warning System for Emerging Markets,” (Washington, DC: Institute for International Economics).
HANOUSEK, J., AND R. PODPIERA (2000): “Detekce bankovních selhání v tranzitivních ekonomikách: případ České republiky [Detection of Bank Failures in Transition Economies: The Case of the Czech Republic],” Finance a úvěr, 51, 5: 252–256.
HEŘMÁNEK, J., AND E. KOMÁRKOVÁ (2004): “Survey of Stress Testing Practices in Czech Commercial Banks,” CNB internal note. (Summarized here in Appendix I.)
HLAVÁČEK, M. (2003): “Nestandardní modely pro rozhodování a vyjednávání ekonomických subjektů týkající se ekonomických informací [Non-standard Models for Decision-Making and Negotiation of Economic Subjects about Economic Information],” Faculty of Social Sciences, Charles University, Prague. Dissertation Thesis.
HONG KONG MONETARY AUTHORITY (2002): “Supervisory Policy Manual: Stress Testing (Guidance Note for Authorized Institutions).” See also www.info.gov.hk/hkma.
INTERNATIONAL ASSOCIATION OF INSURANCE SUPERVISORS (IAIS) (2003): “Stress Testing by Insurers,” Guidance Paper No. 8, October 2003 (Basel: International Association of Insurance Supervisors). Available at http://www.iaisweb.org/185stresstesting03.pdf.

Stress Testing the Czech Banking System 33
INTERNATIONAL MONETARY FUND (IMF) (2001): “Czech Republic: Financial Sector Stability Assessment,” IMF Country Report No. 01/113, (Washington, DC: International Monetary Fund). See also www.imf.org and www.cnb.cz. , 2003, “Financial Soundness Indicators—Background Paper,” May 14, 2003. See also www.imf.org. , 2004, “Financial Soundness Indicators Compilation Guide.” See also www.imf.org.
JONES, M.T., P. HILBERS, AND G. SLACK (2004): “Stress Testing Financial Systems: What to Do When the Governor Calls,” IMF Working Paper 04/127 (Washington, DC: International Monetary Fund).
KALIRAI, H., AND M. SCHEICHER (2002): “Macroeconomic Stress Testing: Preliminary Evidence for Austria,” Financial Stability Report 3 (Vienna: Austrian National Bank). Available at http://www2.oenb.at/english/download/pdf/fsr_3e.pdf.
LETZA, S.R., Ł. KALUPA, AND T. KOWALSKI (2003): “Predicting Corporate Failure: How Useful Are Multi-Discriminant Analysis Models?” The Poznań University of Economics Review, Volume 3, Number 2.
MARAIS, D.A.J. (1979): A Method of Quantifying Companies’ Relative Financial Strength,” Bank of England Discussion Paper, No. 4.
PENG, W., K. LAI, F. LEUNG, AND CH. SHU (2003): “The Impact of Interest Rate Shocks on the Performance of the Banking Sector,” Hong Kong Monetary Authority Research Memorandum, May 2003. Available at http://www.info.gov.hk/hkma/eng/research /RM07 -2003.pdf.
SUNDARARAJAN, V., C. ENOCH, A. SAN JOSÉ, P. HILBERS, R. KRUGER, M. MORETTI, AND G. SLACK (2002): “Financial Soundness Indicators: Analytical Aspects and Country Practices,” Occasional Paper No. 212 (Washington, DC: International Monetary Fund).
TAFFLER, R.J. (1984): “Empirical Models for the Monitoring of UK Corporations,” Journal of Banking and Finance, pp. 199–227.

34 Martin Čihák, Jaroslav Heřmánek
Apendix I
Survey of Stress Testing Practices in Czech Commercial Banks18
Purpose of the survey
As a part of the research project on Financial Sector Stability and Central Banks, a survey of the use of stress testing by banks in the Czech banking sector was conducted. The primary purpose of the survey was to deepen the CNB’s knowledge of the stress testing methods used by commercial banks. A good understanding of the stress testing techniques employed by commercial banks will be particularly useful if the CNB decides to implement the recommendation of this report to move towards an approach to stress tests whereby the CNB would send uniform scenarios to commercial banks, and each commercial bank would calculate the impacts of the scenarios and report back to the CNB, which would then aggregate the results. Such an arrangement could usefully complement the stress tests done in-house at the CNB.
Stress testing methods are generally used for measuring the following risks:
− Market risks, which include interest rate risk, exchange rate risk, equity price risk, and commodity risk. These risks reflect potential losses resulting from changes in prices of financial instruments sensitive to interest rates, exchange rates, equity prices, or commodity prices. All the risks have their specific features, e.g., the risk of changes in interest rates and their volatility is accompanied by the risk of changes in the shape of the yield curve and the risk of premature redemption of bonds.
− Credit risk, which is typically a key risk in banking business. It is the risk of loss due to financial insolvency or unwillingness to pay of a borrower.
− Liquidity risk, which is the risk of loss due to a shortage of liquid funds.
Questionnaire evaluation
The survey was conducted using a questionnaire sent to 36 banking institutions (27 banks and 9 foreign bank branches) out of the 37 operating in the Czech banking sector as of December 31, 2002.19 Altogether, 30 institutions replied to the questionnaire (a response rate of 83 percent in terms of the number of institutions). Two of these were excluded from the sample due to bankruptcy in 2003. This adjustment brought the size of the survey sample down to 28 institutions (covering 92 percent of the banking system’s total assets).
Overall, 19 of the 28 included institutions (68 percent as measured by the number of institutions) applied stress testing methods; the remaining 9 did not use stress testing, but planned to do so in the near future. All 19 institutions that conduct stress testing do so mainly for risk management purposes. Furthermore, 13 institutions (68 percent) use them for management support, 11
18 Prepared by Jaroslav Heřmánek and Eva Komárková. 19 The questionnaire was not sent to one mortgage bank that started operating only at the end of 2002.

Stress Testing the Czech Banking System 35
institutions (58 percent) for setting limits (in three cases this is done by headquarters), 5 institutions (26 percent) for capital allocation (in five cases by headquarters), 12 institutions (63 percent) for emergency planning, and 8 institutions (42 percent) for liquidity risk management.
As regards the periodicity of the stress tests, 10 institutions (52 percent of those conducting stress tests) use stress tests for market risks on a daily basis. Eight institutions (42 percent) conduct stress tests monthly. Only 2 institutions (11 percent) use them quarterly, and 9 declared other or irregular periodicity (weekly, half-yearly, or yearly). For the banks that run stress tests for market risks on a daily basis, it is also common to conduct other stress tests at a lower periodicity.
In their questionnaire responses, banks specified in more detail the scenarios and shocks used. This is discussed in the next section.
Applied methods
The following are the main risk measurement methods used by Czech commercial banks for market risks:
− VaR (Value at Risk) is a method based on the probability of deviation from anticipated profit. Given the banks’ open positions, it calculates the potential losses arising to banks from price volatility. In the Czech banking system, this method is very common for measuring market risks. It is used by 12 institutions.
− Gap analysis is based on measuring the mismatch (“gap”) between interest rate sensitive assets and liabilities. It is used for measuring interest rate risk and liquidity risk by 12 banks. For example, one bank uses interest rate gap analysis under the name of the IRM (Interest Rate Mismatch) method to assess daily gaps in its asset-liability profile.
− Duration analysis estimates the sensitivity of the value of a financial instrument (usually a bond) with respect to change in prices (measured in time units). It is used by 7 banks for measuring interest rate risks. A version of this analysis is used under the name of the BPV (Basis Point Value) method by 6 banks to determine the direction of portfolio changes whenever the price is changed by one basis point.
− “What if” scenarios present the sensitivity of a portfolio to hypothetical changes in the shape of the yield curve, foreign exchange rates, equity prices, or commodity prices. Typically included is a variety of price scenarios with different levels of plausibility (realistic, less realistic, the worst possible). As of end-2002, such scenarios were regularly used by one bank.
− MtM (Marking to Market) consists in the revaluation of an equity portfolio in response to changes in market prices. MtM is used by 3 banks.
As regards credit risk, the banks used the following risk measurement methods: the EDF (Expected Default Frequency) method, the LGD (Loss Given Default) method of credit quality (used by one bank) and an IRB (Internal Rating Based) model (used by one bank). The application of these methods is typically combined with the development and use of methods of credit risk measurement within the New Basel Accord and internal ratings according to the new
36 Martin Čihák, Jaroslav Heřmánek
concept of capital adequacy. Banks have also used other, more bank-specific, methods of credit risk measurement; however, none of these were linked to any stress tests.
The banks generally do not use more complicated stress testing methods with one or more functional dependent variables. Nine banks use historical scenarios and eight banks use hypothetical ones. Thirteen banks also use sensitivity tests.
The historical scenarios are based on the biggest relative growth and decline of interest rates and exchange rates. The importance of a scenario is typically assessed regularly (every month), the most important scenarios being those that could cause the biggest loss. Some banks combine a number of scenarios to create an aggregate scenario based on maximizing the resulting loss.
The hypothetical scenarios and sensitivity tests for interest rate risk are based on changes in the yield curve (a change in the slope, a parallel shift, and an irregular move of the curve). In some cases, shocks to the policy interest rate and developments in country risk and in the exchange rate are mapped into scenarios of interest income and trading portfolio income.
In the building savings market, the assumed shocks typically relate to changes in the regulatory conditions (e.g., the extent of state support, the term of notice, age limits), the number of new clients, and the proportion of clients that save without applying for credit.
Conclusions
Overall, the results of the survey suggest that the Czech banking sector is at a relatively early stage of developing its stress testing capacity. For market risks, banks have regular risk measurement exercises, even though most of them use VaR-type models rather than stress tests. For credit risk, banks apparently do not use scenarios and shocks to risk factors. The stress tests do not allow for correlation between market risk and credit risk. Also, banks have so far not been using vector autoregression models, Monte Carlo simulations (with the exception of two banks), or other more sophisticated methods.
CNB RESEARCH AND POLICY NOTES
2/2005 Martin Čihák: Jaroslav Heřmánek
Stress testing the Czech banking system: Where are we? Where are we going?
1/2005 David Navrátil: Viktor Kotlán
The CNB’s policy decisions – Are they priced in by the markets?
4/2004 Aleš Bulíř: External and fiscal sustainability of the Czech economy: A quick look through the IMF’s night-vision goggles
3/2004 Martin Čihák: Designing stress tests for the Czech banking system 2/2004 Martin Čihák: Stress testing: A review of key concepts 1/2004 Tomáš Holub: Foreign exchange interventions under inflation targeting:
The Czech experience
2/2003 Kateřina Šmídková: Targeting inflation under uncertainty: Policy makers’ perspective
1/2003 Michal Skořepa: Viktor Kotlán
Inflation targeting: To forecast or to simulate?
CNB WORKING PAPER SERIES
8/2005 Roman Horváth: Exchange rate variability, pressures and optimum currency area criteria: Implications for the central and eastern european countries
7/2005 Balázs Égert: Luboš Komárek
Foreign exchange interventions and interest rate policy in the Czech Republic: Hand in glove?
6/2005 Anca Podpiera: Jiří Podpiera
Deteriorating cost efficiency in commercial banks signals an increasing risk of failure
5/2005 Luboš Komárek: Martin Melecký
The behavioural equilibrium exchange rate of the Czech koruna
4/2005 Kateřina Arnoštová: Jaromír Hurník
The monetary transmission mechanism in the Czech Republic (evidence from VAR analysis)
3/2005 Vladimír Benáček: Jiří Podpiera Ladislav Prokop
Determining factors of Czech foreign trade: A cross-section time series perspective
2/2005 Kamil Galuščák: Daniel Münich
Structural and cyclical unemployment: What can we derive from the matching function?
1/2005 Ivan Babouček: Martin Jančar
Effects of macroeconomic shocks to the quality of the aggregate loan portfolio
10/2004 Aleš Bulíř: Kateřina Šmídková
Exchange rates in the new EU accession countries: What have we learned from the forerunners
9/2004 Martin Cincibuch: Jiří Podpiera
Beyond Balassa-Samuelson: Real appreciation in tradables in transition countries
8/2004 Jaromír Beneš: David Vávra
Eigenvalue decomposition of time series with application to the Czech business cycle

7/2004 Vladislav Flek, ed.: Anatomy of the Czech labour market: From over-employment to under-employment in ten years?
6/2004 Narcisa Kadlčáková: Joerg Keplinger
Credit risk and bank lending in the Czech Republic
5/2004 Petr Král: Identification and measurement of relationships concerning inflow of FDI: The case of the Czech Republic
4/2004 Jiří Podpiera: Consumers, consumer prices and the Czech business cycle identification
3/2004 Anca Pruteanu: The role of banks in the Czech monetary policy transmission mechanism
2/2004 Ian Babetskii: EU enlargement and endogeneity of some OCA criteria: Evidence from the CEECs
1/2004 Alexis Derviz: Jiří Podpiera
Predicting bank CAMELS and S&P ratings: The case of the Czech Republic
12/2003 Tibor Hlédik: Modelling the second-round effects of supply-side shocks on inflation
11/2003 Luboš Komárek: Zdeněk Čech Roman Horváth
ERM II membership – the view of the accession countries
10/2003 Luboš Komárek: Zdeněk Čech Roman Horváth
Optimum currency area indices – how close is the Czech Republic to the eurozone?
9/2003 Alexis Derviz: Narcisa Kadlčáková Lucie Kobzová
Credit risk, systemic uncertainties and economic capital requirements for an artificial bank loan portfolio
8/2003 Tomáš Holub: Martin Čihák
Price convergence: What can the Balassa–Samuelson model tell us?
7/2003 Vladimír Bezděk: Kamil Dybczak Aleš Krejdl
Czech fiscal policy: Introductory analysis
6/2003 Alexis Derviz:
FOREX microstructure, invisible price determinants, and the central bank’s understanding of exchange rate formation
5/2003 Aleš Bulíř:
Some exchange rates are more stable than others: Short-run evidence from transition countries
4/2003 Alexis Derviz:
Components of the Czech koruna risk premium in a multiple-dealer FX market
3/2003 Vladimír Benáček: Ladislav Prokop Jan Á. Víšek
Determining factors of the Czech foreign trade balance: Structural Issues in Trade Creation
2/2003 Martin Čihák: Tomáš Holub
Price convergence to the EU: What do the 1999 ICP data tell us?
1/2003 Kamil Galuščák: Daniel Münich
Microfoundations of the wage inflation in the Czech Republic
4/2002 Vladislav Flek: Lenka Marková Jiří Podpiera
Sectoral productivity and real exchange rate appreciation: Much ado about nothing?
3/2002 Kateřina Šmídková: Ray Barrell Dawn Holland
Estimates of fundamental real exchange rates for the five EU pre-accession countries
2/2002 Martin Hlušek: Estimating market probabilities of future interest rate changes
1/2002 Viktor Kotlán: Monetary policy and the term spread in a macro model of a small open economy
CNB ECONOMIC RESEARCH BULLETIN
November 2005 Financial stability May 2005 Potential output October 2004 Fiscal issues May 2004 Inflation targeting December 2003 Equilibrium exchange rate

Czech National Bank Economic Research Department Na Příkopě 28, 115 03 Praha 1
Czech Republic phone: +420 2 244 12 321
fax: +420 2 244 14 278 http://www.cnb.cz
e-mail: [email protected]