Embed Size (px)
Citation preview

Research and Planning & Student Services 2006
Student Retention Strategy
Why is it Essential?

Research and Planning & Student Services 2005
Presentation Overview
Why have a Student Retention Strategy?
What are the purposes of the Strategy?
Discussion . . .

Research and Planning & Student Services 2005
Certificate Programs Retention
RRC Certificate Programs Graduation and Attrition Rates for 1998-99 to 2002-03 cohorts after Two Years
0
10
20
30
40
50
60
70
80
Graduate Non-graduate Termination(College)
Terminations(Self)
On Program
1998-99 1999-00 2000-01 2001-02 2002-03
Source: RRC Research and Planning. COPSE Graduation and Retention Reporting System.

Research and Planning & Student Services 2005
Diploma Students Retention
RRC Diploma Programs Graduation and Attrition Rates for 1998-99 to 2002-03 after Three Years
0
10
20
30
40
50
60
Graduate Non-graduate
Termination(College)
Terminations(Self)
On Program
1998-99 1999-00 2000-01 2001-02 2002-03
Source: RRC Research and Planning. COPSE Graduation and Retention Reporting System.

Research and Planning & Student Services 2005
Impact
Students Loss of financial investment Career confusion Decreased confidence & loss of self concept Lower employment outcomes
College Loss of revenue Negative perceptions of the college
Province Lower return on educational funding Less educated work force

Research and Planning & Student Services 2005
Manitoba Educational Attainment Rate.
Trades, College and University Attainment Rates (25-64) 2001 Canada and Provinces
0
10
20
30
40
50
60
70
CANADA NFL PEI NS NB QC ON MB SK AB BC
Trades College University
Source: Statistics Canada, Census 2001

Research and Planning & Student Services 2005
Manitoba Youth Education Attainment
College/ Trade and University Attainment Rates for Individuals, 20-24 years Age Group, by Province 2001
0%
10%
20%
30%
40%
50%
60%
CA NL PE NS NB QC ON MB SK AB BC
Trade/ College University
Source: Price of Knowledge 2004.
Research and Planning & Student Services 2005
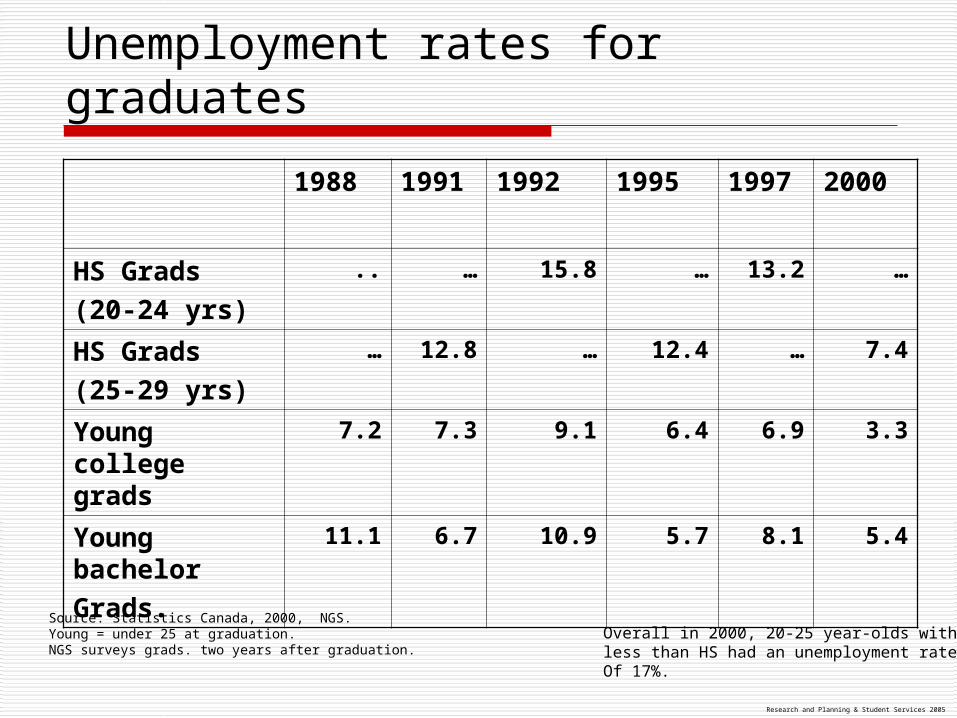
Unemployment rates for graduates
1988 1991 1992 1995 1997 2000
HS Grads(20-24 yrs)
.. … 15.8 … 13.2 …
HS Grads(25-29 yrs)
… 12.8 … 12.4 … 7.4
Young college grads
7.2 7.3 9.1 6.4 6.9 3.3
Young bachelorGrads.
11.1 6.7 10.9 5.7 8.1 5.4
Source: Statistics Canada, 2000, NGS.Young = under 25 at graduation.NGS surveys grads. two years after graduation.
Overall in 2000, 20-25 year-olds with less than HS had an unemployment rateOf 17%.

Research and Planning & Student Services 2005
Graduates’ Productivity Effects
Direct Effect: Past students contribute an estimated $866.6
million worth of added income per year to the regional economy after
leaving RRC.
Indirect Effect: The estimated multiplier effect of past student
productivity in other industries increases income by yet another $159.5 million.

Research and Planning & Student Services 2005
In the Knowledge Economy Education is Essential
Knowledge based economy requires skilled people Now, 70% of new jobs require some
postsecondary education (HRDC)
Looming demographic crunch Ageing population
Learning system needs to be strengthened Canada is 15th in adult learning participation
(OECD) Foundation economy requirements
Skilled trades shortages

Research and Planning & Student Services 2006
What are the purposes of the Strategy?

Research and Planning & Student Services 2005
Goals
Increase student retention and success.
Understand the college-specific determinants of first-term student success and retention.
Promote the efficient and effective use of college resources.

Research and Planning & Student Services 2005
Student Development Models
Neurological Development of the brain and learning Mustard, Phillips & Shonkoff
Cognitive-Structural Understanding the world Piaget, Perry
Psychosocial Achieving identity Erikson, Chickering
Source: Dietsche, 2002.

Research and Planning & Student Services 2005
Lots Happening to Our Students
Establishing their identity Building relationships Clarifying future careers Developing a more sophisticated
understanding of their world Developing abstract reasoning Developing values and ethics Working & managing family responsibilities Trying to have fun Learning skills, developing knowledge

Research and Planning & Student Services 2005
Determinants of Learning Verbal, Quantitative and Subject Matter
Competence Individualized instruction produces greater gains
Cognitive Skills and Intellectual Growth Growth directly related to student involvement in
college academic and social life Identity, Self-Concept and Self-Esteem
Development influenced by student involvement in academic and social systems of college
Relating to Others and the External World Evidence for the importance of interaction with faculty
& peers Attitudes and Values
Evidence that change is due to college experiences: Interpersonal associations students have with faculty and peers
Source: Pascarella & Terenzini (1991). Dietsche (2002).

Research and Planning & Student Services 2005
A Key Issue is Student Diversity Needs
Finance, child care, career guidance, disability Abilities
Literacy, numeracy, learning skills, computer skills
Attitudes Confidence, career certainty, perceived value of
PSE Behaviors
Study habits, Class attendance, homework completion
Travel time to college Work commitment Family comments.

Research and Planning & Student Services 2005
Parent’s Level of Education for RRC Students
28%
18%
10%
17% 16%
11%
27%
3%
19% 18%
10%
23%
0%
5%
10%
15%
20%
25%
30%
35%
40%
< High Sc. High Sc. Apprent. College/Inst. University DK
Per
cent
Father Mother
Source: Canadian College Student Financial Survey, 2004.Note. All years of enrolment. Certificate, diploma and joint degree students only.

Research and Planning & Student Services 2006
Basis of the Strategy?

Research and Planning & Student Services 2005
Student Success
Source: P. Dietsche.

Research and Planning & Student Services 2005
A Model of Educational Outcomes
Source: Dietsche, 2002.

Research and Planning & Student Services 2005
Development Work is Required
Administration of the system Fielding Data entry, analysis and reporting Distributing reports Questionnaire review and customization Reports review and customization
Intervention strategies Faculty advising Student service support Communities of practice

Research and Planning & Student Services 2005
Red River College
……..Going Places..Going Places ....."all effective retention programs have effective advising at their very
core.“ Dr. Vincent Tinto, 1988 NACADA Convention
Discussion . . .