Embed Size (px)
Citation preview

“Research and Implementation: Lessons
from the Original Demonstration”
February 11, 2004
Teleconference

Agenda
Overview of Cash & Counseling Program
Presentation of Evaluation Results University of Maryland Baltimore County Qualitative Study Mathematica Results Question and Answer session
Review of Implementation Lessons Question and answer session
Cash & Counseling: Program Overview Funders
The Robert Wood Johnson Foundation US DHHS/ASPE Administration on Aging
Waiver and Program Oversight Centers for Medicare and Medicaid Services
National Program Office Boston College Graduate School of Social Work
Original Cash & Counseling Demonstration OverviewDemonstration States
Arkansas, Florida, New Jersey
Study Populations Adults with disabilities (Ages 18-64) Elders (Ages 65+) Florida only: Children with developmental disabilities
Feeder Programs Arkansas and New Jersey: Medicaid personal care option programs Florida: Medicaid 1915c Home and Community-Based long-term
care waiver programs

Essential Elements of Cash & Counseling
Person-centered planning for personal assistance services
Consumer-directed individualized budgets
Client supports including financial management and counseling services (supports brokerage)
Quality assurance and improvement systems

Basic Model for Cash & Counseling
Step 1: Consumers receive traditional assessment and care plan
Step 2: A dollar value is assigned to that care plan
Step 3: Consumers receive enough information to make unbiased personal choice between managing individualized budget or receiving traditional agency-delivered services

Basic Model for Cash & Counseling
Step 4: Cash allowance group provided with financial management and counseling services (supports brokerage)
Step 5: Consumer and counselor develop cash plan to meet consumer’s personal assistance needs
Basic Model for Cash & Counseling
Consumers may appoint someone to help them manage the cash allowance
Almost all of the participants chose to utilize the financial management services
Consumers in cash allowance group may return to traditional services at anytime
Cash & Counseling Teleconferences 2004
January 23rd: Responding to the Cash & Counseling Call for Proposals: Requirements and Resources
February 11th: Research & Implementation: Lessons from the Original Demonstration.
March 8th: Open Forum: Getting your Questions Answered.

Responding to the Cash & Counseling Call for Proposals
Intent to Apply Deadline: February 13, 2004, 3pm EST
available at www.cashandcounseling.org
Full Proposal Deadline: March 31, 2004submit to [email protected]

Research and Implementation:
Lessons from the Original Cash & Counseling
Demonstration
Cash & Counseling Qualitative Study

Purpose of Qualitative Study Provide detailed information and stories about the
experience of Cash & Counseling consumers in each state
Four questions were addressed:Has the program made a difference in participants’
lives?How does participation in the program compare to
previous arrangements?How are services provided?How does the program work?
Methodology Focused on care units: Consumer/family member(s),
primary paid worker, and counselor
Samples included consumers of different ages, races, sexes, monthly cash benefits amounts, and types of workers (i.e. family vs. non-family)
Interviewers conducted hour long, face-to-face, tape-recorded interviews in the consumer’s home
Emerging Themes Stories were created from transcripts and
incorporated the perspective of all care unit members
Many themes were identified including: Choice is important to consumers Consumers valued the flexibility of the program Consumers found creative ways to use their monthly
allowance to meet their needs Consumers experienced improved quality of life and
satisfaction with their care

In Their Own Words: Consumers
*Mrs. Margaret Taylor, 64 years old, describing her non-family personal care worker
“She’s a beautiful person. She’s helpful and she’s just like an older daughter and she cooks and cleans and
does the laundry and puts things away…She just takes care. I don’t have to worry about her and
whatever I ask her and whatever I need, I ask her to do, and she does it and things I don’t even ask her to
do, she does.”*Names are changed to protect consumer confidentiality

In Their Own Words: Consumers
*Mr. Gilberto Santiago, 26 years old, describing how his life has changed since his father became his
primary paid caregiver
“You can trust him [father] more. You know that you will be taken care of better…As a young person, you
like to look good…your dad knows about that, he knows how your jeans fit…He [father] puts your hat on the way you want…[health aides] don’t take care
of you the same way your father does.”
*Names have been changed to protect consumer confidentiality
For More Information
Arkansas report is final and available on the web site; New Jersey report is in process of final revisions; Florida final report will be available in Fall 2004
Completed reports available at www.cashandcounseling.org

Effects on Consumers’ Service Use and
Well-Being: Findings from Arkansas
Leslie FosterStacy Dale
Randall BrownBarbara PhillipsJennifer Schore
Barbara Lepidus Carlson
Research and Implementation: Lessons from the Cash & Counseling Demonstration
Teleconference; February 11, 2004
Intended Effects of IndependentChoices
Medicaid beneficiaries with disabilities direct their own personal care services
Change amounts, timing, and types of services
Satisfaction and well-being improve- Without detriment to health and safety

Methods
Randomly assigned applicants after baseline
Interviewed treatment and control group members 9 months later
Compared regression-adjusted outcomes for the two groups

Arkansas Survey Sample Ages 18-64 Age 65+ Sample Size
Treatment group 243 642 Control group
230
624
Total
473
1,266
Source: Survey conducted 9 months after enrollment.
Ages 18-64 Age 65+ Sample Size
Treatment group 243 642 Control group
230
624
Total
473
1,266
Source: Survey conducted 9 months after enrollment.
Ages 18-64 Age 65+ Treatment group
243
642
Control group
230
624
Total
473
1,266
Source: Survey conducted 9 months after enrollment.

Received Paid Assistance in Past Two Weeks
80
95
68
95
***Significantly different from control group at .01 level.***Significantly different from control group at .01 level.
Ages 18-64Ages 18-64 Age 65+Age 65+
*** ***TT
CC
TT
CC
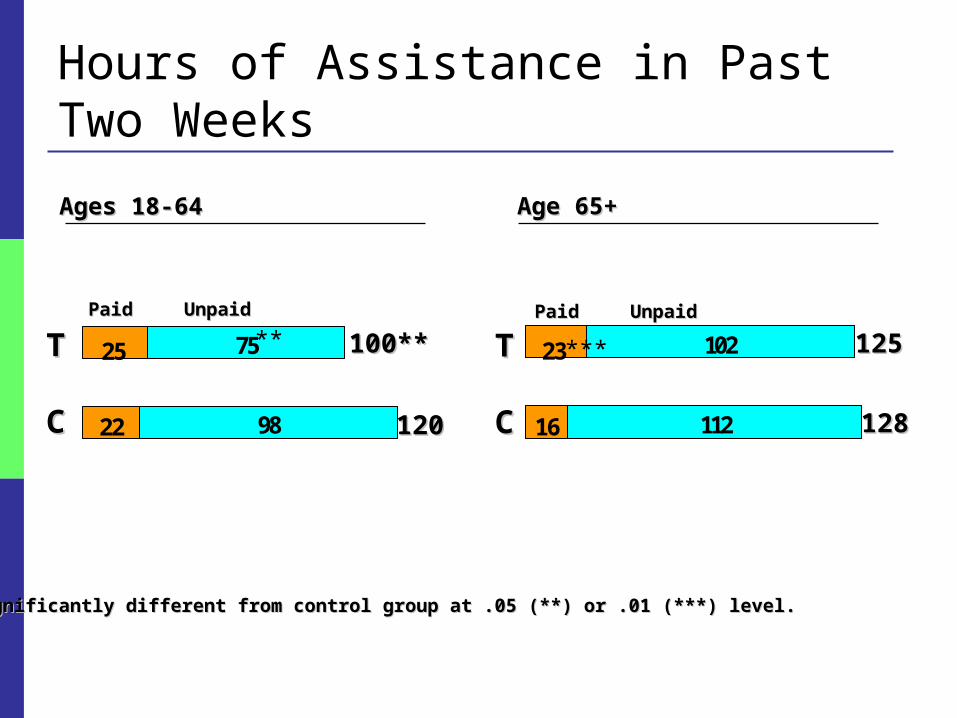
Hours of Assistance in Past Two Weeks
16 112
23 102
22 98
25 75
****,,***Significantly different from control group at .05 (**) or .01 (***) level.***Significantly different from control group at .05 (**) or .01 (***) level.
Ages 18-64Ages 18-64 Age 65+Age 65+
***TT
CC
TT
CC
** 100**100**
120120
125125
128128
PaidPaid UnpaidUnpaid PaidPaid UnpaidUnpaid
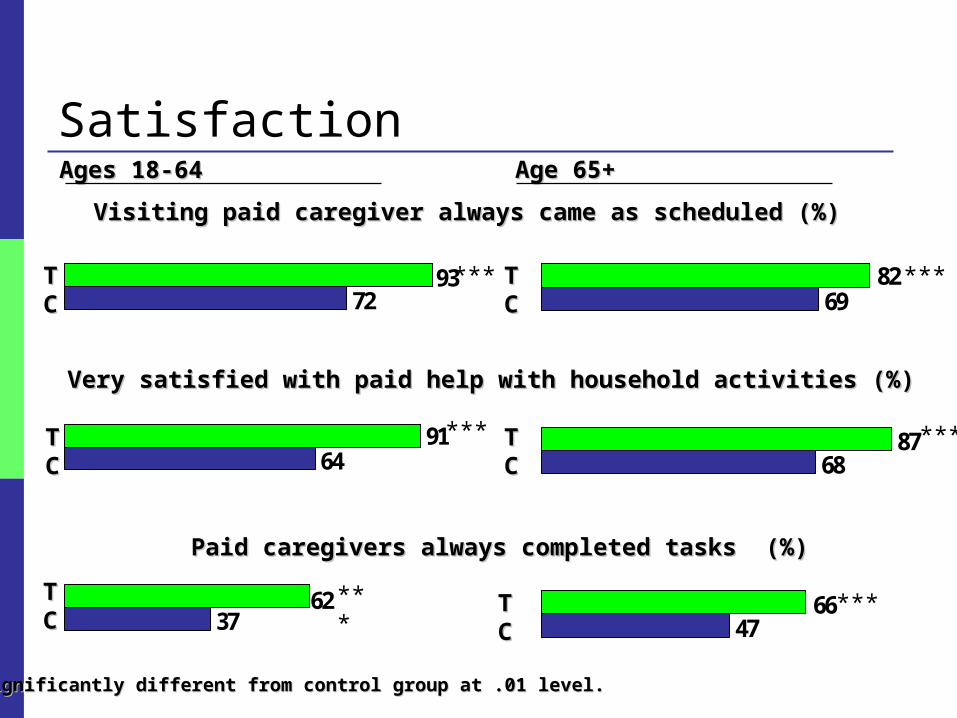
Satisfaction
37
64
72
62
91
93
47
68
69
87
66
82
Visiting paid caregiver always came as scheduled (%)Visiting paid caregiver always came as scheduled (%)
Very satisfied with paid help with household activities (%)Very satisfied with paid help with household activities (%)
***Significantly different from control group at .01 level.***Significantly different from control group at .01 level.
Ages 18-64Ages 18-64 Age 65+Age 65+
***
***
***
***
TTCC
TTCC
TTCC
TTCC
*** ***
Paid caregivers always completed tasks (%)Paid caregivers always completed tasks (%)
TTCC
TTCC
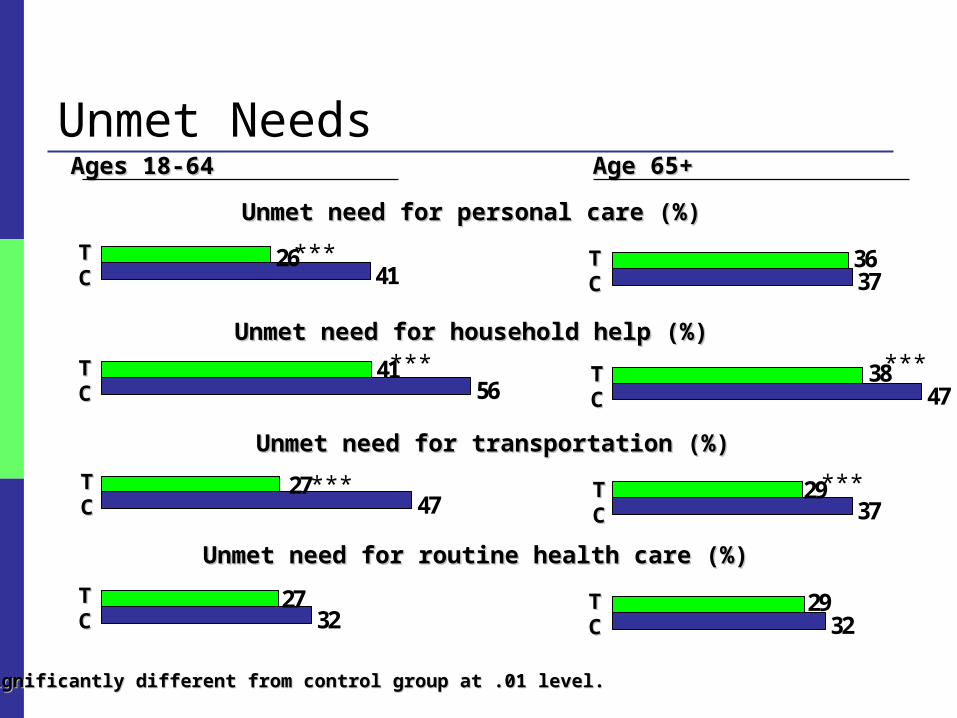
Unmet Needs
32
47
41
56
26
27
27
41
32
37
47
37
29
36
29
38
Unmet need for personal care (%)Unmet need for personal care (%)
Unmet need for household help (%)Unmet need for household help (%)
Unmet need for transportation (%)Unmet need for transportation (%)
***Significantly different from control group at .01 level.***Significantly different from control group at .01 level.
Ages 18-64Ages 18-64 Age 65+Age 65+
***
***
***
***
TTCC
TTCC
TTCC
TTCC
TTCC
TTCC
Unmet need for routine health care (%)Unmet need for routine health care (%)
***TTCC
TTCC

Adverse Events and Health Problems
4.0
13
29
6
1.3
28
1.91.4
7
19
8
19
Fell (%)Fell (%)
Saw doctor for a cut, burn, or scald (%)Saw doctor for a cut, burn, or scald (%)
**,,**Significantly different from control group at .10 (*) or .05 (**) level.**Significantly different from control group at .10 (*) or .05 (**) level.
Ages 18-64Ages 18-64 Age 65+Age 65+
*
TTCC
TTCC
TTCC
TTCC
**
Bed sores developed or worsened (%)Bed sores developed or worsened (%)
TTCC
TTCC

Satisfaction with Overall Care and Life
23
42
43
71
37
54
56
68
Very satisfied with overall care arrangements (%)Very satisfied with overall care arrangements (%)
****,,***Significantly different from control group at .05 (**) or .01 (***) level.***Significantly different from control group at .05 (**) or .01 (***) level.
Ages 18-64Ages 18-64 Age 65+Age 65+
***TT
CC
***
***
***
Very satisfied with way spending life (%)Very satisfied with way spending life (%)
TT
CC
TT
CC
TT
CC

The Experiences of Informal Caregivers and Hired Workers Under IndependentChoices
Stacy Dale
Leslie Foster
Randy Brown
Barbara Phillips
Barbara Carlson
Research and Implementation: Lessons from the Cash & Counseling Demonstration
Teleconference
February 11, 2004

Why Study Caregivers and Workers?
Informal caregivers Provide more in-home personal care than paid sources
Help Medicaid beneficiaries avoid nursing homes
Hired Workers
Must have positive experiences for consumer-direction to be sustainable
Samples Informal caregiver: the person providing the most unpaid
care at baseline. Sample: 721 caregivers for the treatment group 712 caregivers for the control group
Hired worker: the primary person providing paid care at the time of the 9-month survey.
Sample: 391 workers for treatment group 281 agency workers

Outcome MeasuresCompared survey responses (10 months post-baseline) of
treatment group caregivers to control group caregivers for these measures:
Amount of assistance
Satisfaction with care arrangements
Emotional, financial, physical well-being
Satisfaction with life

Informal Caregiver Characteristics
86% Female
93% Related to consumer
62% Lived with consumer
56% of treatment group caregivers became paid worker
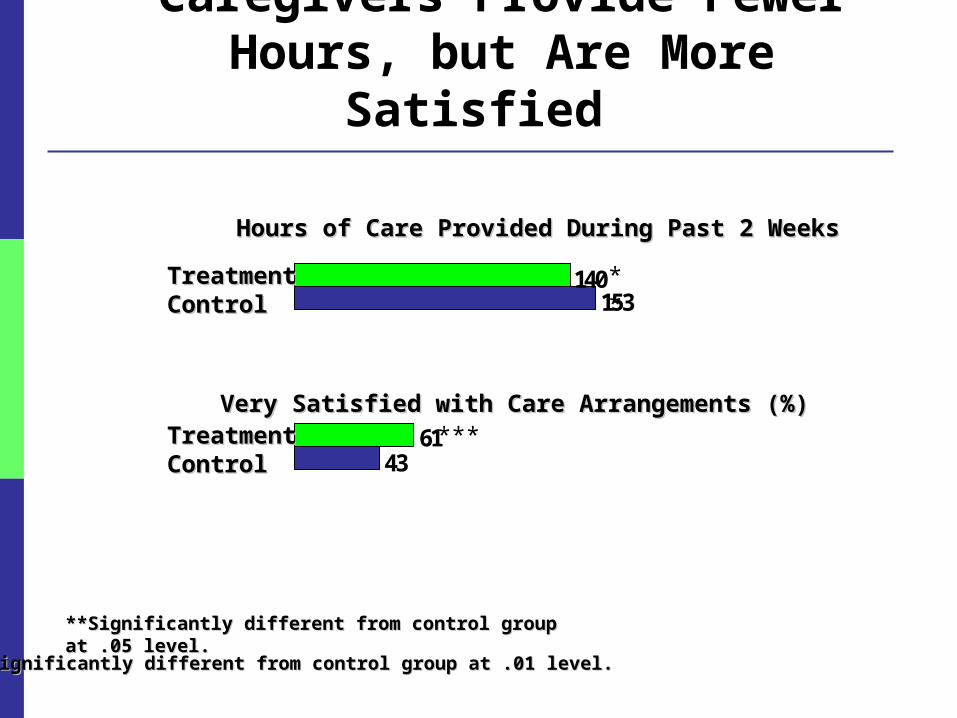
Caregivers Provide Fewer Hours, but Are More Satisfied
**Significantly different from control group at .05 level.**Significantly different from control group at .05 level.
43
153140
61
Hours of Care Provided During Past 2 WeeksHours of Care Provided During Past 2 Weeks
Very Satisfied with Care Arrangements (%)Very Satisfied with Care Arrangements (%)
***Significantly different from control group at .01 level.***Significantly different from control group at .01 level.
**
***
TreatmentTreatmentControlControl
TreatmentTreatmentControlControl

Caregiver Well-Being
32
34
36
23
27
22
Report caregiving causes great financial strain (%)Report caregiving causes great financial strain (%)
Report caregiving causes great emotional strain (%)Report caregiving causes great emotional strain (%)
Report caregiving causes great physical strain (%)Report caregiving causes great physical strain (%)
***Significantly different from control group at .01 level.***Significantly different from control group at .01 level.
***
***TreatmentTreatmentControlControl
TreatmentTreatmentControlControl
TreatmentTreatmentControlControl
***

Caregiver Health and Life Satisfaction
**Significantly different from control group at .05 level.**Significantly different from control group at .05 level.
39
47
51
36
Current Health is Fair or Poor Relative to PeersCurrent Health is Fair or Poor Relative to Peers
Very Satisfied with Life (%)Very Satisfied with Life (%)
***Significantly different from control group at .01 level.***Significantly different from control group at .01 level.
**
***
TreatmentTreatmentControlControl
TreatmentTreatmentControlControl

Policy Concerns for Hired WorkersWithout agency support
Will workers be under-compensated or mistreated?
Will workers receive adequate training?
Will workers feel emotionally and physically strained?
What pattern of care will workers provide?

Findings for Hired WorkersHired workers Were mostly relatives (78%) and friends (16%) Received pay similar to that of agency workers: $6
per hour for about 12 hours a week Provided an average of 26 hours of unpaid care per
week Helped with wide range of tasks

Most Concerns about Workers Didn’t Materialize Many lacked formal training, but:
Most felt well-prepared No greater physical problems for workers or consumers
Had low compensation and fringes, but: Most were very satisfied with pay and conditions
Felt more emotional strain and wanted more respect but: Difference confined to hired relatives
Program Costs in Arkansas and Policy Implications
Randall Brown
Stacy Dale
Leslie Foster
Barbara Phillips
Jennifer Schore
Research and Implementation:Lessons from the Cash & Counseling Demonstration
Teleconference February 11, 2004

Expected Effects on Costs
Program required to be “budget neutral” per month of service
Waiver service costs could increase
Other Medicaid/Medicare costs may be affected
Medicaid cost pressures limit states’ options

Methods and Data Compare actual to expected costs for personal care services
Compare treatment and control groups on service use and costs
Data: Individual care plans
Medicaid claims
Medicare claims
Two-year follow-up data for 1312 first-year enrollees
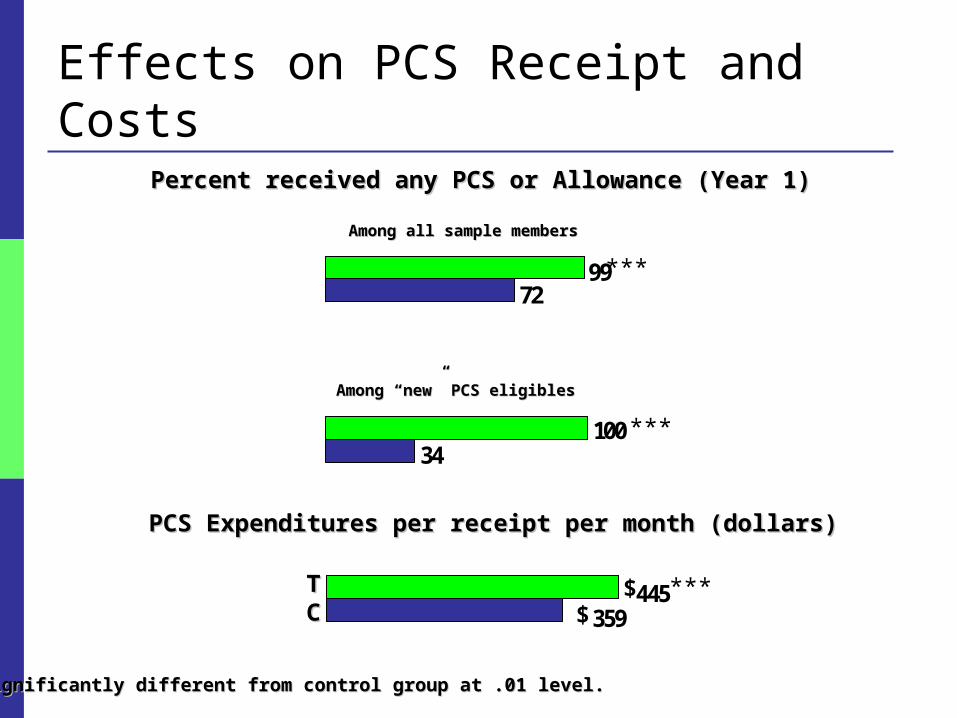
Effects on PCS Receipt and Costs
359445
PCS Expenditures per receipt per month (dollars)PCS Expenditures per receipt per month (dollars)
***Significantly different from control group at .01 level.***Significantly different from control group at .01 level.
***TTCC $
$
34
72
100
99
Percent received any PCS or Allowance (Year 1)Percent received any PCS or Allowance (Year 1)
***
***
Among all sample membersAmong all sample members
Among “new” PCS eligiblesAmong “new” PCS eligibles

Actual/Expected PCS in Month 12
0.70
0.82
1.07
0.99
(Mean actual cost) / (mean expected cost)(Mean actual cost) / (mean expected cost)
****,,***Significantly different from control group at .05 (**) or .01 (***) level.***Significantly different from control group at .05 (**) or .01 (***) level.
***TT
CC
***TT
CC
Note: Includes only those receiving an allowance for the treatment group, and only those receiving PC services for the control group.
(Hours received or cashed out) / (care plan hours)(Hours received or cashed out) / (care plan hours)
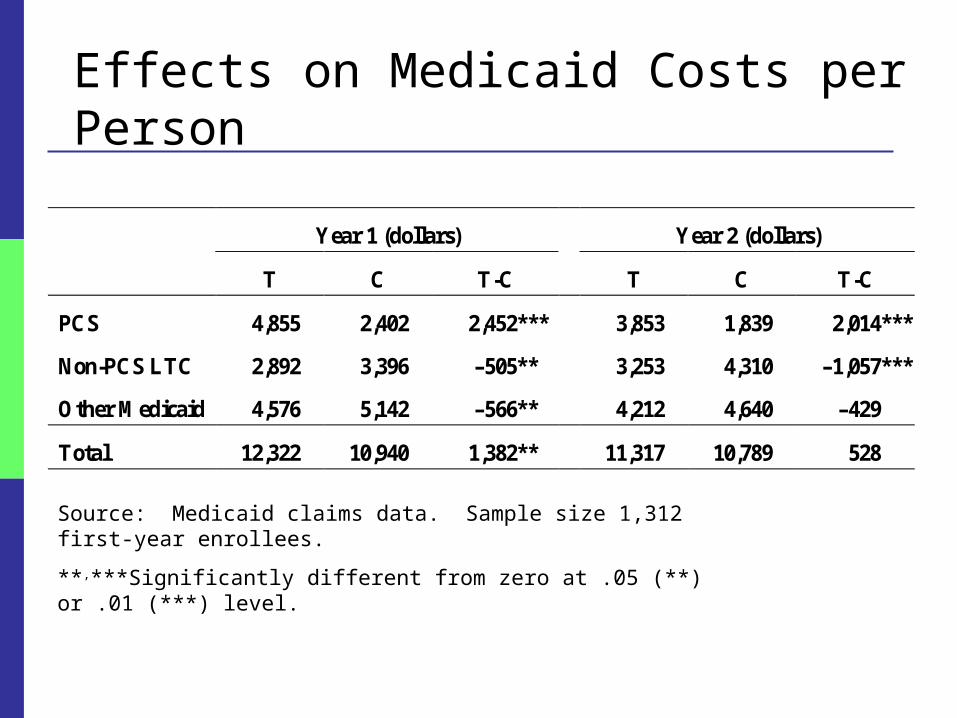
Effects on Medicaid Costs per Person
Year 1 (dollars) Year 2 (dollars)
T C T-C T C T-C
PCS 4,855 2,402 2,452*** 3,853 1,839 2,014***
Non-PCS LTC 2,892 3,396 –505** 3,253 4,310 –1,057***
Other Medicaid 4,576 5,142 –566** 4,212 4,640 –429
Total 12,322 10,940 1,382** 11,317 10,789 528
Source: Medicaid claims data. Sample size 1,312 first-year enrollees.
**,***Significantly different from zero at .05 (**) or .01 (***) level.

Sources of Reduction in Medicaid Costs
Year 1 (dollars) Year 2 (dollars)
T C T-C T C T-C
Nursing home 460 696 –235 1,149 1,749 –601**
Home health 336 479 –142 217 373 –156**
ElderChoices 1,752 1,961 –209** 1,384 1,586 –202
Alternatives 343 261 82 503 602 –99
All non-PCS LTC 2,892 3,396 –505 3,253 4,310 –1,057***
Source: Medicaid claims data. Sample size 1,312 first-year enrollees.
**,***Significantly different from zero at .05 (**) or .01 (***) level.
Policy Implications Program worked from consumer viewpoint - Interested elders can direct their services
- Caregivers benefit too
Costs and access are interrelated
Lower long-term care costs offset higher PCS costs
Agencies might be motivated to compete
Early Florida results suggest generalizability

LESSONS from the IMPLEMENTATION of
CASH and COUNSELING
ARKANSAS, FLORIDA,
and NEW JERSEY

Outreach and Enrollment
Role of traditional agencies
Their cooperation is needed
Assigning them responsibility for outreach and enrollment can create problems
Building caseload quickly may require hiring dedicated staff
Outreach and Enrollment Direct outreach
To eligible beneficiaries and perhaps to their families Letters from the governor Targeting eliminates inquiries from ineligibles
Community education Useful for outreach if can be targeted Can help to generate support among community
providers
Outreach and Enrollment
Home visits to interested beneficiaries Necessary to explain the allowance program Involving family and friends reduces the number of visits
needed Avoid presence of aides from traditional agencies
Materials Must be easy to understand Need a variety of media—written, oral, and video In languages of eligible populations

Outreach and Enrollment
Formal screening process for appropriateness? May not be legally defensible Inconsistent with the philosophy of consumer direction
Allowing all interested to enroll Proved workable But can be costly due to early dropout
Representatives
Representatives assist the consumer with the allowance Naming representatives
Most representatives are related to the consumer• Required for children; many adult consumers will name them
Shared decision making typical Almost all representatives served the consumer well Special monitoring when the representative is also a worker
Counseling and the Spending Plan
Counselor concerns about liability for consumer outcomes
Initial spending plan Development can be time-consuming Consumer need for help not indicative of inappropriateness Advance preparation can minimize counselor home visits to develop
the plan
Plans must be revised as consumer needs and plans change
Techniques available to reduce need for revision
Use of the Allowance and Workers Hiring workers
Nearly all consumers use their allowance to hire workers
Most workers are relatives or acquaintances of the consumer Access to care can be improved by tapping this “labor
supply”
Consumers without a relative or acquaintance to hire often have difficulty hiring a worker Methods to assist them include training and worker
registries

Use of the Allowance and Workers Terminating workers
Consumers usually handle worker termination gently Some will need the assistance of counselors
Consumers take advantage of the flexibility of the allowance Purchase the service that is needed rather than the covered service

Fiscal Services
Nearly all consumers want payroll and check writing services Provided these are offered at little direct expense to them
Procedures needed for minimizing overpayment and recouping if necessary Payments may be deposited for which consumers have become
ineligible Consumers may overspend the allowance due to administrative error

Fiscal Services
Fiscal agents typically strapped when case loads are small May need assistance with cash flow until reach “break-even”
caseload Break-even caseload may vary from 200 to 1,000 consumers,
depending on the structure of payment
Need clear delineation of counselor and fiscal agent duties

Fiscal Services
Consumer financial statements Consumers need financial statement to monitor their
accounts Statements should be timely and easy to understand Should clearly list the amount and payee

Preventing Exploitation of Consumer Consumer exploitation was extremely rare A few questionable cases identified by counselor at
initial home visit Referred to protective services or back to traditional
program Periodic visits and telephone calls prevent
exploitation as consumers’ situations change Information and impressions from calls can signal need for
discretionary visit Telephone calls most useful when both consumer and
representative are contacted

Preventing Abuse of the Allowance Abuse of the allowance almost non-existent Critical to preventing abuse of the allowance are:
1. Review of initial and revised spending plans to ensure only permissible goods and services are included
2. Review time sheets and check requests before payment to ensure consistency with the spending plan
Given these 2 reviews, reviews of receipts not critical for prevention of abuse of funds held by fiscal agent

Structure and Procedures Having traditional agencies provide counseling
can create problems Traditional systems that offer a choice of counselors can be
responsive to consumer demand Support among traditional staff can improve if they
observe the value of an allowance program
Full-time counselors most efficient Workable to have sufficient caseload to occupy a
substantial portion of counselor’s time

Structure and Procedures Giving counselors authority to approve goods and
services on a pre-approved list: Reduces expense of review of spending plans State audit to ensure counselors follow approval procedures
Counseling tasks have many fiscal elements An efficient approach is to combine counseling and fiscal
services in the same organization and Make counselors responsible for some fiscal tasks

Steps from Enrollment to Receipt of Allowance (1-5)1. Consumer reviews rules and considers whether to name
representative and what to include in spending plan
2. Counselor visits the consumer to re-explain program and answer questions
3. Consumer and counselor prepare and sign a formal spending plan
4. Worker employment papers are completed and sent to fiscal agent for review
5. Counselor submits plan to program office for approval

Steps from Enrollment to Receipt of Allowance (6-10)6. Consumer, counselor, fiscal agent, and perhaps program
office resolve any errors in plan
7. Fiscal agent initiates consumer account from approved plan
8. Any errors in the employment papers are resolved by counselor, worker and fiscal agent
9. Traditional agency is notified of the date on which to terminate service
10. State Medicaid system is notified to initiate allowance

Reducing Time to the Allowance Some program structures and procedures are
more effective than others in reducing time to allowance
Procedures can be streamlined Programs should monitor elapsed time to
allowance Intervene if long lags observed

Program Costs
Avoid assigning responsibility for assessment and care planning to an advocate for the consumer
Cashing out care plans at a discount may be necessary to constrain costs
Overall costs could increase if the availability of an allowance increases demand
Costs and access are interrelated. Lower long-term care costs offset higher PCS costs.

Contact Information & Deadlines All inquiries about the program, selection criteria or
application process should be directed to Kristin Simone, Deputy Program Director, either via email at [email protected] or by calling 617.552.0620
Intent-to-Apply form due: February 13, 2004, 3p.m. EST
Full Proposal due: March 31, 2004 Intent-to-Apply form and application guidelines can
be found on www.cashandcounseling.org