Embed Size (px)
Citation preview
___. ___. ______ ________________________________
Research about Flea Market
Case: Oranssi Kirppis, Varkaus
Dhruba Siwakoti
Bachelor’s Thesis

Bachelor’s degree (UAS)SAVONIA UNIVERSITY OF APPLIED SCIENCES THESIS
Abstract
Field of StudySocial Sciences, Business and Administration
Degree ProgrammeDegree Programme in International BusinessAuthor(s)Dhruba Siwakoti
Title of Thesis
Research about Flea Market; Case Oranssi Kirppis in Varkaus
Date 8.4.2013 Pages/Appendices 59+11
Supervisor(s)Tuula Linnas
Client Organisation/PartnersOranssi Kirppis
AbstractFlea shop is an unconventional and interesting business entity that operates in a unique way
compared to traditional retailers. Customer behavior and choices are influenced by different
sets of factors and variable. Further, there exists vast variation in the preferences among vari-
ous customer segment like age and income. This study aims to outline the unique mechanism
of flea shop operation and also attempts to understand consumers’ perception towards flea
shop. Customer survey was used as a method to uncover customers’ preference. Employees,
suppliers and owners of flea shop in Varkaus were interviewed to get more insight into the op-
eration of flea shop. The results show that customers have Positive attitude towards used sec-
ond hand goods suggest the longevity and sustainability of flea market. The operation mecha-
nism is unique in a sense that it provides rental space to the seller and bears no responsibility
and liability of sales. Tax free operation contributes massively towards the sustainability of the
business as long as the rent is good enough for covering the operational cost.
To sum up, this study provides a valuable piece of information to the second hand market op-
erators to understand their business and the customers’ preferences and also details the
uniqueness of flea shop to the readers
KeywordsFlea market

TABLE OF CONTENTS
1 INTRODUCTION ........................................................................................... 7
1.1 Background of the study......................................................................... 7
1.2 Objective of the study ............................................................................. 8
1.3 Limitations of the study........................................................................... 8
2 FLEA MARKETS ......................................................................................... 10
2.1 Comparison of flea markets, and general markets. ............................ 11
2.2 Research on Flea market activities ...................................................... 12
2.3 Function of flea market. ........................................................................ 14
2.4 Flea market system .............................................................................. 15
3 RESEARCH METHODOLOGY ................................................................... 19
3.1 Data collection techniques ................................................................... 21
3.2 Data analysis tools ............................................................................... 22
4 ORANSSI KIRPPIS OPERATION FUNCTIONS ......................................... 23
4.1 Maintaining the accounts ...................................................................... 23
4.2 Maintaining marketing ......................................................................... 29
4.3 Tax analysis ......................................................................................... 31
5 CONSUMER AND SUPPLIER PERCEPTIONS OF FLEA MARKETS IN
VARKAUS ...................................................................................................... 35
5.1 Background information of the consumer respondents ........................ 35
5.2 Customers’ perception of flea market in Varkaus ................................. 40
5.3 Suppliers' perception of second hand shops.............................................48
6 CONCLUSIONS AND RECOMMENDATIONS ........................................... 57
REFEENCES....................................................................................................59
APPENDICE ................................................................................................... 61
Appendix 1. Consumer’s perception of Flea markets in Varkaus (For sup-
plier)

Appendix 2. Consumer’s perception of Flea markets in Varkaus (For cus-
tomers)
Appendix 3 MYYJÄ-ASIAKKAAN NÄKÖKULMA KIRPPUTOREISTA VARKAUDESSA
Appendix 4.OSTAJA-ASIAKKAAN NÄKÖKULMA KIRPPUTOREISTA VARKAUDES-
SA

FIGURES AND TABLES
List of figures
Figure 1. Types of Market ..................................................................14
Figure 2. Research Methodology…………………………………………19
Figure 3. Difference interest groups that need accountinginformation.............................................................................................23
Figure 4. Net income calculation table..................................................32
Figure 5. Respondents age groups................... ..................................36
Figure 6. Respondents gender..............................................................37
Figure 7. Respondents income variables.............. ...............................38
Figure 8. How many times respondents visit flea shops in a month.....38
Figure 9. Expectations of the respondents........................ ...................40
Figure 10. How the products from flea market are used........................41
Figure 11. Selection categories of the products.....................................42
Figure 12. Source of information about second hand shops..................43
Figure 13. Reasons for visiting second hand shop.................................44
Figure 14. Experience to rent a table......................................................45
Figure 15. Environmental consciousness................................................46
Figure 16. Thought of respondents towards big shops............................46
Figure 17 Age of suppliers.......................................................................47
Figure 18. Gender of suppliers................................................................48
Figure 19. Monthly incomes.....................................................................49

Figure 20. Number of visits in a month.....................................50
Figure 21. Expectations from flea shops...................................51
Figure 22. Sources of information about second hand shops....51
Figure 23. Sources of income....................................................52
Figure 24. Selection criteria for suppliers...................................53
Figure 25. Times of renting a table in a year..............................54
List of tables
Table 1. Analyzing general versus second hand shop ……….10
Table 2. Specimen of supplier account……………………………24
Table 3. Specimen of sales account……………………………….25
Table 4. Specimen of cash account………………………………..26
Table 5. Specimen of staff account…………………………………27
Images
Image 1. Promotional activity………………………………………..29

7
1 INTRODUCTION
1.1 Background of the study
Second hand shop is a place where people can find used merchandise
for their use. The materials that are sold in these shops have been used
by people once or more in the past. Second hand shops usually give
people an option to purchase products for their needs on the cheapest
price and also the opportunity to the owners to sell their old stuff with
some value. For a student of business, the business practice of these
second hand shops is a preferred field of research. This particular study
concentrates on the perception of customers, overall tax and accounting
system, and how the overall system works. The sample organization will
be Oranssi Kirppis located in Varkaus.
It was very common practice in human history that people used to ex-
change materials of daily use with each other. In the ancient time of civi-
lization, people just exchanged the stuff to fulfil their livelihood. On the
other hand, in modern age the economic status of people differs from
one to other. At this stage rich people start donating their used cloths
and other objects to the poor people. In this way the concept of using
second hand items gradually developed.
The modern concept of thrift shop has changed according to time and
need of the items. Nowadays, it has become a popular business all over
the world. The perception of people is changing day by day. People
want change in their livelihood; want new belongings to use and most
importantly they don’t want to use same belongings for very long time.
In this way the popularity of thrift shop is increasing continuously. The
prices of items in thrift shop are really very cheap compared to regular
retail shops. You can even bargain the price, so it is a good place for the
people who want to change or want to use branded stuff in cheap price.
(Parson, 2003)

8
1.2 Objective of the study
The aim of this study was to explore the daily business practice of thrift
shops. Of course there are quite many articles around the globe that talk
about this subject, but there are not so many in Finland. The other factor
of the study was to get knowledge of the small business concept and
mechanism of the overall operation.
This study aims to provide readers a complete concept of thrift shops;
how they are operating, how the materials are collected and who actual-
ly are involved in this business. This could help people to establish a
thrift shop or at least they can be an owner of a table inside the shop.
Definition of the research problem is: How Oranssi Kirppis in Varkaus is
organizing its business functions, for example customer relations, sup-
plier relations, marketing, accounting and management.
This research will provide information about customers and suppliers of
flea shops and their perceptions related to the items available in flea
shops. It will also provide the VAT and taxation information to the read-
ers.
1.3 Limitations of the study
There are over 1000 thrift shops all over Finland (Vuolanne 2012). Due
to time and resource limitations, it is difficult to take more than one sam-
ple organization. Only one sample flea shop had been chosen from
1000 shops all over Finland, which is the limitation of this study. The
time frame is also important to finalize the thesis, so the time frame of
the data collected is chosen to be between 1-2 months.
On the other hand, about 200 questionnaires were distributed; 100 for
the customers and 100 for the suppliers. The sampling of 200 copies

9
may not reflect the entire reality of this research topic; this could also be
the limitation of the study. Moreover, the trustiness of the respondent
can introduce some error in the whole research.

10
2 FLEA MARKETS
Going back to the history of human civilization, it can be seen that de-
velopment of business concept follows the development of human soci-
ety. It means that more people are civilised, and the business environ-
ment has become advanced and diverse.
The origin of flea market seems to be different according to the geo-
graphical variances. But it can be seen from the different sources avail-
able in internet that the concept came across the world during late 18th
or early 19th century. But still the exact time when the market started is
not well-understood. Chartwell wrote in his book “Flea Market in Europe”
about the history of flea market. According to him during the Napoleon’s
3rd time there was some kind of army march in the market place in
France forcing the owner to leave the place. After that incident all the
dealers who deal with the second hand merchandise flee from their
business area and gathered at a new place named flea market. On the
other hand, around 18th century the flea market concept was introduced
in the New York City of the United States according to the article availa-
ble at (www.aurorahistoryboutique.com,2009).
Basically flea market was the bazaar where people rented tables or
small places to sell their mostly used products. The products they sold
were cheap and the buyer and seller could also bargain about the price
till they came to a common value. Most commonly clothes, handicrafts,
old jewelleries and even food-products were merchandised on such
markets in the past.
How the second hand shops are helping our society.
- Second hand shops provide useful employment, support and
training for a range of volunteers.

11
- Second hand shops help to recycle unwanted household items;
and also helps people to recycle the unwanted or unused house-
hold items.
- Second hand shops also provide cheap and affordable cloths,
household items and other need items for customers.
- Second hand shops help lessen environment pollution.
2.1 Comparison of flea markets, and general markets.
It is useful to understand the difference between general retails shops
and flea shops. The comparison is presented in the Table 1.
Table 1. General versus second hand shop analyze. (Oranssi Kirppis
interviewed, 2012)
Feature Retail shops Flea shop(2nd hand shops)
Price - Very expensive
- Normally fixed price
- Very cheap compared to
retail shop
- Bargain price
Supplier/
Producer
- Multinational sup-
pliers or high vol-
ume supply chain.
- Local people, anyone
can be the suppliers.
Tax
- All legal taxes
should be paid in all
levels of activities .
- No need to pay sales
tax, only owner of the
shop should pay in-
come tax if he earns.
Competition
- Highly competitive
market.
- Need a lot of adver-
tising costs.
- Not very high competi-
tion due to cheap
stuffs.
- No advertisement ex-
penses.

12
Warranty
- Warranty of the
products available
- No warranty due to pri-
or use
Social Val-
ue
- People feel proud to
Buy expensive and
new products
- Some people don’t
Want to use the stuff
already used by others
Origin - The manufacturer - Retail shops
It can be seen from Table 1 that the flea products are much cheaper
than in normal retails shops. But if we go little deeper, all the products
come from the retail shops first and then to the flea shops. Flea shops
are only fulfilling a very small percentage of the demand of the markets.
In ecological aspect flea shops are very important in our society and al-
so the recycling expenses are decreased drastically.
2.2 Research on Flea market activities
John F. Sherry has done his research on the subject "A Sociocultural
analysis of the Midwestern American flea market”. It was published in
journal of consumer research in 1990.
Mr Sherry has written about the overview of the flea markets, consumer
behaviour and experiences of people and also sociocultural analysis. He
interviewed people to get to know the behaviour of the flea shop’s con-
sumers.
Niko Besnier (University of California, Los Angeles in 2003) wrote about
consumption and cosmopolitanism of the second hand shop in Tango.
He has written about the practice of second hand shop in Tango.
Oleg V. Pachenkov wrote in his article based on case study of flea mar-
ket, St. Petersburg about the “What Actually Do People Sell and Buy at
a Flea Market”? (Research project released at 2002-2003)

13
Mr Pachenkov concentrated on flea markets, consumption, everyday
economy, sustainability and also addressed the phenomenon of flea
market in the Soviet Union.
Richard Charles Goodall from university of London wrote a research for
his PHD degree in 2002 with the subject of “The Professionalization of
Charity Shops”. He concentrated on the organizing practice and cultural
identities of the charitable shops. His thesis question was “How the rap-
id professionalization of charity shops in the 1980 and 1990 was related
to the identification of a certain generation of charity shop head”.
Lawrence M. Lekhanya wrote on his master degree thesis in Durban
University of technology “Consumer perception of charity shops in Dur-
ban area” in 2006. The main objective of his study was to determine
consumer perceptions of charity shops in South Africa and the factors
influencing these perceptions.

14
2.3 Function of flea market
A market is the place where the sellers of particular goods or services
can meet with the potential buyers for those goods or services. So mar-
ket is the meeting point for the two stakeholders where they can ex-
change their need. The need of the seller can be counted as monetary
value and the need of the buyer can be counted as goods or services.
Due to the globalization effect the whole world is really shrinking as a
small market place. The goods or services from one part of the world
can be sold to the other part of the world with the help of computerized
e-market. The scenario of today’s market shows that a business deal
can be done by the use of internet, not physically being togeth-
er(Muhlbacher and Dahringer 1999 4-11)
The whole market is classified in different segments according to the
different variables such as Place, Time and Competition.
According to place it can be divided as
A Local market
B. National market
C. International market
According to time it can be further divided in
a. Very short period
b. Short period
c. Long period
d. Very long period
According to competition it can be divided in
a. imperfect competition
1. Monopoly
2. Duopoly
3. Oligopoly

15
4. Monopolistic competition
b. Perfect competition
In Figure 1. different types of markets are summarized.
Figure 1. Types of Market (kalyan.city-blogpost by Gaurav Akrani 2010)
2.4 Flea market system
Flea shops are very common around globe nowadays. But the evolution
of flea shop came from flea market where people used to buy or sell dif-
ferent products on the open places. Nowadays most of the flea shops
are indoors like the normal retail shops. The purposes of flea shops dif-
fer when they are situated in different geographical area and/or culture.
Most common ways of operating such a shop are to collect money for
some charity where the profit goes to the charity work e.g. Oxfam UK.
But it also has been practiced as a normal business. In the charity
16
shops the items are collected from different people for free. On the other
hand, normal flea shops are little different. The case company is not op-
erated by donated items rather it has outside suppliers. Below, the op-
erating models of the second had shops in Finland are explained.
(Pachenkov 2002-2003 6-15)
The most common system in second hand shops is conpared of three
different parties; supplier, middle man and customers.
A. Suppliers
Supplier refers to a vast meaning in business world. The people who
supply merchandise for the purpose of resale or re-production are called
suppliers. In the flea shops, the meaning is different.
The suppliers of the case company are the people who want to sell
their used items. The items could be clothes, furniture, ornaments, and
utensils and so on. The items are mostly used by the suppliers but in
some case supplier sell new product even not used at all. The main
purpose of people who rent the table could be to dump their product in a
useful way. Most of them think that they can get at least some value of
their used items.
The other flea shops, like FIDA in Finland or charity shops in other part
of the world, are operated by donated items. So in such kind of shops
the supplier’s role is different than in the case company. These kind of
shops collect items from people who want to donate items. Normally the
donor calls the shop for collection or even the donor brings items direct-
ly to the shop.
Oranssi Kirppis represents most of the flea shops, and has a little differ-
ent system about suppliers. It runs under the flea market’s principle, the

17
only difference is that the shop is indoors. Oranssi Kirppis has rented a
big place in Kaupakatu 42-44 Varkaus, where 90 small tables are
stalled. The suppliers contact Oranssi Kirppis for renting one or more
tables to place their belongings. After that suppliers will make the price
tag for their own products and keep them on the table that is rented.
They will get the full price of the product except they pay the rent to
Oranssi Kirppis. They even don’t need to pay any tax to their money be-
cause they have already paid tax when they bought the products from
the retail store. This way the suppliers get money from their items.
B. Owner (middleman)
Owner of the shop does not play a vital role in this business. The owner
just plays a middleman’s role in this kind of business. The main duties of
the owner are to take care of the tables that are rented by suppliers, col-
lect the money selling suppliers’ items and take care of business. They
don’t need to worry about the items coming in or going out. So it looks
very simple and easy for the owner of the business.
Oranssi Kirppis has rented a big place in Kauppakatu 42-44, Varkaus
and made 90 tables. If somebody wants to rent a table, company rents
and takes care of supplier’s items. Company collects money from cus-
tomers and finally gives money to the supplier after deducting rent.
So basically the role of such an owner is just taking care of stuff provid-
ed by suppliers. In clear words owner is the middle man between the
supplier and customers.

18
C. Customers
Customers are always the same, whether they are in normal store or
flea shop. The only difference for the customer is to get cheap items in
this kind of shop. People normally visit the shop without any definite list
of goods. They look different tables to match their necessity. So in this
sense it is different from normal store. In regular store you have a list to
buy or at least you have in your mind what to purchase but on the flea
shop people first visit and start to think what can be useful for them.
But in case of customers, they are the same customers visiting a normal
store. The ordinary local inhabitants are the customers of the shop. In
Oranssi Kirppis, the local inhabitants of Varkaus are the customers of
the company. Oranssi Kirppis has two kinds of customers, first the peo-
ple who regularly visit the shop and other who just pass by and enter the
shop out of curiosity.
The other customers of the shop could be the suppliers of the company.
During the data collection time and interviews with workers, it was found
out that the suppliers are also among the major customers of the com-
pany. The people who rent the table most often visit the shop, every
time of their visit they find some interesting items from other tables
which they buy. In this way suppliers are also good customers of the
company.

19
3 RSEARCH METHODOLOGY
Research methodology is the process of collecting data in a system-
atic way for a research project. It is a complete process of doing re-
search project where each and every step is defined. If we go to the
definition of word “research”, it means finding something new or
searching for knowledge. But it does not always mean that research
is searching or gathering information; research in fact can also an-
swer the unanswered questions till the date. So research also deals
with finding out hidden results or answers. The world today sees con-
tinuous research of different people all over the globe, if our ances-
tors had not researched for new things; we would have still in the
Stone Age. So we can image the importance of research(Ghuauri
and Grönhaug 2002, 25-35)
According to Clifford Woody “ Research comprises defining and re-
defining problems, formulating hypothesis or suggested solutions;
collecting, organizing and evaluating data; making deduction and
reaching conclusions; and at last carefully testing the conclusion to
determine whether they fit the formulating hypothesis.”
Research is basically an academic activity in which most of the col-
leges and universities engage students to find out something new
during their final stage of study. But research is also done by compa-
nies, government and nongovernment organizations. Research is
important for all the area of the study, even though it looks like only
scientific and medical researchers are important. Research in busi-
ness, social science, arts, music, and history are equally important to
make human life better. (Kothari 2004,1-2)

20
In Figure 2. the stages of the research methodology are shown.
Figure 2. Research Methodology (clientopinions.com, 2009)
In the above Figure 2 there are six steps how the real research work
is carried out. It starts with planning of the research to consultation
and review. This thesis process also followed the very similar re-
search methodology. The process started with subject analysis and
ends with conclusions and summary (clientopinions.com 2009)

21
3.1 Data collection techniques
Data collection is a very important part of any research project. The
reliability of the data plays a vital role in determining the result of the
research.
The types of research methods can be classified in different points of
view according to the subject area. But in this research the basic
types of research methods in general are explained;
A. Qualitative method
B. Quantitative method
C. Mixed method
Qualitative methods are the methods of collecting the data in the
depth by choosing a small number of respondents. Group discus-
sions, depth interviews are common examples of qualitative meth-
ods. On the other hand if the research needs a large number of
samples which involve real data (numbers), then it’s called quantita-
tive research. The numbers obtained by using a questionnaire, tele-
phone interview, or even random street sample selection can be the
example of quantitative research methods. In some cases the depth
of the research requires both qualitative and quantitative research
method hence it is called a mixed research method.
In the current case study, the primary date was collected by a ques-
tionnaire distributed to the suppliers and customers. Besides that,
depth interview was made with the employer and employees of the
company. So the thesis method uses a mixed research method. The
research basically concentrates on the perception of the people to-
wards second hand shops, for that a random selection of the people
was needed to get the primary data. That is the way the quantitative
method such as questionnaire is used. (Aaker ,2002)

22
3.2 Data analysis tools
Data analysis is the part where the whole research results come out,
so it is very important to use the right tools for the right results. There
are very many tools that can be used to analyze the collected data.
All the primary data was collected via questionnaires and interview
methods in this research work. For the analysis of those data excel
sheet was used to find out the result in depth. Figures and diagrams
were used to make the research clear enough for the readers. Pie
charts and tables were also used during the data analysis part of this
research work.

23
4 ORANSSI KIRPPIS OPERATION FUNCTIONS
4.1 Maintaining the accounts
According to American Accounting Association the meaning of account-
ing is “the purpose of identifying, measuring and communicating eco-
nomic information to permit informed judgments and decisions by users
of the information”
In simple definition accounting is the way of keeping the financial and
non-financial records in a systemic way. It provides an accurate record
to the owner, manager and related parties in the specific time period
where they can see all the transaction during that time. The data helps
the owner or manger to make decisions related to the company. So we
can say that it’s the language that communicates the economic infor-
mation to the related parties or stakeholders.(Koirala 2006, 4-8)
Here in the figure 3 the parties that need the accounting information or
the stakeholders of the accounting are presented. Basically the stake-
holders are divided into two parts, internal parties and external parties.
Internal parties indicate the stakeholders within the organization where-
as the external parties indicate the outsider for the company. (The cor-
porate Report, ASSC 1975)

24
Figure 3. Difference interest groups that need accounting information,
(The corporate Report, ASSC 1975)
Every business has its own way of keeping accounts. This research
summarizes the accounting system of Oranssi Kirppis but due to the
privacy of data received from the company, the summary is limited to
some extent.
Oranssi Kirppis has been engaging in this flea shop business since
2008. The business type is not very complicated in terms of accounting.
All the data are maintained in simple excel sheets.
Accountinginformation
Analysts
Public
Government
investorsCreditors
Employees
Lenders

25
A. Supplier account
Table 2. Specimen of supplier accounting system in Oranssi Kirppis
(Oranssi Kirppis database 2012)
Table
number
Last date
of
Tenancy
Next ten-
ant
Name
Next ten-
ancy
start date
How
Long
Mobile
No.
1 25.11.2012 Yogen 1.12.2012 2 weeks 0440…..
2
3
4
5
6
7
8
9 and so
on
As mentioned in the above table, it shows how Oranssi Krippis is keep-
ing its’ supplier account. It is very simple to understand and easy to
maintain the supplier account. It starts with the table numbers, right now
company has about 90 tables so the last number will continue till 90.
Secondly it has the last date of tenancy so that the worker can easily
see when the contract will be ending. The next column is the name of
the next tenant coming and after that we can see when the person will
be coming to put his stuff on specified table. The last item is his/her mo-
bile phone number so that if something changes the employee can in-
form him/her.

26
B. Sales account
Table 3. Specimen of the sales account system in Oranssi Kirppis
(Oranssi Kirppis database 2012)
Date Table no. Rent paid Total
sales
Cash
paid
Signature
1.12.2012 17 40
15.12.2012 135 135
31.12.2012 20 150 130
From the above table, it can be seen how Oranssi Kirppis is maintaining
sales accounts in a simple excel sheet. It is very easy to understand and
easy to keep the record. The sales account is made for the individual
person or individual table. The sales accounting in most second hand
shops like Oranssi Kirppis has different records than normal retails
shops. The money collected from sales does not belong to the owner of
the shop; in fact the company keeps the sales account on behalf of the
supplier. So it can be said that this is the account of the owner of the
table.
To make clear, it is explained in the above table where the owner of the
table 17 account is shown. When the owner rent the table such kind of
forms are kept in Oranssi Kirppis. The first column starts with the date
when the table was rented. The next is the number of table where the
owners’ stuff is kept. The third column records the rent payment by the
supplier. The next is the total sales till that date and next is the payment
of the money to the owner on that specific date. Lastly, the signature on
each and every transaction is recorded.
At the end of the contract the remaining rent is paid and rest money is
provided to the owner of table number 17.

27
C. Cash account.
Table 4. Specimen of the cash accounting system in Oranssi Kirppis
(Oranssi Kirppis 2012)
Date Per-
son
Particu-
lar
In Cash
regis-
ter+
In
Cash
regis-
ter-
Rent
+
Ren
t -
Differ-
ence
Ban
k
1.1.201
2
Peta rent from
table- 56 60,00 60,0
0
1.1.201
2
Peta rent from
table -18 38,00 38,0
0
1.1.201
2
Peta rent from
table -28 48,00 48,0
0
1.1.201
2
Peta rent from
table -71 52,00 52,0
0
1.1.201
2
Rent
Sum
146,00 146,0
0
-
From Table 4 cash specimen, it can be seen how Oranssi Kirppis is
keeping its cash accounting in a simple way. The first column consists
of the date, normally starting from the beginning of the month. In that
column, it is recorded how many activities are done on that particular
day. The second one shows that the person taking care of the money,
where the employee’s name is mentioned. The third column gives the
detail information about how much and which table the money came
from. Next 2 columns give the cash debit and cash credit. Next 2 col-
umns are rent collection debit and credit. After that the difference is
recorded, if there is some mistake, and finally when the money went to
the bank.

28
At the end of the day all the transactions from the whole day are sum-
marized. It will be balanced by crediting the cash that means the money
goes to cash account and debiting the rent means the money goes from
rent to cash.
D. Staff account
Table 5. Specimen of the staff Record system in Oranssi Kirppis
(Oranssi Kirppis 2012)
Date Employee
A
Employee
B
Employee
C
Extra
days
Visitor(extra)
1.11.2012
Mo
8:00- 2:30 10:00- 3:30 2:00- 5:30
2.11.2012
Ti
8:00- 2:30 10:00- 3:30 2:00- 5:30
3.11.2012
We
8:00- 2:30 10:00- 3:30 2:00- 5:30
4.11.2012
Th
8:00- 2:30 10:00- 3:30 2:00- 5:30
5.11.2012
Fr
8:00- 2:30 10:00- 3:30 2:00- 5:30
6.11.2012
Sat
free day B+C
7.11.2012
Sun
free day free day
It has been mentioned in the previous chapters that most of the second
hand shops are operated by volunteer workers. Oranssi Kirppis is also
using volunteer workers except one paid worker. The government agen-
cy pays workers’ basic pay for the work. In Finland employment office
pays the volunteer workers to keep them active.(Interviewed with Jarmo
Ihalainen Oranssi Kirppis 2012)

29
Oranssi Kirppis has kept the record of the employees as mentioned in
the above table 4. The first column has the date and the next columns
contain the timetables of the employees. On extra days employees who
have worked less in a particular week, will be working on that extra date.
The last visitor column records if somebody comes to help in some situ-
ation when the regular employee can’t come.
4.2 Maintaining marketing
P. Kotler explains that marketing is a social and managerial process by
which individuals and group obtain what they need and want through
creating and exchanging products and value with others. Marketing is
the process of creating the value of the product and hence it finally
builds a strong customer relationship.
In very simple and traditional concept, marketing is the process of sell-
ing goods or services. But today marketing is connected with customer
satisfaction. Marketing is not only to deal with the promotion of products
or services but also to create the demand of the product or services.
Today marketing plays a vital role in all business, it also determines the
success of any business. The quality is not everything if the people don’t
know about the product, so marketing is a good tool to make product
visible in the market. (Kotler 2001, 32-34)
P. Kotler explains that marketing is a social and managerial process by
which individuals and group obtain what they need and want through
creating and exchanging products and value with others. Marketing is
the process of creating the value of the product and hence it finally
builds a strong customer relationship.
Here it is summarized how Oranssi Kirppis (OK) is maintaining the mar-
keting part of the business.

30
A. Marketing concept
Marketing concepts of the business are already mentioned on 4.2.
Oranssi Kirppis is also focused on marketing activities hence all the em-
ployees give a high value to both the customers and suppliers. To cre-
ate the demand on people’s mind, OK has the outside windows made
from bigger glasses, in a way that customers can find something inter-
esting while watching inside through big windows. In that sense OK is
always concentrated on marketing activities even it has limited re-
sources.
B. Advertising and mass media
Second hand shops cannot invest in very big promotional as other regu-
lar retailer shops do. There are some Nation wide websites which pro-
vide the information about the second hand shops. (kirpputorihaku 2012
and Vuolanne 2012 )
Besides this, OK publishes advertisement in the local newspaper, like
Warkauden Lehti and Sinun Savo a couple of times a year .
Image 1. Promotional activities of Oranssi Kirppis (Oranssi Kirppis 2012)

31
C. Personal selling
Personal selling is the customer oriented method of marketing tools.
Bigger companies invests a large amount of money in personal selling.
Usually big deals are made through personal selling.
Oranssi Kirppis is doing a lot of business deals personally, especially
with the suppliers. A lot of deals are made between two parties, the
supplier and the employee of OK. Due to the high number of suppliers it
is very important for OK to maintain the personal relationship with sup-
pliers. Suppliers are the source of money for the business.
4.3 Tax analysis
Benjamin Franklin said that there is nothing more certain than taxes and
death. That means that the tax is subjected to anyone and anywhere in
the world hence tax is mandatory for all humans in this world.
If we go to the history of taxation, we found that people had to pay some
kind of levy to the king or the leader of the area. The levy could have
different forms, such as food, animals, metals and later money. There
were various tax systems according to different age in different coun-
tries in the history. United States was tax free country on its early history
but on the other hand Egypt, Greece, Roman Empire were introduced
tax on certain items in early history. It can be seen from the history that
when the country was in war tax was higher and vice-versa.
(forbes, 2010)
Tax is the source of income for the government to run the country. The
government should be responsible for social welfare, infrastructure de-

32
velopments, security and other emergency work where tax money is uti-
lized. In the current world all the people are mandatory to pay the tax.
There are different types of tax where governments get money, they are
- income tax
- sales tax
- capital gain tax
- corporate tax
- gift tax
- estate tax
- consumption tax etc.
There are still more taxes we can find if we go through all around globe
but basically income tax and sales tax are common for everybody.
(taxworld 2009 )
Tax analysis – Flea versus General marketsHere in this part, the comparison between the taxes on different level in
flea shops and normal shops is made.
Having looked at the tax system of second hand shop it can be seen
that it has a different tax system compared to any other normal shop. It
is obvious that the items available in second hand shops are used items
meaning that they are first bought from general shops, then used and
brought to the second hand shop.
When new items are bought the sales need to be paid tax according to
the products. If some clothes have been bought from retail shop 23 per-
centage of the tax need to be paid to the government and the same
items go to the second hand shops after they have been used by one or
more people. So The same clothes that the tax has already been paid at

33
the time of first purchase, do not need to pay tax even if it available in
second hand shops. Hence tax is subjected only to new items that is
why the flea items are tax free.(stott and Truman,2010,119-123)
Here in the thesis, how the tax imposed on second hand shop is being
described. Why flea shops are tax free shops for the people and so on.
Taxes of Oranssi Kirppis
As it has been mentioned above that the flea market is a tax benefited
shop. The real owner, the owner of the stuff, does not need to pay any
tax from their income to the government. Here in Oranssi Kirppis the
same rules are applied to the owner; owner means the person who
rents the table in OK. So the income they get after paying the rent is
their own money.
On the other hand what will the government get from this kind of a
shop? Of course the government should get the tax from the income if
the owner of the shops gets any. The Figure 4 shows how the govern-
ment gets the tax from the second hand shops.

34
Figure 4. Net income calculation table (Oranssi Kirppis 2012)
From the Figure 4 it can be seen that the collection of all table rent is the
gross income of the company. From that gross income if all expenses
will be deducted, the rest will be the net income of the company.
Total expenses = Room rent + electricity + stationary expenses + sala-
ries + all other small expenses.
So the tax will be subjected to the net income of the company. Suppos-
ing that the Oranssi Kirppis will get 2000 Euros as net income, it needs
to pay 26 % of 2000 as an income tax.
Net income total rent -totalexpensesn
rent from table 1
rent from table 1
rent from table 3
rent from table 4

35
5 CONSUMER PERCEPTIONS OF FLEA MARKETS IN VARKAUS
In this area, the perception of the consumers is analysed through the
questionnaire data collected from suppliers and consumers of second
hand shops. There were two sets of questionnaires, designed to get in-
formation from suppliers and customers of second hand shops. The
questionnaires were designed in an easy way so that more people could
fill them out. Hence it was possible to collect enough data from re-
spondents.
About the questionnaires
- 100 copies of questionnaires were distributed to customers where
76 were received but some of the answered were not answered
- 100 copies of questionnaires were distributed to the suppliers
where 63 answered were received.
- All the questionnaires were delivered to the Oranssi Kirppis in
September, October and November.
- The questionnaires were filled with the help of the employees of
oranssi kirppis to the customers and supplier.
5.1 Background information of the respondent
Questions about the background of the respondents were
- Age
- Gender
- Income
- Frequency of visiting flea markets

36
1 Age of the respondent
It is very important to find out what kind of people are interested in sec-
ond hand shops in response of age group. According to the respond-
ent’s data, the least percentage of people are more than 61 years, the
figure 5 shows that only 7 % of the respondents belong to age group
over 60 years of age.
On the other hand, 21-30 age group respondents place the number one
in visiting the second hand shop; 32 % of all the respondents belong to
that group. This data reflected that in this age, many are unemployed
and they want to change their goods most often. It is only possible to get
cheap stuff at second hand shops, so the visitors whose age 21-30 be-
long to this behaviours.
The respondents of 31-41 years of age group accounts for 26 %. It
looks like the middle aged people are also attracted to the second hand
shops. Similarly the third largest group comprised of 41-50 years of age
group accounts for 19 percentages. 16 % of the people who visit these
shops are of the age group 51-60.
Figure 5. Respondents’ age groups (n=74)
2. Gender of the respondents
24; 32 %
19; 26 %
14; 19 %
12; 16 %
5; 7 %
21-30
31-40
41-50
51-60
60 +

37
This study also studied the variation of the visitors of second hand
shops according to the sex. The collected data shows that the number
of female visitors is extremely higher than that of male visitors.
From the figure 6 it can be seen that 73 % of the respondents were fe-
male and only 27 % of the respondent were male. As it can be seen
from the data, it looks like female visitors are attracted to the second
hand shops.
In our society it is common that females are most likely to go for shop-
ping compared to male. This study also shows the same trend in second
hand shop. The perception of the female does not change even in sec-
ond hand shops.
Figure 6. Respondent gender (n=74)
3 Monthly income of respondents
The data related to the income level of people visiting second hand
shop was also collected. In this context it was learned that unemployed
Male ; 20; 27 %
Female; 54; 73%

38
people visit much more than people from other income categories. 35 %
of all the visitors belong to group of unemployed . The reason behind
this result is quite obvious because of the cheap items available in sec-
ond hand shops. Unemployed people don’t have much money to invest
in new items, rather they fulfill their desire by buying second hand items.
The next highest percentage falls on the income level 1000-2000 € lev-
els. 30 % of the respondents belong to this category. So middle class
people also visit second had shops to find goods for them.
Similarly 27 % of the respondent who have less than 1000 € and 8 % of
the visitors represent the salary level of more than 2000 € . The figure
shows that the higher the salary the lower the visits to the second hand
shop. In this case the perception of people is different depends on the
salary level.
Figue 7. Respondents’ income in a month (n=71)
4. Frequency of second hand shop visits
25; 35 %
19; 27 %
21; 30 %
6; 8 %
Unemployed
more 1000 €
1-2 thousands €
more than 2 thousand €

39
Figure 8. How many times respondents visit flea shops in a month
(n=73)
From the analysis of questionnaire it can be inferred that a large per-
centage of respondents visit the flea shops 6-9 times in a month. 31 %
of respondents said that they visited 6-9 times a month. From this data it
can be seen that people consider the flea shop like normal clothes
shops. 22 % of the respondent said they visit 10-15 times in a month
and that is almost every second day. There are 14 % respondents who
visit flea shops more than 16 times a month.
5.2 Customers’ perception of flea market in Varkaus
Schiffman and Kanuk (2000, 147) define the perception as “a complex
process by which people select, organise and interpret sensory stimula-
tion into a meaningful picture of the world”
From the above definition we can say that to find out the value of peo-
ple’s mind is not only difficult but also the diversification of the data from
the reality.
10; 14 %
16; 22 %
23; 31 %
14; 19 %
10; 14 %
1-2 times
3-5 times
6-9 times
10-15 times
more than 16 times

40
Here is a summary of the collected data, according to different variable
set while making questionnaire, is presented.
5 Expectation for flee shops
In this part of questionnaire it was aimed at finding out why people visit
flea shops. Four possible options for the products people usually buy
were considered. It was aimed to understand the Perception of people
towards the price, and quality of the goods.
Figure 9. Expectations of the Respondents (n=100)
From the analysis of the questionnaire, it is seen that most of the people
visit second hand shops to get good products in a cheap price. More
than 30 % of respondents think that they visit second hand shops hop-
ing to get good products in cheap price. But respondents also visit flea
shops to get some interesting products where about 18 % respondents
choose this answer. On the other hand about 14 % respondents visit
second hand shops to get old products. From this analysis it is observed
that people are conscious of price of the products, which is one of the
most important reasons to visit second hand shops. It does not matter
38; 38 %
30; 30 %
14; 14 %
18; 18 %
Good products
Cheap products
Old products
Interesting product

41
whether the products are used or not, but if the price is very cheap,
people are willing to buy them.
6. How do people use most of the products bought from a fleamarket?
In this part the behaviour of the people who buy items from second hand
shops is analysed. Three options for how they use the products bought
from flea shops were given, such as use like new, use some time and
throw away or sell them again. Very interesting behaviour of the people
is noticed in this respect. Most of the people say that they use it like a
new product. From this analysis we can say that second hand shops
also give people normal shop experiences. From the figure 10, it is seen
that almost 54 % of the people used them like new products. They don’t
find any difference between new products from normal shops and prod-
ucts from second hand shops; it is good information for the owner or
supplier of the second hand shops.
On the other hand about 29 % people just use the items a few times and
throw them away. Meaning that they don’t give them a big priority for
that kind of products. But about 17 % people buy the products; use them
and when they become tired of that they again sell the same items to
the second hand shops. This is a good way of recycling the products
again and again.

42
Figure 10. How the products from flea markets are used (n=79)
7 What type of products are mostly selected while visiting a fleashop?In this part of questionnaire, what people really want to buy from sec-
ond hand shops is examined. Four possible answers were given, the
result is as follows:
Figure 11. Categories of the products bought from second hand shops
(n=93)
43; 54 %23; 29 %
13; 17 %
Use like new products
Use couple of times andthrough away
Use couple of times andsell on flea market again.
26; 26 %
32; 32 %
35; 36 %
6; 6 %
Random selection
Clothing
Home articles
Furniture

43
From the above diagram it is known that majority of the people visit sec-
ond hand shops as home articles and clothing; in fact 68 % of the re-
spondents say that they visit for home articles and clothing. In that 36%
of the people visit for home articles and 32 % of the people go for cloth-
ing. This means people have already some plan to visit second hand
shops like the normal retail shops. Even if the availability of the product
is not sure in second hand shop, people visit such shop to find their de-
sired products. So the perception of people in this part shows that sec-
ond hand shop can replace big shops.
On the other hand 26 % of people just visit second hand shops hoping
that they could find some useful product for them. Those people ran-
domly visit the shops, see the items and can buy if they think the item
can be useful for them. A few respondents said that they visit second
hand shops to get furniture items, only 6 % of people belong to this
group.
8 How do you find this kind of shops?
The advertisements based questionnaires are analyzed in this section.
How do people find this shop, what could be the means of finding such
shops. Three possible options were presented to the respondents. This
analysis will help the owner of the second hand shop to focus on their
marketing parts.
44
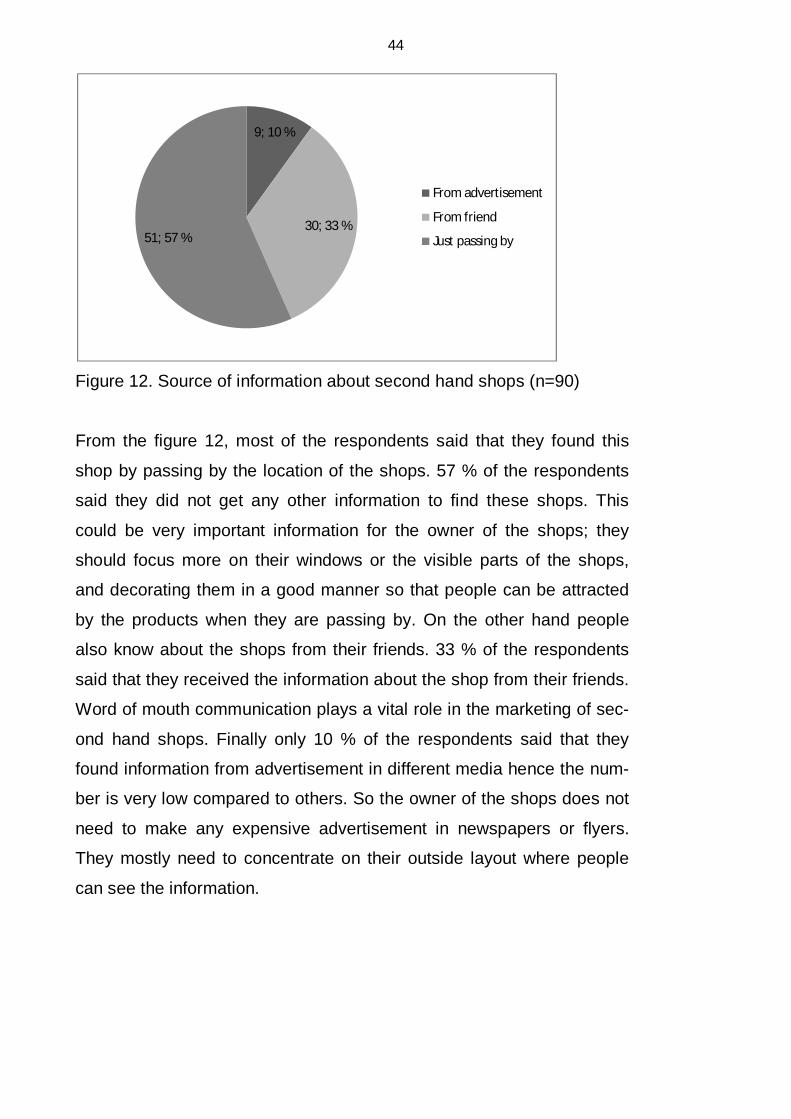
Figure 12. Source of information about second hand shops (n=90)
From the figure 12, most of the respondents said that they found this
shop by passing by the location of the shops. 57 % of the respondents
said they did not get any other information to find these shops. This
could be very important information for the owner of the shops; they
should focus more on their windows or the visible parts of the shops,
and decorating them in a good manner so that people can be attracted
by the products when they are passing by. On the other hand people
also know about the shops from their friends. 33 % of the respondents
said that they received the information about the shop from their friends.
Word of mouth communication plays a vital role in the marketing of sec-
ond hand shops. Finally only 10 % of the respondents said that they
found information from advertisement in different media hence the num-
ber is very low compared to others. So the owner of the shops does not
need to make any expensive advertisement in newspapers or flyers.
They mostly need to concentrate on their outside layout where people
can see the information.
9; 10 %
30; 33 %51; 57 %
From advertisement
From friend
Just passing by
45
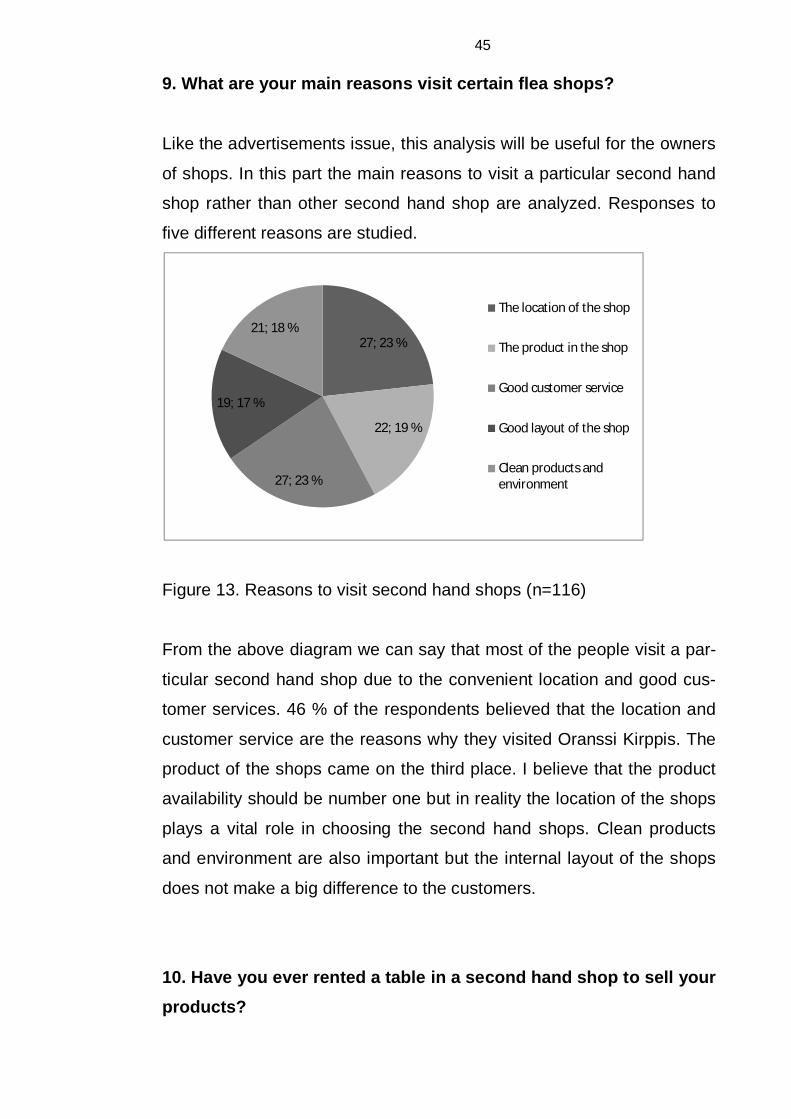
9. What are your main reasons visit certain flea shops?
Like the advertisements issue, this analysis will be useful for the owners
of shops. In this part the main reasons to visit a particular second hand
shop rather than other second hand shop are analyzed. Responses to
five different reasons are studied.
Figure 13. Reasons to visit second hand shops (n=116)
From the above diagram we can say that most of the people visit a par-
ticular second hand shop due to the convenient location and good cus-
tomer services. 46 % of the respondents believed that the location and
customer service are the reasons why they visited Oranssi Kirppis. The
product of the shops came on the third place. I believe that the product
availability should be number one but in reality the location of the shops
plays a vital role in choosing the second hand shops. Clean products
and environment are also important but the internal layout of the shops
does not make a big difference to the customers.
10. Have you ever rented a table in a second hand shop to sell yourproducts?
27; 23 %
22; 19 %
27; 23 %
19; 17 %
21; 18 %The location of the shop
The product in the shop
Good customer service
Good layout of the shop
Clean products andenvironment

46
Figure 14. Experience about renting a table (n=57)
In this part it is studied whether the visitors of second hand shop have
ever rented a table. It was learned that a big percentage of people who
visit second hand shops have rented a table at some stage. 74 % of the
respondents said that they have rented a table even when they were
customers of the shops. So customers are also the sellers of the prod-
ucts.
11 Do you think flea market is a good way for utilizing productsmore efficiently?
The questionnaire was made in such a way to find out whether or not
people are conscious about the recycling of the items to save environ-
ment.
Yes ; 42; 74 %
No; 15; 26 %
47
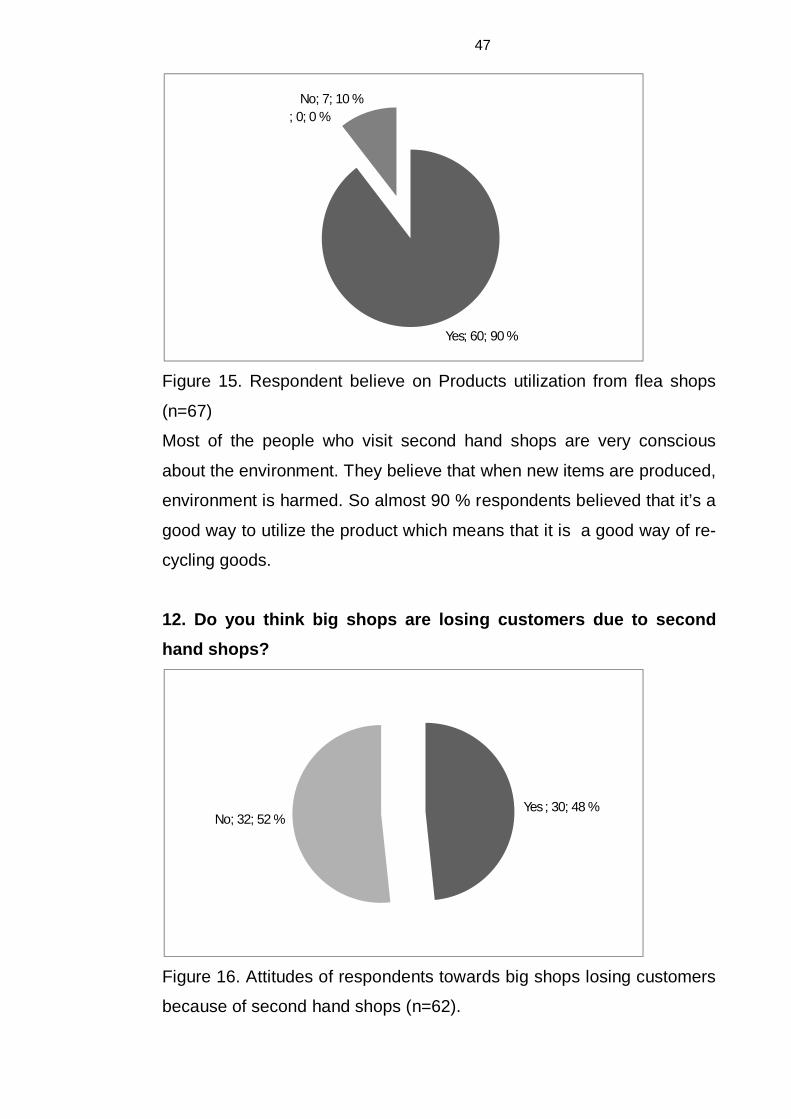
Figure 15. Respondent believe on Products utilization from flea shops
(n=67)
Most of the people who visit second hand shops are very conscious
about the environment. They believe that when new items are produced,
environment is harmed. So almost 90 % respondents believed that it’s a
good way to utilize the product which means that it is a good way of re-
cycling goods.
12. Do you think big shops are losing customers due to secondhand shops?
Figure 16. Attitudes of respondents towards big shops losing customers
because of second hand shops (n=62).
Yes; 60; 90 %
; 0; 0 %No; 7; 10 %
Yes ; 30; 48 %No; 32; 52 %

48
Respondents were confused about this. They could not specifically say
that second hand shops were hampering normal retails shops. People
are divided almost 50-50 %. It means half of the people believed that it
hampers the big shops and other half believed that it does not hamper
big shops. So no concrete conclusions could be made.
5.3 Suppliers’ perception of second hand shops
In this part, the perception of the supplier of the second hand shops is
analysed. The questionnaires were similar to those that were given to
the customers. So these questions are not repeated here. Only the re-
sults are presented.
1. Age variable
Figure 17. Age of suppliers (n=65)
From figure 17 it can be seen that about 38 % respondents belong to
the age group 41-50, so we can say that middle-aged people are more
interested in hiring a table for their products in second hand shops and
6; 9 %
13; 20 %
25; 38 %
14; 22 %
7; 11 %
21-30
31-40
41-50
51-60
60 +

49
also 22 % of the people who rent a table in second hand shops belong
to 51-60 age group. On the basis of these two examinations it can be
said older people were more interested in renting a table in second hand
shops.
2 Gender
Figure 18. Gender of suppliers (n=62)
From the figure 18 it can be seen that there are higher numbers of fe-
male suppliers in second hand shops. As we saw in customer’s analy-
sis, there are much more female visitors than male visitors, similar re-
sults appeared here in supplier side also. About 73 % of the suppliers
belong to females and the rest about 27 % of suppliers are males. From
this analysis it can be said that females are more interested in renting a
table.
Male; 17; 27 %
Female; 45; 73%
Male
Female

50
3 Monthly incomes
Figure 19. People belonging to monthly incomes (n=58)
What income level actually rent a table more often is studied in this sec-
tion. From the figure 19, it can be seen that 42 % of the people who
have income level 1-2 thousands Euros rented a table in flea shops it
means than the higher number of respondents who have income level
1-2 thousands in a month rent table in second hand shop. If we com-
pare the income level of the customers and suppliers, it is seen that un-
employed customers visit flea shops more frequently but middle-income
people rent the table more often. Similarly from the research it is also
seen that the second largest number of people who rent the tables be-
long to unemployed group. 32 % of the respondents belong to unem-
ployed people group, so we can say that unemployed people are also
attracted to flea shops to get some tax-free income. 15 % of the re-
spondents said that they belong to the income level less than 1000 eu-
ros and other 15 % were the respondents who earn more than 2000 Eu-
ros in a month.
12; 32 %
5; 13 %16; 42 %
5; 13 %
Unemployed
less than 1000 €
1-2 thousands €
more than 2 thousands €

51
4 How many times a month do you visit to flea shops
Figure 20. Number of visits to flea shops in a month (n=51)
In this part it’s examined how the supplier’s frequencies of visits to flea
shops take place. From the figure 20 it can be seen that almost half of
the respondents said that they visit only 3-5 times in a month. This is not
very high. But on the other hand 31 % of respondents visit 6-9 times in a
month.
From this analysis one can say that suppliers are also good customers
of the flea shops.
5 What do you expect from flee shops?
From this questionnaire, it is aimed at understanding the expectations of
the suppliers from the flea shops, especially why they rent the table in a
flea shop.
4; 8 %
23; 45 %16; 31 %
5; 10 %
3; 6 %
1-2 times
3-5 times
6-9 times
10-15 times
more than 16 times
52
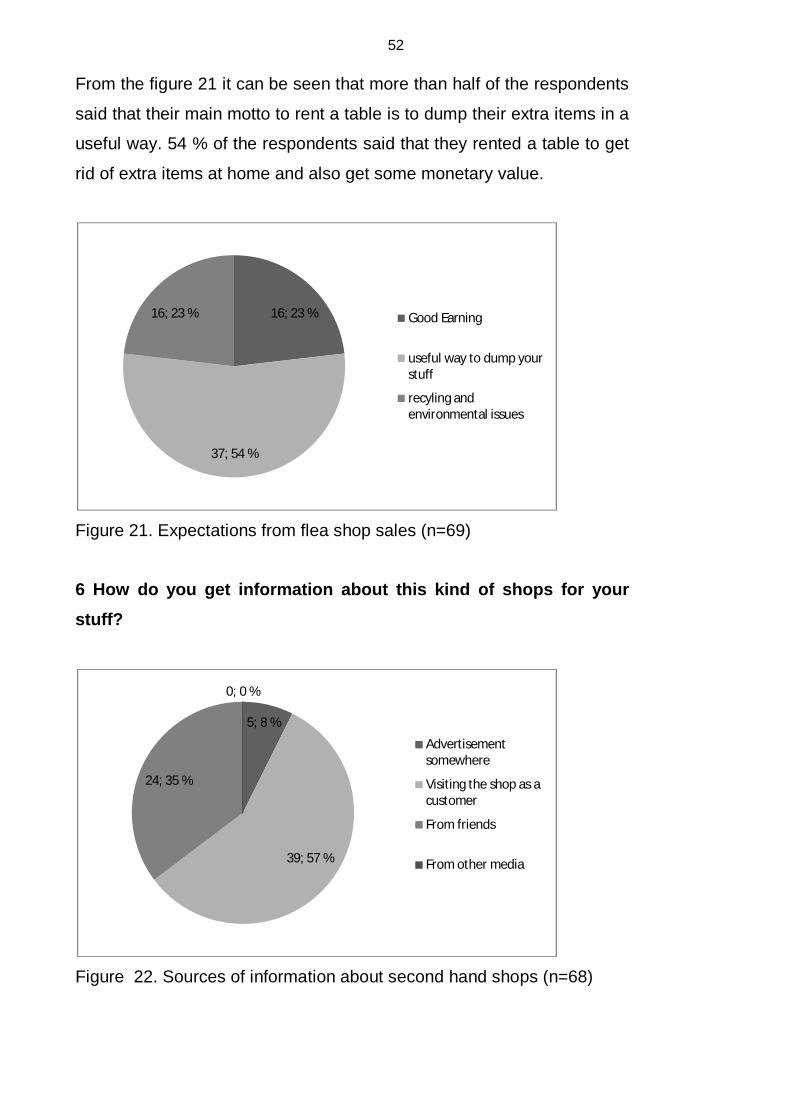
From the figure 21 it can be seen that more than half of the respondents
said that their main motto to rent a table is to dump their extra items in a
useful way. 54 % of the respondents said that they rented a table to get
rid of extra items at home and also get some monetary value.
Figure 21. Expectations from flea shop sales (n=69)
6 How do you get information about this kind of shops for yourstuff?
Figure 22. Sources of information about second hand shops (n=68)
16; 23 %
37; 54 %
16; 23 % Good Earning
useful way to dump yourstuff
recyling andenvironmental issues
5; 8 %
39; 57 %
24; 35 %
0; 0 %
Advertisementsomewhere
Visiting the shop as acustomer
From friends
From other media

53
From the figure 22 it can be seen that more than half of the respondents
said that they become interested when they visit flea shops as a cus-
tomers. 57 % of the respondents said that they found Oranssi Kirppis for
their items while visiting as customers. Other 35 % of the respondents
said that they found Oranssi Kirppis through their friends, so word of
mouth also play good role in flea shops.
There are 8 % of the respondents who said that they found Oranssi
Kirppis from advertisement. It shows that advertisement plays some
small role in attracting suppliers for second hand shops. On the other
hand none of the respondents said that they found Oranssi Kirppis from
other media, so it is probably worthless to advertise on other media so-
cial media like social media.
7 Do you think renting a table could be a good source of income?
Figure 23. Sources of Income (n=70)
From the Figure 23 it can be seen that 45 % of the respondents said
that renting a table could be a good source of money. From this analysis
it can be seen that many flea shops can provide a good source of in-
come for the people who rent tables.
yes ; 45; 64 %
No; 25; 36 %

54
8 What kind of stuff you mostly select for sale?
Figure 24. Selection criteria for suppliers (n=72)
From this analysis it is clear that most of the respondents’ criteria of the
stuff are that they chose them based on their household products. 57 %
of the respondents said that they rent the table in second hand shops
when they have a lot of extra stuff at home. But 40 % of respondents
said that they have collected some products for a long time and now
they want to empty their house by selling all of those items. On the other
hand 2 respondents said that they just collect stuff for renting table and
earning money.
9 Do you think flea shops are useful for utilizing things more effi-ciently?
29; 40 %
41; 57 %
2; 3 %
Specific products youcollect
products you have extraat home
product you collect forresale purpose

55
In this part of the questionnaire the respondents were asked to answer
about the effective utilization issue of used items. 45 respondents an-
swered that flea shops are a useful way to utilize items more efficiently.
This analysis shows that people want to use more items efficiently ra-
ther than throw away. On the other hand about 23 respondents said that
flea shops are not very useful at utilizing stuff more efficiently.
10 Do you think big shops are losing customers due to flea shops?
In this part the researcher wanted to know about the perception of re-
spondents towards the flea shops when compare with normal retails
shops. Respondents are asked if flea shops hamper the business of big
shops and 44 of the respondents answered that it will not make any dif-
ference to bigger shops but 19 respondents said it will hamper the big-
ger shops.
11. How many times in a year you rent a tables in flea shops?
Figure 25. Times of renting table in a year (n=63)
17; 27 %
23; 37 %
14; 22 %
7; 11 %
2; 3 %
1-2 times
3-5 times
6-9 times
10-15 times
more than 16 times

56
The above figure will help to analyze the frequency of the respondents
who rent the table in one year period. 37 % of the respondents said that
they rent 3-5 times in a year and 27 % of the respondents said that they
rented 1-2 times in a year. On the basis of this it can be said that the
same people do not rent table very many times in a year. The data rep-
resents the flow of the supplier in second hand shops, in fact not all the
time same supplier supply products for second hand shops.

57
6 CONCLUSIONS AND RECOMMENDATIONS
In this section the results of the analysis are presented and the question
that was set in the objective of this research is answered. The research
question was “How Oranssi Kirppis in Varkaus organizes its business
functions, for example, customer relations, supplier relations, marketing,
accounting and management”?
Flea markets are becoming a popular business nowadays around the
globe. People can get high quality products at a considerably lower
price although the products available in the flea shops have been used
by one or more people in the past. The research focused on the history
of flea market, the concept of flea shops and its operational mechanism.
The players behind the flea shops like suppliers, owner and consumers
and also the role and functions of each parties is analysed. The devel-
opment of operation functions was studied in the fifth part based on the
objective determined in the thesis plan. Accounting part includes the
supplier account, sales account, cash account and stuff account. The
marketing behaviours of the second hand shops is also analysed where
marketing concept, advertising and mass media and personal deals
were expanded. The research also gives a clear knowledge of the tax
system of flea shops where the answer for taxation of the business
based on tax free purchasing can be found.

58
Questionnaires were set to analyse the perception of customers and
suppliers based on age, gender and income level. From the data analy-
sis of customer questionnaires, it can be seen that largest number of
visitors in second hand shops belong to an age group of 21-30 and the
respondents’ analysis reflected that most of the visitors in second hand
shops were women. The income analysis of the respondent showed that
unemployed visitors visited the shop more often to other group of visi-
tors. A higher number of respondents said that their frequency of visit in
second hand shops accounted 6-9 times in a month. Most of the re-
spondents who visit as customers said that they visit second hand
shops to get good products at cheap price. Similarly most of the re-
spondents said that they used the products bought from second hand
shops like a new product. On the other hand most of the respondents
said that they mostly look for clothes and home articles while they visit
the second hand shops. Most of the respondents said that they find par-
ticular second hand shops from friends or just passing by the shop. Sim-
ilarly from this analysis it can be said that a higher number of visitors
were concerned about the customer services and location of the shops
that influenced the frequency of visitors.
On the other hand it can be seen in this study that suppliers’ play a key
role in second hand business. If suppliers supply verities of good items
for sales, more customers are attracted; consequently more and more
suppliers rent table and so on. From the analysis of suppliers’ question-
59
naire data it can be seen that most of the suppliers belong to age group
of 41-50 and most of them were female suppliers. 1000-2000 Euros in-
come level respondents comprise a higher percentage of the suppliers.
Similarly the data analysis reflected that suppliers’ main motto of renting
tables was to dump their extra items in a useful way. On the other hand
a higher number of respondents said that they got the information about
the possibility of renting tables when they visited as customers. It is also
concluded by this analysis that most of the respondents believe that
they got some income from renting the table in second hand shops.
Recommendations
The research can make some recommendations to the owner who in-
volved in the marketing part of the business. The questionnaires analy-
sis proved that it is not useful to publish advertisements about the busi-
ness in any media including social media and mass media. Most of the
respondents said that they knew about the shops by looking through the
window of the shops when they pass by and/or word of mouth. On the
other hand good customer service will enhance the business of second
hand shops.

60
REFERENCES
Published Sources:
Besnier Niko 2003
Consumption and cosmopolitanism of the second hand shop
in Tango University of California, Los Angeles in 2003, Mas-
ter Thesis
Sherry John F. 1990
A Sociocultural analysis of the Midwestern American flea
market”Journal of consumer research in 1990.
Pachenkov Oleg V. 2002-2003
“What Actually Do People Sell and Buy at a Flea Market”?
Research project realized at 2002-2003
Goodall Richard Charles 2002
The professinalization of charity shops.
university of London ,PHD degree in 2002
Lekhanya Lawrence M. 2006
Consumer perception of charity shops in Durban area.
Durban University of technology 2006, Master Thesis
Ghuauri Pervez N. and Grönhaug Kjell, 2002
Research Methods in Business Studies, 2002
Kothari C.R. 2004
Research methodology second edition

61
P. Kotler 2001
Principle of marketing fifth European edition
The corporate report , 1975
Accounting standards steering committee (ASSC)
Koirala K. D., 2006
Fundamental of marketing decision, M.K. Publishers.
Stott J.R. and Truman M. 2010
Basic Accounting, Teach Yourself Publication.
Muhlbacher H. and Dahringer L. 1999
International marketing, An international Thomason publishing
company
Internet sources
B. Mike 2009
Histor of flea market
(http://blog.aurorahistoryboutique.com/history-of-flea-
markets)
Client Options reviewed 2012
Research Methodology
(http://www.clientopinions.com/pages/11/Research-
Methodology/)Finnish Secondhand shops 2010
List of secondhand shops in Finland
http://www.vuolanne.net/kirpputorit/
Beattie Andrew 2010
A short history of tax
http://www.forbes.com/2010/04/14/tax-history-law-personal-
finance-tax-law-changes.html

62
Tax world
history of Taxation
http://www.taxworld.org/History/TaxHistory.htm
Jarmo Ihalainen 2013
Oranssi Kirppis
http://www.oranssikirppis.net/
Flea Market Valtteri 2007http://locatinghelsinki.wordpress.com/2007/09/25/kirpputori-
valtteri/Parson Liz, 2003
Charity shop managers in UK
http://keele.academia.edu/LizParsons/Papers/523016/Charit
y_shop_managers_in_the_UK_becoming_more_professiona
l
63
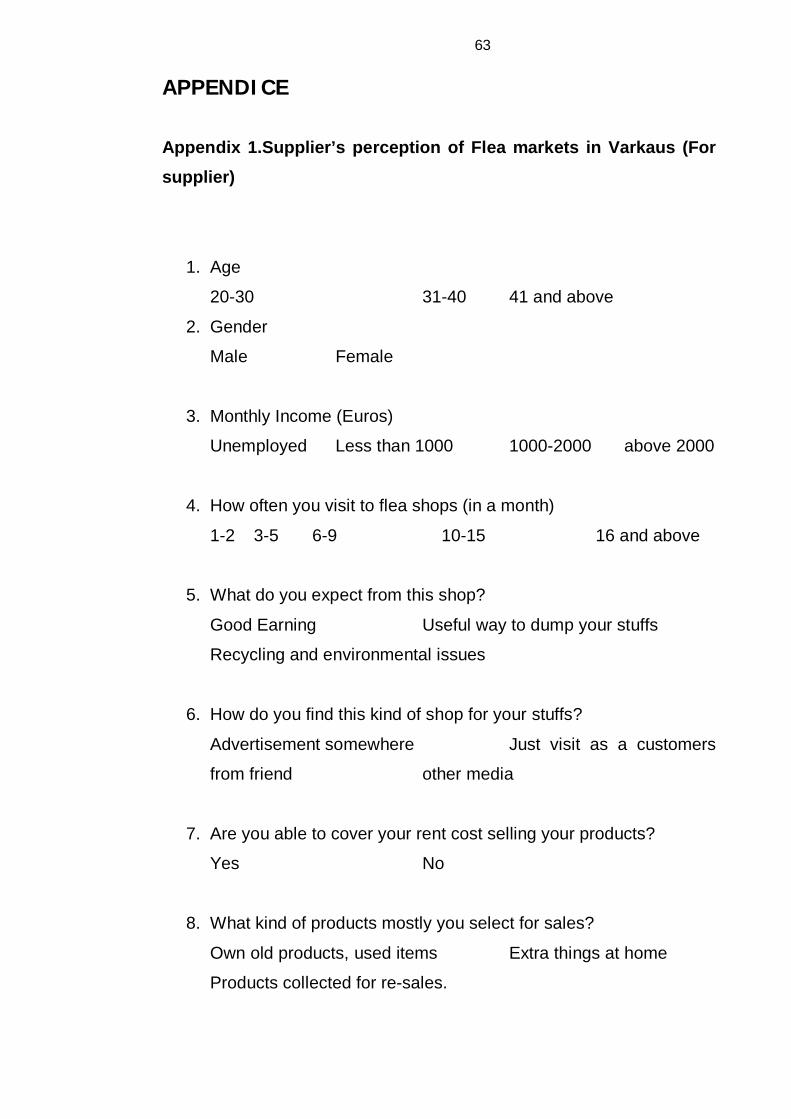
APPENDICE
Appendix 1.Supplier’s perception of Flea markets in Varkaus (Forsupplier)
1. Age
20-30 31-40 41 and above
2. Gender
Male Female
3. Monthly Income (Euros)
Unemployed Less than 1000 1000-2000 above 2000
4. How often you visit to flea shops (in a month)
1-2 3-5 6-9 10-15 16 and above
5. What do you expect from this shop?
Good Earning Useful way to dump your stuffs
Recycling and environmental issues
6. How do you find this kind of shop for your stuffs?
Advertisement somewhere Just visit as a customers
from friend other media
7. Are you able to cover your rent cost selling your products?
Yes No
8. What kind of products mostly you select for sales?
Own old products, used items Extra things at home
Products collected for re-sales.

64
9. Do you think is the good way for utilizing things more efficiently?
Yes No
10. Do you think the big companies are losing customers due to
this kind of shop?
Yes No
11. How often you rent the table on such shops? (Annually)
1-3 4-7 8-11 12 and above

65
Appendix 2. Consumer’s perception of Flea markets in Varkaus(For customers)
1. Age
20-30 31-40 41 and above
2. Gender
Male Female
3. Monthly Income(Euros)
Less than 1000 1000-2000 above 2000
4. How often you visit to flea shops (in a month)
3-5 6-10 11 and above
5. What do you expect from this shop?
Good products cheap products
Old products Interesting products
6. How do you use most of the products from flea market?
Use like new products use couple of times and through away
Use couple of times and sell to second hand shop
7. Have you ever rented any tables for your products?
Yes No

66
8. What kind of products mostly you select while you visit second
hand shop?
Random selection Cloths
Household products Furniture
9. What makes you choose a flea market?
Location products
customer service good layout clean products
10. Do you think is the good way for utilizing things more effi-
ciently?
Yes No
11. Do you think the big companies are losing customers due to
this kind of shop?
Yes No
12. How do you find this kind of shops?
From advertisements just to watch on road
From friend

67
Appendix 3 MYYJÄ-ASIAKKAAN NÄKÖKULMA KIRPPUTOREISTA VARKAU-
DESSA
1. Ikä21-30 31-40 41-50 51-60 61 yle
2. SukupuoliMies Nainen
3. Nettotulot / kk Alle 1000 € 1000- 2000 € yli 2000 €
4. Kuinka monta kertaa käyt kirpputorilla kuukaudessa?
1-2 kertaa 3-5 kertaa 6-9 kertaa 10-15 kertaa 16 use-
ammin
5. Mitä odotuksia sinulla on kirpputoreista?(ole hyvä ja valitse 2 vaihto ehtoa)
a. Hyvät tulotb. Kätevä tapa päästä eroon tavaroistac. Kierrätys ja ympäristöasiatd. Muu, mikä? __________________________________
6. Mistä saat tietoa kirpputoritoiminnasta? (ole hyvä ja valitse 2 vaihto ehtoa)
a. Mainoksista
b. Asiakkaana olemisesta
c. Ystäviltä
d. Mediasta
e. Muualta, mistä? ________________________________
7. Uskotko pöytävuokrauksen olevan hyvä tulonlähde?
Kyllä Ei
8. Millaisia tuotteita yleensä valitset myyntiin?
a. Omia keräämiäsi tuotteita
b. Ylimääräiset tavarat kotoa
c. Tuotteita, joita keräät myytäväksi

68
d. Muuta, mitä? __________________________________
9. Onko kirpputori mielestäsi hyvä tapa realisoida tavaroita?
Kyllä Ei
10. Menettävätkö mielestäsi isot kaupat asiakkaita kirpputorien vuoksi?
Kyllä Ei
11. Kuinka monta kertaa vuodessa vuokraat pöydän?
1-2 kertaa 3-5 kertaa 6-9 kertaa 10-15 kertaa 16 useam-
min

69
Appendix 4. STAJA-ASIAKKAAN NÄKÖKULMA KIRPPUTOREISTA VARKAU-
DESSA
1. Ikä21-30 31-40 41-50 51-60 61 yle
2. SukupuoliMies Nainen
3. Nettotulot / kk Alle 1000 € 1000- 2000 € yli 2000 €
4. Kuinka monta kertaa käyt kirpputorilla kuukaudessa?
1-2 kertaa 3-5 kertaa 6-9 kertaa 10-15 kertaa 16 use-
ammin
5. Mitä odotat kirpputorilta? (ole hyvä ja valitse 2 vaihto ehtoa)
a. Hyviä tuotteita
b. Halpoja tuotteita
c. Vanhoja tuotteita
d. Mielenkiintoisia tuotteita
e. Muuta, mitä?
_________________________________________________
6. Kuinka käytät ostamiasi tuotteita? (ole hyvä ja valitse 2 vaihto ehtoa)
a. Kuin ne olisivat uusia
b. Käytät pari kertaa ja heität pois
c. Käytät pari kertaa ja myyt uudelleen kirpputorilla
d. Muuten, miten?
_______________________________________________
7. Minkälaisia tuotteita valitset kirpputorilta? (ole hyvä ja valitse 2 vaihto ehtoa)
a. Satunnaisia tuotteita
b. Vaatteita
c. Tuotteita kotiin
d. Huonekaluja
e. Muuta, mitä?
________________________________________________

70
8. Kuinka löydät kirpputorit? (ole hyvä ja valitse 2 vaihto ehtoa)
a. Mainosten avulla
b. Ystävien suosituksesta
c. Liikkumalla kaupungilla
d. Muuten, miten?
______________________________________________
9. Mikä saa sinut valitsemaan tietyn kirpputorin? (ole hyvä ja valitse 2 vaihto ehtoa)
a. Sijainti
b. Tuotteet
c. Hyvä asiakaspalvelu
d. Hyvä esillepano
e. Puhtaat tuotteet ja ympäristö
f. Muu, mikä?
_________________________________________________
10. Oletko koskaan vuokrannut myyntipöytää kirpputorilta?
Kyllä Ei
11. Onko kirpputori mielestäsi hyvä tapa realisoida tavaroita?
Kyllä Ei
12. Menettävätkö mielestäsi isot kaupat asiakkaita kirpputorien vuoksi?
Kyllä Ei