Embed Size (px)
Citation preview

The effect of grading on the performance of basecourse aggregate
August 2007 Land Transport New Zealand Research Report 325

The effect of grading on the performance of basecourse aggregate Dr Greg Arnold Pavespec Ltd Dr Sabine Werkmeister University of Canterbury David Alabaster Transit New Zealand
Land Transport New Zealand Research Report 325

ISBN 0–478–28737–2
ISSN 1177–0600
© 2007, Land Transport New Zealand
PO Box 2840, Waterloo Quay, Wellington 6011, New Zealand
Telephone + 64 4 931 8700; Facsimile + 64 4 931 8701
Email: [email protected]
Website: www.landtransport.govt.nz
Arnold, G., Werkmeister, S., and Alabaster, D. 2007. The effect of grading on
the performance of basecourse aggregate. Land Transport New Zealand
Research Report 325. 51 pp.
1 Pavespec Ltd, 26 Copeland Street, Lower Hutt 2 University of Canterbury, Private Bag 4800, Christchurch 8020 3 Transit New Zealand, PO Box 1479, Christchurch
Keywords: aggregates, basecourse, deformation, grading, particle size
distribution, performance specifications for aggregate, permanent
deformation, recycled materials, repeated load triaxial, rutting.

An important note for the reader Land Transport New Zealand is a Crown entity established under the Land Transport New Zealand Amendment Act 2004. The objective of Land Transport New Zealand is to allocate resources in a way that contributes to an integrated, safe, responsive and sustainable land transport system. Each year, Land Transport New Zealand invests a portion of its funds on research that contributes to this objective.
The research detailed in this report was commissioned by Land Transport New Zealand.
While this report is believed to be correct at the time of its preparation, Land Transport New Zealand, and its employees and agents involved in its preparation and publication, cannot accept any liability for its contents or for any consequences arising from its use. People using the contents of the document, whether directly or indirectly, should apply and rely on their own skill and judgement. They should not rely on its contents in isolation from other sources of advice and information. If necessary, they should seek appropriate legal or other expert advice in relation to their own circumstances, and to the use of this report.
The material contained in this report is the output of research and should not be construed in any way as policy adopted by Land Transport New Zealand but may be used in the formulation of future policy.

Acknowledgements
The authors are grateful to Transit New Zealand (particularly the staff at CAPTIF) and
the staff and students at the University of Canterbury for their continued support.
Abbreviations and acronyms
CAPTIF Canterbury Accelerated Pavement Testing Facility
DGABC Dense-graded aggregate basecourse
ESA Equivalent standard axle
MDD Maximum dry density
NJDOT New Jersey Department of Transport
OMC Optimum moisture content
PSD Particle size distribution
RLT Repeated load triaxial
RLTT Repeated load triaxial testing
UGMs Unbound granular materials

5
Contents
Executive summary ................................................................................................7
Abstract..................................................................................................................9
1. Introduction ................................................................................................ 11
2. Literature review ......................................................................................... 12 2.1 Introduction .......................................................................................... 12 2.2 History.................................................................................................. 12 2.3 Theory.................................................................................................. 12 2.4 International specifications ...................................................................... 14 2.5 Effect of grading on aggregate permanent deformation ................................ 16 2.6 Physical properties of aggregate particles................................................... 23 2.7 Summary of literature review................................................................... 25
3. Repeated load triaxial study......................................................................... 26 3.1 Introduction .......................................................................................... 26 3.2 Aggregates and grading ranges tested....................................................... 28 3.3 Vibrating hammer compaction tests .......................................................... 29 3.4 RLT results ............................................................................................ 29 3.5 Rut depth predictions.............................................................................. 36
4. Specifying grading envelopes for RLT tests .................................................. 41
5. Conclusions.................................................................................................. 46
6. Recommendations........................................................................................ 48
7. References................................................................................................... 49

6

7
Executive summary
This research project included a literature review, repeated load triaxial (RLT) tests and
rut depth modelling to predict the rutting performance primarily for one basecourse
aggregate at different gradings. Limited RLT results for another aggregate were added to
supplement the results of the main test. The objective was to determine the extent to
which the grading could be changed without affecting the rut depth performance found
from RLT testing. Based on this knowledge, grading envelopes were established around
the gradings of samples tested in the RLT apparatus where gradings within this envelope
would give similar results in the RLT test. The grading envelope found from this project is
very tight and it is likely that a wider grading envelope would be required for
specifications. Wider grading envelopes can be established by quarry owners by
undertaking several RLT tests to cover the full range of gradings expected to occur when
developing an alternative in TNZ M/4. From a literature review and RLT test the following
conclusions were found:
• Talbot’s exponent n-value was a convenient way to describe the grading of an
aggregate, where n-values >0.5 are a coarse grading while n-values <0.5 are
considered fine.
• Current Transit New Zealand specification for basecourse aggregate has a Talbot’s n-
value varying from 0.4 to 0.6, while the majority of overseas roading authorities allow
finer gradings with a Talbot’s n-value of 0.3 to 0.6.
• Previous research has revealed that fine gradings have a lower strength when wet
compared with coarse gradings, while the opposite is the case when dry and/or when
a modifier like cement is added (ie fine gradings are best).
• The literature reported that finer gradings could be constructed with less segregation
and lower total voids to minimise any further densification after opening a pavement
to traffic.
• Vibrating hammer compaction tests for determining target densities for RLT testing
indicated that the highest density occurred with an n-value of around 0.5 which is the
same as the theoretical maximum density curve.
• RLT testing on a TNZ M/4 basecourse from Pounds Road, Christchurch at gradings
with Talbot’s n-values of 0.3, 0.4, 0.55 and 0.8 showed that the best performance
(least rutting) in wet conditions was obtained with the coarse grading with an n-value
of 0.8. The best performance in dry test conditions was obtained at a finer grading
with an n-value of 0.3.

THE EFFECT OF GRADING ON THE PERFORMANCE OF BASECOURSE AGGREGATE
8
0
5
10
15
20
25
30
35
40
45
50
0 0.1 0.2 0.3 0.4 0.5 0.6 0.7 0.8 0.9
Talbot Grading Exponent, n
Whe
el P
asse
s N
(Mill
ion
ES
As)
to A
chie
ve
10m
m R
ut in
Agg
rega
te
Material 1 (Wet)
Material 1 (Dry)
Material 7+ 15% fines (Dry)
Material 7 (Wet)
Figure E1. Effect of Talbot grading exponent n (equation 1) on rutting performance for materials #1 and #7.
• The RLT test results showed that Talbot’s n-values can vary by ±13% without greatly
affecting the resulting rutting performance.
• Based on varying the n-value by ±13% and limiting the amount of fines new grading
envelopes were recommended. These grading envelopes are about half the variation
allowed for in the TNZ M/4 and RTA NSW 3051 specifications.
The result from this research project was a grading envelope around the grading of a
material tested in the RLT apparatus where the results from the RLT tests and resultant
rut depth prediction were nearly the same. This grading envelope can be used for
establishing RLT testing criteria for determining grading envelopes suitable for production
control for alternative materials approved for use as TNZ M/4 RLT regional variants.
Table E1. Recommended grading envelope variations around a measured particle size distribution (PSD) for the RLT sample.
Sieve sizes Acceptable variation around measured particle size distribution (PSD).
%
37.50 -
19.00 ± 5
9.50 ± 5
4.75 ± 4
2.36 ± 3
1.18 the > of ± 14% of the measured PSD or ± 2
0.600 the > of ± 14% of the measured PSD or ± 1
0.300 the > of ± 14% of the measured PSD or ± 1
0.150 the > of ± 14% of the measured PSD or ± 1
0.075 the > of ± 14% of the measured PSD or ± 1
Table E1 shows two methods for calculating the envelope around the fine fraction. The
first is ± 14% of the measured PSD and is suitable when the fine fraction is greater than
20 to 30% as the variation in grading is 2.8% and 4.2% respectively, which is a relatively

Executive summary
9
small variation around an already large quantity of fines. The second approach is limiting
the grading envelope of the fines to an absolute value of ± 2% or ± 1% which is suitable
for coarse materials where the fine fraction is less than 5% to nil. This is because
performance is not affected by changes in fines of ± 1 or 2%, while keeping with a
percentage variation around the PSD would result in an envelope of ± 0.3% which is
unnecessarily tight, hence the smallest envelope is limited to ± 1%.
This research was based on limited testing by varying only the grading envelope while the
plasticity of fines, shape control, moisture content and density would also have a large
influence on RLT performance. Further testing would be required to consider the effect of
these and in particular to establish more parameters around the quantity and quality
(type) of fines.
Abstract
A laboratory study was undertaken to determine the effect of grading/particle size
distribution on permanent deformation in multi-stage repeated load triaxial (RLT) tests.
Results showed the coarse gradings with a Talbot’s exponent n-value of 0.8 had the least
amount of permanent deformation for high-moisture contents near saturation. Finer
gradings with an n-value of 0.3 had the least deformation in all of the tests in dry
conditions at less than 70% of optimum moisture content. Similar performance in terms
of permanent deformation was obtained if variations of the n-value were less than 13%.
Based on limiting the variations in n-value to ±13% new grading envelopes for use in the
new Transit New Zealand specification for RLT testing were proposed.

10

1. Introduction
11
1. Introduction
Transit New Zealand has recently undertaken a research project, Performance Tests for
Road Aggregates and Alternative Materials, funded by Land Transport New Zealand. The
objective was to develop a practical repeated load triaxial (RLT) test that will enable
pavement materials to be categorised according to their suitability as base materials for
high, medium or low traffic situations in either dry or saturated conditions. This will
ensure that pavement design life can be met; a range of materials including marginal
materials (previously discarded) can be used in appropriate locations (ie low traffic and
dry environments); and alternative materials (eg industrial by-products such as melter
slag) and waste materials (eg glass, recycled crushed concrete) can be assessed and
used appropriately according to their level of rut resistance in wet and dry conditions.
This project has undertaken RLT tests on six different aggregate sources in New
Zealand known to provide poor, average and good performance. As a result of these
RLT tests, the aggregates will be boxed into various categories of low, medium and high
traffic for both wet and dry conditions. Results of this categorisation will be compared
with actual performance on the road (based on local knowledge) and at the Canterbury
Accelerated Pavement Testing Facility (CAPTIF) to validate and refine the method of
performance assessment.
To enable a base material that had passed the proposed RLT test method to be used in
road construction a grading envelope was required to allow for material variations in the
field while not compromising performance/rut resistance. It was not known to what extent
slight grading variations in material used in the field compared with that used in the RLT
apparatus would affect performance/rut resistance. There was a risk of early rutting
failure due to the material delivered on site having a different grading from the one tested
and approved for use in the RLT apparatus. Tests at a range of gradings expected to
occur in the field needed to be conducted. The number of tests would depend on what
could be practically controlled in production and the grading envelopes that could be
established around one RLT test result from the above research project.
The project discussed in this report was undertaken to repeat the RLT tests conducted on
two aggregates in the Performance Tests for Road Aggregates and Alternative Materials
project at two gradings either side of the one originally tested. The objective was to
determine the maximum variation in grading where changes in strength/rut resistance
would still be acceptable for the material’s classified use. Results in terms of predicted rut
depth were determined and compared with the original grading. Interpolation was used to
determine the grading boundary where the material would still be acceptable for use,
either in low, medium or high traffic in wet or dry conditions. A methodology for
determining the grading limit boundaries was determined as a result of this research and
included in the material specification.

THE EFFECT OF GRADING ON THE PERFORMANCE OF BASECOURSE AGGREGATE
12
2. Literature review
2.1 Introduction
A literature search was undertaken, using the resources of the Engineering Library at the
University of Canterbury, on the effect of aggregate grading on performance/rutting as
measured in road trials and/or the laboratory. The internet and overseas contacts were also
used to determine aggregate grading envelopes used throughout the world for basecourse.
2.2 History
The Romans can be considered as pioneers in road construction. They established a vast
network of roads throughout Europe primarily for military purposes. The layout seldom
varied; two trenches were dug 5 m apart to act as drainage ditches and the soil between was
excavated down to a firm foundation on which a multilayer granular base was laid using
materials locally available (Croney and Croney 1991). The thickness of pavement was
modified to take account of the strength of the soil foundation. In most cases the pavements
built by Romans in other parts of Europe were surfaced with flat quarried stone to maintain
the common appearance familiar to visitors from Rome.
After the Romans, roads were needed to transport surplus crops to barter with other villages.
This led to the development of small market towns surrounded by satellite village
communities. Long-distance coach travel became important with the growing wealth of the
17th and 18th centuries. This necessitated more permanent roads between towns. Roads
were either a bed of comparatively large pitched stone with dry fines added to fill the gaps,
as preferred by Thomas Telford, or were constructed with smaller angular material watered
to assist granular interlock, as preferred by John Louden Macadam (Lay 1984).
The modern pavement of today is derived from macadam with a base of small angular rock
material (granular) with a uniform grading overlying the soil foundation. But it is unlike
macadam as it is often surfaced with a smooth waterproof bituminous layer. In New Zealand
the surfacing is thin, so that the granular material with a uniform grading (a range of
aggregate sizes from large to small in the right proportions to form a tightly packed dense
material) in the base layer provides the necessary structural strength and resistance to
shear/rutting failures from wheel loads.
2.3 Theory
Grading or gradation is the particle size distribution of the soil/aggregate or granular
material. A dense grading is one in which each set of particle sizes fits snugly into the space
left between the particles of the next largest size. A uniformly graded aggregate is one with a
predominance of single-sized particles like stones used in chip seals. Gap or skip-graded
aggregates have at least one size range of particles missing. An open-graded mix is one that
contains only small amounts of fine aggregate. A dense grading is generally targeted by

2. Literature review
13
most road controlling authorities for aggregate base materials due to its strength and
stability from interlocking particles and fewer voids. Having fewer voids means less further
densification can occur. In addition to a dense grading the aggregate sizes need to be
derived from crushing to enable a strong interlock with the angular/crushed faces. Rounded
stones do not interlock and will quickly deform under a wheel.
To ensure a dense grading, road controlling authorities specify grading envelope curves in
their aggregate base specifications. Particle size distribution curves or grading curves are
produced by plotting particle diameter in millimetres on a negative log scale against the
percentage by mass of material smaller than the diameter. Following this definition the
particle size distribution is expressed by Talbot’s grading curve represented by the value of
the exponent n in equation 1.
n
Ddp ⎟⎠⎞
⎜⎝⎛=100 Equation 1
Where p = percent passing sieve size d
D = maximum particle size and
n is an integer which commonly has a range between 0.3 (fine grading) and 0.6
(coarse grading).
In most specifications n is found to be between 0.3 (fine grading) and 0.5 (coarse grading)
with values of 0.45 to 0.5 indicating better compactibility (Lay 1984). However, an
experienced New Zealand engineer (Bartley 2007) is of the opinion that better compactibility
is achieved with n-values of 0.35 as the fine-graded materials can pack down more readily to
form a dense grading. A grading with n = 0.5 is historically known as Fuller’s maximum
density curve, although the actual maximum density may occur at n-values less than 0.5 for
some aggregates. Aggregates containing mainly coarse particles have a low n-value,
commonly known as coarse graded. Coarse-graded aggregates are difficult to handle,
compact and unable to achieve their potential strength. However, coarse-graded aggregates
from crushed rock of high crushing strength, if compacted properly, can result in strong
interlock due to stone-on-stone contact and as they are lacking in fines they are permeable
and less susceptible to failure caused by water.
A material with excessive small particles (low n) that are plastic clay materials will have low
strength, be very sensitive to moisture and will have a surface which is slippery when wet,
and dusty when dry. However, it will be easy to handle and compact as well as impermeable.
It is common to add fine material (fines) from crushing or other rock sources that are non
plastic and thus not sensitive to moisture to crushed stone in order to meet grading
requirements and permit easier compaction.
Another important factor in aggregate gradings is the coefficient of uniformity of soil
(Krebs and Walker 1971, cited in Lay 1984). This is defined as d60/d10 where dn is the
diameter at which n% by mass of the soil is passed during sieving. A value of about 5 is
the border between a good and bad grading. However, this measure was reported by the

THE EFFECT OF GRADING ON THE PERFORMANCE OF BASECOURSE AGGREGATE
14
authors (Krebs and Walker 1971, cited in Lay 1984) as not always ‘full-proof’ as a gap-
graded mix can have a deceptively good coefficient of uniformity. The d10 diameter fraction
has a major influence on permeability, cohesion and moisture sensitivity. A large amount
of fines when wet can become a lubricant between the larger crushed stones and reduce
the shear strength of the material.
2.4 International specifications
A range of unbound road aggregates base specifications used on major highways throughout
the developed world were reviewed. Relevant specifications were found from the following
countries: Germany (ZTVT-StB 95) (Bundesministerium für Verkehr 1995); Sweden; South
Africa’s G3 aggregate (COLTO 1989); Canada (City of Winnipeg 2006); State of Victoria,
Australia (VicRoads 1998); South Australia – class 3 quarried pavement material (Transport
SA 2007); Western Australia (City of Geraldton 2004); Sub-base specification, United
Kingdom (Highways Agency 2004); Chile; and Finland. The upper and lower grading
envelopes are plotted in Figures 2.1 and 2.2.
Upper Grading Limits
0
10
20
30
40
50
60
70
80
90
100
0.01 0.1 1 10 100
Sieve Size (mm)
% P
assi
ng
New Zealand - TNZ M/4FinnlandSouth AustraliaGermanySwedenNSW, AustraliaChileAustralia-VictoriaSouth AfricaCanada -WinnepegWestern AustraliaUK - 805 material
Figure 2.1 Upper grading limits for basecourse aggregate specifications.

2. Literature review
15
Lower Grading Limits
0
10
20
30
40
50
60
70
80
90
100
0.01 0.1 1 10 100
Sieve Size (mm)
% P
assi
ng
New Zealand - TNZ M/4FinnlandSouth AustraliaGermanySwedenNSW, AustraliaChileAustralia-VictoriaSouth AfricaCanada -WinnepegWestern AustraliaUK - 805 materials
Figure 2.2 Lower grading limits for basecourse aggregate specifications.
Talbot’s exponent n (equation 1) was estimated for the various aggregate gradings
throughout the world and these are summarised in Table 2.1. This shows the New Zealand
TNZ M/4 basecourse has an n-value ranging from 0.4 to 0.6 while the other gradings
generally fall between 0.3 and 0.6 with a few exceptions. It should be noted when reviewing
Table 2.1 that often there is not a very good fit between actual grading limits and there is a
curve defined by equation 1.
Table 2.1 Talbot’s exponent n (equation 1) values for selection of aggregates throughout the world.
Talbot's exponent n-values
Lower limits (coarse side)
Upper limits (fine side)
New Zealand 0.61 0.4
Finland 0.38 0.38
Germany 0.58 0.33
South Australia 0.61 0.37
Sweden 0.55 0.47
United Kingdom 0.68 0.35
Chile 0.95 0.3
Canada 0.58 0.3
Australia–Victoria 0.5 0.3
Australia–Western Australia 0.57 0.3
South Africa 0.5 0.31
RTA NSW, Australia 0.5 0.32

THE EFFECT OF GRADING ON THE PERFORMANCE OF BASECOURSE AGGREGATE
16
2.5 Effect of grading on aggregate permanent deformation
Thom and Brown (1988) studied the behaviour of crushed limestone material at different
gradings and arrived at the conclusion that the resistance to permanent deformation
decreased with increasing fines content. This could be explained by the assumption that the
entire fines fraction does not necessarily fit into the pore spaces between the large particles.
Therefore a skeleton of larger particles in full contact does not exist. The fines act as a
lubricant between the stones. As a result the resistance against permanent deformation and
stiffness decreases with increasing fines content.
Tampere University in Finland (Kolisoja 1998) found from large-scale dynamic triaxial tests
that if the grading was changed so the relative density increased, then resistance to
permanent deformation would rise. Significantly higher permanent strains could be expected
for aggregates containing extremely high fines content (eg d < 0.074 mm > 15 %) or at a
low content of fines.
Belt et al. (1997) undertook permanent strain RLT tests on a range of aggregate gradings
varying the Talbot’s exponent n-value (equation 1 and Figure 2.3). Results are shown in
Figure 2.4 where the lowest permanent deformation was found at a fine grading of n=0.4,
which was finer than the theoretical highest density grading of n = 0.5.
Figure 2.3 Grading curves of aggregates tested by Belt (1997).

2. Literature review
17
Figure 2.4 Effect of grain size distribution on the aggregate’s susceptibility to permanent deformations (Belt 1997).
Van Niekerk (2002) recognised in RLT tests that unbound granular materials (UGMs) with a
more balanced grading performed better than the more uniformly graded materials. It is
worth emphasising that the experimental observations on the effects of the gradings
presented above are mainly based on the results of test series performed with RLT
equipment. The RLT test applies user-defined loads and stresses at a particular sample
moisture content and density. For example, the RLT test does not take into account the
effects of freeze thaw where it has been found a coarser aggregate lacking in fines performs
best. Furthermore, dilatant behaviour of UGMs will cause a discrepancy between
experimental observations using the RLT test and the behaviour in the real pavement
structure. Dilatant behaviour allows heavily stressed elements to build up an increasing
confinement and thus reduce permanent deformation. Van Niekerk (2002) recognised that
finer gradings showed less resilient dilatant behaviour (particles could resiliently rearrange
under loading) than a coarse skeleton structure (particles would resiliently wedge sideways
under loading).
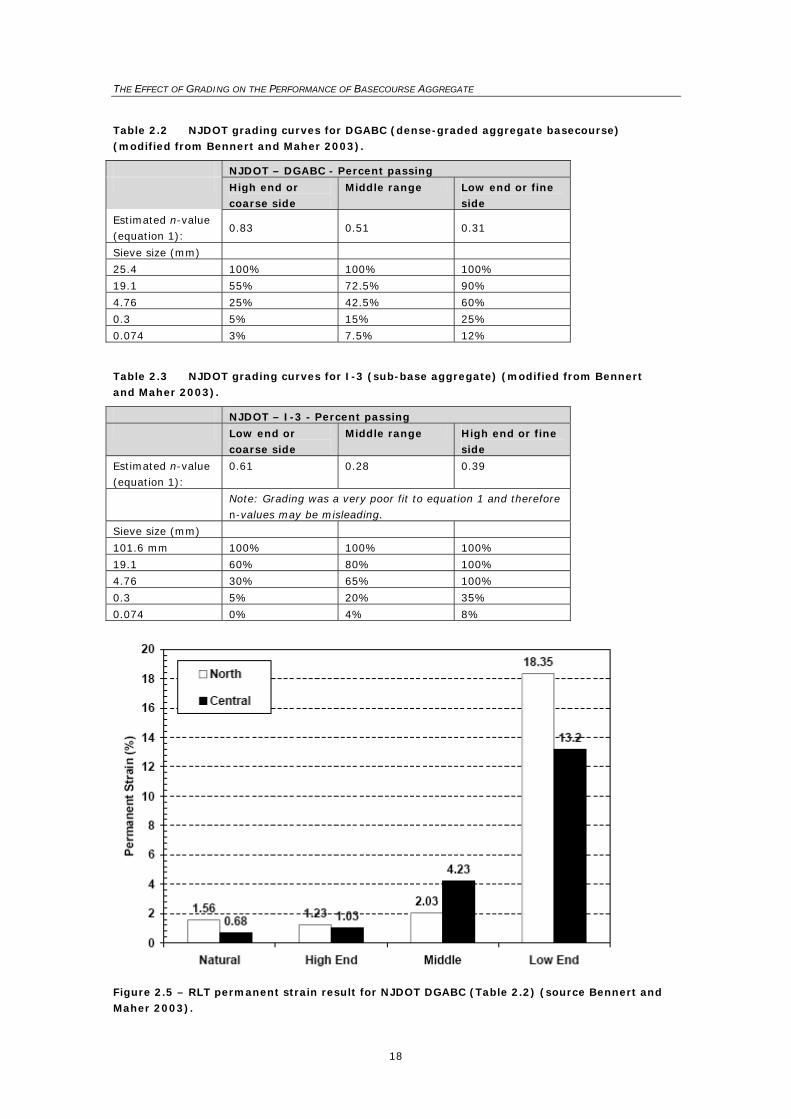
The New Jersey Department of Transport (NJDOT) undertook a project on the performance of
aggregates (base and sub-base materials) with a focus on gradation ranges (Bennert and
Maher 2003). Resilient modulus and permanent strain RLT tests were conducted and
analysed using the materials with different gradations. It was found that different materials
behaved differently in regard to the change in the grading. Permanent strain RLT tests were
conducted on three different aggregates at four different gradings (high end or coarse side;
middle range; low end or fine side; and natural or as received). Permanent strain testing was
for 100,000 cycles of a 310 kPa haversine pulse with a 103 kPa confining pressure on a
sample compacted using a heavy hammer at its respective maximum dry density and
optimum moisture contents. Figures 2.5 and 2.6 show the permanent strain-values at the
end of the RLT test. Grading limits in New Jersey are very wide and based on their limits
(Tables 2.2 and 2.3), the n-values were calculated for the different gradings tested, although
the natural gradings were not reported.
THE EFFECT OF GRADING ON THE PERFORMANCE OF BASECOURSE AGGREGATE
18
Table 2.2 NJDOT grading curves for DGABC (dense-graded aggregate basecourse) (modified from Bennert and Maher 2003).
NJDOT – DGABC - Percent passing
High end or coarse side
Middle range Low end or fine side
Estimated n-value (equation 1):
0.83 0.51 0.31
Sieve size (mm)
25.4 100% 100% 100%
19.1 55% 72.5% 90%
4.76 25% 42.5% 60%
0.3 5% 15% 25%
0.074 3% 7.5% 12%
Table 2.3 NJDOT grading curves for I-3 (sub-base aggregate) (modified from Bennert and Maher 2003).
NJDOT – I-3 - Percent passing
Low end or coarse side
Middle range High end or fine side
Estimated n-value (equation 1):
0.61 0.28 0.39
Note: Grading was a very poor fit to equation 1 and therefore n-values may be misleading.
Sieve size (mm)
101.6 mm 100% 100% 100%
19.1 60% 80% 100%
4.76 30% 65% 100%
0.3 5% 20% 35%
0.074 0% 4% 8%
Figure 2.5 – RLT permanent strain result for NJDOT DGABC (Table 2.2) (source Bennert and Maher 2003).

2. Literature review
19
Figure 2.6 RLT permanent strain result for NJDOT I-3 (Table 3.3) (source Bennert and Maher 2003).
The RLT study by Bennert and Maher (2003) showed that the DGABC gradings at the high
end performed best, with the middle grading showing adequate performance, while at the
fine end very high deformations occurred. Results for the sub-base showed the grading in
the middle of the envelope was best for all three aggregates. This result is not surprising
given the large range in particle size distributions between the coarse and fine materials.
Thom and Brown (1988) conducted RLT permanent strain tests on crushed dolomitic
limestone at a range of gradings and compaction level. They found when uncompacted, the
specimens with uniform grading resulted in the least permanent strain (Figure 2.7).
Figure 2.7 Effect of grading and compaction on plastic strain (Thom and Brown 1988).

THE EFFECT OF GRADING ON THE PERFORMANCE OF BASECOURSE AGGREGATE
20
The effect of increasing fines content generally increases the magnitude of deformation in
RLT permanent strain tests (Barksdale 1972, 1991; Thom and Brown 1988). Dodds et al.
(1999) confirmed this result as the material with 10% fines added showed the highest
deformations. Pore water pressure development was observed by Dodds et al. (1999) to be
higher for materials with higher fines content. Pore water pressure reduced the effective
stress and thus reduced the beneficial level of confinement.
Thompson and Smith (1990) looked at the resilient modulus of seven Illinois granular
materials, including two crushed stones, two crushed gravels, two gravels and a partially
(30–35%) crushed gravel. The partially crushed gravel and one material from each of the
other types conformed to one gradation specification, while the remaining three materials
conformed to another. The two gradation specifications differed only in the percentage
passing the 75 μm sieve. The one with the lower fines content required 0–4% passing 75 μm
whereas the higher fines content required 4–8% passing 75 μm. The materials were tested
at or near the maximum dry density, which varied from 1962 kg/m3 (low fines content
crushed stone) to 2300 kg/m3 (high fines content crushed stone) and the optimum moisture
content, which varied from a low of 4% (low fines content crushed stone) to a high of 9%
(partially crushed stone, high fines content). At a bulk stress of 138 kPa (20 psi), their
resilient modulus results ranged from a high value of 244 MPa for the crushed stone having
the higher fines content to a low of 134 MPa for the partially crushed gravel, which also had
the higher fines content. Looking at the pairs of similar material, in all cases, the material
with the higher fines content had a slightly higher modulus. How much of the difference is
attributable to the different fines content, and how much is attributable to different moisture
and density conditions cannot be discerned from the data.
Along with the quantity of fines the type of fines has a significant affect on rut depth
performance. Theyse (2002) found that increasing the non-plastic fines content up to 9% in
a crushed rock base increased the cohesion and shear strength. However, replacing these
fines with plastic/clay fines had the opposite effect and significantly reduced the cohesion
and shear strength.
Arnold (2004) found in his doctorate studies that resilient modulus was higher for an
aggregate with 10% clay fines added at 70% of optimum moisture content. However, results
from the multi-stage permanent deformation RLT test and associated rut depth modelling
clearly showed the aggregate with 10% clay fines resulted in the highest rut depth.
Walaa and El Hussein (2004) studied the effects of clay fines content and moisture content
on resilient modulus and permanent strain measured in RLT tests. At moisture contents dry
of optimum the resilient modulus increased while the permanent strain decreased (Figures
2.8 and 2.9). Although for moisture contents greater than optimum Walaa and El Hussein
found that higher fines contents caused greater permanent strain (Figure 2.10).

2. Literature review
21
Figure 2.8 Effect of fines content on resilient modulus (Walaa and El Hussein 2004).
Figure 2.9 Effect of fines content on permanent strain (Walaa and El Hussein 2004).
Figure 2.10 Effect of moisture content on permanent strain for an aggregate with 12% clay fines (Walaa and El Hussein 2004).

THE EFFECT OF GRADING ON THE PERFORMANCE OF BASECOURSE AGGREGATE
22
A RLT study looking at freeze-thaw effects on granular materials (Kolisoja et al. 2002) found
the modulus values of dry samples increased as the fines content increased. However, in
samples which had absorbed water or those which had gone through a freeze-thaw cycle, the
modulus values instead tended to decrease as the fines content increased. Permanent strain
tests on the same samples prior to a freeze-thaw cycle found the permanent strain clearly
increased with increasing fines content.
Elastic and plastic RLT and failure tests were conducted and analysed on unbound mixes
using different gradations between the two extreme limits of the envelope currently used in
the United Kingdom (Kamal et al. 1993). It was found that the resistance to permanent
deformation generally increased for well-graded materials compared with open-graded
(coarse-grading) materials. The stiffness also increased from the finer to the coarser end of
the envelope.
The results of Monismith et al., reported in FHWA (2006), showed an increase in modulus as
the fines content increased from a coarse (2–3% fines) to a medium (5–6% fines) gradation
for both crushed and partially crushed materials. However, a decrease in modulus occurred as
the fines content was further increased from a medium gradation to a fine gradation (8–10%
fines).
Ishibashi et al., reported in FHWA (2006), investigated four soils. Two were gravelly, silty,
sand-base materials differing only in fines content. Two were subgrade materials, which were
identical but for the substitution of a sandy silty clay material for the minus number 8
fraction (2.36 mm sieve) of the original gravelly sandy silt in one soil. The materials having
the highest fines content exhibited the lowest modulus for both the base and subgrade
materials.
Early research work at CAPTIF by Seddon, reported in Salt (1977) looked at the effect of
grading percentage broken faces and fines content on rutting and densification of basecourse
under wheel loading. Aggregate from Miners Road Quarry in Christchurch and Stevensons
Quarry in Drury was used in the trial. This report concludes that the most adequate means of
predicting susceptibility of aggregate to excessive densification is examination of the shape
of the particle size distribution curve (n-value). The sand equivalent test which reputedly
determines the amount of undesirable fines in aggregates was found to correlate poorly with
basecourse performance. Table 2.4 shows some results from Salt (1977) and it can be seen
that both aggregates end up at the same amount of total voids regardless of the initial total
voids. The denser gradings with n-values of 0.5 and 0.4 started with the lowest amount of
total voids of 14% and hence had the least amount of further densification showing as
surface rutting.

2. Literature review
23
Table 2.4 Aggregate gradation effect on densification after trafficking (Appendix 1, Salt 1977).
1 Note all Stevensons Drury material is a quarried product with 100% crushed.
2 CF = Crushed faces
2.6 Physical properties of aggregate particles
Although not the prime purpose of this study the literature review was extended to include
the physical properties of aggregate particles such as grain shape and particle surface
roughness as these affect permanent deformation behaviour.
2.6.1 Grain shape
A significant factor influencing the grain shape of coarse-grained aggregates is the
mineralogical composition of the aggregate particles. The crushing technique used to produce
the aggregates affects the grain shape of the crushed materials. The grain shape can be
defined into two general groups: the first is composed of natural sands and gravels and the
second of crushed materials. In the first group, particle contact is between two smooth
surfaces, while in the second group (ie crushed aggregates) the particle edges can be very
sharp. This difference between the natural aggregate having rounded grains and crushed
aggregate having sharp-edged grains is of most significance in long-term and permanent
deformation behaviour. The crushed material is likely to have more grain abrasion than the
natural aggregate, especially at high stresses.
The two tests used in basecourse specifications to control the grain shape are the Flakiness
Index and the percentage of broken faces. The Flakiness Index is a measure of the length to
width ratio of aggregate particles. The Transit New Zealand specification for basecourse
aggregate (TNZ M/4) requires the aggregate broken face content (two or more broken faces
as per NZS 4407: 1991, Test 3.14 Broken Face Test) in the aggregate fractions between the
37.5 mm and 4.75 mm sieves to be not less than 70% by weight.
2.6.2 Surface roughness of the particles
Many investigations have addressed the effect of macro- and micro-roughness of particles on
deformation behaviour (Thom and Brown 1989; Cheung 1994). The surface friction angle can
be measured using a sliding type test performed by pulling a representative specimen of
aggregate loaded on a rough test surface (Cheung 1994). The surface friction at the contact
points of particles can be assumed to affect the resilient deformation behaviour, especially
Aggregate Total voids %
Initial After 16,300 EDAs (wheel passes)
1Drury – n-value = 0.65 16 10.5
Drury – n-value = 0.55 17 10
Drury – n-value = 0.5 14 10 2Christchurch – 95%CF – n-value = 0.65
15 7
2Christchurch – 94%CF – n-value = 0.5
16 8
2Christchurch – 94%CF – n-value = 0.4
14 8

THE EFFECT OF GRADING ON THE PERFORMANCE OF BASECOURSE AGGREGATE
24
when the external load reaches the value which makes the particles slide. It should be
mentioned that the surface friction angle in the friction test proposed by Cheung (1994)
does not necessarily correlate with the visual assessment of surface roughness. However,
the macro-level surface roughness (visible roughness of the individual particles based on
the number of protrusions in the surface) probably correlates better with the ability of the
material to resist permanent deformations (Thom 1989).
2.6.3 Effect of water
High pore water pressures that reduce the amount of suction will occur in granular
materials in the laboratory and field due to a combination of a high degree of saturation,
low permeability and poor drainage. These conditions result in lowering the effective
stress and consequently reducing stiffness and resistance to deformation (Haynes and
Yoder 1963; Barksdale 1972; Maree et al. 1982; Thom and Brown 1987; Dawson et al.
1996). Haynes and Yoder (1963) found the total permanent strain rose by more than
100% as the degree of saturation increased from 60 to 80%. A more modest increase of
68% in permanent strain was observed by Barksdale (1972) for tests on soaked
specimens compared with those partially saturated. Thom and Brown (1987) reported
that a small increase in water content could trigger a dramatic increase in permanent
strain. Analysing RLT permanent strain tests from Dodds et al. (1999) found the
aggregate contaminated with 10% clay fines did not survive for 100,000 loading cycles
when saturated, while the aggregate free from clay fines did survive.
2.6.4 Effect of fines
The effect of increasing fines content generally increases the magnitude of deformation in
RLT permanent strain tests (Barksdale 1972, 1991; Thom and Brown 1988). Dodds et al.
(1999) confirm this result as the material with 10% fines added showed the highest
deformations. Pore water pressure development was observed by Dodds et al. (1999) to
be higher for materials with higher fines content. Pore water pressure reduces the
effective stress and thus reduces the beneficial level of confinement.
As found by Theyse (2002) and discussed earlier, the type of fines, either plastic (clay) or
non-plastic (crusher dust/sand), affects the performance of an aggregate in different
ways. Non-plastic fines up to 9% increase shear strength while any quantities of plastic
fines decrease strength. Hence TNZ M/4 limits the quantity and type of fines.
2.6.5 Effect of density
Results for RLT permanent strain tests by Dodds et al. (1999) showed in all cases larger
permanent strains for the samples compacted to a low density of 90% of MDD (maximum
dry density with vibrating hammer, BS 1377–4: 1990) compared with samples compacted
at 95% of MDD. Other researchers reported that the resistance to permanent deformation
under repetitive loading improved as a result of increased density (Holubec 1969;
Barksdale 1972, 1991; Allen 1973; Marek 1977; Thom and Brown 1988). Barksdale
(1972) observed an average of 185% more permanent axial strain when the material was
compacted at 95% instead of 100% of the maximum compactive density obtained from
the drop hammer test.

2. Literature review
25
2.7 Summary of literature review
Generally, the results from the literature show that the mid-range to the coarse side provide
the best results in terms of resistance to permanent deformation/rutting. There are
exceptions to this where dry materials with high fines contents can reduce the amount of
permanent deformation. Resilient modulus results are more scattered and tend to increase
with increasing fines contents. This increase in modulus for higher fines contents is probably
caused by the increase in density due to the fines filling the voids and thus giving less
secondary densification. Also resilient modulus decreases and permanent strain increases
with increasing water content. Finer gradings are more affected by increasing water content.

THE EFFECT OF GRADING ON THE PERFORMANCE OF BASECOURSE AGGREGATE
26
3. Repeated load triaxial study
3.1 Introduction
Multi-stage RLT permanent strain tests following the procedure developed by Arnold et al.
(2007) in stage 1 of this project were conducted on basecourse aggregates mixed to
specified particle size distributions (gradings). The RLT apparatus applied repetitive
loading on cylindrical materials for a range of specified stress conditions. The output was
deformation (shortening of the cylindrical sample) versus the number of load cycles
(usually 50,000) for a particular set of stress conditions. Multi-stage permanent strain RLT
tests were used to obtain deformation curves for a range of stress conditions to develop
models for predicting rutting. Figures 3.1 and 3.2 detail the RLT setup and typical output
from a multi-stage permanent strain RLT test. Resilient modulus information can also be
obtained for pavement design in the computer program CIRCLY and in finite element
models.
Figure 3.1 RLT apparatus and setup.

3. Repeated load triaxial study
27
Figure 3.2 Typical output from permanent strain RLTT (A, B, C … etc denote each loading stage of the RLT test as detailed in Table 4.1).
The method developed by Arnold (2004) has been used in this study to interpret the results
from RLT testing and to predict the rut depth in a pavement. This method has been refined
and validated for a range of New Zealand basecourses as detailed in stage 1 of this project in
the report titled, Performance tests for road aggregates (Arnold et al. 2007). The RLT test
method is a six-stage test at 50,000 load cycles per stage as detailed in Table 3.1.
Table 3.1 RLT testing stresses for 6-stage test.
RLT testing stress stage
A B C D E F
Deviator stress – q (kPa) (cyclic vertical stress)
90.0 100.0 100.0 180.0 330.0 420.0
Mean stress – p (kPa)
150.0 100.0 75.0 150.0 250.0 250.0
Cell pressure, σ3
(kPa) 120.0 66.7 41.7 90.0 140.0 110.0
Major principal vertical stress, σ1
(kPa) 210.0 166.7 141.7 270.0 470.0 530.0
Cyclic vertical loading speed
Haversine at 4 Hz
Number of loads (N) 50,000
Record and report data electronically in Microsoft Excel
Permanent strain versus load cycles and resilient modulus versus load cycles
p = mean principle stress (1/3*(σ1 + 2*σ3)
q = principle stress difference (σ1 - σ3)
To predict the pavement rut depth from RLT tests required a series of steps. The first step
was to develop a mathematical relationship between stress (both vertical and horizontal)
with permanent strain rate (slope of each deformation curves (Figure 3.3), eg % deformation
per 1 million load cycles).
0
0.2
0.4
0.6
0.8
1
0 50,000 100,000 150,000 200,000 250,000 300,000Number of load cycles [-]
Perm
anen
t stra
in [%
]
A B C DE
F

THE EFFECT OF GRADING ON THE PERFORMANCE OF BASECOURSE AGGREGATE
28
Figure 3.3 Fitting the permanent strain rate model to RLT test results.
The next step was to use a finite element model (to model the non-linear elastic behaviour of
a pavement material and to avoid discontinuities as occurs in CIRCLY which results in high
tensile stresses) to compute the stresses (both vertical and horizontal underneath a standard
axle load (8.2 tonne dual tyred axle or higher if designing for ports etc). Stresses were
exported into a spreadsheet to calculate the deformation rate at depth increments in the
pavement from the permanent strain model (Figure 3.3). Results showed that very good
predictions of rutting occurred at CAPTIF (Arnold 2004).
Pavement rut depth was predicted for all RLT tests on basecourse aggregates with a range of
aggregate basecourse gradings.
3.2 Aggregates and grading ranges tested
The aggregate used primarily in this study was a TNZ M4 AP40 basecourse from Pounds
Road Quarry in Christchurch. Tests at CAPTIF commonly use this basecourse due to the close
proximity of the quarries to the site. Using this basecourse allowed the rut depth prediction
models to be validated against actual rut depth measured in CAPTIF tests. An added
advantage in using the Pounds Road basecourse was there have been many other RLT tests
on this material which supplemented the results. The Pounds Road aggregate is referred to
as material #1 or CAPTIF 1 as used in stage 1 of this research project.
After initial RLT tests on the Pounds Road basecourse it was decided to undertake further
tests on a different aggregate from the upper North Island of New Zealand to see if the same
pattern of results could be obtained. This aggregate will remain anonymous and in keeping
with names chosen in stage 1 of this project the other aggregate shall be referred to as:
material #7.
0.0
0.5
1.0
1.5
2.0
0.00 0.20 0.40 0.60 0.80 1.00
Principal Stress Difference, q (MPa)
Perm
anen
t stra
in r
ate
(%/1
M)
(25k
to 1
00k
)
0.0750.1500.2500.0750.1500.250
CAPTIF 3
R2 = 0.92Mean Principal Stress, p (MPa)
σ3
σ1σ3 = σ2cell pressure
σ3
σ1
σ2q = σ1 – σ3p = 1/3(σ1+σ2+σ3)
εp_rate = e(a) e(bp) e(cq) - e(a) e(bp)
Where: a, b, c are constants; e = natural log number (2.718…)ε p
_rat
e
0.0
0.5
1.0
1.5
2.0
0.00 0.20 0.40 0.60 0.80 1.00
Principal Stress Difference, q (MPa)
Perm
anen
t stra
in r
ate
(%/1
M)
(25k
to 1
00k
)
0.0750.1500.2500.0750.1500.250
CAPTIF 3
R2 = 0.92Mean Principal Stress, p (MPa)
σ3
σ1σ3 = σ2cell pressure
σ3
σ1
σ2q = σ1 – σ3p = 1/3(σ1+σ2+σ3)
0.0
0.5
1.0
1.5
2.0
0.00 0.20 0.40 0.60 0.80 1.00
Principal Stress Difference, q (MPa)
Perm
anen
t stra
in r
ate
(%/1
M)
(25k
to 1
00k
)
0.0750.1500.2500.0750.1500.250
CAPTIF 3
R2 = 0.92Mean Principal Stress, p (MPa)
σ3
σ1σ3 = σ2cell pressure
σ3
σ1
σ2q = σ1 – σ3p = 1/3(σ1+σ2+σ3)
σ3
σ1σ3 = σ2cell pressure
σ3
σ1
σ2q = σ1 – σ3p = 1/3(σ1+σ2+σ3)
εp_rateεp_rate = e(a) e(bp) e(cq) - e(a) e(bp)
Where: a, b, c are constants; e = natural log number (2.718…)ε p
_rat
eε p
_rat
e

3. Repeated load triaxial study
29
Talbot’s exponent n-values (Equation 1) were used as a guide for calculating grading curves
to test. Gradings targeted were n-values in the middle and just outside the limits of TNZ M/4
basecourse. These n-values were 0.55 (middle), 0.3 (fine side) and 0.8 (coarse side).
3.3 Vibrating hammer compaction tests
The standard for compaction of road basecourse is Transit New Zealand’s specification TNZ
B/2 Specification for the Construction of Unbound Pavement Layers. Compaction targets are
a minimum of 95% of maximum dry density (MDD) and 70% of optimum moisture content
(OMC). MDD and OMC are determined by a vibrating hammer compaction test in accordance
with NZS 4402: Test 4.1.3. targets for repeated load triaxial testing are 95% MDD and 100%
OMC (wet) or 70% OMC (dry).
Vibrating hammer compaction tests (NZS 4402: Test 4.1.3) were conducted for the range of
aggregate gradings tested in the RLT apparatus. Table 3.2 and Figure 3.4 show the results of
the compaction tests which indicate a definite trend in relation to the grading curve. The
maximum density does appear to occur when the Talbot’s n is 0.5 being the same value as
the theoretical maximum density grading curve.
Table 3.2 Vibrating hammer compaction test (NZS 4402 : Test 4.1.3) results.
Material # n Maximum dry density (t/m3) Optimum moisture content (%)
1 0.3 2.22 5.7
1 0.4 2.33 5.4
1 0.55 2.34 5
1 0.8 2.23 4.3
7 0.55 2.31 5.45
Gradation Type versus Maximum Dry Density
2.2
2.22
2.24
2.26
2.28
2.3
2.32
2.34
2.36
0.2 0.3 0.4 0.5 0.6 0.7 0.8 0.9
Talbots Gradation Exponent, n (Eqn. 1)
Max
Dry
Den
sity
(t/m
3 )
Mat. # 7
Mat. # 1
Gradation Type versus Optimum Moisture Content
22.5
33.5
44.5
55.5
66.5
7
0.2 0.3 0.4 0.5 0.6 0.7 0.8 0.9
Talbots Gradation Exponent, n (Eqn. 1)
OM
C v
alue
s (%
)
Mat. # 7
Mat. # 1
Figure 3.4 Effect of Talbot’s grading exponent, n (Equation 1) on maximum dry density (MDD) and optimum moisture content (OMC).
3.4 RLT results
RLT tests conducted including densities and moisture contents are summarised in Table 3.3.
A test number reference is included to enable reference to the raw results shown in Figures

THE EFFECT OF GRADING ON THE PERFORMANCE OF BASECOURSE AGGREGATE
30
3.5 to 3.14. Interpretation of these results in relation to pavement rut depth prediction are
summarised in the next section.
Table 3.3 Summary of RLT tests and identification.
University of Canterbury test reference #
Material # n (equation 1) value and wet (100%OMC targeted) or dry (70%OMC targeted)
Actual dry density achieved
Actual moisture content achieved
4 Mat. #1, n=0.8 (coarse), dry.
99% (2.20t/m3) 60% (2.6%)
5 Mat. #1, n=0.8 (coarse), wet.
97% (2.16t/m3) 84% (3.6%)
7 Mat. #1, n=0.3 (fine), wet. 96% (2.13t/m3) 83% (4.7%)
6 Mat. #1, n=0.3 (fine), dry 99% (2.20t/m3) 63% (3.6%)
17 Mat. #1, n=0.55 (middle), wet
98% (2.29t/m3) 71% (3.6%)
3 Mat. #7, n=0.55 (middle) + 15% fines (AP5), dry
96% (2.23t/m3) 62% (3.7%)
13 Mat. #7, n=0.55 (middle), wet
99% (2.28t/m3) 79% (4.3%)
8 Mat. #1, n=0.4 (fine), wet 96% (2.24t/m3) 77% (4.2%)
14 Mat. #7, n=0.3 (fine), dry 102% (2.26t/m3) 74% (4.6%)
15 Mat. #7, n=0.8 (coarse), dry
96% (2.13t/m3) 70% (3.3%)

3. Repeated load triaxial study
31
Univ of Cant Test # 4Material # 1, n=0.8 (coarse), dry (CAPTIF 1)
0
0.1
0.2
0.3
0.4
0.5
0.6
0 50000 100000 150000 200000 250000 300000
Number of load cycles [-]
Per
man
ent s
train
[%]
Stage A Stage B Stage C Stage D Stage F
Figure 3.5 RLT result for test #4.
Univ of Cant Test # 5Material # 1, n=0.8 (coarse), wet (CAPTIF 1)
0
0.1
0.2
0.3
0.4
0.5
0.6
0 50000 100000 150000 200000 250000 300000
Number of load cycles [-]
Per
man
ent s
train
[%]
Stage A Stage B Stage C Stage D Stage F
Figure 3.6 RLT result for test #5.

THE EFFECT OF GRADING ON THE PERFORMANCE OF BASECOURSE AGGREGATE
32
Univ of Cant Test # 7Material # 1, n=0.3 (fine), wet (CAPTIF 1)
0
0.1
0.2
0.3
0.4
0.5
0.6
0 50000 100000 150000 200000 250000 300000
Number of load cycles [-]
Per
man
ent s
train
[%]
Stage A Stage B Stage C Stage D Stage F
Figure 3.7 RLT result for test #7.
Univ of Cant Test # 6Material # 1, n=0.3 (fine), dry (CAPTIF 1)
0
0.1
0.2
0.3
0.4
0.5
0.6
0 50000 100000 150000 200000 250000 300000
Number of load cycles [-]
Per
man
ent s
train
[%]
Stage A Stage B Stage C Stage D Stage F
Figure 3.8 RLT result for test #6.

3. Repeated load triaxial study
33
Univ of Cant Test # 17Material # 1, n=0.55 (middle), wet (CAPTIF 1)
0
0.1
0.2
0.3
0.4
0.5
0.6
0 50000 100000 150000 200000 250000 300000
Number of load cycles [-]
Per
man
ent s
train
[%]
Stage A Stage B Stage C Stage D Stage F
Figure 3.9 RLT result for test #17.
Test # 3Material # 7, n=0.55 (middle) + 15% fines (AP5), dry
0
0.1
0.2
0.3
0.4
0.5
0.6
0 50000 100000 150000 200000 250000 300000
Number of load cycles [-]
Per
man
ent s
train
[%]
Stage A Stage B Stage C Stage D Stage F
Figure 3.10 RLT result for test #3.

THE EFFECT OF GRADING ON THE PERFORMANCE OF BASECOURSE AGGREGATE
34
Test # 13Material # 7, n=0.55 (middle), wet
0
0.1
0.2
0.3
0.4
0.5
0.6
0 50000 100000 150000 200000 250000 300000
Number of load cycles [-]
Per
man
ent s
train
[%]
Stage A Stage B Stage C Stage D Stage F
Figure 3.11 RLT result for test #13.
Test # 8Material # 1, n=0.4 (fine), Wet (CAPTIF 1)
0
0.1
0.2
0.3
0.4
0.5
0.6
0.7
0.8
0.9
1
0 50000 100000 150000 200000 250000 300000
Number of load cycles [-]
Per
man
ent s
train
[%]
Stage A Stage B Stage C Stage D Stage F
Figure 3.12 RLT result for test #8.

3. Repeated load triaxial study
35
Test # 14Materials # 7, n=0.3 (fine), dry
0
0.1
0.2
0.3
0.4
0.5
0.6
0.7
0.8
0.9
1
0 50000 100000 150000 200000 250000 300000
Number of load cycles [-]
Per
man
ent s
train
[%]
Stage A Stage B Stage C Stage D Stage F
Figure 3.13 RLT result for test #14.
Test # 15Material # 7, n=0.8 (coarse), dry
0
0.1
0.2
0.3
0.4
0.5
0.6
0 50000 100000 150000 200000 250000 300000
Number of load cycles [-]
Perm
anen
t stra
in [%
]
Stage A Stage B Stage C Stage D Stage F
Figure 3.14 RLT result for test #15.

THE EFFECT OF GRADING ON THE PERFORMANCE OF BASECOURSE AGGREGATE
36
3.5 Rut depth predictions
Rut depth from RLT tests was predicted for a typical pavement constructed at CAPTIF
(Figure 3.15). Rut depths within the subgrade and aggregate were predicted with the results
shown in Table 3.4. Reviewing the results for material #1 in the wet state shows that the
strength/resistance to rutting was significantly improved for coarser gradings with n-values
>0.5 as shown in Figure 3.16.
Figure 3.15 CAPTIF pavement cross-section for rut depth prediction.
Granular
Material
CAPTIF
SUBGRADE
300m
1200m
550kP
C
C

3. Repeated load triaxial study
37
Table 3.4 Rut depth predictions from RLT results.
CAPTIF pavement 300 mm aggregate over 10CBR subgrade
Total pavement
Aggregate only
Aggregate only
N, ESAs to get 25 mm rut
N, ESAs to get 10 mm rut in aggregate.
Long-term rate of rutting within aggregate
Resilient modulus
Average RLT slope
Maximum slope
# Material # (Table 3.3)
Million ESAs
Million ESAs
mm per 1 million ESAs
MPa %/1M %/1M
4 Mat. #1, n=0.8 (coarse), dry.
3.33 24.66 0.4 672 0.182 0.433
5 Mat. #1, n=0.8 (coarse), wet.
3.42 28.60 0.3 760 0.193 0.471
7 Mat. #1, n=0.3 (fine), wet.
3.18 10.36 0.7 882 0.594 1.157
6 Mat. #1, n=0.3 (fine), dry
3.49 37.16 0.3 741 0.206 0.424
17 Mat. #1, n=0.55 (middle), wet
3.39 26.14 0.4 698 0.207 0.363
3
Mat. #7, n=0.55 (middle) + 15% fines (AP5), dry
2.19 2.46 3.7 583 0.604 1.878
13 Mat. #7, n=0.55 (middle), wet
3.07 10.97 0.9 566 0.167 0.448
8 Mat. #1, n=0.4 (fine), wet
2.75 6.17 1.2 608 0.978 2.708
14 Mat. #7, n=0.3 (fine), dry
3.03 13.57 0.5 756 0.496 1.235
15 Mat. #7, n=0.8 (coarse), dry
3.52 48.73 0.2 784 0.157 0.339
CAPTIF Test 2001, Section 1A, 40kN wheel load
3.8 Unknown Unknown

THE EFFECT OF GRADING ON THE PERFORMANCE OF BASECOURSE AGGREGATE
38
0
5
10
15
20
25
30
35
40
45
50
0 0.1 0.2 0.3 0.4 0.5 0.6 0.7 0.8 0.9
Talbot Grading Exponent, n
Whe
el P
asse
s N
(Mill
ion
ES
As)
to A
chie
ve
10m
m R
ut in
Agg
rega
te
Material 1 (Wet)
Material 1 (Dry)
Material 7+ 15% fines (Dry)
Material 7 (Wet)
Figure 3.16 Effect of Talbot grading exponent n (equation 1) on rutting performance for materials #1 and #7.
The various lives predicted in the rut depth modelling showing the different contributions of
subgrade and aggregate deformations for the various materials can be seen in Figures 3.17
to 3.19.
2.00
2.20
2.40
2.60
2.80
3.00
3.20
3.40
3.60
3.80
4.00
Mat # 1, dry,n=0.3,
DD=99%(2.20t/m3),MC=63%
(3.6%)
Mat # 1, dry,n=0.8,
DD=99%(2.20t/m3),MC=60%
(2.6%)
Mat # 1, wet,n=0.3,
DD=96%(2.13t/m3),MC=83%
(4.7%)
Mat # 1, wet,n=0.4,
DD=96%(2.24t/m3),MC=77%
(4.2%)
Mat # 1, wet,n=0.55,
DD=98%(2.29t/m3),MC=71%
(3.6%)
Mat # 1, wet,n=0.8,
DD=97%(2.16t/m3),MC=84%
(3.6%)
Mat # 7, dry,n=0.3,
DD=102%(2.26t/m3),MC=74%
(4.6%)
Mat # 7, dry,n=0.55,
DD=96%(2.23t/m3),MC=62%
(3.7%)
Mat # 7, dry,n=0.8,
DD=96%(2.13t/m3),MC=70%
(3.3%)
Mat # 7, wet,n=0.55,
DD=99%(2.28t/m3),MC=79%
(4.3%)
N, E
SAs
(Mill
ions
) to
get 2
5mm
Rut
in
Ful
l CA
PTIF
Pav
emen
t
+15% Fines (AP5)
Figure 3.17 Effect of aggregate grading on life of CAPTIF pavement (includes both aggregate and subgrade deformation).

3. Repeated load triaxial study
39
0
5
10
15
20
25
30
35
40
45
50
Mat # 1, dry,n=0.3,
DD=99%(2.20t/m3),MC=63%
(3.6%)
Mat # 1, dry,n=0.8,
DD=99%(2.20t/m3),MC=60%
(2.6%)
Mat # 1, wet,n=0.3,
DD=96%(2.13t/m3),MC=83%
(4.7%)
Mat # 1, wet,n=0.4,
DD=96%(2.24t/m3),MC=77%
(4.2%)
Mat # 1, wet,n=0.55,
DD=98%(2.29t/m3),MC=71%
(3.6%)
Mat # 1, wet,n=0.8,
DD=97%(2.16t/m3),MC=84%
(3.6%)
Mat # 7, dry,n=0.3,
DD=102%(2.26t/m3),MC=74%
(4.6%)
Mat # 7, dry,n=0.55,
DD=96%(2.23t/m3),MC=62%
(3.7%)
Mat # 7, dry,n=0.8,
DD=96%(2.13t/m3),MC=70%
(3.3%)
Mat # 7, wet,n=0.55,
DD=99%(2.28t/m3),MC=79%
(4.3%)
N, E
SAs
(Mill
ions
) to
get 1
0mm
Rut
in
Agg
rega
te
+15% Fines (AP5)
Figure 3.18 Effect of aggregate grading on number of wheel loads to achieved a 10 mm rut within the aggregate layer of a CAPTIF pavement (includes aggregate deformation only).
0.00
0.50
1.00
1.50
2.00
2.50
3.00
3.50
4.00
Mat # 1, dry,n=0.3,
DD=99%(2.20t/m3),MC=63%
(3.6%)
Mat # 1, dry,n=0.8,
DD=99%(2.20t/m3),MC=60%
(2.6%)
Mat # 1, wet,n=0.3,
DD=96%(2.13t/m3),MC=83%
(4.7%)
Mat # 1, wet,n=0.4,
DD=96%(2.24t/m3),MC=77%
(4.2%)
Mat # 1, wet,n=0.55,
DD=98%(2.29t/m3),MC=71%
(3.6%)
Mat # 1, wet,n=0.8,
DD=97%(2.16t/m3),MC=84%
(3.6%)
Mat # 7, dry,n=0.3,
DD=102%(2.26t/m3),MC=74%
(4.6%)
Mat # 7, dry,n=0.55,
DD=96%(2.23t/m3),MC=62%
(3.7%)
Mat # 7, dry,n=0.8,
DD=96%(2.13t/m3),MC=70%
(3.3%)
Mat # 7, wet,n=0.55,
DD=99%(2.28t/m3),MC=79%
(4.3%)
Long
term
def
orm
atio
n ra
tein
Agg
rega
te (m
m/1
M)
+15% Fines (AP5)
Figure 3.19 Effect of aggregate grading on the long term rate of deformation within the aggregate layer of a CAPTIF pavement (includes aggregate deformation only).
The CAPTIF material #1 showed a typical ‘textbook’ response. In wet conditions higher
deformations or shorter life occurred for the finer grading due to the lubricating effect of the
fines. Further, the fine gradings were more sensitive to moisture showing large differences in

THE EFFECT OF GRADING ON THE PERFORMANCE OF BASECOURSE AGGREGATE
40
performance between the wet and the dry tests. The coarse gradings for material #1 gave
the highest life in wet conditions with little difference between the wet and dry tests. For the
dry tests, as predicted, a fine grading proved to be best for material #1 due to the cohesive
nature of the additional fines.
Material #7 did not follow text book rules for the limited number of tests in dry conditions,
probably because the nature of the fines did not have beneficial cohesive strength. This was
probably due to the 4% moisture in the material which could cause the fines to have a
lubricating effect, hence the results could be considered a wet test. Adding 15% fines had a
negative effect on performance as expected. The coarse grading for material #7 showed the
best performance in the test.

4. Specifying grading envelopes for RLT tests
41
4. Specifying grading envelopes for RLT tests
The original purpose of this research was to determine the acceptable limits around a
grading that was tested in the RLT apparatus. Ideally one RLT test would be undertaken
to determine the acceptability as a basecourse and to determine production limits so that
at the extremes of the limits the performance would be nearly the same. A review of the
RLT results gave a conservative estimate that Talbot’s n-value could vary around +/- 0.06
at the low/fine end and +/- 0.1 at the high/coarse end (Figure 4.1). These variations were
estimated based on the results of material #1 in wet conditions where it was assumed
that the predicted life at n=0.3 (higher fines) should be the same as n=0.4 (less fines)
and the differences in performance were due to sample preparation. Although gradings
around an n-value of 0.5 can be seen in Figure 4.1, in fact fewer variations of n were
required to achieve similar results. In this limit test data set the results were grouped as
either fine or coarse and anything in between would be placed between the two extreme
cases in the grading envelope. This equates to around +/- 13% variation in Talbot’s n-
value where the performance predicted by the RLT test would be similar. In comparison
the TNZ M/4 basecourse specification allows for a variation in Talbot’s n-value of +/- 20%
or from 0.4 to 0.6.
0
5
10
15
20
25
30
35
0 0.1 0.2 0.3 0.4 0.5 0.6 0.7 0.8 0.9
Talbot Grading Exponent, n
Whe
el P
asse
s N
(ES
As)
to A
chie
ve 1
0mm
R
ut in
Agg
rega
te
Material 1 (Wet)
+/- 0.06 n-values +/- 0.1 n-values
Figure 4.1 Proposed variation in n-values where RLT results are similar.
For simplicity, production limits should be specified in variations around each sieve size as
done in TNZ M/4 basecourse specification (Table 4.1). Based on varying Talbot’s n-value
+/- 13% grading envelopes for the fine side and coarse side were determined (Tables 4.2
and 4.3).

THE EFFECT OF GRADING ON THE PERFORMANCE OF BASECOURSE AGGREGATE
42
Table 4.1 Particle size distribution envelope limits for an individual sample.
Test sieve aperture Maximum and minimum allowable percentage weight passing
AP40 (Max size 40 mm) AP20 (Max size 20 mm)
37.5 mm 19 mm 9.5 mm 4.75 mm 2.36 mm 1.18 mm 600 μm 300 μm 150 μm 75 μm
100 66–81 43–57 28–43 19–33 12–25 7–19 3–14 0–10 0–7
- 100
55–75 33–55 22–42 14–31 8–23 5–16 0–12 0–8
Table 4.2 Variation in grading envelopes for +/- 13% of Talbot’s exponent n-values on the coarse side.
n 0.70 0.80 0.90 Variation
D 37.5 37.5 37.5 Absolute Percentage
plus minus plus minus
Sieve sizes
Fine of middle
Middle Coarse of
middle
Fine side Coarse side
Fine side
Coarse side
37.5 100 100 100 0.0 0.0 0 0
19 62 58 54 4.3 4.0 7 7
9.5 38 33 29 5.1 4.4 15 13
4.75 24 19 15 4.6 3.7 24 19
2.36 15 11 8 3.6 2.7 33 25
1.18 9 6 4 2.7 1.9 43 30
0.6 6 4 2 2.0 1.3 54 35
0.3 3 2 1 1.4 0.8 65 39
0.15 2 1 1 0.9 0.5 78 44
0.075 1 1 0 0.6 0.3 91 48
Table 4.3 Variation in grading envelopes for +/- 13% of Talbot’s exponent n-values on the fine side.
n 0.26 0.3 0.34
D 37.5 37.5 37.5 Absolute Percentage
plus minus plus minus
Sieve sizes
Fine of middle
Middle Coarse of middle
Fine side Coarse side
Fine side Coarse side
37.5 100 100 100 0 0 0 0
19 84 82 79 2 2 3 3
9.5 70 66 63 4 3 6 5
4.75 58 54 50 5 4 8 8
2.36 49 44 39 5 4 11 10
1.18 41 35 31 5 4 14 13
0.6 34 29 25 5 4 18 15
0.3 28 23 19 5 4 21 17
0.15 24 19 15 5 4 24 19
0.075 20 15 12 4 3 27 22

4. Specifying grading envelopes for RLT tests
43
Table 4.4 Variation in grading envelopes for +/- 13% Talbot’s exponent n-values shown as absolute values.
Acceptable absolute variation for each sieve size, based on Talbot’s n-value.
Sieve sizes
0.2 0.3 0.4 0.5 0.6 0.7 0.8 0.9
% % % % % % % %
37.50 0 0 0 0 0 0 0 0
19.00 2 2 3 3 4 4 4 4
9.50 3 4 4 4 5 5 5 5
4.75 4 4 5 5 5 4 4 4
2.36 4 5 5 5 4 4 3 3
1.18 5 5 5 4 3 3 2 2
0.600 5 5 4 3 3 2 2 1
0.300 5 4 4 3 2 2 1 1
0.150 5 4 3 2 2 1 1 0
0.075 5 4 3 2 1 1 0 0
Table 4.5 Variation in grading envelopes for +/- 13% Talbot’s exponent n-values shown as percentages.
Acceptable % variation for each sieve size, based on Talbot’s n-value.
Sieve sizes 0.2 0.3 0.4 0.5 0.6 0.7 0.8 0.9
37.5 0 0 0 0 0 0 0 0
19 2 3 4 4 5 6 7 8
9.5 4 5 7 9 11 13 14 16
4.75 5 8 11 13 16 19 22 24
2.36 7 11 14 18 22 25 29 33
1.18 9 14 18 23 27 32 37 42
0.6 11 16 22 27 33 39 44 50
0.3 13 19 25 32 39 45 52 60
0.15 14 22 29 37 44 52 61 69
0.075 16 24 33 42 50 60 69 79
Tables 4.4 and 4.5 show the calculated acceptable variations in sieve sizes for the full range
of Talbot’s exponent n-values. It is interesting to note that less variation is allowed for the
large sieve sizes for the fine gradings (low n-values), while the opposite occurs for the coarse
gradings. A difficulty with determining acceptable variations based on Talbot’s n-values is the
difficulty in calculating the n-value based on the received grading curve for the RLT
specimen. Thus, a more simplified method of calculating the acceptable variation is required.
The Road Traffic Authority in New South Wales, Australia allows alternative basecourse
aggregates, either modified or unmodified, based on acceptable shear strength. Limits on
grading envelopes for materials based on shear strength are specified in RTA NSW 3051 and
are summarised in Table 4.6.

THE EFFECT OF GRADING ON THE PERFORMANCE OF BASECOURSE AGGREGATE
44
Table 4.6 Grading limits specified by RTA NSW 3051.
Sieve sizes (mm) Limits around nominated particle size distribution
%
37.50 -
26.50 ± 10
19.00 ± 10
13.20 ± 8
6.70 ± 5
2.36 ± 4
0.425 ± 3
0.075 ± 2
% passing 6.70mm 50–80
A quick scan of grading envelopes from the three methods reported, TNZ M/4 (Table 4.1);
Talbot’s n-value derived from RLT tests (Tables 4.5 and 4.6); and RTA NSW 3051 (Table 4.6)
shows the Tabot’s n-value derived from RLT tests is the most restrictive. Limits derived from
RLT testing were used to develop recommended grading envelopes as these were based on
actual performance tests and were more conservative. As the amount of fines had the most
effect on wet strength then this was limited further. Reviewing grading envelopes in Tables
4.5 and 4.6 and limiting the variation in fines led to the following recommended grading
envelopes in Table 4.7.
Table 4.7 Recommended grading envelope variations around a measured particle size distribution (PSD) for the RLT sample.
Sieve sizes Acceptable variation around measured particle size distribution (PSD).
%
37.50 -
19.00 ± 5
9.50 ± 5
4.75 ± 4
2.36 ± 3
1.18 the > of ± 14% of the measured psd or ± 2
0.600 the > of ± 14% of the measured psd or ± 1
0.300 the > of ± 14% of the measured psd or ± 1
0.150 the > of ± 14% of the measured psd or ± 1
0.075 the > of ± 14% of the measured psd or ± 1
Table 4.7 shows a reasonably tight grading envelope that may not be achieved in practice
but it does represent a grading envelope within which a similar result to the RLT test should
be obtained. Therefore, it is considered that Table 4.7 is appropriate for setting grading
boundaries on a RLT test result and if an aggregate supplier requires a larger grading
envelope for production control then additional RLT tests to expand the grading range will be
required.

4. Specifying grading envelopes for RLT tests
45
Variations in grading envelopes were derived to be similar values as the variations in Table
4.5 for the coarse materials >2.36 mm in sieve size. A less conservative approach near the
maximum variation allowable for the coarse materials (Table 4.5) was chosen as both TNZ
M/4 and RTA NSW 3051 allow larger variations in the coarse materials. For the fines a more
conservative approach was taken of the lowest variation values shown in Tables 4.5 and 4.6
with allowance for original fine gradings with a percentage variation (± 14% of PSD value) as
± 1% would be too restrictive for fine contents >15%.

THE EFFECT OF GRADING ON THE PERFORMANCE OF BASECOURSE AGGREGATE
46
5. Conclusions
This research project included a literature review, RLT tests and rut depth modelling to
predict the rutting performance primarily for one basecourse aggregate at different
gradings. Limited RLT results for another aggregate were added to supplement the results
of the main test. The objective was to determine the extent at which the grading could be
changed without affecting the rut depth performance found from RLT tests. Based on this
knowledge grading envelopes were established around the gradings of samples tested in
the RLT apparatus where the results from the RLT tests would be nearly the same for all
gradings within the envelope. The grading envelope found from this project is very tight
and it is likely that a wider grading envelope would be required for specifications. Wider
grading envelopes can be established by quarry owners by undertaking several RLT tests
to cover the full range of gradings expected to occur when developing an alternative in
TNZ M/4. From a literature review and RLT test the following conclusions were found:
• Talbot’s exponent n-value is a convenient way to describe the grading of an
aggregate, where n-values >0.5 are a coarse grading while n-values <0.5 are
considered fine.
• Current Transit New Zealand specification for basecourse aggregate has a Talbot’s n-
value varying from 0.4 to 0.6, while the majority of overseas roading authorities allow
finer gradings with a Talbot’s n-value of 0.3 to 0.6.
• Previous research has revealed that fine gradings have a lower strength when wet
compared with coarse gradings, while the opposite is the case when dry and/or when
a modifier like cement is added (ie fine gradings are best).
• The literature reported that finer gradings could be more easily constructed with less
segregation and lower total voids to minimise any further densification after opening a
pavement to traffic.
• Vibrating hammer compaction tests for determining target densities for RLT testing
indicated that the highest density occurred with an n-value of around 0.5 which is the
same as the theoretical maximum density curve.
• RLT testing on a TNZ M/4 basecourse from Pounds Road, Christchurch at gradings
with Talbot’s n-values of 0.3, 0.4, 0.55 and 0.8 showed that the best performance
(least rutting) in wet conditions was obtained with the coarse grading with an n-value
of 0.8. The best performance in dry test conditions was obtained at a finer grading
with an n-value of 0.3.

5. Conclusions
47
0
5
10
15
20
25
30
35
40
45
50
0 0.1 0.2 0.3 0.4 0.5 0.6 0.7 0.8 0.9
Talbot Grading Exponent, n
Whe
el P
asse
s N
(Mill
ion
ES
As)
to A
chie
ve
10m
m R
ut in
Agg
rega
te
Material 1 (Wet)
Material 1 (Dry)
Material 7+ 15% fines (Dry)
Material 7 (Wet)
Figure 5.1 Effect of Talbot grading exponent n (equation 1) on rutting performance for materials #1 and #7
• The RLT test results showed that Talbot’s n-values can vary by ±13% without greatly
affecting the resulting rutting performance.
• Based on varying the n-value by ±13% and limiting the amount of fines, a grading
boundary was determined around a RLT result where it was predicted the rut depth
performance would be nearly the same. This grading boundary is about half the variation
allowed for in the TNZ M/4 and RTA NSW 3051 specifications and additional RLT tests will
be required at the extremes of a grading envelope to establish practical production limits.
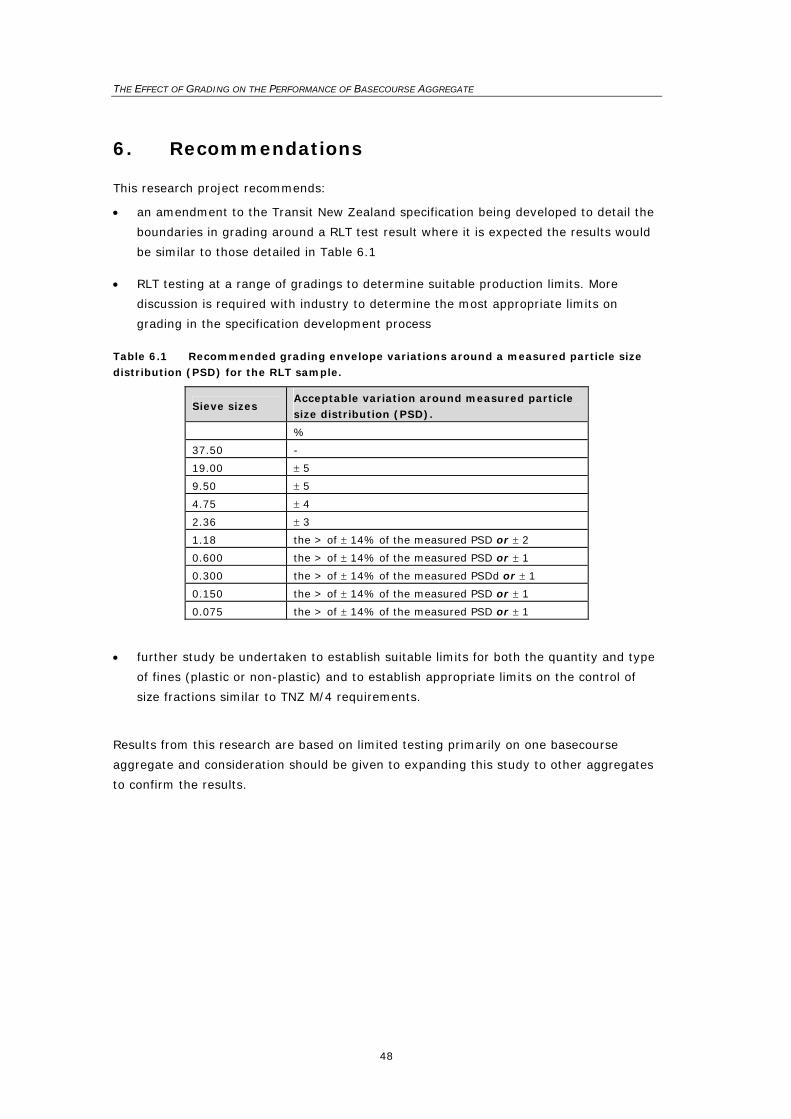
THE EFFECT OF GRADING ON THE PERFORMANCE OF BASECOURSE AGGREGATE
48
6. Recommendations
This research project recommends:
• an amendment to the Transit New Zealand specification being developed to detail the
boundaries in grading around a RLT test result where it is expected the results would
be similar to those detailed in Table 6.1
• RLT testing at a range of gradings to determine suitable production limits. More
discussion is required with industry to determine the most appropriate limits on
grading in the specification development process
Table 6.1 Recommended grading envelope variations around a measured particle size distribution (PSD) for the RLT sample.
Sieve sizes Acceptable variation around measured particle size distribution (PSD).
%
37.50 -
19.00 ± 5
9.50 ± 5
4.75 ± 4
2.36 ± 3
1.18 the > of ± 14% of the measured PSD or ± 2
0.600 the > of ± 14% of the measured PSD or ± 1
0.300 the > of ± 14% of the measured PSDd or ± 1
0.150 the > of ± 14% of the measured PSD or ± 1
0.075 the > of ± 14% of the measured PSD or ± 1
• further study be undertaken to establish suitable limits for both the quantity and type
of fines (plastic or non-plastic) and to establish appropriate limits on the control of
size fractions similar to TNZ M/4 requirements.
Results from this research are based on limited testing primarily on one basecourse
aggregate and consideration should be given to expanding this study to other aggregates
to confirm the results.

7. References
49
7. References
Allen J. 1973. The effect of non-constant lateral pressures of the resilient response of
granular materials. PhD Thesis. Urbana: University of Illinois.
Arnold, G. K. 2004. Rutting of granular pavements. PhD Thesis. Nottingham: University of
Nottingham.
Arnold, G., Werkmeister, S., and Alabaster, D. 2007. Performance tests for road aggregates
and alternative materials. Land Transport New Zealand Research Report. In press.
Barksdale, R. D. 1972. Laboratory evaluation of rutting in basecourse materials. In
Proceedings of the 3rd International Conference on the Structural Design of Asphalt
Pavements, London. pp. 161–174.
Barksdale, R. D. 1991. The aggregate handbook. Washington, DC: National Stone
Association.
Bartley, F. 2007. Total voids in unbound granular pavements. Land Transport New Zealand
Research Report. In press.
Belt, J., Ryynänen, T., and Ehrola, E. 1997. Mechanical properties of unbound base course.
In Proceedings of the 8th International Conference on Asphalt Pavements, Seattle, August
1997. Vol. 1 pp. 771–781.
Bennert, T., and Maher, A. 2003. The development of a performance specification for
granular base and sub-base materials, Piscataway, NJ: Department of Civil and
Environmental Engineering, The State University.
Bundesministerium für Verkehr. 1995. Zusätzliche Technische Vertragsbedingungen und
Richtlinien für Tragschichten im Straßenbau (Specification for UGM used in pavement
constructions – in German). ZTVT-StB 95:1995. Bonn: Bundesministerium für Verkehr.
Chan, F. W. K. 1990. Permanent deformation resistance of granular layers in pavements.
PhD Thesis. Nottingham: Department of Civil Engineering, University of Nottingham.
Cheung, L. W. 1994. Laboratory assessment for pavement foundation materials. PhD Thesis.
Nottingham: Department of Civil Engineering, University of Nottingham.
City of Geraldton. 2004. Specification for reinstatement of road reserve excavations.
Geraldton, Western Australia: Environmental and Infrastructure Services Department.
City of Winnipeg. 2006. Sub-grade, sub-base and base course construction. CW3110.
Winnipeg, Canada: The Public Works Department.
www.winnipeg.ca/finance/findata/matmgt/std_const_spec/current/Docs/CW3110.pdf
COLTO (Committee of Land Transport Officials). 1989. Standard specification for road and
bridge works for state roads, Section 3600: Crushed-stone base. Pretoria: Department of
Transportation.

THE EFFECT OF GRADING ON THE PERFORMANCE OF BASECOURSE AGGREGATE
50
Croney, D., and Croney, P. 1991. The design and performance of road pavements. 2nd ed.
Maidenhead, UK: McGraw Hill International.
Dawson, A. R., Thom, N. H., and Paute, J. L. 1996. Mechanical characteristics of unbound
granular materials as a function of condition. In Flexible Pavements, Proceedings of the
Euroflex Symposium 1993, A. G. Correia (Ed.). Balkema, Rotterdam: pp. 35–44.
Dodds, A., Logan, T., McLachlan, M., and Patrick, J. 1999. Dynamic load properties of New
Zealand basecourse. Transfund New Zealand Research Report 151.
FHWA. 2006. Seasonal variations in the moduli of unbound pavement layers. FHWA–HRT–04-
079. McLean, VA: Federal Highway Administration.
Haynes, J. G., and Yoder, E. J. 1963. Effects of repeated loading on gravel and crushed stone
base course materials used in the AASHO road test. Highway Research Record 39.
Washington, DC: Highway Research Board.
Highways Agency. 2004. Manual of contract documents for highway works, Vol. 1:
Specification for highway works. Series 800 Road pavements (11/04) Unbound Cement
and other hydraulically bound mixtures. United Kingdom: UK Highways Agency.
Holubec, I. 1969. Cyclic creep of granular materials. Report No. RR147. Ontario: Department
of Highways.
Kamal, M. A., Dawson, A. R., Farouki, O. T., Hughes, D. A. B., and Sha'at, A. A. 1993. Field
and laboratory evaluation of the mechanical behaviour of unbound granular materials in
pavements. Transportation Research Record 1406: 89–97.
Kolisoja, P. 1998. Large scale dynamic triaxial tests III. Tampere, Finland: Tampere
University of Technology.
Kolisoja, P., Saarenketo, T., Peltoniemi, H., and Vuorimies, N. 2002. Laboratory testing of
suction and deformation properties of base course aggregates, Transportation Research
Record 1787: 83–89.
Lay, M. 1984. Handbook of road technology. Vol. 1. Planning and pavements. New York:
Gordon and Breach Science Publishers.
Lekarp, F., Isacsson, U., and Dawson, A. R. 2000. State of the art. I: Resilient response of
unbound aggregates. Journal of Transport Engineering 126(1): 66–75.
Lekarp, F., Isacsson, U., and Dawson, A. 2000. State of the art. II: Permanent strain
response of unbound aggregates. Journal of Transport Engineering 126(1): 76–84.
Marek, C. R. 1977. Compaction of graded aggregate bases and subbases. In Proceedings,
The American Society of Civil Engineers 103: 103–113.
Maree, J. H., Freeme, C. R., Van Zyl, N. J., and Savage, P. F. 1982. The permanent
deformation of pavements with untreated crushed stone bases as measured in heavy
vehicle simulator tests. In Proceedings of the 11th ARRB Conference, Part 2: 16–28.

7. References
51
Roads and Traffic Authority. 1998. Unbound and modified base and sub-base materials for
surfaced road pavements. RTA NSW: 3051. New South Wales: Roads and Traffic
Authority.
Salt, G. 1977. The performance of unbound basecourses under simulated traffic. Road
Research Unit Project BC–15. Christchurch: Ministry of Works and Development.
Theyse, H. 2002. Stiffness, strength, and performance of unbound aggregate material:
Application of South African HVS and laboratory results to California flexible pavements.
Davis, California: University of California Pavement Research Center.
Thom, N. H., and Brown, S. F. 1988. The effect of grading and density on the mechanical
properties of a crushed dolomitic limestone. In Proceedings of the 14th ARRB Conference,
Part 7: 94–100.
Thom, N. H., and Brown, S. F. 1989. The mechanical properties of unbound aggregates from
various sources. UNBAR 3. Nottingham. pp. 130–142.
Thompson, M. R., and Smith, K. L. 1990. Repeated triaxial characterization of granular
bases, in Transportation Research Record 1278, Dynamic testing of aggregates and soils
and lateral stress measurements.
Transit New Zealand. 2006. Specification for basecourse aggregate. TNZ M/4:2006.
Wellington: Transit New Zealand.
Transport SA. 2007. Part 215 Supply of pavement materials. South Australia: Department of
Transport.
Van Niekerk, A. 2002. Mechanical behavior and performance of granular bases and sub-
bases in pavements. PhD Thesis, Delft: University of Technology.
VicRoads. 1998. Guide to general requirements for unbound pavement materials. Technical
bulletin no. 39. Melbourne: VicRoads.
Walaa, E. I. K., and El Hussein, M. 2004. Novel approach for characterisation of unbound
materials. Transportation Research Record 1874: 38–46.

THE EFFECT OF GRADING ON THE PERFORMANCE OF BASECOURSE AGGREGATE
52