Embed Size (px)
Citation preview

MICRODOSIMETRIC INVESTIGATIONS ATTHE FAST NEUTRON
THERAPY FACILITY AT FERMILAB
6M?CEIVEDBy JAU2M!B8
Katja Maria Langen OS7V
A DISSERTATIONSUBMITTEDIN PARTIALFULFILLMENTOF THE
REQUIREMENTSFOR THE DEGREE OF
MASTERDOCTOR OF PHILOSOPHY
(DEPARTMENT OF MEDICAL PHYSICS)
at the
UNIVERSITY OF WISCONSIN – MADISON
1997

DISCLAIMER
This report was preparedas an account of work sponsored by an agency of theUnited States Government. Neither the United States Governmentnor any agencythereof, nor any of their empioyc% makes any warranty, express or implied, orassumes any legal liability or responsibilityfor the accuracy,compictencssjor use-fulness of any information,apparatq product, or process d~iosed, or rc$rcscntsthat its usc would not infringeprivatelyowned rights. Reference hereinto any spe-cific commercial product,process,or service by trade name, trademark manufac-turer, or otherwisedoes not necessarilyconstitute or impiy its endorscmentjrecom-mendation, or favoring by the United States Governmentor any agency thereof.The views and opinions of authors expressed herein do not necesarily state orreflect those of the United States Governmentor any agency thereof.
.

DISCLAIMER
Portions of this document may be illegibleelectronic image products. Images areproduced from the best available originaldocument.

MICRODOSIMETRIC INVESTIGATIONS ATTHE FAST NEUTRON
THERAPY FACILITY AT FERMILAB
By
Katja Maria Langen
A DISSERTATIONSUBMITTEDIN PARTIALFULFILLMENTOF THE
REQUIREMENTSFOR THE DEGREE OF
DOCTOR OF PHILOSOPHY
(DEPARTMENT OF MEDICAL PHYSICS)
at the
UNIVERSITY OF WISCONSIN – MADISON
1997

1
NIICRODOSIMETRICIN VEST IGATION SAT
THE FAST NEUTRON
THERAPY FACILITY AT
Katja Maria Langen
Under the supervision of Professor Paul
At the LTniversity of Wisconsin –
FE RMIL.4B
M. DeLuca, Jr.
Madison
Abstract Microdosimetry was used to investigate three issues at the neutron
therapy facility (NTF) at Fermilab.
Firstly, the conversion factor from absorbed dose in A-150 tissue equivalent
plastic to absorbed dose in ICRU tissue was determined. For this, the effective
neutron kerma factor ratios, i.e. oxygen to A-150 tissue equivalent plastic and
carbon to A-150 tissue equivalent plastic, were measured in the neutron beam. An
A-150 tissue equivalent plastic to ICRU tissue absorbed dose conversion factor of.
0.92 & 0.04 was determined.
Secondly, variations in the radiobiological effectiveness (RBE) in the beam
were mapped by determining variations in two related quantities, e* and 1?, with
field size and depth in tissue. Maximal variation in e* and R of 9 % and 15 %
respectively were determined.
Lastly, the feasibility of utilizing the boron neutron capture reaction on boron-10
to selectively enhance the tumor dose in the NTF beam was investigated. In the -
unmodified beam, a negligible enhancement for a 50 ppm boron loading was mea-
sured. To boost the boron dose enhancement to 3 70 it was necessary to change
the primary proton energy from 66 MeV to 37 MeV and to filter the beam by 90
mm of tungsten.

ii
The feasibility of measuring microdosimetric spectra in the NTF beam was
proven and its usefulness demonstrated.

. . .111
I would like to thank my advisor, Professor Paul M. DeLuca, Jr., for the guidance,
support and opportunities that I have received from him during the last five years.
To work for him was very inspiring and a lot of fin. Many thanks also to Drs.
Alan Ross and Tim Bohm for their help with the Monte Carlo calculations and
with various UNIX problems.
During my time at Ferrnilab I have received help from numerous people. I would
like to thank Dr. Arlene Lennox, head of the neutron therapy facility (NTF), for
her continuing support of this project. Thanks to Tom Kroc and the rest of the
NTF staff for helping me with many details. I’d like to thank Larry Allen for
tuning the NTF beam so many times, particularly for tuning the beam twice last
New Year’s eve. I thank Lester Wahl for helping with many equipment problems.
I am grateful to Chuck Schmidt for thinking of an alternative method to reduce
the NTF dose rate which has saved me uncountable hours. I also appreciate the
friendliness ,and helpfulness of all the main control room crews.
On a personal note, I thank my parents for their encouragement and for com-
plaining so very little about my absence. My sister-in-law, Birgit, and my brother,
Georg, I thank for helping me in so many ways.
I appreciate the financial support of this project through Ferrnilab’s Beam
Division’s Ph.D. program.
iv
List of Figures
1
2
3
4
5
6
7
8
9
10
11
12
13
14
15
16
17
18
19
20
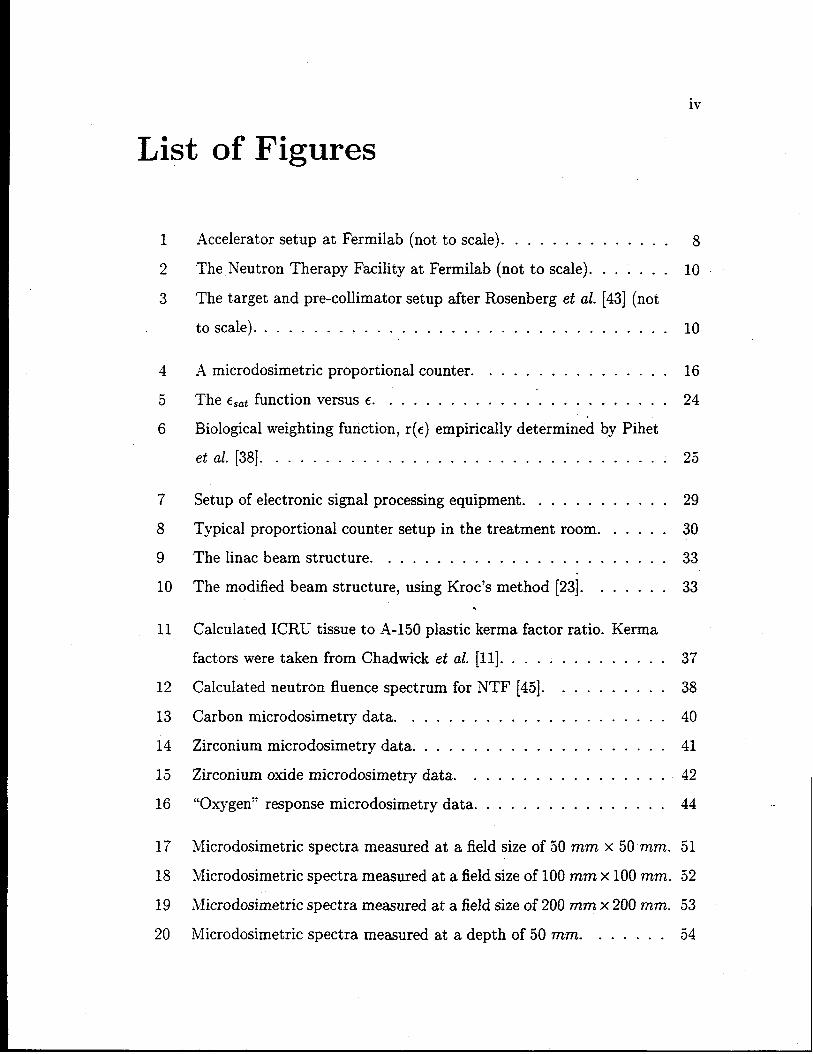
Accelerator setup at Fermilab (not to scale). . .‘ . . . . . . . . . . . 8
The Neutron Therapy Facility at Fermilab (not to scale). . . . . . . 10
The target and pre-collimator setup after Rosenberg et al. [43] (not
to scale) . . . . . . . . . . . . . . . . . . . . . . . . . . . . . . . ...10
A microdosimetric proportional counter. . - . . . . . . . . . . . . . 16
ThecSat function versus~. ~ . . . . . . . . . . . .. . . . . . . . . . . 24
Biological weighting function, r(e) empirically determined by Pihet
etd. [38]. . . . . . . . . . . . . . . . . . . . . . . . . . . .
Setup of electronic signal processing equipment. . . . . . .
Typical proportional counter setup in the treatment room.
Thelinac beam structure. . . . . . . . . . . . . . . . . . .
The modified beam structure, using Kroc’s method [23]. ..
Calculated ICRU tissue to A-150 plastic kerma factor ratio.
factors were taken from Chadwick et al. [11]. . . . . . . . .
Calculated neutron fluence spectrum for NTF [451. . . . .
Carbon microdosimetry data. . . . . . . . . . . . . . . . .
Zirconium microdosimetry data. . . . . . . . . . . . . . . .
Zirconium oxide microdosimetry data. . . . . . . . . . . .
“Oxygen” response microdosimetry data. . . . . . . . . . .
. . . . . 25
. . . . . 29
. . . . . 30
. . . . . 33
. . . . . 33
Kerma
. . . . . 37
. . . . . 38
. . . . 40
. . . . . 41
. . . . . 42
. . . . 44
Microdosirnetric spectra measured at a field size of 50 mm x 50 mm. 51
Microdosimetric spectra measured at a field size of 100 mm x 100 mm. 52
lklicrodosimetric spectra measured at a field size of 200 mm x 200 mm. 53
.Nlicrodosimetric spectra measured at a depth of 50 mm. . . . . . . 54

21
22
23
24
25
26
27
28
29
30
31
32
33
34
Microdosimetric
Microdosimetric
v
spectra measured at a depth of 100 mm. . . . . . . 55
spectra measured at a depth of 150 mm. . . . . . . 56
Spectra measured at 150 mm depth in a 50 mm x 50 mm fieki and
50mmdepth ina200mmx200mm field. . . . . . . . . . . . . . 57
Geometry used for Monte Carlo calculations. . . . . . . . . . . . . . 64
Side view of counter setup in the treatment room for the open field
BNC measurements . . . . . . . . . . . . . . . . . . . . . . . . ...66
Microdosimetric spectra measured in the unmodified beam. . . . . . 67
Results of MCNP calculations on the effect of tungsten filtration of
the NTF beam . . . . . . . . . . . . . . . . . . . . . . . . . . . ...68
Side view of counter setup in the treatment room for the tungsten
filtered beam BNC measurements. . . . . . . . . . . . . . . . . . . . 69
Microdosimetric spectra measured in the tungsten filtered beam. . .. 70
Side view of counter setup in the treatment room for the steel col-
limated BNC measurements . . . . . . . . . . . . . . . . . . . . ...71
Microdosimetric spectra measured in the steel block collimated field. 72
.Microdosimetric spectra measured in the steel block collimated and
tungsten filtered field . . . . . . . . . . . . . . . . . . . . . . . ...73
Microdosimetric spectra measured in the 37 MeV and tungsten fil-
tered beam . . . . . . . . . . . . . . . . . . . . . . . . . . . . . . . .74
A-150 microdosimetric spectra measured in the modified and un-
modified beam . . . . . . . . . . . . . . . . . . . . . . . . . . . ...75
vi
List of Tables
1
2
3
4
5
6
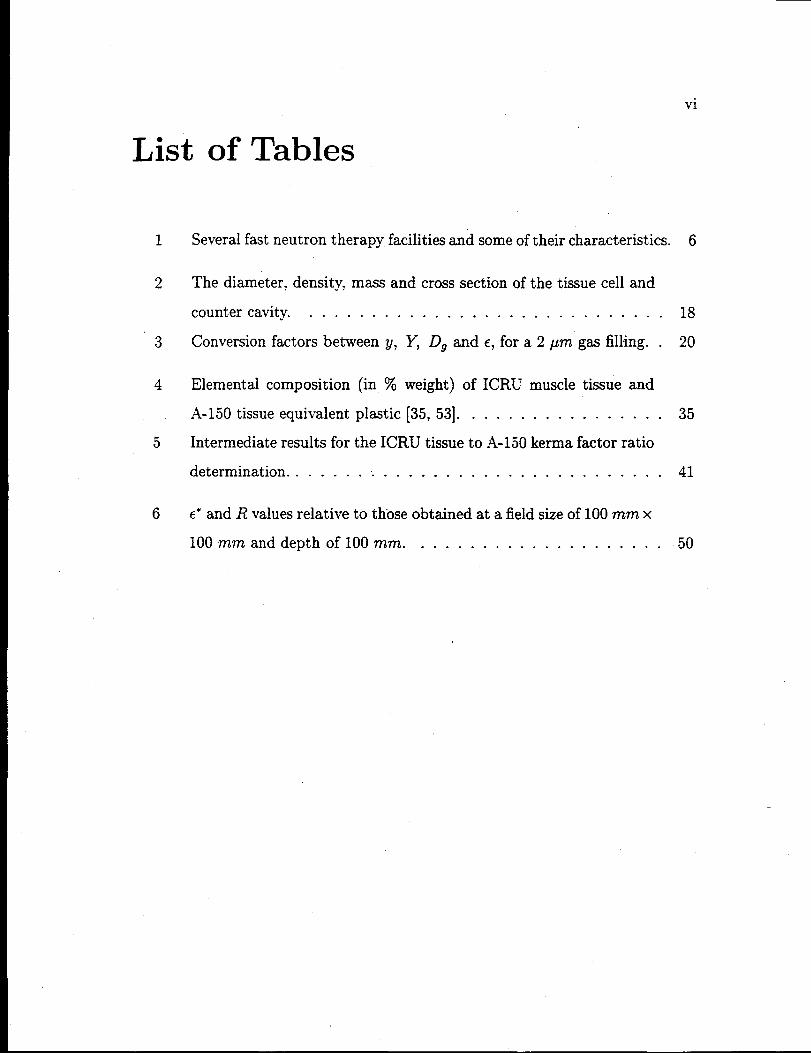
Severai fast neutron therapy, facilities andsome of their characteristics. 6
Thediameter, density, mass andcross section of thetissue cell and
counter cavity . . . . . . . . . . . . . . . . . . . . . . . . . . . ...18
Conversion factors betweeny, Y, D~ande, fora2prn gas filling. . 20
Elemental composition (in % weight) of ICRU muscle tissue and
A-150 tissue equivalent plastic [35, 53]. . . . . . . . . . . . . . . . . 35
intermediate results for the ICRU tissue to A-150 kerma factor ratio
determination . . . . . . . .. . . . . . . . . . . . . . . . . . . . ...41
e’ and 1?values relative to those obtained at a field size of 100 mm x
100mmand depth of100mnz. . . . . . . . . . . . . . . . . . . . . 50

vii
Contents
Abstract
Acknowledgements
1
2
3
4
5
Introduction
Neutron Therapy
2.1 Development . .
2.2 Rationale . . . .
,..
,..
. . .
. . .
2.3 Neutron Therapy Facility (NTF) at Fermilab
Microdosimetry
3.1
3.2
3.3
3.4
3.5
3.6
3.7
3.8
3.9
Introduction . . . . . . . . . .
Neutron Interactions . . . . .
Absorbed Dose Determination
Instrumentation . . . . . . . .
Volume Simulation . . . . . .
Counter Calibration. . . . . .
Data Analysis . . . . . . . . .
Qualitative Information. . . .
Uncertainties . . . . . . . . .
Experimental Methods
4.1 Data Acquisition . . . . . . .
4.2 Dose Rate Reductions . . . .
. . . .
. . . .
. . . .
. . . .
. . . .
. . . .
. . . .
. . . .
. . . .
. . . .
. . . .
Relative Carbon and Oxygen Kerma Factor
5.1 Introduction . . . ..-. . . . . . . . . . . .
5.2 Correction of A-150 Reading . . . . . . - . .
. .
. .
. .
. .
. .
. .
. .
. .
. .
. .
. .
. .
. .
. .
Ratios
. . . . .
. . . . .
. . . . .
. . . . .
. . . . .
. . . . .
. . . . .
. . . . .
. . . . .
. . . . .
. . . . .
. . . . .
. . . . .
. . . . .
. . . . .
. . . . . .
. . . . .
. . . . .
i
. . .Ill
1
5
5
7
7
11
11
11
12
15
17
18
20
23
25
28
28
31
34
34
35

. ..Vlu
38
39
45
46
46
48
49
49
49
58
60
60
61
62
62
64
65
69
76
78
5.3 Measurements . . .
5.4 Results . . . . . . .
5.5 Discussion . . . . .
. . . . . .
. . . . . . .
. . . . . . .
. . . .
. .
. .
. .
. .
. .
<
. .
. .
. .
. .
. .
. .
. .
. .
. .
,.
6 Beam Characterization
Introduction . . . . .6.1
6.2
‘ 6.3
6.4
6.5
6.6
. . . . . . .
RBE variations with depth in tissue .
RBE variations with field size .
Measurements . . . . . . . .
. .
. .
. .
. .
. .
. .
. .
. .
. .
. .
. .
. .
. .
. .
Results . . .
Discussion .
. . . . . . .
. . . . . . .
7 Boron Neutron Capture
7.1
7.2
7.3
7.4
7.5
7.6
7.7
Introduction . . . . . . .
Clinical rationale . . . .
BNC in fast neutron beams
Beam Modifications . . .
. .
. .
. .
. . .
. . .
. . .
. . .
. . . .
. . . .
,.. .
Results . . .
Discussion .
8 Conclusions
Bibliography

1
Chapter 1
Introduction
The neutron therapy facility (NTF) at the Fermi NationaI Accelerator Laboratory
has been treating cancer patients since 1976. During more than twenty years of
operation over 2300 patients have been treated and a wealth of clinical experience
has been accumulated. Therefore the “clinical effects of the neutron beam are well
known and characterized.
Several important physical characteristics of the beam can be determined with
ion chamber measurements. For example, central axis depth dose and off-axis dose
ratios were quantified using an A-150 ion chamber [43]. There are, however, some
physical characteristics that were thus far not directly determined in the NTF
beam. These include the A-150 tissue equivalent plastic to ICRU tissue absorbed
dose ratio. A calculation of this factor requires large amounts of data that are
not completely available. Furthermore, qualitative variations of the neutron beam
with irradiation conditions were investigated only sparsely in the NTF beam [19].
lMicrodosimetry can be used to investigate several issues, including the above, in a
neutron beam, since it provides quantitative as well as qualitative information on
the absorbed dose deposited in a neutron beam.
Microdosimetric measurements are acquired in a pulse mode and they”require a
sufficiently low dose rate to minimize pulse pile-up. The beam structure at NTF is
such that it results in a very low duty cycle and the instantaneous dose rate within
the beam pulse is consequently very high. The instantaneous dose rate needs to be
reduced drastically to allow the measurement of microdosimetric data. This fact
has thus far prohibited the utilization of microdosimetry in the NTF beam.
2
The neutron therapy facility is part of Fermilab where a chain of accelerators
provides a high energy proton beam primarily for research purposes. NTF uses
protons from the linear accelerator (linac) when they are not needed for injection
into a downstream booster synchrotrons. The linac beam structure is dictated by
the booster operation and a modification of it is not practical.
This thesis was initiated when a technique was developed to reduce the instan-
taneous dose rate sufficiently by modifying the intensity of beam pulses designated
for NTF. Unfortunately this technique also further reduces the duty cycle of the
beam, necessitating long data acquisition times. During the course of this project
another technique was developed where the original duty cycle is maintained while
the instantaneous dose rate is reduced to a level that allows microdosimetric meas-
urements to be taken. This latter technique was used to acquire the microdosimetric
data presented in this thesis. These measurements are the first microdosimetric,
measurements taken in the NTF beam;
Employing microdosimetric techniques, several characteristics of the neutron
therapy beam were investigated and a feasibility study on the utilization of boron
neutron capture in the NTF beam was performed.
One investigation focused upon the conversion factor that relates absorbed dose
in ICRU (International Commission on Radiation Units and lleasurements) tissue
to absorbed dose in A-150 plastic. The former is the most important quantity in
radiation therapy while the latter is routinely measured for calibration purposes in
neutron beams. A calculation of this factor is possible but requires kerma factor
ratio values for all relevant neutron energies as well as knowledge of the neutron
energy spectrum. Kerma factor ratios are only sparsely available for neutron en-
ergies above 30 MeV. In a recent study,, Monte Carlo calculations were used to
calculate the energy spectra for various facilities including NTF [45]. In this thesis
microdosimetry was used to directly measure the quantities needed to determine
the absorbed dose in ICRU tissue to absorbed dose in A-150 plastic conversion

3
factor.
In a second investigation we used
crodosimetric measurements to map
the qualitative information provided by mi-
changes in the radiobiological. effectiveness
(RBE) of the beam. Traditionally, the RBE of a beam is determined by irradia-
tion of cell cultures in both the beam of interest and in a reference beam. These
experiments are very time consuming. Alternatively, microdosimetry offers the
possibility of performing physical measurements that can be related to the bio-
logical effectiveness of the beam. The RBE, for a given biological endpoint, of
a neutron beam depends on the neutron energy spectrum which changes slightly
with beam parameters such as field size and depth in tissue. The influence of both
these parameters on the radiation quality were investigated in the Fermilab beam.
Last, a feasibility study on the use of boron neutron capture therapy (BNCT)
in the NTF beam was performed. The ultimate goal in radiation therapy is to
deliver a lethal absorbed dose to tumor tissue, but for each treatment modality
the absorbed tumor dose is eventually limited by the absorbed dose given to sur-
rounding normal tissue in the course of treatment. The aim of treatment planning
is to deliver a maximal amount of absorbed dose to the tumor while minimizing
the absorbed dose to normal tissue. An approach to conform dose to tumor tissue
is to selectively sensitize the tumor tissue thereby improving the tumor to normal
tissue dose ratio. Boron neutron capture therapy is based on this method. When
tumor tissue is selectively loaded with a boron compound and exposed to ther-
mal neutrons the neutron capture reaction on boron 10, which results in two short
range densely ionizing particles, can be used to selectively enhance the tumor dose.
We explored the possibility of using this method to enhance the tumor dose in -
Fermilab’s fast neutron therapy beam. The dose enhancement can be calculated if
the boron concentration in the tumor as well as in normal tissue and the thermal
neutron fluence at the tumor location are known. Instead, the boron dose enhance-
ment was measured directly using a tissue equivalent microdosimetric counter with

4
a boron-loaded wall and a regular tissue equivalent microdosimetric counter.
It is a further aim to increase the boron dose boost in the neutron beam. Besides
increasing the boron concentration one can try to increase the thermal neutron
fluence at the tumor location to get a further enhancement. The latter method
necessitates a change in the neutron energy spectrum. This can be achieved by
either beam filtration or by an alteration of the primary neutron energy spectrum.
Both options were investigated in the NTF beam. Microdosimetric measurements,
to determine the boron dose enhancement, were performed in the modified beams.
This thesis is divided into eight chapters. T~e following two chapter provide
background information on neutron therapy and microdosimetry. The fourth chap
ter describes the experimental setup used. Following are three chapters that each
deal with one of three investigations. A conclusion chapter is last.

5
Chapter 2
Neutron Therapy
2.1 Development
When the first patient was treated with neutrons at Lawrence Berkeley Laboratory
in 1938 little was known about the radiobiology of neutrons, except that for the
same exposure neutron irradiation resulted in a greater biological effect than x-ray
irradiation. First, single large dose treatments were applied until a new cyclotron
became available for clinical work, permitting fractionated therapy [55]. A total
of 250 patients were treated until 1943 when the project was halted by World War.
II. In 1948, after studying the clinical results, Stone concluded that the neutron
therapy treatments resulted in such severe late side effects that they should not be
continued [54].
Interest in neutron therapy rose again at the Hammersmith Hospital in London
some twenty years later, after it became apparent that the oxygen enhancement
ratio (OER) for neutrons was reduced compared to x-rays and many tumors, par-
ticularly larger tumors, were thought to contain a hypoxic cell fraction. This group
re-investigated Stone’s clinical results and attributed the severe late effects in part
to the increased radiobiological effectiveness (RBE) of neutrons with decrease in
the dose per fraction [13]. After extensive radiobiological experiments neutron
therapy treatments were started in the late sixties at Hammersmith. Initial clin- -
ical results were promising and this triggered the installation of several neutron
therapy facilities in the US and Europe.
Subsequent clinical trials could not reproduce the initial Hammersmith results.
The majority of these new facilities were built around existing accelerators which
Facility iNeutron Reaction Comments
Seattle, WA p(50)Be Isocentric Gantry?vlultileaf Collimator
Batavia, IL . p(66)Be Horizontal BeamlineDetroit, MI d(48.5)Be Isocentric Gantry
Multirod CollimatorSeoul, Korea d(51)Be Isocentric Gantry
Faure, South -Africa p(66)Be Isocentric GantryVariable Collimator
Louvain-La-Neuve, Belgium p(65)Be Vertical BeamlineMultiIeaf Collimator
1-
6
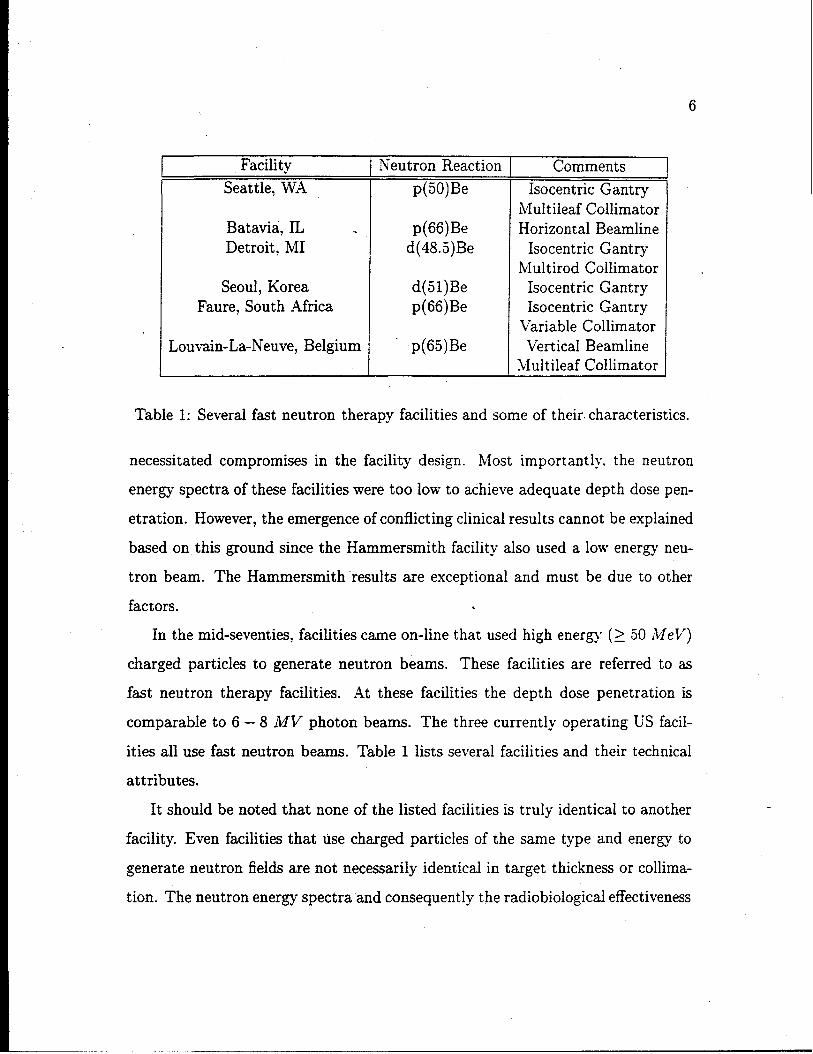
Table 1: Several fast neutron therapy facilities and some of their. characteristics.
necessitated compromises in the facility design. Most importantly, the neutron
energy spectra of these facilities were too low to achieve adequate depth dose pen-
etration. However, the emergence of conflicting clinical results cannot be explained
based on this ground since the Hammersmith faciIity also used a low energy neu-
tron beam. The Hammersmith “results are exceptional and must be due to other
factors. .
In the mid-seventies, facilities came on-line that used high energ (~ 50 MeV)
charged particles to generate neutron beams. These facilities are referred to as
fast neutron therapy facilities. At these facilities the depth dose penetration is
comparable to 6 – 8 MV photon beams. The three currently operating US facil-
ities all use fast neutron beams. Table 1 lists several facilities and their technical
attributes.
It should be noted that none of the listed facilities is truly identicai to another
facility. Even facilities that tise charged particles of the same type and energy to
generate neutron fields are not necessarily identical in target thickness or collima-
tion. The neutron energy spectra and consequently the radiobiological effectiveness

7
of the beam can be influenced by all these parameters and unless facilities are iden-
tical in all aspects clinical results from different facilities have to be compared with
caution [59].
2.2 Rationale
The radiobiological rationale of neutron therapy has evolved since treatments com-
menced again at Hammersmith. The importance of the reduced oxygen enhance-
ment ratio (OER) was questioned when it was discovered that some hypoxic cells
reoxygenate during fractionated treatment [56]. Reoxygenation is slower in slow
growing tumors which indicates an enhanced sensitivity of slowly growing tumors
to neutron therapy [58]. In addition, the radiosensitivity variation over a cell cycle
that exists for photon irradiation is less pronounced for neutron irradiation. Cells
that have a long cell cycle, i.e., they are slow growing and have a longer G1 phase
in which they are relatively insensitive to photon irradiation, are less protected if
irradiated with neutrons [16].
The clinical value of neutron therapy is still urider investigation. Its advantage
in the treatment of locally advanced inoperable salivary gland tumors is gener-
ally accepted [15]. Studies point towards an advantage of neutron therapy in the
treatment of locally advanced prostate cancer [24, 47]. Next to these, there are
other tumors that can be treated with neutron therapy. Wambersie estimates
that 10 – 1570 of all referred radiotherapy patients can benefit from neutron ther-
apy [58, 60]. This number also stresses the need for proper patient selection.
2.3 Neutron Therapy Facility (NTF) at Fermilab
Unlike other facilities, NTF utilizes protons from a linear accelerator in a parasitic
mode. The proton linac is part of a series of accelerators that eventually accelerate
protons up to 900 GeV. Its primary function is to accelerate 750 keV protons to

8
Neutron Thempy Fixed Target Exp&imente
Facili@ (66MeV)
Cockcroft-Walton (750 keV) A
LARC (400 MeV’)~
Booster (8 GeV)~
hti Proton Ring P %foin Bing (150 Gev)
Tevatron (900 GeV)
Figure 1: Accelerator setup at Fermilab (not to scale).
an energy of 400 MeV and then inject them into a booster synchrotrons. After
being further accelerated in the booster synchrotrons the protons enter the main
accelerator ring before being finally injected into the tevatron. Since the booster
requires injection only for a fraction of time, protons are available for neutron
therapy the rest of the time. Figure 1 shows the layout of the acceleration chain
at Fermilab.
Since NTF was built at an existing and operating proton linac its design had to
be compatible with the accelerator operation. The Iinac is four feet below ground
level and for economical reasons it was decided to treat patients at the linac level
and to use one of the three existing freight elevators to move patients down to
that level. Freight elevators are located at the beginning, middle and end of the
Iinac building. At the time when NTF was designed, protons at these locations
had an energy of 750 keV, 99 MeV and 200 MeV respectively. Based on these
energies the freight elevator that is located at the middle of the Iinac building
was chosen to be used for neutron therapy [26]. At the time, the linac itself was

9
divided into nine linac tanks and beam can only be extracted between two linac
tanks. The chosen elevator is located between Iinac tank four and five. Protons
exiting tank four have an energy of 99 MeV. However, the space between the linac
tanks is such that with a conventional magnet only protons Up to 65-70 MeV could
be cleanly extracted [28]. Protons leaving Iinac tank three have an energy of 66
MeV and in order to use these protons, Iinac tank four is turned off while beam
pulses designated for NTF are passing through. After drifting through tank four
protons for NTF are extracted using a magnet that bends protons by 58 degrees.
The first dipole is followed by a second dipole to complete a 90 degree bending
of the beam. The beam exits through a shielding wall before impinging onto a
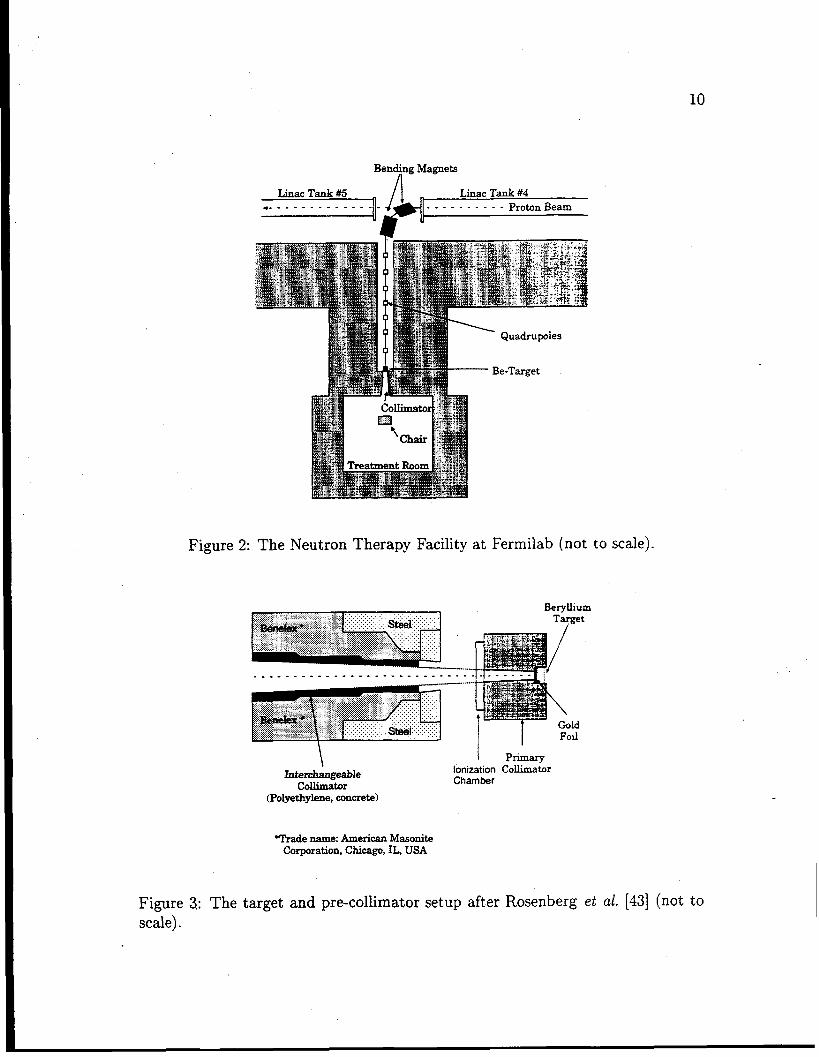
beryllium target. Figure 2-illustrates the beam-line design of the facility. In the
early nineties the proton linac was upgraded to accelerate protons to 400 MeV but
this did not interfere with NTF operations since all upgrades were implemented
downstream of NTF.
A patient is set up at ground level where a laser array is used to simulate the
beam isocenter. For treatment the elevator is lowered to the Iinac level where
an equivalent laser array is used to position the patient. After the treatment is
completed the elevator is raised again to the ground level.
For the Fermilab facility a 22.1 mm thick beryllium target was chosen in which
66 MeV protons lose 49 MeV. This configuration is abbreviated as pee. .
The residual proton energy is absorbed in a 0.5 mm gold foil [43]. The collimation
system consists of a primary collimator that is followed by a secondary assembly in
which interchangeable collimators for different field sizes can be placed. Figure 3
illustrates the target and collimator design. The total length of the collimation -
system is 1.09 m with a target to isocenter distance of 1.90 m [43]. Due to the fixed
horizontal beam line the patient sits in a chair or stands on a pIatform at isocenter.
Typical dose rates at isocenter are 40 rad/min or 0.4 Gy/min at 100 mm depth
in tissue equivalent liquid.
10
Bending Magneta
=Y=l#=u-”- - ‘V:;:’n’eam
Figure2: The Neutron Therapy Facility at Fermilab (not to scale).
\ I Primary
InterdngeableCollimator
Ionization CollimatorChamber
(Polyethylene,concrete)
Vrade narw American MaaoniteCorporation,Chicago, II+ USA
Figure 3: The target and pre-collimator setup after Rosenberg et al. [43] (not toscale).

11
Chapter 3
Microdosimetry
3.1 Introduction
Nficrodosimetry is the study of energy deposition events on a micrometer scale. A
micrometer size cell volume is simulated by filling a centimeter size cavity with
tissue equivalent gas to a low pressure such that charged particles crossing the gas
cavity lose an equal amount of energy in the gas and in a micrometer size tissue
volume. The amount of energy lost by a ckiarged particle per unit path length,
i.e., the stopping power, depends on the particle type and energy. The frequency
distribution of enerW deposition events collected in the counter is therefore a direct
consequence of the charged particle spectrum crossing the counter cavity which is
itself intimately connected to the primary radiation spectrum. In neutron fields,
the shape of a microdosimetric spectrum is correlated with the radiation quality
of the primary field [30]. Microdosimetry therefore provides quantitative as well as
qualitative information on the energy deposited in a materiaI in a radiation field.
It can be applied in any radiation field but it is especially powerful in neutron
fields due to the large variety of secondary particles generated in these fields.
3.2 Neutron Interactions
Neutrons deposit their energy indirectly by interaction with the nuclei of the ir-
radiated material. As a result of these nuclear interactions, secondary particles
(protons, alphas, heavy recoils) are generated. These secondary charged particles
then deposit their energy in the absorbing material. Type and probability of a
-....
12
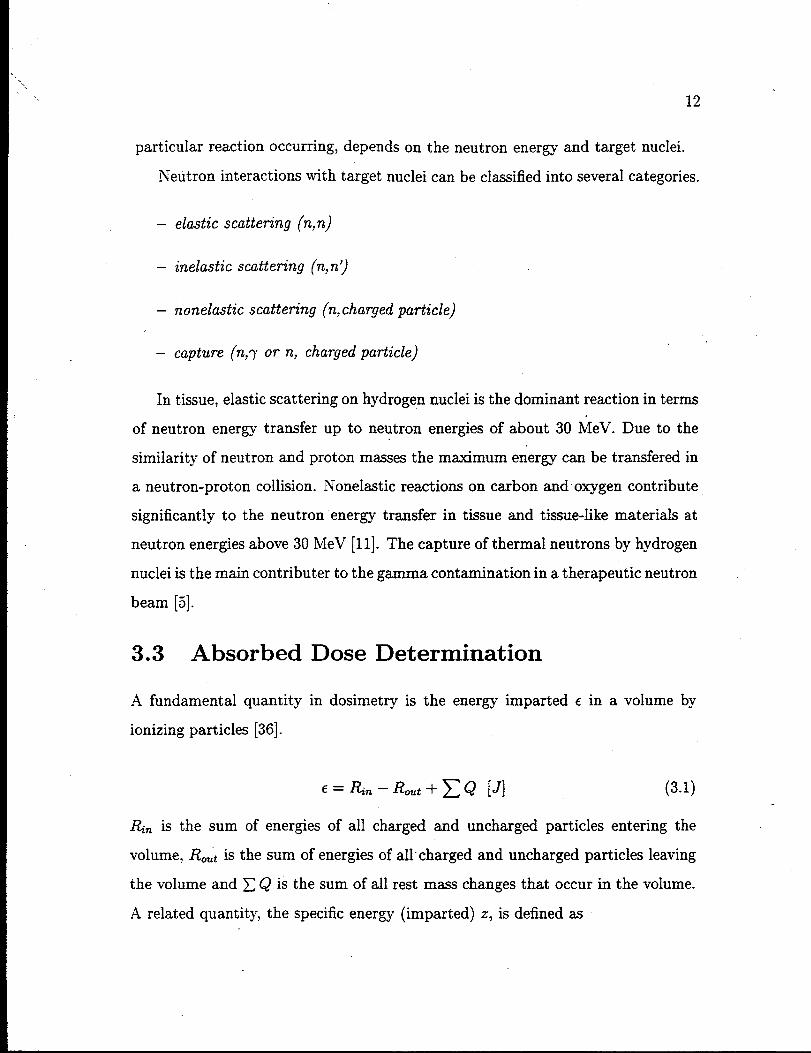
particular reaction occurring, depends on the neutron energy and target nuclei.
Neutron interactions with target nuclei can be classified into several categories.
— elastic scattering (n,n)
— inelastic scatten”ng (n, n’)
– nonelastic scattering (n, charged particle)
capture (n,~ or n, charged particle)
In tissue, elastic scattering on hydrogen nuclei is the dominant reaction in terms
of neutron energy transfer up to neutron energies of about 30 MeV. Due to the
similarity of neutron and proton masses the maximum energy can be transfered in
a neutron-proton collision. Nonelastic reactions on carbon and oxygen contribute
significantly to the neutron energy transfer in tissue and tissue-like materials at
neutron energies above 30 MeV [1I]. The capture of thermal neutrons by hydrogen
nuclei is the main contribute to the gamma contamination in a therapeutic neutron
beam [5].
3.3 Absorbed
A fundamental quantity
ionizing particles [36].
Dose Determination
in dosimetry is the energy imparted e in a volume by
(3.1)
&. is the sum of energies of all charged and uncharged particles entering the
volume, Rm~ is the sum of energies of all charged and uncharged particles leaving
the volume and ~ Q is
A related quantity, the
the sum of all rest mass changes that occur in the volume.
specific energy (imparted) z, is defined as
z = ~ [Jkg-l]m
where e is the energy imparted to a mass m [36].
The absorbed dose D is defined to be
13
(3.2)
(3.3)
where d ~ is the mean energy imparted to the mass dm [36]. The absorbed dose
D is related to the mean specific energy,
(3.4)
by
D={n& (3.5)
where f(z) is the frequency distribution of z. The absorbed dose is defined as the
energy imparted in an infinitesimal volume at a point and dm is the mass of this
volume. The absorbed dose is therefore the expectation value of the specific energy
z. A measurement of absorbed dose is really a measurement of the absorbed dose
averaged over a volume with mass dm. The imparted energy e and specific energy z
are both stochastic quantities whereas as the mean specific energy ~ and absorbed
dose D are non-stochastic quantities [36].
Kerma, K, is the amount of kinetic energy d13tTgiven to charged particles by
indirectly ionizing radiation per unit mass.
(3.6)~ = dEtr
~ [Jkg-’] or [Gy]
The absorbed dose refers to the absorption of energy in matter whereas kerma
refers to the transfer of energy to charged particles in matter. Under charged

14
particle equilibrium (CP13) conditions, kerma is numerically equal to absorbed
dose which can be measured by a variety of methods.
Kermac~~ Dose [Gg] (3.7)
CPE conditions exist when the secondary ~arged particle energy spectrum enter-
ing a volume is equal to the charged particle energy spectrum leaving the volume,
i.e. the energy given to charged particles in a volume is equal to the energy de-
posited in the volume by charged particles.
Using cavity theory formalism [1] the absorbed dose measured in a material
g can be related to the absorbed dose in a material w. The absorbed dose D in
material w is equal to
Dw()
=@x =dl p .,w
[Gy] (3.8)
where @ is the charged particle fluence and (#$)C,W the mass collision stopping
power in material w. Near the interface between material w and g, the charged
particle fluence can assumed to be constant. The ratio of absorbed dose in the
materials is then
(3.9)
Using S /p to denote the average mass collision stopping power of a charged
particle spectra, equation 3.9
The ratio of dose in material
can be rewritten for a spectrum of charged particles.
w to dose in material g
_ = (9P)wDw
D~ = (+.(WP),
is
(3.10)
This is known as the Bragg-Gray relation [1]. This principIe can be extended to a
gas filled cavity and in a material. A constant charged particle fluence in the cavity
15
and throughout the material, is the underlying condition and has to be fulfilled.
To achieve this certain conditions must be true.
1. The charged particle fluence is not perturbed in the gas cavity, i.e., the size
of the gas cavity is small compared to the secondary particle range.
2. The dose to the gas is only due to particles crossing the gas cavity (Only for
dissimilar gas and wall materials).
The second Bragg-Gray condition is difficult to fulfill for counters exposed to
a neutron fluence. This introduces some uncertainty to the dose determination.
3.4 Instrumentation
Microdosimetric spectra were measured with low
(manufactured by Far West Technology, Goleta,
pressure proportional counters
California, USA), also called
Rossi-counters. The design was first developed by Rossi et al. [46] in the fifties.
Figure 4 is a diagram of a typical counter. Counters are spherical with a 12.7 mm
inner diameter. Walls can be made of several materials of interest and are typically
1.27 mm thick. Most commonly counters are used to measure absorbed” dose in
A-150 tissue equivalent (TE) plastic and are therefore made with TE walls. Coun-
ters were filled with isobutane based tissue equivalent gas (elemental composition
in percentage weight is H:1O.3, C:59.2, N:3.5, 0:26.9 [49]) to a low pressure (66
Torr) to simulate a 2 pm diameter sphere of unit density tissue. The counter wall
is grounded and the anode is biased to +600 VDC. A helical grid which is biased to
20 % of the anode voltage is centered around the anode to correct for field inhomo-
geneities at the anode entrance and exit to the cavity. An internal alpha particle
source can be used for calibration purposes. The whole assembly is encapsulated
in a vacuum-tight aluminum housing.

16
Gas evacuation
244cmt-Source
At Vacuum Housing
holeO. D. = 21 cm
~ “ickn~ = 0.0”8
I
Anode Bias Wire
Helix Mae Wire=$
cm
/1.27 CITl L 0.
w ~ AJu~inum
I Al TubeO. D. = 0.64 cm
/L D.=”.”6-n
\
Figure 4: A microdosimetric proportional counter.
17
Radiation interacts with the wall material and secondary charged particles
enter the cavity where they produce ionization in the counting gas. Electrons
travel towards the anode where gas multiplication occurs. A pulse with amplitude
proportional to the number of electrons produced in the counting gas is induced at
the anode. The counter is operated in pulse mode and the pulse height distribution
is collected and stored.
3.5 Volume Simulation
Microdosimetric counters are filled with low pressure gas to simulate a 2 pm tissue
volume. This means that a charged particle loses the same amount of energy ;
when it crosses the gas cavity diameter and when it goes through 2 pm of unit
density tissue, i.e.
:= dg x (;)gx A = d, x (~)tx p, [MeV] (3.11)
where d is the sphere diameter, ($) is the collision mass stopping power, p is the
density and subscripts g and t indicate gas and tissue. For a particle of the same
type and energy passing through the same material,
dgxpg=dtxpt
or
4pg = ~ x p~ [g/cmS].‘J’9
This allows us to define a factor k:.
equation 3.11 reduces to
(3.12)
(3.13)
(3.14)
18
Quantity Tissue cell Counter cavity
Diameter [m] 2 x 10⁻⁶ 12.7 X 10⁻³Density [kg/m3] 1 x 10³ 157.5 x 10⁻³Mass [kg] 4.19 x 10⁻¹⁵ 169 X 10-9Cross section [m*] 31.4 x 10⁻¹³ 1.27 X 10⁻⁴
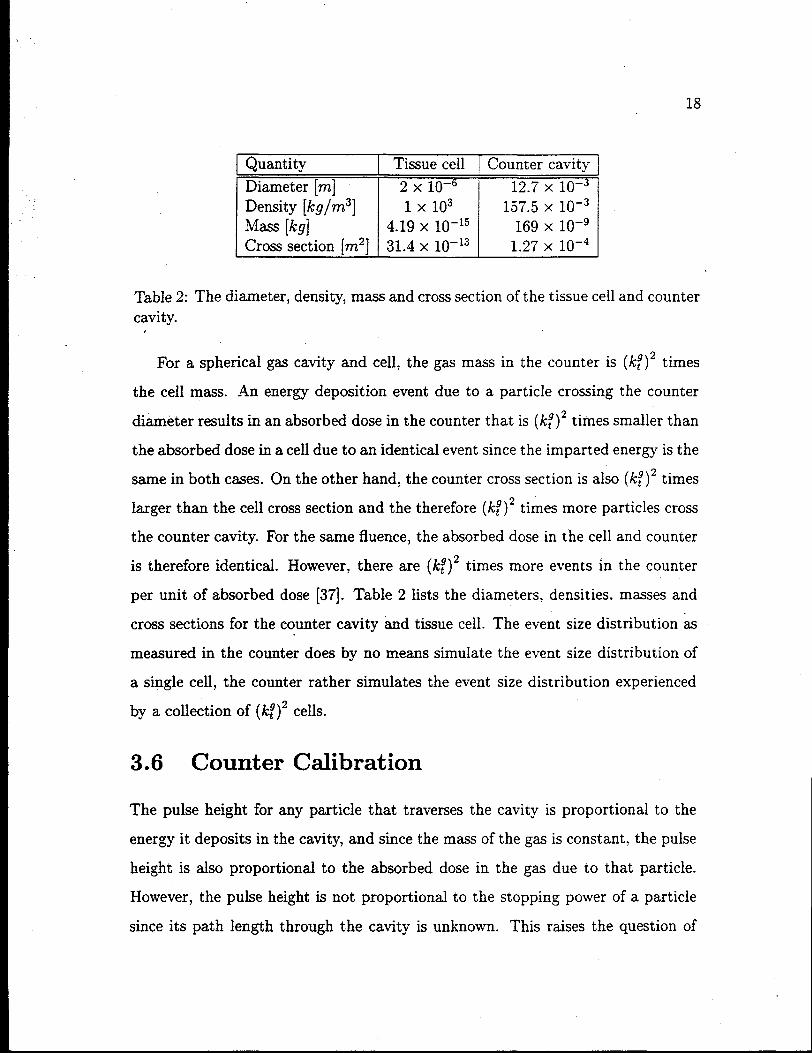
Table 2: The diameter, density, mass and cross section of the tissue cell and countercavity.
For a spherical gas cavity and cell, the gas mass in the counter is (k~)2 times
the celI mass. An energy deposition event due to a particle crossing the counter
diameter results in an absorbed dose in the counter that is (k~)2 times smaller than
the absorbed dose in a cell due to an identical event since the imparted energy is the
same in both cases. On the other hand, the counter cross section is also (k: )2 times
larger than the cell cross section and the therefore (k~)z times more particles cross
the counter cavity. For the same fluence, the absorbed dose in the cell and counter
is therefore identical. However, there are (k~)2 times more events in the counter
per unit of absorbed dose [37]. Table 2 lists the diameters, densities. masses and
cross sections for the counter cavity and tissue cell. The event size distribution as
measured in the counter does by no means simulate the event size distribution of
a single cell, the counter rather simulates the event size distribution experienced
by a collection of (k~)2 celIs.
3.6 Counter Calibration
The pulse height for any particle that traverses the cavity is proportional to the
energy it deposits in the cavity, and since the mass of the gas is constant, the pulse
height is also proportional to the absorbed dose in the gas due to that particle.
However, the pulse height is not proportional to the stopping power of a particle
since its path length through the cavity is unknown. This raises the question of
19
pulse height calibration.
According to ICRUReport36 [37], microdosimetric spectra can reexpressed
in terms of lineal energy g,
Y = ~ [keV/pnz] (3.15)i?
where ~ is the energy imparted in the counter and ~ is the mean chord length
in the cell volume. For a sphere the mean chord length ~ is 2/3 d, d being the
sphere diameter. The use of lineal energy implies that the measured pulse height is
proportional to ~, or linear energy transfer of the particle. Since this is not so, the
concept of lineal energy is somewhat misleading. Only for ‘a particle whose path
Iength is equal to 2/3 d, is y numerically equal to its stopping power. However,
particles going through 2/3 d can not be identified in the pulse height spectrum.
Alternatively, spectra can be expressed in terms of Y,
Y=Lx~ [MeVcm2/g]. (3.16)m~ 9
where m~ is the gas mass, Vg and dg are counter volume and diameter. The
utilization of Y has similar drawbacks as that of lineal energy y. The display of
microdosimetric spectra in terms of Y has the only advantage that, if a particle
crosses the diameter of the cavity, Y is numerically equal to its stopping power.
Certain points, namely the proton and alpha edge, in a microdosimetric spectrum
can be associated with particles that cross the diameter of the counter.
It is furthermore possible to display the spectrum in terms of absorbed gas dose1
D~.
Dg = ~. [MeV/g] (3.17)
The pulse height is proportional to the absorbed dose in the gas and an event can be
clearly associated with the absorbed dose deposited by it. However, the absorbed
I

20
Unit Definition Conversion
Y — [keV/pm]Y=2/:rl y = 752 x e [MeV]
Y Y=+ x ~ [MeVcm2/g] Y = 5263 x e [MeV]eD~ D~ = $ [MeV/g] D~ = 5882 x e [MeV]
Table 3: Conversion factors between g, Y, D9 and e, for a 2 pm gas filling.
dose in the gas is (kf)2 times smaller than the absorbed dose in a cell deposited by
an identical particle. Since a microdosimetric counter is used to simulate a cell, it
is advantageous to display the pulse height spectrum in a quantity that is identicaI
in the counter and cell.
For this work all spectra were calibrated in terms of imparted
pulse height is directly proportional to the energy imparted by
energy c. The
a particle. In
addition, the imparted energy due to a particle is identical in the counter and in
a cell.
The conversion between y, Y, D~ and e is linear and table 3 list the appropriate
conversion factors.
3.7 Data Analysis
In an ion chamber the imparted energy c
C= QX; X
is
10-6 [MeV] (3.18)
where Q is the number of elemental charges collected and W is the average energy
required in eV produce an ion pair. For a proportional counter equation 3.18 has
to be expanded to include a gas multiplication factor g.
(3.19)

Since gas multiplication only occurs in close proximity to the anode it is indepen-
dent of thelocation of theinitial ionization event. A constant gas multiplication
factor can be assumed.
The ~ value depends on the charged particle type and energy. Since it is not
possible to clearly distinguish between different particle types and energy, a con-
stant ~ value is used. This introduces some uncertainty in the measurement which
will be further discussed in section 3.9. The necessity of the counter calibration
arises from the fact that the gas multiplication factor g is undetermined.
.4 Cm-244 calibration source is built into the counter assembly which can be
used for counter calibration and performance testing. Cm-,244 emits two CYpar-
ticles, a 5.806-MeV particle with a 76.7 % probability and a 5.764-MeV particle
with 23.3 ?Io emission probability [25], which results in an average a energy of
E.= 5.8 MeV.
the known mass
gas, the counter
posited energy e
The alphas are collimated to cross the counter diameter. Using
collision stopping power S/p for the alpha particle in TE-butane
diameter d~ as the path
in the counter gas is
length, and the gas density P9, the de-
.
p~ [MeV]. (3.20)
In this way, the alpha source can be used to determine the gas gain g and to
calibrate the pulse heights in terms of imparted energy e.
This procedure assumes knowledge of the a particle energy. The a sources
used in these counters have a gold coating to seal the source. Alpha particles lose
energy in this gold layer and its thickness therefore determines the energy of the
a particles that enter the gas cavity. Substantial differences in ~ particle energies
due to variations in the gold layer thickness have been reported [10, 57].
To ,reduce uncertainties associated with a a-source calibration, proton edge
calibration was used to calibrate spectra. This method is based on the fact that,

22
for each particle type there
the counter. Firstly, theses
is a maximum amount of energy that can deposit in
particles have a maximal stopping power while they
traverse the counter cavity and secondly, they must travel along the longest path
length in the counter, i.e. go through the counter diameter. For a 2 pm equivalent
filling pressure with tissue equivalent gas, protons and alpha particles, that have
a maximal stopping power can deposit up to 186 keV and 505 keV, respectively,
in the counter [9, 57]. The frequency distribution in pulse height can then be
calibrated in terms of imparted energy e.
The frequency distribution in imparted energy can be converted to dose distri-
bution in imparted energy by
1D(e) = e x f(e) x — X 1.602 X 10-i3 [Gy]
nq(3.21)
where D(e) is the dose deposited in the gas by events of event size ~ to c+&, ~(e)
is the number of events of imparted energy e+ Ae, and m~ is the gas mass in kg. A
microdosimetric spectra can be represented as eD (c) vs. log (. This representation
conserves the equal area equal dose relationship of D(f) vs. e. The totaI absorbed
gas dose can be determined by the summation of D(e) over c.
Using equation 3.10 the absorbed gas dose D~ can be used to determine the
absorbed wall dose DW.
(3.22)
For a single particle of known type and energy, that crosses the counter cavity,
the rm,g value is equal to the ratio of its stopping power in the wall and gas material.
However, in a neutron field several types of particles with wide ranges of energies
are generated. Newhauser et al. [32] used Monte Carlo codes to calculate charged
particle emission spectra and mass stopping powers in a variety of materials and for
a variety of neutron energies. Their publication supplies rm,~ values for several wall

23
and gas material combinations. Using these values, wall doses were determined.
3.8 Qualitative Information
To predict the biological effect of neutron irradiation two parameters are needed.
Firstly, the absorbed dose in tissue needs to be known, but secondly, the radiobio-
Iogical effectiveness (RBE) of the beam, i.e., its relative effectiveness as compared
to 250-keV gamma irradiation [16], needs to be known. The RBE of a neutron
beam directly influences the clinical response to the beam and an increase or de-
crease in RBE can be equated with an increase or decrease in absorbed dose.
Through radiobiological experiments where cells were irradiated with charged
particles of different types “and energies, it W* determined that RBE is a strong
function of the linear energy transfer coefficient (LET), i.e., the energy lost by
a charged particle per unit path le~gth [3]. The RBE vs. LET function rises
with LET but then peaks at a LET value of about 100 keV/pm. With iin-ther
increasing LET the RBE decreases. This is known as the saturation effect. An
explanation for this effect is the deposition of excess energy in a target volume.
If more than the necessary energy to cause a biological effect is deposited in a
target no additional advantage is expected. The excess energy is wasted and the
effectiveness is decreased.
This effect has been incorporated in the calculation of saturation corrected
mean lineal energy y“ [21].
I-J*= /?-l.at(Y)x4V)4?4 (3.23)
Here ysat(y) is a biological weighting function that can be used to weight the
microdosimetric spectra and d(y) is the dose corresponding to events with lineal
energy y. The term y“ is a weighted average that can be used to indicate the
radiation quality. Using the conversion factor from table 3, y~atwas converted into
. .,‘,
.,!’
. .
24
100 I 1 I I I I I>
80-
60-
~w
40-
20-.
A
o I10-’
I I Ifo-’ fo+ fo-’
I i
fo” fo’ m’E / bfeV
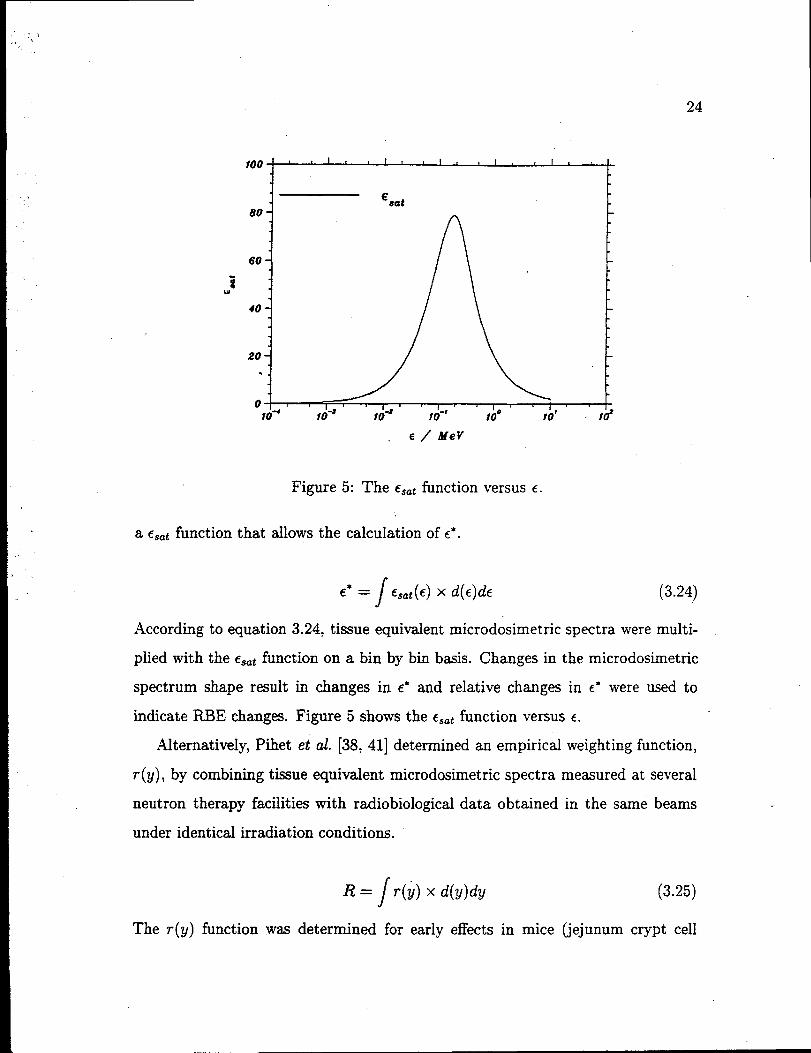
Figure 5: The C,=tfunction versus c.
a e~~tfunction that allows the calculation of e’.
According to equation 3.24, tissue equivalent microdosimetric spectra were multi-
plied with the Cat function on a bin by bin basis. Changes in the microdosimetric
spectrum shape result in changes in c“ and relative changes in ~“ were used to
indicate R13E changes. Figure 5 shows the e.~t function versus c.
Alternatively, Pihet et al. [38, 41] determined an empirical weighting function,
r(g), by combining tissue equivalent microdosimetric spectra measured at several
neutron therapy facilities with radiobiological data obtained in the same beams
under identical irradiation conditions.
~= /r(i) x 4,)4/
The r(g) function was determined for early effects
(3.25)
in mice (jejunum crypt cell

4 ! I 1 I I
3-
2-A
.,, .
. .
Io I I
104I
fo+I
10*[
10-’i i
10” “ 10’ f(fE / fWeV
Figure 6: Biological weighting function, r(~) empirically determined by Pihet etal. [38].
survival, skin reaction).
function which is shown
the following equation.
The r(y) function was converted for this work to a r(e)
in Figure 6. A R-value was then determined according to
R=/.(i) x ((e)ti,
3.9 Uncertainties
(3.26)
There are several sources of uncertainties in microdosimetric measurements. Count-
ing statistics, in addition to errors associated with the calibration technique, the -
use of a constant ~ value and the failure to fuIfill the second Bragg-Gray cavity
theory contribute to the total uncertainty. When wall kerma is determined, the
uncertainty of rn,~ values has to be included in an error analysis. The influence of
25

these uncertainties on a particular measurement depends on the individual experi-
mental conditions but for a Single A-150 dose measurement the uncertain y in our
data is typically 7 %. This is due to a combination of the following uncertainties.
Counting statistics: Since the probability that an event is of event size c is
small, Poisson statistics can be applied to estimate this error. If N events have
an event size q their statistical error is fi. Waker et al. [57] estimated the total
error by calculating microdosimetric quantities from two spectra, one in which
each bin contained N + fi events and another one with each bin containing
N – ~ events. However, since the uncertainty that is introduced by one bin is
independent from that of another bin, the total error in our data due to counting
statistics was estimated by summing the uncertainties from all bins in quadrature.
Typically, measured A-150 spectra have an uncertainty of 3-4 % in absorbed dose
due to counting statistics.
Calibration: For this work all tissue equivalent spectra were calibrated using
the proton edge method. Carbon spectra were calibrated using the alpha edge
method. Uncertainties in the proton edge method are estimated to contribute a
3 % uncertainty to the determination of absorbed gas dose [39].
Constant ~ value: The ~ value determines the ratio of imparted energy
e to collected charge Q (Equation 3.18) and is therefore of importance. The ~
value depends on the particle type and ener~. Since neither the particle type
nor energy can be uniqueiy identified for events in a microdosimetric spectrum a
constant ~ value, i.e. that of the calibration events, is assumed. By assuming a
constant & value for all events a 370 uncertainty in the gas dose determination is
introduced [18, 39].
Second Bragg-Gray cavity theory condition: The violation of the second
Bragg-Gray cavity condition for counters that differ in wall and gas composition
has to be addressed. In this work three such counters (C, Zr, 27-02) were used.
27
Theerror introduced inthe Zr and Zr02counters is not ofpractical importance
since it largely cancels out when the Zr spectrum is subtracted from the Zr02
spectrum. At 15 lMeV neutron energy Buhler et al. [9] estimated that about 5.5
% of the gas dose in a TE gas filled carbon counter is due to “Starters”, i.e.
particles that are generated by neutron interactions in the gas. Since the TE
kerma is about twice as large as the carbon kerma, this effect adds about a 3 %
uncertainty. At 50 iMeV neutron energy Newhauser [33] estimated an uncertainty
of less than 1 70 due to this effect. The average neutron energy at the I?ermilab
neutron therapy facility is about 25 MeV, therefore a conservative estimate of the
induced uncertainty in the dose determination is 2 Yo.
rm,g values: Newhauser et al. [32] estimated that their calculated r~,~ values
have a 4 % uncertainty.
28
Chapter 4
Experimental Methods
4.1 Data Acquisition
In each data acquisition run, one or two proportional counters were irradiated in the
therapeutic neutron beam. Pulses from each counter were amplified in a charge
sensitive pre-amplifier. Three NIM bin standard linear amplifiers with relative
gain settings of x10, x100 and x1000 further amplified the pulses. The amplified
pulses were then digitized by three Wilkinson-type analog to digital converters
(ADC) into 1024 channels each. The ADC outputs were connected to a paralleI
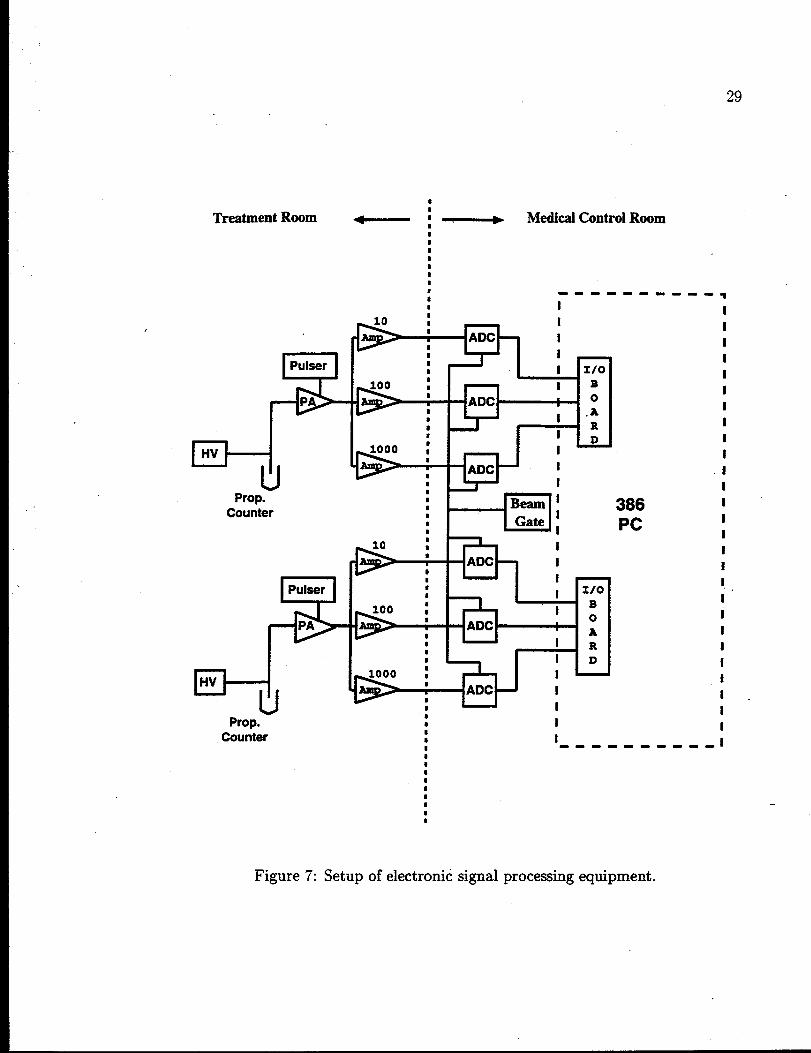
1/0 card in a 386 IBM compatible computer. Figure 7 illustrates the setup of the
electronic signal processing equipment. Data were then sort ed and displayed by a
data acquisition program. For further analysis the data were transferred to a Unix
computer.
The high voltage supplies were directly connected to the counters. The pre-
amplifiers were connected via short (< 100 mm) cables to the counters. To mini-
mize noise pickup in the data transmission cables, it was necessary to amplify the
pre-amp pulses in the treatment room before feeding them via 15 m long cables
to the medical control room (MCR) where the ADCS were located. .W additional
data acquisition equipment was located in the h4CR. Each .\DC was gated with a
beam envelope gate to minimize noise contamination.
Data were calibrated by determining the proton edge pulse height. This pulse
height was assigned to event size ~ = 186 keV. The relative gain of other pulse
heights was determined using a precision pulser. A pulser spectrum was taken
before and after each run to determine drifts in the electronic equipment. Pulser
29
Treatment Room
~
Prop.Counter
#1
4 :~ Medical Control Room
II
m Im1 I 1/0
ADC*8*
I
I1
1 I1I# Beam ‘n9 Gate :s
FPuleer
PA
q
Prop.Counter
386Pc
I1IiI11III1Ii11II
1..I1
1I
it1.I
I
# ------ ---- I
Figure 7: Setup of electronic signal processing equipment.

30
Coutex
Figure 8: Typical proportional
pulse heights had a relative range of
counter setup in”the treatment room.
one to 1000. The pulser spectrum was also
used to determine ADC and amplifier offsets. .An cr calibration spectrum was
acquired before and after each run in order to determine changes in the counter
performance.
For most data runs, two counters were irradiated simultaneously and were
therefore arranged symmetrically about the beam axis at the isocenter distance
of 1.80 m. Figure 8 illustrates a typical setup of the proportional counters in the
treatment room.
After pulse heights have been calibrated in terms of e, D(e) is determined
according to equation 3.21. Data were logarithmically binned into 40 bins per
decade and dispIayed as cD(c) vs. log c. This display accommodates the large
range of e values while maintaining an equal area equal dose relationship.
31
4.2 Dose Rate Reductions
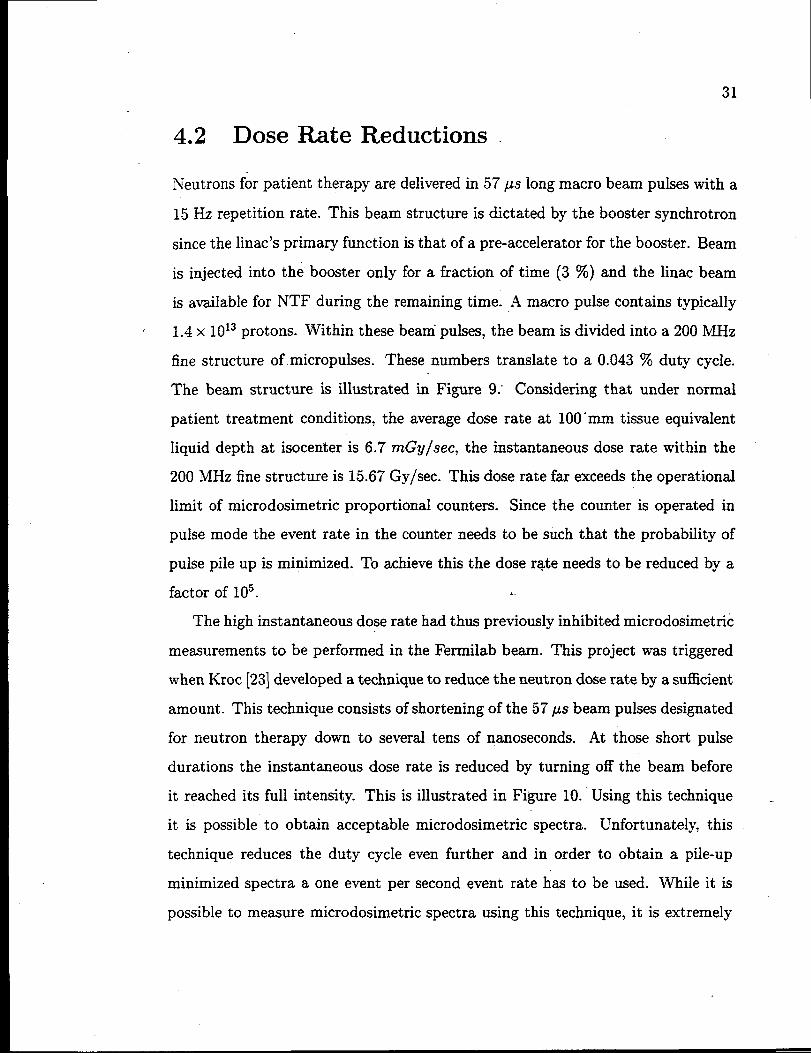
Neutrons for patient therapy are delivered in 57 PS long macro beam pulses with a
15 Hz repetition rate. This beam structure is dictated by the booster synchrotrons
since the linac’s primary function is that of a pre-accelerator for the booster. Beam
is injected into the booster only for a fraction of time (3 Yo)and the linac beam
is available for NTF during the remaining time. .4 macro pulse cent ains typically
1.4 x 10¹³protons. Within these beam”pulses, the beam is divided into a 200 MHz
fine structure of micropulses. These numbers translate to a 0.043 % duty cycle.
The beam structure is illustrated in Figure 9.’ Considering that under normal
patient treatment conditions, the average dose rate at 100’mm tissue equivalent
liquid depth at isocenter is 6.7 mGy/see, the instantaneous dose rate within the
200 MHz fine structure is 15.67 Gy/sec. This dose rate far exceeds the operational
limit of microdosimetric proportional counters. Since the counter is operated in
pulse mode the event rate in the counter needs to be such that the probability of
pulse pile up is minimized. To achieve this the dose rate needs to be reduced by a
factor of 105. +.
The high instantaneous dose rate had thus previously inhibited microdosimetrii
measurements to be performed in the Fermilab beam. This project was triggered
when Kroc [23] developed a technique to reduce the neutron dose rate by a sufficient
amount. This technique consists of shortening of the 57 ps beam pulses designated
for neutron therapy down to several tens of nanoseconds. At those short pulse
durations the instantaneous dose rate is reduced by turning off the beam before
it reached its full intensity. This is illustrated in Figure 10. Using this technique _
it is possible to obtain acceptable microdosimetric spectra. Unfortunately, this
technique reduces the duty cycle even further and in order to obtain a pile-up
minimized spectra a one event per second event rate has to be used. While it is
possible to measure microdosimetric spectra using this technique, it is extremely

32
painful, necessitating 80 hour runs.
Fortunately, during the course of this project, a second technique was developed
by members of the Fermilab linac group, that allowed us to obtain pile-up mini-
mized data at an event rate of ten events per second. In this technique the linac
beam is deliberately defocused. The Cockroft-Walton pre-accelerator produces a
750 keV continuous beam. Before entering the linac, this beam is formed into beam
bunches by a buncher. In an effort to reduce the beam intensity this buncher is
turned off. Furthermore, focusing magnets along the linac line are mistuned such
that they now defocus the beam. The bending magnets that bend protons into the
neutron therapy facility (NTF) beam line are unchanged. to ensure that only 66
MeV protons are extracted. The proton beam is now reduced in intensity during
the whole 57 ps pulse duration. The only disadvantage of this technique is that by
mistuning the linac beam, all downstream operations, i.e. the rest of Fermilab, is
affected. In practice this means that microdosimetry measurements at ~TF have
to be restricted to times when all other Fermilab accelerators are off. During the
last year there have been some extended maintenance periods in addition to a 10
day lab wide shut down that, in combination, allowed us to measure all data shown
in this thesis using this improved technique.

66.6 ms+ *
time
-Micropuk
Figure9: Thelinac beam structure.
InstantaneousDoseRate Reduction
.—. _ - ,- _- —--.
*
Figure IO: Themodified beam structure, using Kroc’smethod [23].
34
Chapter 5
Relative Carbon and OxygenKerma Factor Ratios
5.1 Introduction
The quantity of interest in radiation therapy is the absorbed dose in tissue delivered
during treatment. A determination of this quantity is, however. not trivial since it
can not be directly measured. Commonly an ion
plastic (A-150 PIastic) wall is used to mimic real
the absorbed dose is a largely a function of the
this approach is valid since A-150 and tissue are
In neutron therapy, where cross sections can
ment to the next, the above method fails. Ideally
chamber with a tissue equivalent
tissue. In photon therapy, where
electron density of the material,
matched in this quantity.
change drastically from one ele-
a tissue mimicking plastic should
be matched exactly in elemental composition to the tissue that is being mimicked.
But this is hard to achieve due to the difficulty of constructing a plastic with such a
high oxygen content and due to the need for a higher carbon content in the plastic
in order for it to be conducting. Even though the exact elemental composition of “
tissue depends on the tissue type, ICRU muscle tissue can be used to represent
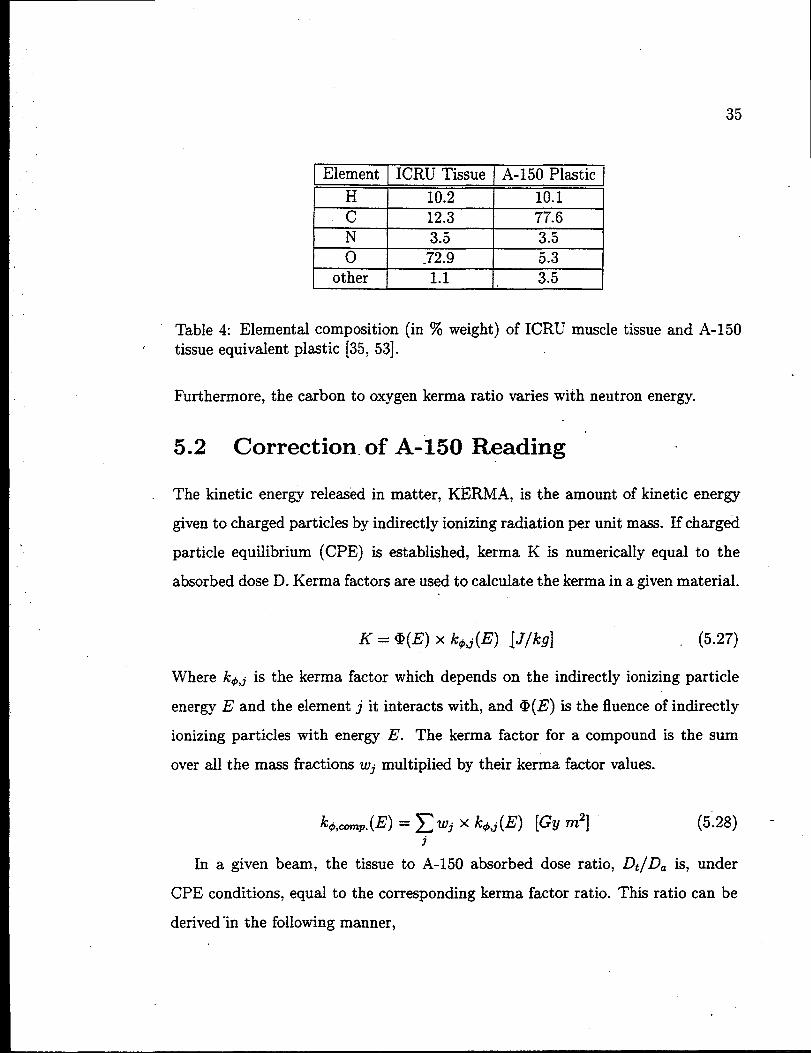
most soft tissues. Table 4 lists the elemental compositions of ICRU muscle tissue
and A-150 plastic. As can be seen the two materials mainly differ in carbon and
oxygen content. The absorbed dose measured in A-150 needs to be corrected for
this discrepancy to determine the absorbed dose in ICRU tissue. Since the carbon
kerma is larger than the oxygen kerma for neutron energies used in therapeutic
beams, the A-150 kerma is larger than the ICRU tissue kerrna for these beams.
35
(Element ICRU Tissue A-150 Plastic
H 10.2 10.1c 12.3 77.6N 3.5 3.50 .72.9 5.3
other 1.1 , 3.5
Table4: Elemental composition (in% weight) of ICRUmuscle tissue and A-150tissue equivalent plastic [35, 53].
Furthermore, the carbon to oxygen kerma
5.2 Correction. of A-150
ratio varies with neutron energy.
Reading
The kinetic energy releaied in matter, KERMA, is the amount of kinetic energy
given to charged particles by indirectly ionizing radiation per unit mass. If charged
particle equilibrium (CPE) is established, kerma K is numerically equal to the
absorbed dose D. Kerma factors are used to calculate the kerma in a given material.
K = @(E) x k@J(E) [J/kg] (5.27)
Where kd,j is the kerma factor which depends on the indirectly ionizing particle
energy 13 and the element j it interacts with, and @(l?) is the fluence of indirectly
ionizing particles with energy E. The kerma factor for a compound is the sum
over all the mass fractions ~j multiplied by their kerma factor values.
h,ctmp.(~)= ~ Wj xk@) [@/ ~2] (5.28) -j
In a given beam, the tissue to A-150 absorbed dose ratio, D~/Da is, under
CPE conditions, equal to the corresponding kerma factor ratio. This ratio can be
derived ‘in the foilowing manner,

36
k~,i = kd,. – w(o in a) x ko,o+ W(oin t) x kqzo
- W{c in ~) X k@,C+ W(c in t) X k@,C [Gy m’] (5.29)
dividing by the A-150 kerma factor yields,
ktit-=1 +0-U(oint)k~,a
- W(oin a)) x *.$Va
+ (’W(C”i~ ~) – ‘W(C in *)) x *.
For a broad energy spectrum, the effective kerma factor ratio
(5.30)
is
where W(j in ~) are the weight fractions of element j in material k and subscripts t
and a indicate ICRU tissue and A-150 plastic, respectively.
This calculation requires not only knowledge of the carbon and oxygen kerma
factors relative to A-150 plastic kerma factors over the whole energy range but also
knowledge of the neutron energy spectrum.
While extensive nucIear data are available for neutron interactions up to 15-
20 MeV, only sparse data exist at higher neutron energies. Kerma factors for
carbon [7, 51], oxygen [7,’18] and A-150 plastic [51] have been reported for some
neutron energies above 20 MeV.
In order to supplement the sparse experimental data a variety of calculations
have been performed. Recently, ICRU tissue and A-150 kerma have been calculated
for neutron energies ranging up to 100 MeV [11]. These data are based on nuclear
model calculations that took experimental data into consideration, when possible.

37
12
ICRU tissue/A-150 plastic kl ratio,
e1.f
according to Chadwick et at. ( 1997)-ez%bo
; ‘“0k
~
0.8 I 1“’’’1’””’1 I I I I Io 10 20 30 40 50 60 70 80 90 100
Neutron %er~ / hfeV
Figure 11: Calculated ICRU tissue to A-150 plastic kerma factor ratio. Kerma I
factors were taken- from Chadwick et al. [11].
The ICRU tissue to A-150 plastic kerma factor ratios versus neutron energy which
were calculated using this data are shown in Figure 11.
Schrewe et al. [50] recently published .4-150 plastic to ICRU tissue kerma con-
version factors for neutron energies up to 100 MeV which had been calculated from
published data. A conversion factor of 0.92 + 0.02 for neutron energies above 20 ‘
MeV is recommended in this publication.
After reviewing published neutron spectra data and available kerma factors ‘
Awschalom et al- [2] deduced a value of 0.93+ O.O3for the tissue to A-150 kerma
for a p(66)Be neutron beam. Ross et al. [45] used Monte Carlo transport codes -
to calculate the neutron fluence spectrum at Fermilab.s neutron therapy facility.
This calculated spectrum is shown in figure 12. By weighting the calculated spectra
with published kerma factor values, he deduced an A-150 plastic to ICRU tissue
kerma ratio of 0.93.

38
Figure 12: Calculated
E= / MeV
neutron fluence spectrum for NTF [45].
The current dosimetry protocol [34] for fast neutron beams recommends a value
of 0.95 to be used for the conversion from A-150 plastic kerma to ICRU tissue kerma
in the NTF beam.
5.3 Measurements
Alternatively we propose to obtain the effective carbon to A-150 and oxygen to
A-150 kerma factors for the broad energy neutron beam by direct measurements.
If two proportional counters are irradiated simultaneously in the same neutron
beam, that is they both are exposed to the same neutron energy spectrum and
fluence, the absorbed dose ratio of the counters isthenequal to the kerma ratio
and hence to the effective kerma factor ratio. This method eliminates the need to
know the kermafactor ratios for relevant neutron energies as well as the need to
know the neutron energy spectrum.

Three measurements
mine the A-150 to tissue
39
with two counters each were performed in order to deter-
kerma factor ratio. An A-150 counter was simultaneously
irradiated with carbon, zirconium and zirconium oxide counters. It is assumed
that when two counters are arranged symmetrically about the beam axis, they are
exposed to the same neutron fluence. From the A-150/carbon detector pair mea-
surement the corresponding kerma factor ratio can be directly determined. For
the determination of oxygen kerma two counters are needed since a detector wall
cannot be constructed out of oxygen. For this reason two counters which differ in
oxygen concentration of the wall, namely a Zr and Zr02 counter, were constructed
and the relative oxygen kerma can be determined by a subtraction technique [12].
The above set of measurements was made in a 10 x 10 cm2 field size beam
at the isocenter distance of 1.8 m. Counters were arranged symmetrically about
the beam axis and were irradiated free in air. In order to establish full build-up
conditions the A-150 plastic counter wall (thickness: 12.7 mm) was supplemented
with a 16 mm thick Nylon 6 build-up cap. Nylon 6 can be substituted for .A-150
plastic as a buiId-up material [6]. For the carbon counter a 6 mm carbon build-up
cap was used in addition to the counter wall thickness of 12.7 mm. The total
carbon thickness is equivalent to the total A-150 and Nylon thickness in terms of
proton range. No build-up caps were used on the Zr and 27-02 counters.
5.4 Results
The acquired carbon, zirconium and zirconium oxide data
ures 13, 14, 15. A microdosimetric spectrum measured in a
is used to represent the microdosimetric spectrum due to the
are shown in Fig-
CS-137 source field
gamma contamina-
tion in a neutron beam. Hence the measured spectra were corrected for gamma
contamination by fitting a gamma spectrum (CS-137) to the measured spectra at
event sizes

40
100 t 1 I t 1!111 I , 1I tIII 1 , , 1I l,, I I , t 1, 1, ! I ! 11t1,
80- c
60-Tw
‘z
w40-
20-
0 A# 1 1 1I 1111 I 1 I 1I 1111 # I 1 t 111,, , , , f * ,, # I 11161
to-’ fo4 104 10-’ 10’ 10’
e / MeV
Figure 13: Carbon microdosimetry data.
e = 0.001 to 0.0013 MeV and subsequently the gamma component was subtracted
from the measured event size spectra. The remaining event size spectrum is then
only due to the neutron component of the
ized to unit dose.
Gas doses measured with each counter
beam. The spectra shown were normal-
and calculated wall kermas are listed in
table 5. In order to obtain wall kerma, gas doses were multiplied with r~,~ values
taken from Newhauser et al. [32]. The r~,~ values used were those for isobutane
based tissue equivalent gas and 25 MeV, which is estimated to be the the average
neutron energy of the NTF beam. Wall kermas were used to determine the effective
carbon and oxygen to A-150 tissue equivalent plastic kerma factor ratios.
Carbon to A-150 TE pIastic kerma factor ratio: Results obtained from

41
w
100 t 1 t , #I1, t 1 I t It Ill I I #t I111 t 1 I 11*11 1 I I , , 1I*
80- Zr
60-
40-
20 –
o 4I , 1 #zIll I I 1 #, 111[ # 1 I I , 11,[ 1 1 I 111111 1 1 1I 188
fo+ to4 104 10-’ 10’ fo’
E / fWeV
Figure 14: Zirconium microdckimetry data.
Run Counter Gas dose [mGy] I r~,~ value Wall kerma [mGy]
C/TE Carbon 13.77 + 1.52 I 0.830+ 0.03 11.43*1.33A-150 21.52 & 1.25 1.001 k 0.04 21.54 & 1.52
Zr/TE Zirconium 4.40 & 0.27 0.442 & 0.02 1.95 * 0.15A-150 27.00 * 1.40 1.001 k 0.04 27.03 & 1.77
zro2/TE Zirconium oxide 5.60 & 0.47 0..488 & 0.02 2.73 + 0.26 -A-150 17.62 & 1.03 1.001 * 0.04 17.64 & 1.25
Table 5: Intermediate results for the ICRU tissue to A-150 kerma factor ratiodetermination.

42
--J
&w
100 1 , t I 1111[ * , t , 1’1 Ill , 1 I I 1,111 t t t t , t ,11 1 I 1t , I1.
zro2t
60-
40-
20 –
o
10-’
d
Figure 15: Zirconium oxide
Me V
microdosimetry data.
43
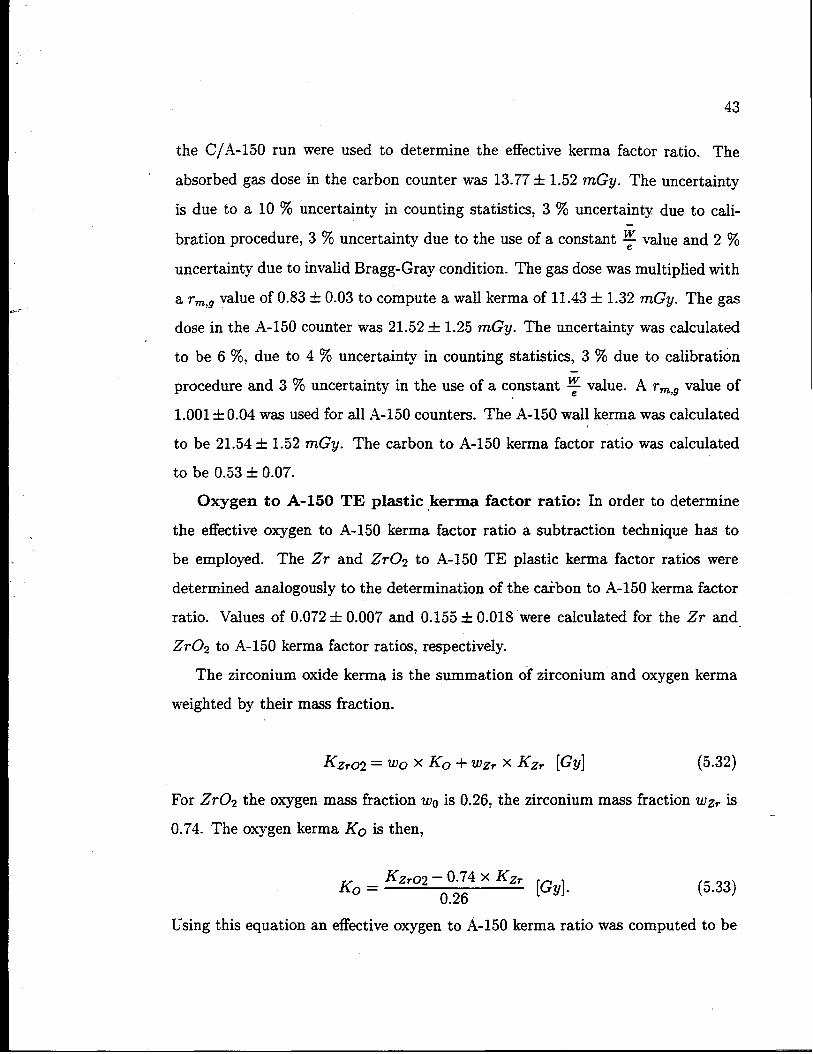
the C/A-150 run were used to determine the effective kerma factor ratio. The
absorbed gas dose in the carbon counter was 13.77+ 1.52 nzGy. The uncertainty
is due to a 10 ~0 uncertainty in counting statistics, 3 YO uncertainty due to cali-
bration procedure, 3 % uncertainty due to the use of a constant ~ value and 2 %
uncertainty due to invalid Bragg-Gray condition. The gas dose was multiplied with
a r~,~ value of 0.83 ~ 0.03 to compute a wall kerma of 11.43 + 1.32 mGy. The gas
dose in the A-150 counter was 21.52+ 1.25 mGy. The uncertainty was calculated
to be 6 %, due to 4 ~o uncertainty in counting statistics, 3 4?Z0due to calibration
procedure and 3 % uncertainty in the use of a constant ~ value. A r~,~ value of
1.001 +0.04 was used for all A-150 counters. The A-150 wall kerma was calculated
to be 21.54+ 1.52 mGy. The carbon to A-150 kerma factor ratio was calculated
to be 0.53+ 0.07.
Oxygen to A-150 TE plastic .kerma factor ratio: In order to determine
the effective oxygen to A-150 kerma factor ratio a subtraction technique has to
be employed. The Zr and ZT02 to A-150 TE plastic kerma factor ratios were
determined analogously to the determination of the caibon to A-150 kerma factor
ratio. Values of 0.072 + 0.007 and 0.155 + 0.018”were calculated for the Zr and
Zr02 to A-150 kerma factor ratios, respectively.
The zirconium oxide kerma is
weighted by their mass fraction.
the summation of zirconium and oxygen kerma
Kz,02= wo x K.+ Wzr X Kz, [Gy] (5.32)
For ZT02
0.74- The
the oxygen mass fraction W. is 0.26, the zirconium mass fraction Wz. is
oxygen kerma K. is then,
K. =KZ.02 –
0-74 x ‘2’ [Gy].0.26
(5.33)
Using this equation an effective oxygen to A-150 kerma ratio was computed to be

44
100 8 , t t { I1! t 1 t I I1Ill t ! I t 11111 1 t 1 111!11 , # # t !, 11
801 “O” Response
40+
20+ i“% n
r “-MI /.
Ill%“
{ ‘wI
0 I,
/11# , # I111 I 1 #I t1II c , I II , r1:1, , , I,, r , , , 1,,,
104 10 ● fo z 10 ‘ d 10’
E / MeV
Figure 16: “Oxygen” response microdosimetry data.
0.39 + 0.02. Figure 16 shows the oxygen microdosimetry data that were obtained
by subtracting the weighted Zr spectrum from the Z@2 spectrum.
ICRU tissue to A-150 tissue equivalent plastic kerma factor ratio:
For the determination of the effective ICRU tissue to A-150 plastic kerma ratio,
equation 5.31 was used, where W(o in ~, is 0.729, W(o ~~,4) is 0.053. W(c in ~, is
0.123 and W(c ;. ~, is 0.776. The ICRU tissue to A-150 plastic kerma factor ratio
is then
kT_092*oo4
k~”””(5.34)

45
5.5 Discussion
The result obtained through measurements agrees welI with previous results calcu-
lated for the NTF beam. Both, ROSSet al. [45] and AwschaIom et al. [2]recommend
an ICRU tissue to A-150 kerma factor ratio of 0.93 which agrees well with our re-
sult of 0.92 + 0.04. ROSSet al. [45] used data from Chadwick et al. [11] to compute
the ICRU tissue to A-I5O kerma factor ratio.
The measured carbon to A-150 kerma factor value of 0.53 ~ 0.07 for the NTF
beam compares well with with a determination of the same quantity by Schrewe
et al. [51]. They measured a value of 0.51 + 0.06 for the carbon to A-150 kerma
factor ratio at a neutron energy of 44.5 MeV.
Our calculations also yields the effective carbon to oxygen kerma factor ratio
of 1.36 + 0.19 for the NTF beam. This value equals the carbon to oxygen kerma
factor ratio calculated by Chadwick et al. [11] for 35 MeV.
The current value in use at NTF for the conversion of A-150 to ICRU tissue
dose is 0.95, as recommended by the AAPM protocol [34]. As a result, NTF
doses could be 2-3 % lower than prescribed, assuming a true conversion factor of
0.92-0.93.

46
Chapter 6
Beam Characterization
6.1 Introduction
It is well established that for the same absorbed dose neutrons are more effective
than photons incausing a biological effect. This isquantified bythe radiobiological
effectiveness (RBE) of the beam which is defined as
17BE(neutron) =Dose (250 keV z – rays)
Dose (neutron)(6.35)
where Dose (250 keV x – rags) and Dose (neutron) are to result in the same
amount of biological effect [16]. The higher RBE of neutrons is attributed to
densely ionizing secondary particles. Fast neutron therapy beams have a typical
RBE value of three to four for fractionated therapy..
In a typical neutron therapy beam most absorbed dose is deposited by sec-
ondary protons generated in the neutron beam. The ionization density, or stopping
power, distribution of protons in a fast neutron beam is, on average, an order of
magnitude larger than the stopping power distribution of electrons generated in a
CO-60 beam.
The RBE, as a function of the linear energy transfer coefficient (LET), i.e. the
energy lost by the particle per unit path length, rises with increasing LET. The
function peaks at a LET values of 100 IceV/pm before it decreases with increasing
LET values [3].
The stopping power of protons in tissue peaks at a value of just below
100 IceV/pm at a proton energy of 75 keV. .4ny higher and lower ener~ proton has

47
a lesser RBE. The average secondary proton energy generated in tissue increases
with the neutron beam energy. An increase in the average fast neutron beam
energy slightly decreases the RBE of the beam. Considering that no neutron
therapy facility is identical to another in terms of neutron energy spectra, each
facility has its own
Beauduinet al.
variations between
unique RBE value.
[4] performed a radiobiological study to determine the RBE
several neutron beams. Their results show that the RBE of
neutron beams decreases as the half value thickness, or energy, of the beams in-
creases. For a neutron beam generated by 20 MeV deuteron bombardment of a
beryllium target, the RBE was measured to be 50 % larger than the RBE of a
p(65)Be beam.
Besides the primary neutron energy spectrum, several other parameters infiu-
ence the neutron energy spectrum. The beam collimation as well as field shaping
devices all influence the neutron spectrum that eventually is used to irradiate the
patient. Consequently all these parameters influence the RBE of the treatment
beam to some degree.
As an alternatively, to radiobiological experiments, microdosimetry can be used
to map RBE variations in a neutron beam by weighting the measured event size dis-
tribution with biological weighting functions (section 3.8). Whereas the saturation
corrected mean lineal energy @ (or e“) can be used to approximate RBE varia-
tions, it neglects the RBE dependence on biological endpoint [40]. The empirical
weighting function determined by Pihet et al. [41] was derived from radiobiological
data on early effects in mice, and is thus inherently valid only for that specific
endpoint.
We investigated qualitative changes in the N-TI?beam with depth and field size
by obtaining microdosimetric spectra under various irradiation conditions. All
spectra were then weighted with
in C*and R were determined.
the ~,.t and Pihet’s r-functions. Relative changes
48
6.2 RBE variations with depth in tissue
As abroad spectrum neutron beam penetrates into tissue it hardens due to the
preferential absorption of lower energy neutrons. The RBE of the neutron beam
therefore decreases with depth in tissue. Several studies on this subject verified a
reduction in R-BE with depth in neutron beams. Hall et al. [17] measured a 10 %
reduction in RBE in a p(43)Be neutron beam between 20 mm and 120 mm using
Chinese hamster V79 cells. Later, a group at Clatterbridge found the same RBE
reduction in the p(62)Be beam [20] using mouse intestinal c~pt cells.
A study of this effect in the pee neutron therapy beam at the Na-
tional Accelerator Center (NAC) at Faure, South .4frica [52] using microdosimetry,
yielded a reduction of 6 Yoin y“ at 150 mm water depth as compared to 25 mm
depth. The effects of various thickness polyethylene filters were subsequently stud-
ied. Polyethylene filtration reduces the variation of y“ wit h depth by hardening the
beam in the filter material, therefore reducing the hardening effect in the patient.
In a 50 mm polyethylene filtered beam, the above g“ variation was reduced to
zero, however such a thick filter also reduces the dose rate to an unacceptable low
level. This study led to the permanent installation of a 25 mm thick polyethylene
filter in the Faure beam. In this beam a 5 % reduction in y“ between 25 mm and
200 mm depth was subsequently measured [52].
It should be noted that the South African beam and Fermilab’s beam are both
produced by 66 MeV protons on beryllium. However, the RBE changes with depth
are expected to be larger, in the Fermilab beam due to the thicker beryllium target
and the lack of a polyethylene filter in the Fermilab beam.
Hill et al. [19] performed radiobiological experiments in the Fermilab neutron
therapy beam with Chinese hamster V79 cells. A RBE reduction of 10 – 15 Yowas
found between 30 mm and 240 mm depth in a water phantom.
.“
,:
49
6.3 RBE variations with field size
.4s the field size is increased the amount of scattering in the collimation system
increases. This enhances the lower energy component of the spectra, which influ-
ences the quality of the beam. RBE changes with field size in the South African
beam have been determined by Binns [6]. The RBE of the beam was found to
increase with field size (30 cm2 to 400 cm2) by 3 – 5 YO percent.
6.4 Measurements
An A-150 tissue equivalent plastic counter was used to measure microdosimetric
spectra at different depths and field sizes. ,The counter was immersed in a 300 mm x
300 mm x 300 mm water filled phantom. The surface of the water phantom was
placed at isocenter distance. The A-150 counter was positioned in the center of the
radiation field. For three field sizes (50 mm x 50 mm, 100 mm x 100 mm, 200 mm x
200 mm) spectra were acquired at three water depths (50 mm, 100 mm, 150 mm).
6.5 Results
The measured A-150 spectra were weighted with two biological weighting functions,
e~.t and Pihet’s r(c) -function. These functions can be seen in figures 5 and 6. After
absolute ~“ values were determined, these values were normalized to the e“ value
obtained at a field size of 100 mm x 100 m and a depth of 100 mm. Since the r(e)-
function was derived in order to provide a parameter that allows the comparison
of different neutron therapy facilities in terms of RBE, the absolute R-value for
one measurement as well as relative R-values for all other measurements were
calculated. The absolute R-value is normalized to the p(65) beam at Louvain-
la-Neuve per definition. For the 100 mm x 100 mm field size, 100 mm depth
measurement a R-value of 1.08 & 0.04 was calculated. All other results are listed
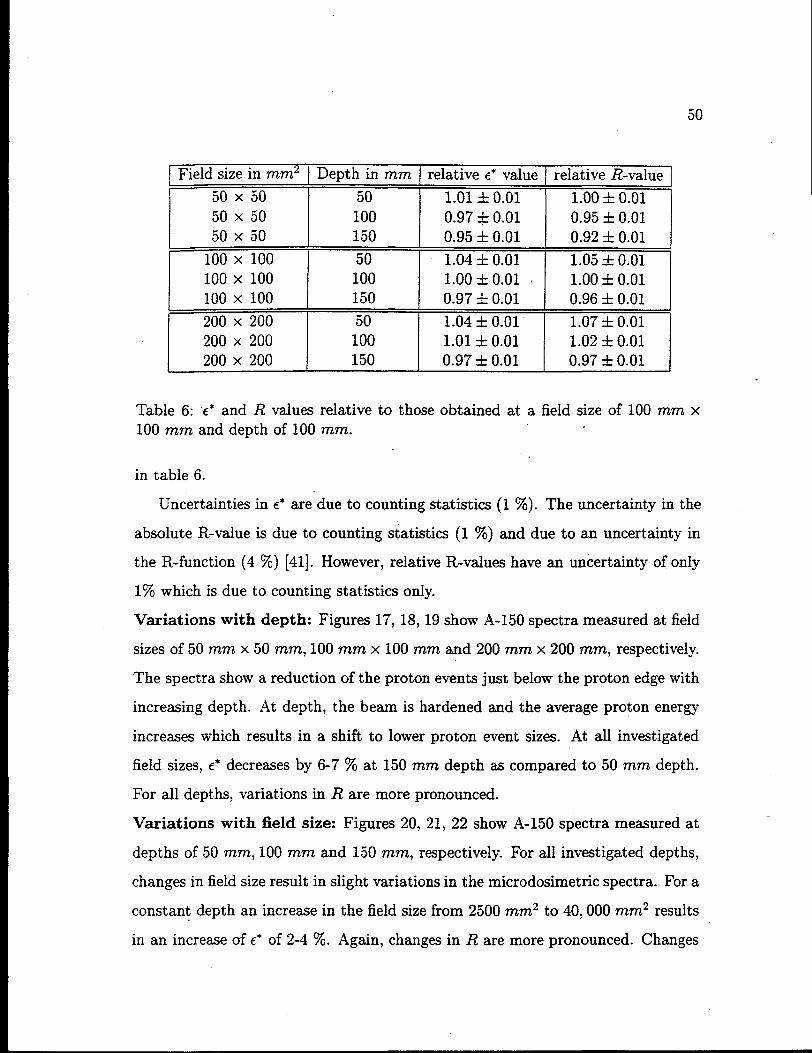
50
Field size in mm2 Depth in mm relativee’ value relative R-value
50 x 50 50 1.01 + 0.01 1.00 * 0.0150X 50 100 0.97 * 0.01 0.95 + 0.0150 x 50 150 0.95 * 0.01 0.92 + 0.01
100 x 100 50 1.04 * 0.01 1.05 + 0.01loox 100 100 1.00+0.01 ~ 1,00 * 0.01100 x 100 150 0.97 + 0.01 0.96 + 0.01
200 x 200 50 1.04 + 0.01 1.07 A 0.01200 x 200 100 1.01 + 0.01 1.02 + 0.01200 x 200 150 0.97 * 0.01 0.97 * 0.01(
Table 6: ‘e” and Rvalues relative to those obtained at afield size of 100 mm x100mm and depth
in table 6.
Uncertaintiesin
of100mm.
e“ are due to counting statistics (1 Yo). The uncertainty in the
absolute R-value is due to counting statistics (1 ?ZO) and due to an uncertainty in
the R-function (4 %) [41]. However, relative R-values have an uncertainty of only
1% which is due to counting statistics only.
Variations with depth: Figures 17, 18, 19 show A-150 spectra measured at field
sizes of 50 mm x 50 mm, 100 mm x 100 mm and 200 mm x 200 mm, respectively.
The spectra show a reduction of the proton events just below the proton edge with
increasing depth. At depth, the beam is hardened and the average proton energy
increases which results in a shift to lower proton event sizes. At all investigated
field sizes, t“ decreases by 6-7 % at 150 mm depth as compared to 50 mm depth.
For all depths, variations in R are more pronounced.
Variations with field size: Figures 20, 21, 22 show A-150 spectra measured at
depths of 50 mm, 100 mm and 150 mm, respectively. For ail investigated depths,
changes in field size result in slight variations in the microdosimetric spectra. For a
constant depth an increase in the field size from 2500 mm2 to 40,000 mm2 results
in an increase of ~“ of 2-470. Again, changes in R are more pronounced. Changes
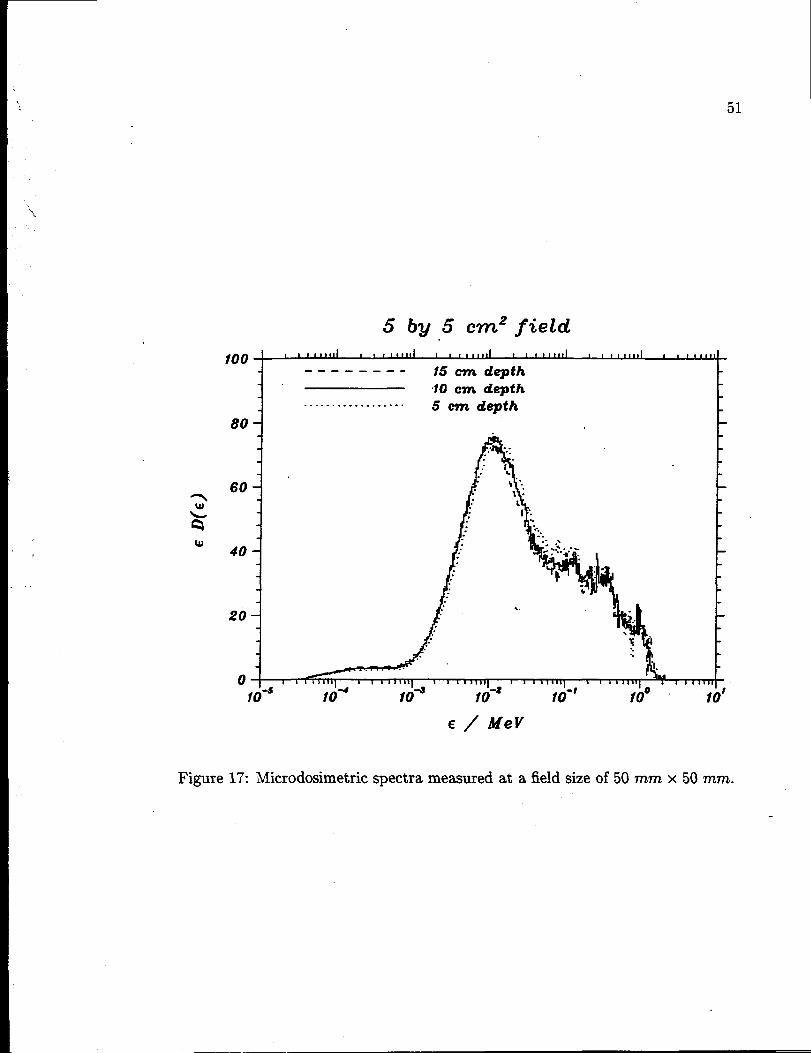
w
5 by 5 cm2 field
100 I I I 1111111t t I111111t 1IIIlb:l t I I t,Ill # , tt1111 t I t<11111---- ---- 15 m depth
110 cm depth
... .. .. . . . . . .. . .. . 5 m depth80 I
J
60 –
40-
20-
0 1 III11l,, I I 1I 1*1:1 1 1 , 1Illq i 1 I 1I111[ s 1&1111118 t I 1ITIT-10-5 10-’ 10+ 10+ ?0-/ /0° 10’
Figure 17 Microdosimetric
E / AfeV
spectra measured at a field size of 50 mm x 50 mm.

w
52
10 by 70 cm2 field
100 , * 1111111 I t t I1,, ,1 * I , 1tlltl 1 I 11,II*I a , *, 111,1 t , 1t1~---- ---- 15 (nn depth
?0 cm depth.. . .. .. .. . .. .. . .. . 5 cm depth
80 ~ r
60 1 A;..:%i->..... II1 1-
140{
20 +
I. ..—
0 1 r 1I11111 I 8
Figure 18:
J! “’hki.,..
1..
..”
J.“
....“
....
-1
,,,
104 10-’? i 11111I , I #11l,, 1 1 I 1111,, I I I : 1111, * 1 I t ,
104 to+ 10-’ 10° 10?
Microdosimetric spectra
E / AfeV
measured at a field size of 100 mm x 100 mm.
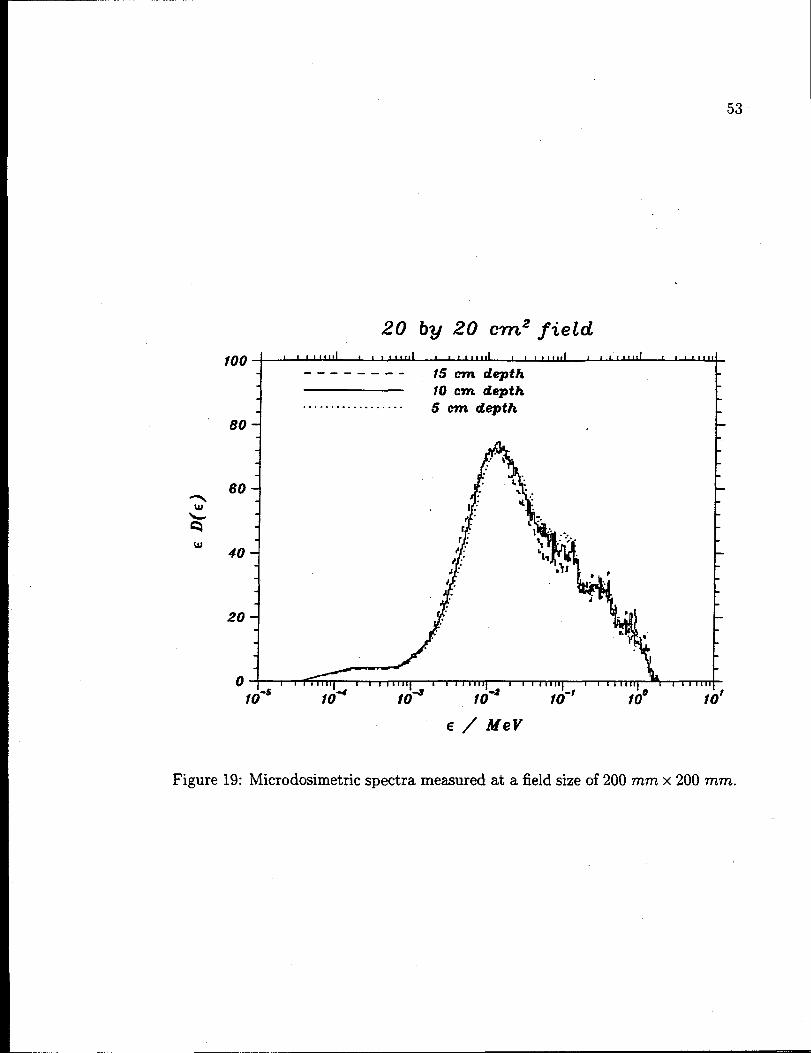
53
--J
w
20 by 20 cm2 fietd
too I I ,#11111I I t111,s 1 , tI,s,1 1, Ittllll ‘ , I tI*II , # ,,,,,,---- ____ 15m depth
fO m depth... . ... .. . .. .. . .. . 5 m depth
80-
60-
40–
20-
0 1 II111111I ,1111111i I1111111r I1I111:1 I I aI11111t 1 I #111110-5 104 104 10+ to-$ 10° 101
Figure 19: Microdosimetric
E / fUeV
spectra measured at a field size of 200 mm x 200 mm.

5 cm depth
100* 11t,,,, t It,[1111* I1t,,,1 I ,I,I,,, t tI1,I*,I 1 It11,,,
---- ---- 5 by 5 Crnzfield10 by 10 C?nzfield
... . . .. .. . .. .. . .. . 20 ~ 20 cmz field80-
1k
60-
40–
20-
0 I ,#,11l,,, 1,,18111, II ,,,, , 1,[,131 1 r , , 8,Ir-10-5 104 10+ 10-x ?0-’
m/0° 10’
E / fWe V
Microdosimetric spectra measuredFigure 20:
in field size result in smaller variations in e“, R and
at a depth of 50 mm.
the microdosimetric spectra,
than comparable changes with depth.
Maximal variations: Figure 23 shows spectra measured at 150 mm depth in
a 50 mm x 50 mm field and 50 mm depth in a 200 mm x 200 mm field. The
first corresponds to the hardest and the latter to softest spectrum measured. The
difference in shape of these two spectra is clearly seen and is quantified by a -
decrease of t“ by 9 % and R by 15%, moving from the softest to hardest spectrum.

55
10 cm depth
w
100 t , I I1111 I I 1t I*II , , , , 11,,1 I , , t ,,, , I * 1 , , [It t * I t ,,,
80-
---- ---- 5 by 5 cmz field10 by 10 cmz field
... .. . . .. . . . .. . .. . 20 @ 20 &n2 field
1.
60- J
40-
20-
0 , ,,1,,,, ,t *ro-s
1III
Figure 21: Microdosimetric spectra measured at a depth of 100 mm.

56
w
15 cm depth
100 I 1,11111, I I It111[1 I I,11111: I ,11111I t 1t,ttll , 1 I1t,,,---- ---- S by 5 cm= field
10 b~ ~0 cms field... .. .. .. . . . . . . .. . 20 ~ 20 cm2 f<ehl-1 r
60-
40-
20–
o , II,1,11, ,*81,111, ,,,,,, 1 1 11111E ‘1‘,’,, , II,,,,8io-5 104 104 104 10-’ 10° 10’
Figure 22:
E / fWeV
Microdosimetric spectra measured at a depth of 150 mm.

57
w
100 t 1t I11111 : I I , 1,,,1 ! * I I la, , 1 I 1 t 111,1 t * t t 11111 1 , , I 11$1
---- ---- S by 5 cmz field, 15 cm depth... .. .. .. . .. .. . .. . 20 by 20 cma fieid, 5 cm depth
80-.“, +.:
) :-:y..J .- ~.:
60- J: $.:..~: 1 ....r: L ,..# :: I .-.t: 1 “...r: 1 :<”. . .. . .
40- J: ‘If ... ‘11:
d;“q-; { ,
4: “’yi~ ‘i~y!~q~+;
J :.. .
20- #; !’*.\r:f.: ?:;;.+8..-# @jl
/“- t’~.---.-.-0 -.- ~j
1 1,,111*I 1 II#11111# #tI11,1i 1II1[,,11 , I I:111 1 , , rnlT-10-6 104 10+ lo- fo-’ 10° Iof
Figure 23: Spectra measured at 150 mm depth in a 50 mm x 50 mm field and50 mm depth in a 200 mm x 200 mm field.

58
6.6 Discussion
Besides mapping E*and Rvariations inthe NTF beam, theabsolute R-value for
the normalization conditions was calculated. A R-value of 1.08 + 0.04 suggests
that the Fermilab beam is somewhat softer than the Louvain-la-Neuve beam. The
proton energy at both facilities is essentially the same, however, the Louvain beam
is, in fact, produced in a thinner beryllium target (17 mm) and the neutron beam
is filtered by 20 mm polyethylene and 3 mm lead [38]. Each of these difference
leads to a harder beam as compared to the NTF beam.
Variations in 6* with depth can be directly compared to similar studies done at
NAC in South Africa due to the similarity of the two facilities. In the unfiltered
beam at NAC a reduction in y“ of 6 % was measured in a 200 mm x 200 mm
field between 25 mm and 150 mm depth [52]. At NTF a decrease in e“ of 7 % was
measured between 50 mm and 150 mm depth. These results confirm the similarity
of the two neutron beams.
Variations in e“ due to changes in field size in the NTF beam’ also compare well
to similar investigation in the NAC beam [6]. At NAC a 3-5% variation in V*was
found whereas at NTF a 2-4 YO variation in e“ was found for similar changes in
fieid sizes.
Hill et al. [19] performed radiobiological experiments in the NTF beam and
measured a 12-1570 reduction in RBE between 30 mm and 240 mm. Assuming a
uniform rate of beam hardening, Hill’s results agree with the decrease of e“ found
in this study. However, Hill et al. [19] did not find any variations in RBE with
collimator size.
Variations in e“ compare well to predicted variations in RBE based on previous
studies, and can therefore be used as a reliable tool to study beam quality changes.
The calculation of RBE relative to other facilities using Pihet’s r(e) -function agrees
qualitatively with predictions. Calculations of R variations are, in general, more

59
pronounced than e” variations. However, they qualitatively agree with calculated
e“ variations.
Maximal Variations between irradiation conditions result in e” and l?variations
ofupto9and ~5% respectively. These variations introduce large errors in thecal-
culation ofabsorbed dose, compared to the proposed accuracy in neutron thetapy
of3.5% [31].
Many neutron therapy facilities use a polyethylene filter to reduce RBE vari-
ations with depth. The implementation of a 2.5 mm polyethylene filter at NAC
reduced the variations in ~“ to 5 ~obetween 25 mm and 200 mm [52]. The remain-
ing variations with depth are included in the treatment planning system at NAC
[6].
In a separate study Rosenberg et al. [44] determined that the attenuation of
the NTF beam by 25 mm polyethylene filter is only about 20 %.
The implementation of a
with field size and depth in
considered.
hardening filter or the inclusion of RBE variations
the treatment planning system at NTF, should be

60
Chapter 7
Boron Neutron Capture
7. I Introduction
Boron neutron capture therapy (BNCT) aims atconforming theabsorbed dose to
the tumor tissue by selectively loading the tumor tissue with a boron-10 compound
and subsequently irradiating the tumor with thermal neutrons: Boron-10 has a
high cross section (3830 barn) for thermal neutron capture and then branches into
the two following reactions. With” a 6 YO branching ratio a 4He and a 7Li particIe
are produced which share 2.8 A4eV of kinetic energy. With a 94 YO probabilityy a
4He a 7Li and a 0.48 MeV photon are produced which leaves a kinetic energy7
of 2.3 MeV to be shared between the two charged particles. The cross section of
this capture reaction has a l/v dependence, where v is the neutron speed. The
411e and 7Lz particles have ranges in water of approximately 10 ~m and 5 pm,
respectively. Due to these short ranges the absorbed dose is confined to the tumor
tissue.
in
to
BNCT was proposed by Lecher in 1936 [27]and first clinical trials were Iaunched
the early fifties using reactor neutron beams. Resuits were unacceptable due
severe normal tissue damage which was caused by the presence of boron in
normal tissue. After improved boron compounds were developed, the interest
in BNCT arose again during the mid-eighties. There are currently two facilities
(Brookhaven National Laboratory and Massachusetts Institute of Technology) in
the US that have started to use reactor beams for BNCT trials on brain tumors
and melanomas [14].
61
Reactor beams exhibit limited penetration and Waterman et al. [61] first sug-
gested the utilization of low energy neutrons produced by the slowing down of
higher energy neutrons in fast neutron beams. Appiying this c.oncept, the feasibil-
ity of using BNC in the fast neutron therapy beam at Fermilab in order to boost
the tumor dose W= investigated- If BNCT is the sole form of treatment, one needs
to ensure that each tumor cell experiences a boron neutron capture reaction, which
necessitates the loading of every cell with boron-10. In addition, the boron loading,
of normal tissue needs to be significantly lower. This sets high demands on the
tumor specificity of the boron compound. On the other hand, if boron neutron
capture couId be used just for a tumor dose enhancement the above requirement
would no longer be as stringent.
7.2 Clinical rationale
The expected sum;val time for patients diagnosed with glioblastoma multiforrne,
a type of brain tumor, is around eight months following diagnosis and can be
extended by another four months with radiation therapy. There is no difference
in survival between fast neutron and photon patients but the cause of death has
been found to vary with treatment modality. A regrowth of the tumor is the
primary cause of death in photon patients whereas with fast neutron therapy one
achieves tumor control but patients sustain a high degree of normal tissue damage
that causes death [48]. These clinical results indicate a small therapeutic ratio
of glioma to normal brain tissue. To increase the survival, the therapeutic ratio
needs to be increased. BNCT has the potential of achieving just that in neutron
beams. A selective dose enhancement in the tumor tissue will allow a corresponding
reduction in the overall absorbed dose level, therefore reducing the normal tissue
complications.

62
7’.3 BNC in fast neutron beams
The enhancement due to boron neutron capture in fast neutron therapy beams has
been investigated by several groups for a variety of therapy beams [61, 62, 42, 29].
Waterman et al. [61] studied the dose enhancement due to B-10 in four neutron
beams which varied in median energy from 2.4 to 9 .kfeV. The thermal neutron
fluence was determined with a BFs proportional counter and Xa-23 activation.
The absolute dose enhancement due to boron was between 3.5 % and 16 % for a
typical boron loadingof 50 ppm.
More recently Poller et al. [42] used .Monte Carlo techniques to deduce the dose
enhancement due to neutrons in a d(14)Be beam used at Essen. Gold foil activation
measurements were done to verify the Monte Carlo calculations. Results were in
agreement with Waterman [61] and calculations were in reasonable agreement with
gold foil measurements. A 7.5 % absorbed dose enhancement was found at 60 mm
depth and for a 50 ppm boron loading.
Wootton et al. [62] investigated several neutron beams produced by protons
and deuterons of varying energy on beryllium targets of different thicknesses by
means of sodium activation. In addition to that, several beams were filtered with
iron and perspex filters. For a p(50.5)Be(26) beam a boron dose enhancement of
3 % was deduced for a 50 ppm loading.
At the p(48.5)Be neutron therapy facility in Detroit, Kota [22] measured a dose
enhancement of 2.5-3.5 Yo for a 50 ppm boron-10 loading.
7.4 Beam Modifications
The dose enhancement due to boron is proportional to the boron concentration in
tumor tissue and to the thermal and epithermal neutron fluence. We investigated
an enhancement of the latter quantity. The effect of various filter materials on the
neutron energy spectrum was simulated using Monte Carlo codes. Results were

63
used to select promising filter materials that were then investigatedin the actual
beam. The influence of the collimator material was tested in the actual beam.
Additionally, the primary neutron energy spectrum can be changedbyc hanging”
the proton beam energy.
Monte Car10 Calculations. Calculations were performed using MCNP [8], a
Monte Carlo code from LOSAlamos. lMCNP uses data files that normally extend
up to 20 MeV. Extended data libraries up to 100 MeV for use by MCNP exist
for some selected elements [64] and were used after they became available to us.
The NTF neutron spectrum recently calculated by Ross et al. [45] was used as
the source spectrum for the Monte Carlos calculations. The simulated geometry
is shown in figure 24. Neutrons are emitted into a cone to simulate a collimated
neutron beam. At isocenter we simulated a head phantom that is surrounded with
a 50 mm thick bone surface and filled with water. Filters were placed adjacent to
the head phantom to minimize loss of thermal neutrons produced in the filter due
to the l/r2 effect.
Collimator and Filter Materials. Besides determining the influence of filters
on the neutron beam, changes introduced by different collimator materials were
investigated. Neutron scattering of the collimator material contributes to the lower
energy component of the beam. At NTF, the regular collimator is a mixture of
concrete and polyethylene pellets. The influence of steel blocks was investigated.
Proton Beam Modifications. At NTF, 66 MeV protons from a linear acceler-
ator (Iinac) are used to generate the neutron beam. As described in section 2.3,
the linac is divided into several tanks and protons designated for NTF are only
accelerated in tanks one through three. Protons exit tank three with an energy “
of 66 MeV and drift through tank four to where NTF is located. Protons enter
tank three with an energy of 37 MeV. It is possible to turn tank three off such
that protons drift through tank three and four before they are diverted into the
NTF beam line. The proton energy can in this way be reduced to 37 MeV. The
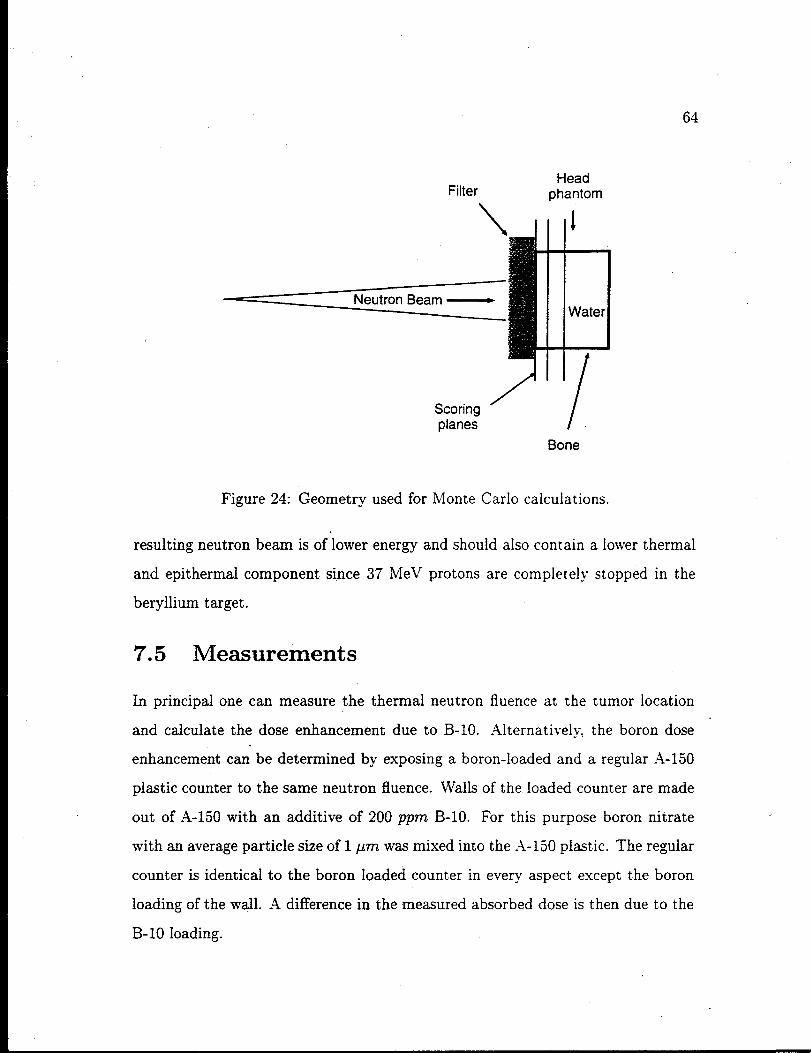
64
HeadFilter phantom
\
Neutron Beam ~I
/“/Scoring ‘planes I
Bone
Figure 24: Geometry used for iMonte Carlo calculations.
resulting neutron beam is of lower energy and should also cent ain a lower thermal
and epithermal component since 37 MeV protons are completely stopped in the
beryllium target.
7.5 Measurements
In principal one can measure the thermal neutron fluence at the tumor location
and calculate the dose enhancement due to B-10. Alternatively, the boron dose
enhancement can’ be determined by exposing a boron-loaded and a regular .4-150
plastic counter to the same neutron fluence. Walls of the loaded counter are made
out of .4-150 with an additive of 200 pprn B-10. For this purpose boron nitrate
with an average particle size of 1 pm was mixed into the .\- 150 plastic. The regular
counter is identical to the boron loaded counter in every aspect except the boron
loading of the wall. .4 difference in the measured absorbed dose is then due to the
B-10 loading.

7.6 Results
65
For all measurements two counters, the regular A-150 counter and the B-10 loaded
A-150 counter, were irradiated simultaneously in the neutron field. Unless other-
wise stated, a 100 mm x 100 mm field was used. A head shaped lucite phantom
was filled with water and counters were immersed in the phantom at a approxi-
mate water depth of 50 mm. For this to be feasible, the head phantom was turned
upside down.
The uncertainty in the dose ratio of the two A-150 counters is estimated to be .
4 % due to a 3 % counting statistics uncertainty in both spectra.
The boron-loaded counter is filled with regular isobutane tissue equivalent gas
and the lack of a boron-loading of the gas needs to be considered. Since both
particles that are generated in the B-10 reaction have ranges in tissue that are
comparable to the counter volume and may therefore not be able to cross the
counter cavity, the measured boron dose enhancement in the counter underesti-
mates the true boron dose enharicement in a homogeneous tumor. Wuu et at [63]
calculated that, for a 2pm gas filling, 75 ‘%0 of the dose is due to particles crossing
the cavity. If 25 % of the dose is due to particles stopping in the gas cavity, it can
be estimated that, if stoppers are only depositing about half of the energy that
crossers do, about 13 Yoof the gas dose is lost due to the lack of boron-10 in the
gas. To eliminate this effect, the boron-loaded counter can be filled with tissue
equivalent gas that contains an additive of boron trifluoride such that the gas is
loaded with the same amount of B-10 as the wall.
Enhancement in the open beam. Firstly, the boron dose enhancement in the -
open field was determined- In anticipation of the filter investigations, in which the
dose rate is decreased, the counters were positioned about 300 mm closer to the
target than the isocenter for alI measurements. Figure 25 illustrates the setup.
The result of this measurement is shown in figure 26. A 3% +4% boron dose
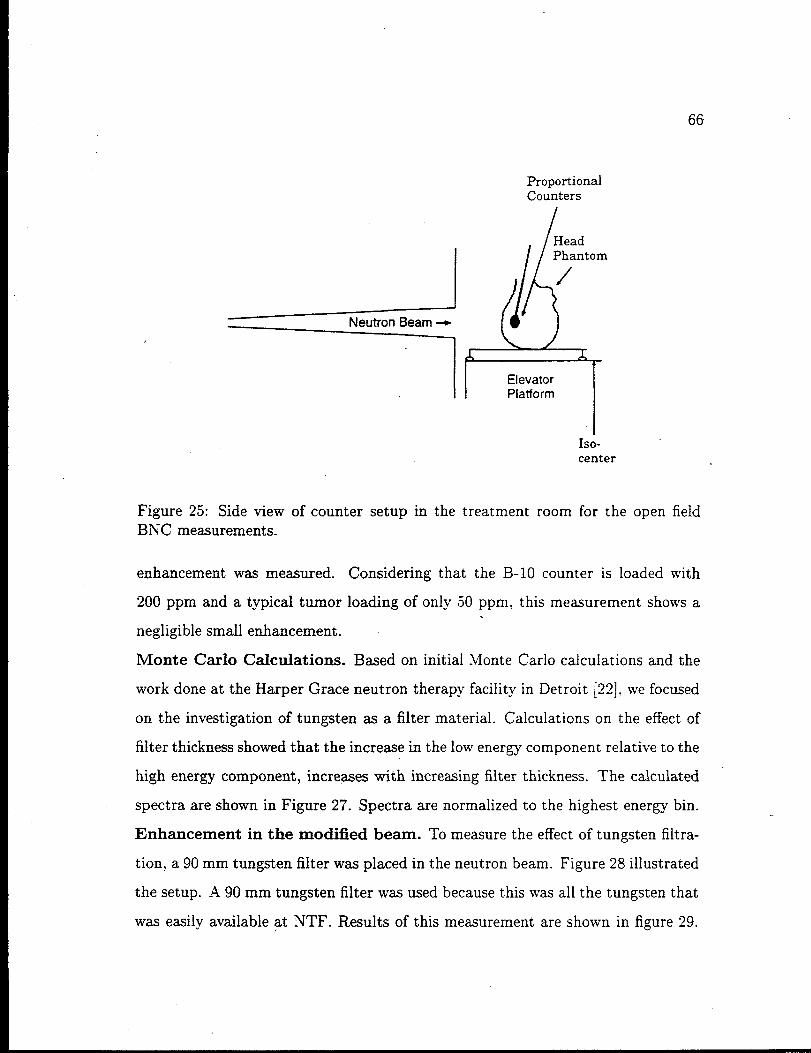
66
ProportionalCounters
- /FmY ‘:$“
Iso-center
Figure 25: Side view of counter setup in the treatment room for the open fieldBNC measurements.
enhancement was measured. Considering that the B-10 counter is loaded with
200 ppm and a typical tumor loading of only 50 ppm,.
negligible small enhancement.
Monte Carlo Calculations. Based on initial Monte
this measurement shows a
Carlo calculations and the
work done at the Harper Grace neutron therapy facility in Detroit [22], we focused
on the investigation of tungsten as a filter material. Calculations on the effect of
filter thickness showed that the increase in the low energy component relative to the
high energy component, increases with increasing filter thickness. The calculated
spectra are shown in Figure 27. Spectra are normalized to the highest ener~ bin.
Enhancement in the modified beam. To measure the effect of tungsten filtra-
tion, a 90 mm tungsten filter was placed in the neutron beam. Figure 28 illustrated
the setup. .490 mm tungsten filter was used because this was all the tungsten that
was easily available at NTF. Results of this measurement are shown in figure 29.

67
Unmodified Beam100 I f 1 1 111s I 1 1 I 1111 3 I , , 1114 I I 1 41111 I I , I 1!11 I I 1I 1*U
A-150 Counter
80-.................. B-10 A-150 Counter
J
60-
40-
20-
0 s ,,1111114 1,I11111 ,I11411[I tI1,1,1II1I11111I 1I,111104 10+ 104 104 /0-’ to” 10’
Figure 26: Microdosimetric spectra measured in the unmodified beam.

68
Monte Carlo Calculations10’Ii
3
unfiltered beam.... . . . .. . .. .. . . 5 - w-filt~
---------- 10 cm W-filter—.—. — .- 20 cm W-filter
.4“1,r---,,’1
10-7 -r-l’.... . .... ------- .%-” .-L.- , --- ...: ::;,::’ “:.-, .& .--s --- ,, ..... ------- ------- ---------- ---- .-,-......1: ... .. .. . .. ... . . . . . .. . . . . . . . .. . .. ... . . .. .. . . . ..“”...,.:
fo+
Energy / MeV, 50 mm depth
Figure 27: Results of MCNP calculations on the effect of tungsten filtration of theNTF beam.
The measured boron dose enhancement was boosted to 5%= 4’%as compared with
the unmodified beam. This enhancement is, however, still insufficient.
To test the influence of the collimator material on the neutron spectrum, a
240 mm x 240 mm size collimator was blocked down to a 120 mm x 120 mm
field size. For this, steel blocks, that extend 200 mm into the collimator, were
used. Figure 30 illustrates this setup. Results are shown in figure 31, Again, the
measured boron dose enhancement was slightly boosted to 57c& 4YcaS compared
with the unmodified beam.
If both, the 90 mm tungsten filter and steel blocks, are used, the boron dose
enhancement is boosted to 7% + 470. Results for this run are shown in figure 32.
Last, the reduction of the proton energy to 37 MeV was investigated. In addi-
tion to decreasing the proton energy, the resulting neutron beam was also filtered
by 90 mm tungsten. Results are shown in figure 33. With this setup the boron
dose enhancement increases to 12%+ 4~o.

69
ProportionalTungsten CountersFilter /
14!!-\ HeadPhantom
,. /i<,., ,:“;;.‘.,...........,,... .
;...‘, :; ,,,.,.
mI
Iso-center
Figure 28: Side view of counter setup in the treatment room for the tungstenfiltered beam BNC measurements.
7.7 Discussion
The above measurements show that at most a 3 % boron dose enhancement can
be achieved in the modified neutron beam for a 50 ppm boron loading.
Even though, it is possible to further filter the beam, e.g., to use a thicker
tungsten filter, there are practical limitations to this. Using a 90 mm tungsten
filter reduces the dose rate to 20 %, which would result in treatment time up to 30
minutes. Much longer treatment times are unacceptable. The dose rate reduction
due to the proton energy change is not known, but this fiuther reduction might
already be unacceptable. It also has to be kept in mind that the modified beam h~ _
a different RBE. Figure 34 shows the A-150 spectra measured in modified beam
and the regular beam. Convolution of both spectra with a biological weighting
function indicates a 20 % increase in the modified beam’s RBE, which indicates
that a modified beam may have quite different characteristics which need to be
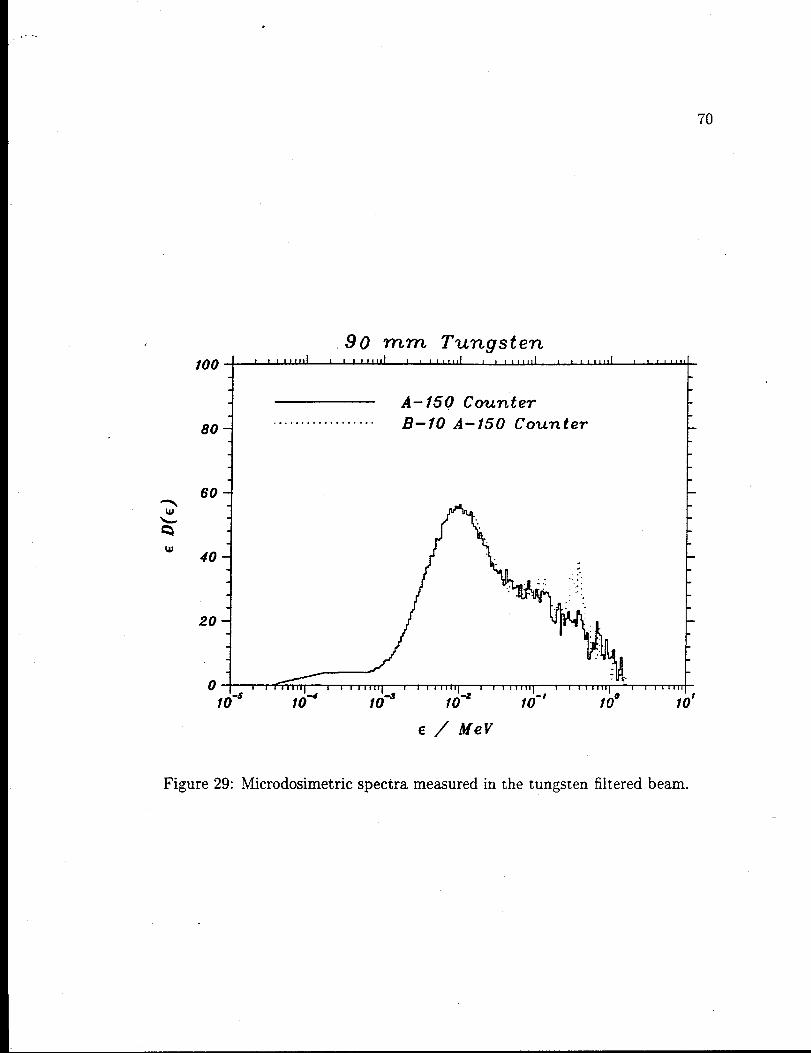
70
90 mm Tungsten100 * 1 I I1OII , 1 1* 11,1 I , I t I Ittl , t , , ,11 , * t , I , , I , , :,
A- 150 Counter.. . . . . . . . . . . . . . . . .
80- B-10 A-150 Counter
60 1
E / fUe V
Figure 29: Microdosimetric spectra memured inthetungsten filtered beam.

SteelBlocks
71
ProportionalCounters
~ 4JHeadPhantom
/::.: .,.,. .. “.,..-.,‘,:. .,!’”.,.,.,.*.,,,$.,;“.,,, ,,’.>:.~.;$,’,
ElevatorPlatform
Iso-center
Figure 30: Side view of counter setup in the treatment room for the steel collimatedBNC measurements.
taken into account.
In conclusion, the use of BNC in the fast neutron beam is not feasible, unless.
the neutron spectra is further modified or, better, boron compounds that achieve
a higher boron concentration in the tumor tissue become available.
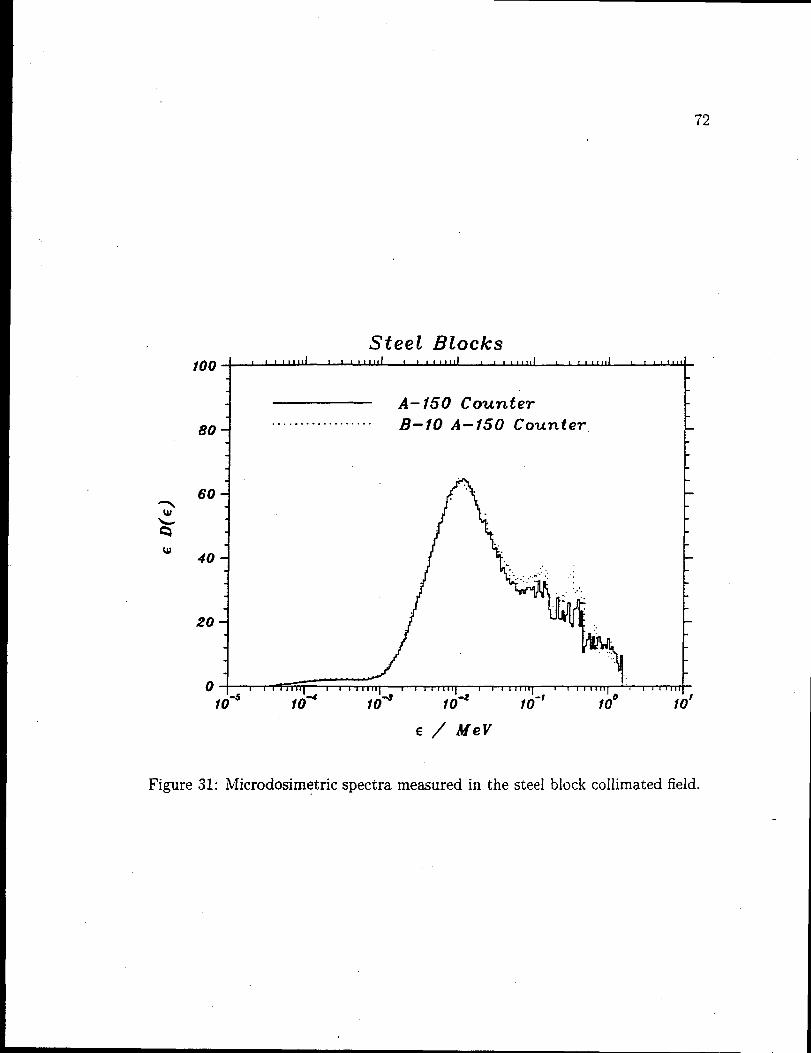
72
w
Steet Blocks100 I 1 , I ,111/ , , ,I ,1,11 , , t t ‘ 1* I , , , t 111,/ t , ,1 , , , , ,11
A-150 Counter
80-.. . .. ..- . . .. .. . .. . B-10 A-150 Counter
60-
40–
20-
0 i I,#1111,1,1,,1, 1 tI4i,,8 i ,,,trat , , J,, , I 4 , ITIT -
10-5 104 10+ 104 10-’ 10° 10’
E / Aie V
Figure 31: Microdosimetric spectra measured in the steel biock collimated field.

.
73
Steel Blocks and 90 mm Tungsten100 f 1tt8188111i t91111*1al*#@l18*1,*I8 1 t f1lltll 1 1 s9**B,
I
.................. B-10 A-150 Counter
80- A-150 Counter
60-%%........-..
40- .
20-
0 I i1I,,,, 1 #,I111111 i,I,1,1 1 I1,1,,,,1 101*II: 1 t8I1111-10-5 104 10+ 104 fo-’ 10° to’
E / dfeV
Figure 32: Microdosimetric spectra measured in the steel block collimated andtungsten fiItered fieId.
—

74
%,7.,:.,: . .
,,,
. ..!,,’
,;, .:
.
37 MeV and 90 mm Tungsten100 I 11,11,1[1 , , I11111, , I#lltll , I t ,, tt t , #,11111 t t ,,1111
A– 150 Counter
80-. . . . . . . . . . . . . . . . . . B-10 A-150 Counter
-.
,60- .,.. ....+ .. .... .. ..... . ... ..
40-
20-
..0 , ,, 11s,,, IIII,1118 t I t 1111 1 1 i , t,,, , , v rcttl
T.I I ‘ ,$
10-5 104 10+ 10-2 to-’ /0°
Figure 33:beam.
E / MeV
Microdosimetric spectra measured in the 37 .MeV and tungsten filtered

75
/
w
100 , 1 , 1 , ,11 I I t 1 II*, t 1 1 1 191, 1 , 1 t 11111 t , t 1 , 111 , I * I ,,,,
37 MeV mad 9 cm W-filter A-150 Spectrum ... . . . .. .. . .. . .. .. .. Unmod~. ~ed Beam A-150 Spectrum
80 j
....“
. .
60- ...“.“.“.-
40- s“.........“.:.-...;.... %..
.“ ..,.L
20-.“......... .....
................“o- ~q 1 1r1,,11 I 1.,111l,, t t1,111111 1IIIll&l7 ,,,1111?O-s 10-’ fod to-a ?0-’ 10° 10’
Figure 34: A-150 microdosimetricfied beam.
E / fUeV
spectra measured in the modified and unmodi-
76
Chapter 8
Conclusions
Using microdosimetry, the absorbed dose conversion factor from A-150 plastic to
ICRUtissue wasascertained to be O.W+ O.04. Currently, therecommended [34]
conversion factor of 0.95 is used at NTF. This discrepancy leads to an overestima-
tion of the NTF tissue dose by 3 %, i.e., NTF doses are 3 % smaller than prescribed.
Here a correct determination of the absorbed dose in A-150 tissue’ equivalent plas-
tic is assumed. Due to the wealth of clinical information and experience obtained
in this beam, its clinical effects are well characterized and optimized. An adjust-
ment in the delivered doses is therefore not recommended. The overestimation in
NTF doses is however particularly important when clinical results are compared
between different neutron therapy facilities.
It would be well worth to repeat this investigation in other neutron therapy
beams, since all facilities rely on recommended conversion factors. The deter-
mination of tissue dose is of paramount importance when clinical information is
exchanged.
The qualitative information provided by microdosimetry was used to map vari-
ations in RBE related quantities throughout the beam. Variations were found to
be significant and an incorporation of these into the treatment planning system,
or, alternatively, the installation of a polyethylene filter in the NTF beam, should
be considered.
Since there is such wealth of clinical information available for the NTF beam, a
correlation of changes in e’ and R with clinical effects could be investigated. Such a
study would be very interesting and could potentially lead to a biological weighting

77
function that could be used to predict variations in clinical effects based variations
in the shape of microdosimetric spectra. NTF is probably the only facility that
has accumulated enough clinical information for a such a study.
Results of our BNC study showed that in the regular NTF beam the boron
dose enhancement for a typical boron concentration is negligible. The beam had
to be modified significantly to achieve an enhancement of 3 Yo. In conclusion, we.“. . . . . ..- ..— .-
could not demonstrate the teasblhty ot,
tumor dose in the NTF beam.
The use of fast neutron beams in the
should still be investigated since neutron
using BNG to significantly enhance the
treatment of glioma multiform patients
beams do control this tumor better than
any other form of radiation therapy. An improvement in neutron therapy treat-
ments for this particularly aggressive tumor relies on improvements in the tumor
to normal tissue dose ratio. The implementation of stereotactic methods at neu-
tron therapy facilities, would result in such an improvement. A study on the
implementation of stereotactic radiation therapy at NTF would be very useful.
78
Bibliography
[1]
[2]
[3]
[4]
[5]
[6]
[71
[8]
..
F. H. Attix. Introduction to Radiological physics and Radiation Dosimety.
John Wiley and Sons, New York, 1986.
M..4wschalom, LRosenberg, and A. Mravca. Kermasfor various substances
averaged over the energy spectra of fast neutron therapy beams: A study in
uncertainties. Med. Phys., 10(4) :395–409, 1983.
G. W. Barendsen, H. M. D. Walter, J. F. Fowler, and D. K. Bewley. Effects
of different ionizing radiations on human cells in tissue culture. Radiat. Res.,.
18:106–119, 1963. “
JM.Beauduin, J. Gueulette, B. M: de Coster, V. Gregoire, M. Octave-Prignnot,
S. Vynckier, and A. Wambersie. Radiobiological intercomparisons of fast
neutron beams used in therapy. Strahlenther. Onkol., 165:263-267, 1989.
D. K. Bewley. The physics and radiobiology of fmt neutron beams. Adam
Hilger, Bristoi, England, 1989.
P. J. Binns. A4icrodosimetry for a Fast Neutron Therapy Beam. PhD thesis,
University of Cape Town, Cape Town, Republic of South Africa, June 1993.
F. P. Brady and J. L. Romero. Neutron induced reactions in tissue resi-
dent elements, final report to the National Cancer Institute, grant no. lRO1
CA16261. Technical report, University of California-Davis, Davis, CA, 1979.
J. F. Briesmeister (Editor). MCNP 4A general Monte Carlo code for neutron
transport and photon transport. Technical Report LA-12695-M, Los Alamos
National Laboratory, 1993.

’79
[9]
[10]
[12]
[13]
[14]
[15]
[16]
G. Buhler, H. Menzel, H. Schumacher, G. Dietze, and S. Guldbakke. Neu-
tron kerma factors for magnesium and aluminum me~ured with low-pressure
proportional counters. Phys. Med. Biol., 31(6):601-612, 1986.
Buhler, G. Anwendung microdosimetrischer Methoden fur die Dosimetrie und
Messung von Ionisationsvertedungen mit metallischen Proportional.zkhlern fur .
Neutronen zwischen 13.9 Me V und 19 Me V. PhD thesis, Universitat des
Saarlandes, Saarbrticken, Federal Republic of Germany, February 1985.
M. B. Chadwick, P- M. DeLuca, Jr., and R. C. Haight. Nuclear data needs
for neutron therapy and radiation protection. Radiat. Prot. Dosim., 70:1-12,
1997.
P. M. DeLuca, Jr., H. H. Barschall, Y. Sun, and R. C. Haight. Kerma factor
of oxygen, aluminum, and silicon for 15- and 20-MeV neutrons. Radiat. Prot.
Dosm., 23:27-30, 1988.
J. L. Fowler. Nuclear Particles in Cancer l’1-eui$men~. Adam Hilger, Bristol,
United Kingdom, 1981.
R. Gahbauer, N. Gupta, T. Blue, J. Goodman, J. Grecula, A. H. Soloway,
and A. Wambersie. BNCT: Status and dosimetry requirements. Radiat. Prot.
Dosim., 70:547-554, 1997.
T. W. Griffin, T. F. Pajak, G. E. Laramore, W. Duncan, M. P. Richter, F. R.
Hendrickson, and M. H. Maor. Neutron vs photon irradiation of inoperable
salivary gland tumors: Results of an RTOG-MRC Cooperative randomized -
study. Int. J. Radiation Oncology Biol. Phys., 15:1085–1090, 1988.
E. Hall. Radiobiology for the Radiologist, Third Edition. J. B. Lippincott
Company, Philadelphia, 1988.

80
[17]
[18]
[19]
[20].
[21]
[22]
[23]
[24]
E. J. Hall, M. Zaider, R. Bird, M. .Astor, and w. Roberts. Radiobiological
studies with therapeutic neutron beams generated by p+Be or d+ Be. Brit.
J. Radiol., 55:640-644, 1982.
C. L. Hartmann, P. M. DeLuca Jr., and D. W. Pearson. Measurement of
neutron kerma factors in C, O, and Si at 18, 23, and 25 MeV. Radiat. Prot.
~OS., 44(1/4):25-30, 1992.
C. K. Hill, R. K. Ten Haken, and M. Awschalom. The lethal effects of Fermilab
fast neutrons vary with the depth of cells in a water phantom. Int. J. Radiation
oncology Biol. Phys., 20:1341-1345, 1981.
S. Hmnsey, R. .Myers, C. J. Parnell, S. W. Blake, and D. K. Bewley. Changes
in relative biological effectiveness with depth of the Clatterbridge neutron
therapy beam. l?rit. J Radiol., 61:1058-1062, 1988.
A. M. Kellerer and H. H. Rossi. The theory of dual radiation action. Current
Topics in Radiation Research Quarterly, 8:85-158, 1972.
C. Kota. Microdosimetric considerations in the use of the boron neutron cap-
ture reaction in radiation therapy. PhD thesis, Wayne State University, De-
troit, Michigan, 1996.
T. K. Kroc. Low intensity configuration at NTF for rnicrodosimetry and spec-
troscopy. Technical Report TM-1940, Fermi N-ational .\ccelerator Laboratory,
Batavia, IL., 1995.
G.E. Laramore, J. M. Krall, F. J. Thomas, K. J. Russell, }1. H. Maor, F. R.
Hendrickson, K. L. Martz, T. W. Griffin, and L. W. Davis. Fast neutron radio-
therapy for locally advanced prostate cancer. Am. J. Clin. OncoL, 16(2):164-
167, 1993.
[25]
[26]
[27]
‘ [28]
[29]
[30]
[31]
[32]
[33]
81
C. M. Lederer and V. S. Shirley. Table of Isotopes-seventh Edition. Wiley
Press, 1978.
A. J. Lennox. Private Communication. 1997.
G. L. Lecher. Biological effects and therapeutic possibilities of neutrons. Am.
J. Roentgenol., 36:1-13, 1936.
Awschalom M., G. M. Lee, M. L. Palmer, and D. E. Young. The Fermilab
neutron radiotherapy facility. 1~~~ Transitions on Nuclear Science, NS-24(3),
1977.
R. L. Maughan, C. Kota, and M. Yudelev. A microdosimetric study of the
dose enhancement in a fast neutron beam due to boron neutron capture. Phys.
Med. Biol., 37:1957-1961, 1992.
H. G. .Menzel, P. Pihet, and A. Wambersie. Microdosimetric specification of
radiation quality in neutron radiation therapy. Int. J. Radiat. Biol., 57(4):865–
883, 1990. .
B. J. Mijnheer, J. J. Batterman, and A. Wambersie. What degree of accuracy
is required and can be achieved in photon and neutron therapy. Radiother.
Oncol., 8:237-252, 1987.
W. Newhauser and U. J. Schrewe. Gas-to-wall absorbed dose conversion fac-
tors for neutron energies of 25 to 250 MeV. Atomic Data And Nuckxw Data
Tabies, 65:37-53, 1997.
W. D. Newhauser. Neutron kerma factor measurements in the 25-MeV to 85-
Me V neutron energy range. PhD thesis, University of Wisconsin, Madison,
Wisconsin, 1995.

[34]
[35]
[36]
“ [37]
[38]
[39]
[40]
[41]
82
.American .Association of Physicists in Medicine. Protocol ~or Neutron Beam
Dosimetry. American Institute of Physics, New York, 1980.
International Commission on Radiation Units and Measurements. Physical
Aspects o~Radiation, volume Report 10b. International Commission on Ra-
diation Units and Measurements, Bethesda, MD, 1964.
International Commission on Radiation Units and Measurements. Radiation
Quantities and “Units,volume Report 33. International Commission on Radi-
ation Units and Measurements, Bethesda, MD, 1980.
International Commission on
dosimetry, volume Report 36.
and Measurements, Bethesda,
Radiation Units and }lemurements. Micro-
International Commission on Radiation Units
MD, 1983.
P. Pihet. Etude microdosimetrique de faisceaux de neutrons de haute energie.
Applications dosimetriques et radiobiologiques (Appendices). PhD thesis, Uni-
versity Catholique de Louvain, Louvain-la-Neuve, Belgium. 1989.
P. Pihet, S. Gerdung, R. E. Grillmaier, A. Kunz, and H. G. ~Ienzel. Critical
assessment of calibration techniques for low pressure proportional counters
used in radiation dosimetry. Radiat. Prot. Dosim., 44(1/4): 115–120, 1992.
P. Pihet, J. Guelette, H. G. Menzel, R. E. Grillmaier. and .4. Wambersie.
Use of microdosimetric data of clinical relevance in neutron therapy planning.
Rad. Prot. Des., 23(1/4):471-474, 1988.
P. Pihet, H. G. Menzel, R. Schmidt, M. Beauduin, and .A. Wambersie. Bi-
ological weighting function for RB13 specification of neutron therapy beams.
Intercomparison of 9 European centers. Rad. Prot. Des., 31(1/4) :437–442,
1990.
83
‘\
.,
[42]
[43]
[44]
[45]
[46]
[47]
[48]
[49]
F. Poller, W. Sauerwein, and J. Rassow. Monte Carlo calculation of the dose
enhancement by neutron capture of B-10 in fast neutron therapy. Phys. Med.
Bioi., 38:397-410, 1993.
I. Rosenberg and lM. Awschalom. Characterization of a pee neutron
therapy beam I: Central axis depth dose and off-axis ratios. A4ed. Phys.,
8:99--104, 1981.
I. Rosenberg, M. Awschalom, and R. Ten Haken. The effects of hydrogenous
and nonhydrogenous filters on the “quality of a pee neutron beam.
Med. Phys., 9:199-203, 1982.
M. A. Ross, P. M. DeLuca Jr., D. T. L. Jones, A. J. Lennox, and R. L.
Maughan. Calculated fluence spectra at neutron therapy facilities. Radiat.
??ot. Dosim., 70:481-484, 1997.
H. H. Rossi and W. Rosenweig. A device for the measurement of dose as a
function of specific ionization. Radiology, 64:404, 1955.
K. J. Russell, R. J. Caplan, G. E. Laramore, C!. M. Burnison, M. H. Maor,
M. E. Taylor, S. Zink, L. W. Davis, and T. W. Griffin. Photon versus neutron
external beam radiotherapy in the treatment of locally advanced prostate
cancer: Results of a randomized prospective trial. Int. J. Radiation Oncology
Bio~. Phys., 28:47-54, 1994.
K. R. Saroja, J. Mansell, F. R. Hendrickson, L. Cohen, and A. J. Lennox.
Failure of accelerated neutron therapy to control high grade astrocytomas. .
Int. J. Radiation Oncology BioL Phys., 17:1295-1297, 1989.
J. J. Schrewe, H. J. Brede, and G. Dietz. Dosimetry in mixed neutron-
photon fields with tissue-equivalent proportional counters. Rad. Prot. Des.,
29(1/4):41-45, 1989.
84
[50]
[51]
[52]
[53]
[54]
[55]
[56]
[57]
U. J. Schrewe, W. G. ~lberts, W. D. Newhauser, H. J. Brede, and P. M.
DeLuca Jr. Comparison of various dose quantities in tissue and tissue substi-
tutes at neutron energies between 20 lMeV and 100 MeV. Rad. Pmt. Dosirn.,
70:17-20, 1997.
U. J. Schrewe, H. J. Brede, S. Gerdung, R. ?Jolte, P. Pihet. P. Schmelzbach,
and H. Schumacher. Determination of kerma factors of A-150 plastic and
carbon at neutron energies between 45 and 66 MeV. hi. Prot. Dosim.,
pages 21-24, 1992.
J. P. Slabbert, P- J. Binns, H. L. Jones, and J. H. Hough. .~ quality assessment
of the effects of a hydrogenous filter on a pee neutron beam. Brit. J.
Radiol., 62:989-994, 1989.
J. B. Smathers, V. A. Otte, .4. R. Smith, P. R. .Mmond, F. H. Attix, J. J.
Spokas, W. M. Quam, and L. J. Goodman. Composition of A-150 tissue
equivalent plastic. A4ed. Phys., 4:74, 1975.
R. S. Stone. Neutron therapy and specific ionization.. Am. J. Roentgenol.,
59:771-785, 1948.
R. S- Stone, J. H. Lawrence, and P. C. .4ebersold. .~ preliminary report on
the use of fast neutrons in the treatment of malignant disease. Radiology,
35:322-327, 1940.
L. M. Van Putten and R. F. Kallman. Oxygenation status of a transplantable
tumor during fractionated radiation therapy. J. NatL Cancer Inst., 40:441-
451, 1968.
.A.J. Waker. Experimental uncertainties in microdosimetric measurements and
an examination of the performance of three commercially produced propor-
tional counters. Nucl. Instr. and Meth.., .A234:354–360, 1985.

[58)
[59]
[60]
[61]
[62]
[63]
[64]
A. Wambersie.
reality. Radiat
A. Wambersie.
85
Neutron therapy: From radiobiological expectation to clinical
Prot. Dosim., 44:37g-395,1992.
Contribution ofmicrodosimetry to thespecification ofneutron
beam quality for the choice of the ‘clinical RBE’ in fast neutron therapy.
Radiat. Prot. Dosim., 52:453-460, 1994. ‘
.4. Wambersie and H. G. Menzel. Specification ofabsorbed dose and radiation
quality in heavy particle therapy (A review). Radiat. Prot. Dosim., 70:517–
527, 1997.
F. M. Waterman, F. T. Kuchnir, L. S. Skaggs, D. K. Bewley, B. C. Page,
and F. H. Attix. The use of B-10 to enhance the tumor dose in fast neutron
therapy. Phys. Med. “Biol., 23:592-602, 1978.
P. Wootton, R. Risler, “J. Livesey, S. Brossard, G. Laramore, and T. Griffin.
Boron neutron capture enhancement of the tumor dose in fast neutron therapy
beams. In Progress in Neutron Therapy for Cancer, New York, United States
of America, 1992. Plenum Press.
C. S. Wuu, H. I. Amols, P. Kilauga, L. E. Reinstein, and S. Saraf. Nli-
crodosimetry for boron neutron capture therapy. Radiat. Res., 130:355–359,
1992.
P. G. Young, E. D. Arthur, M. Bozoain, T. R. England, G. M. Hall, R. J.
LaBauve, R. C. Little, R. E. MacFarlane, D. G. Madland, R. T. Perry, and
W. B. Wilson. Transport libraries for incident proton and neutron energies to -
100 MeV. Technical Report LA-11753-MS, Los Alamos National Laboratory,
Los Alamos, NM, USA, 1990.