Embed Size (px)
Citation preview

1
Requirements Specification

2
Overview:
Our project team will design and build a portable generator powered by the rotary action of a bicycle wheel, capable of generating environmentally clean energy which may be used for supplying low power applications (up to 100 W). The energy storage unit may either be simply charged exclusively while pedaling, or some of the power may be routed to an attached headlight, lowering the charge rate on the energy storage unit by a small amount (not more than 20 W). Once charged, the energy storage unit may be detached and later used as a standalone power supply.
Problem Statement:
In a world where more people in our society are exhibiting environmental conscientiousness, bicycles are rapidly becoming the most economically and ecologically viable alternative transportation method. This can be attributed to the bicycle’s lack of emissions and gasoline expenses. Consumers who have already acknowledged the benefits of this form of transportation would undoubtedly be attracted to a way to increase the bicycle’s positive environmental impact even more.
Through P.E.E.V.S., we aim to reach out to these potential consumers. By designing a portable energy storage unit which uses the bicycle as a renewable mechanical source of energy in order to supply low power loads (cell phones, laptops, etc.), we will add yet another benefit to the list of the bicycle’s environmental contributions.
Operation:
Operation of the device will be simplistic and intuitive, such that the bicycle is not any more difficult or unwieldy to ride (based on O2 consumption) than any other conventional bicycle. While in use, the movement of the bicycle’s wheel automatically stores energy to the unit through a generator. The user may flip a switch attached to the handlebars if he/she wishes to instead power a mounted headlight.
Once charged, the user may detach the energy storage unit from its housing on the bicycle, which may then be used to power other electrical loads once an on/off switch allowing electrical discharge has been flipped to the ‘on’ position. The user will be notified once the supply has been depleted of energy and has cut off discharge, so that the user may then reattach it to the bicycle in order to charge it again.

3
Deliverables:
• Mobile bicycle with gear shifting capabilities and power supply mount
• Detachable energy storage unit with LED indicators
• Generator
• LED headlight with on/off switch
• User’s manual
• Circuit diagrams/schematics including analysis and simulations
• CAD drawings and analysis
• Final report including test results, list of materials, and final design
Draft User’s Manual:
Setup:
• Flip power supply discharge switch to the ‘off’ position
• Mount power supply - Fasten and tighten housing clamps - Plug in LED headlight (ensure headlight switch is in the ‘off’
position) - Connect energy storage unit to generator system
Operation:
• Ride bicycle in order to charge power supply
• For night riding, user should flip both the power supply switch and the headlight switch to the ‘on’ position to power the headlight
• Once the power supply has been fully charged as indicated by an LED on the power supply, the supply may be detached after ensuring that both switches are in the ‘off’ position
• At this point, one or two low-power loads (not to exceed 100W) may be plugged into the energy storage unit
• Charging of the low power device will begin once the user has flipped the discharge switch to the ‘on’ position
• The energy storage unit will no longer discharge once the voltage level drops to a predetermined threshold, as indicated by a low power LED
• Repeat setup instructions for further use
Maintenance:
• Store bicycle in a dry location protected from the weather

4
• Ensure that the discharge switch is set to the ‘off’ position when not in use
• Normal bicycle maintenance applies (chain tension and lubrication, tire pressure, etc.)
User Interface:
• On/Off switch for headlight
• On/Off switch for energy storage unit
• LEDs indicating maximum charge and low power Physical Capabilities:
• Easily rideable (such that the supply may be fully charged in 2.5-3 hours of pedaling at a rate of approximately 50 rpm with the rider’s oxygen consumption ranging from 1-1.5 L/min.)
• 12-14 W headlight operated by an On/Off switch with a 15-20o beam dispersion, able to illuminate a distance in front of the rider up to at least 30 meters with maximum intensity of at least 20 candela.
• Headlight will run continuously (with constant luminosity, beam dispersion, etc.) as long as the power supply discharge switch is in the ‘on’ position and the charge level in the supply is above the cutoff threshold
• Will be able to support two low-power electrical loads (up to 100 W each for two hours)
• Generator able to generate 125-150 watts
• Energy storage unit maximum capacity of at least 400 watt-hours
• Waterproof power supply casing
• Automatic cutoff when the charge drops below 5% of its maximum capacity
System Testing:
Supply testing: The energy storage unit will be tested over 20 complete charge/discharge cycles at a supply rate of no less than 40 W*hr to confirm that the system performs as well as originally specified. The cutoff system must be shown to occur within a 20% tolerance of the 5% charge level cutoff threshold.

5
Peripheral testing: Through night-time testing it must be demonstrated that the headlight is capable of meeting all of the above listed physical qualities.
Mechanical testing: Due to the addition of external parts on the bike, testing will need to be done to ensure that the structural integrity of the bicycle is not compromised. We will measure and record the initial tire pressure, tread height, bolt tightness, etc. of the bike. We will then ride it at a steady rate of 40-50 pedal rpm for a total of 25 hours and record the new measurements, which will then be compared quantitatively. All measured values should be within 10% of the original values.
Ease of ride testing: In order to verify the comparative ease of riding the bicycle with existing industry standards, the oxygen consumption for a batch of three students will be measured while riding
for 2.5-3 hours at an average of 50 RPM, and aiming for an oxygen consumption of 1-1.5 L/min.

6
Mechanical Progress
7
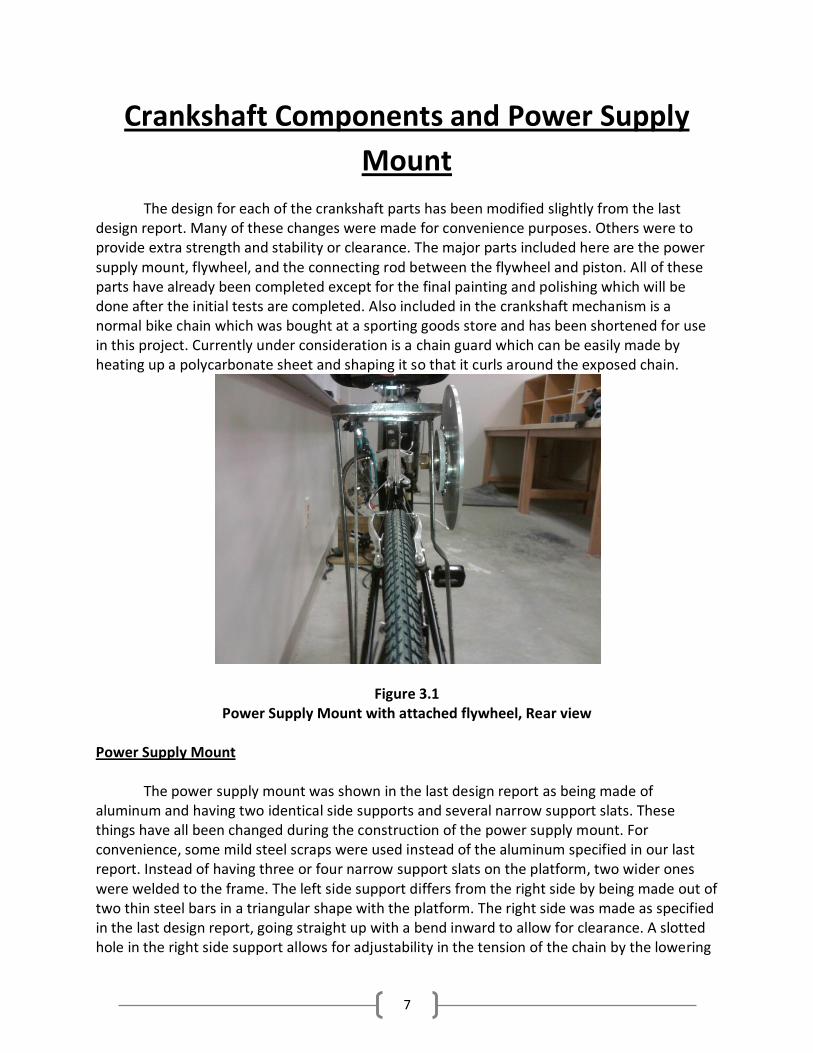
Crankshaft Components and Power Supply Mount
The design for each of the crankshaft parts has been modified slightly from the last design report. Many of these changes were made for convenience purposes. Others were to provide extra strength and stability or clearance. The major parts included here are the power supply mount, flywheel, and the connecting rod between the flywheel and piston. All of these parts have already been completed except for the final painting and polishing which will be done after the initial tests are completed. Also included in the crankshaft mechanism is a normal bike chain which was bought at a sporting goods store and has been shortened for use in this project. Currently under consideration is a chain guard which can be easily made by heating up a polycarbonate sheet and shaping it so that it curls around the exposed chain.
Figure 3.1 Power Supply Mount with attached flywheel, Rear view
Power Supply Mount
The power supply mount was shown in the last design report as being made of
aluminum and having two identical side supports and several narrow support slats. These things have all been changed during the construction of the power supply mount. For convenience, some mild steel scraps were used instead of the aluminum specified in our last report. Instead of having three or four narrow support slats on the platform, two wider ones were welded to the frame. The left side support differs from the right side by being made out of two thin steel bars in a triangular shape with the platform. The right side was made as specified in the last design report, going straight up with a bend inward to allow for clearance. A slotted hole in the right side support allows for adjustability in the tension of the chain by the lowering

8
or raising of the flywheel. One thing that was not previously specified was how the power supply mount would be attached to the seat post. It has since been decided that a simple plumbing clamp can be bolted to the rack and tightened around the seat post. The rack has been made so that it can be adjusted to fit perfectly onto the bike.
Figure 3.2 Power Supply Mount, Right side view
Figure 3.3 Power Supply Mount, Top view
Flywheel
The flywheel consists of a 22-tooth chain-ring bolted to a 7.5in (19.05 cm) aluminum disc. The last design report did not specify exactly how the assembly would come together. The

9
chain-ring is bolted directly to an aluminum disc that is smaller than the chain-ring itself to provide clearance for the chain. This is done to provide extra stability and strength for the chain-ring. This assembly is then bolted to the larger disc with spacers for clearance between the chain and the large disc. The 7.5in (19.05 cm) disc has been machined so that a ball-bearing has been press-fit into the center and a countersunk hole has been drilled 3in (7.62 cm) from the center. This hole is where the connecting rod attaches to the flywheel.
Figure 3.4 Flywheel (Top View)
Figure 3.5 Flywheel (Bottom View)
10
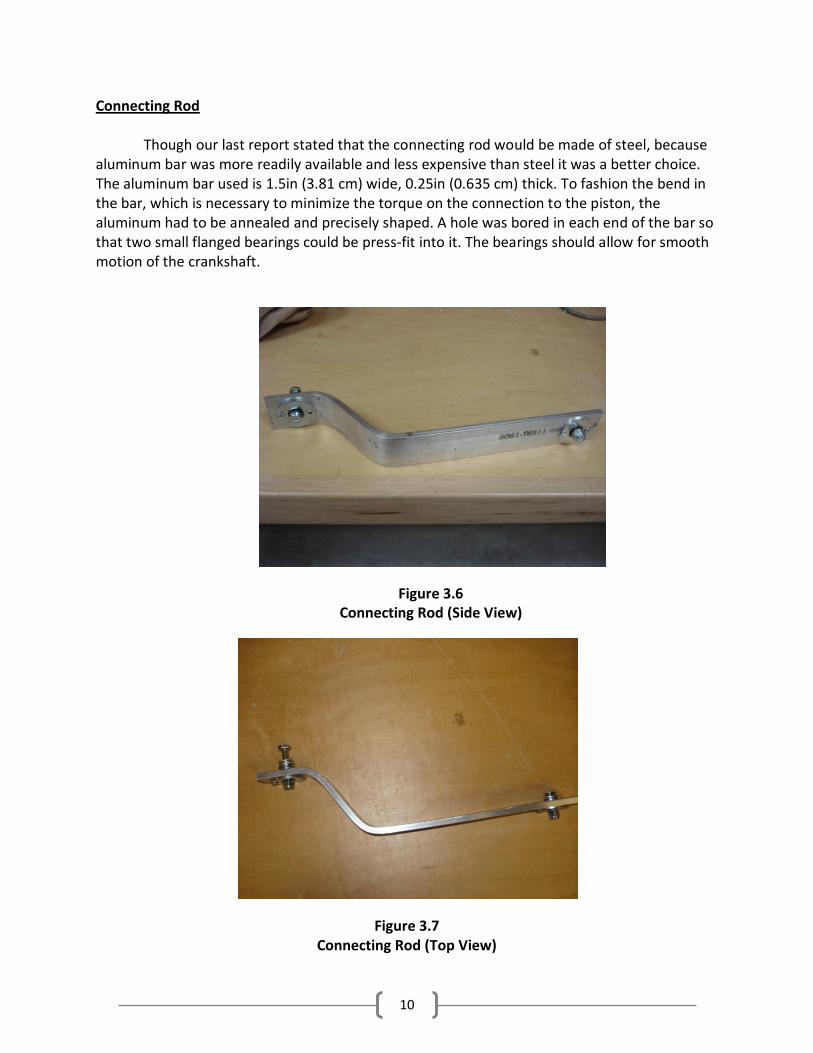
Connecting Rod
Though our last report stated that the connecting rod would be made of steel, because aluminum bar was more readily available and less expensive than steel it was a better choice. The aluminum bar used is 1.5in (3.81 cm) wide, 0.25in (0.635 cm) thick. To fashion the bend in the bar, which is necessary to minimize the torque on the connection to the piston, the aluminum had to be annealed and precisely shaped. A hole was bored in each end of the bar so that two small flanged bearings could be press-fit into it. The bearings should allow for smooth motion of the crankshaft.
Figure 3.6 Connecting Rod (Side View)
Figure 3.7 Connecting Rod (Top View)
11
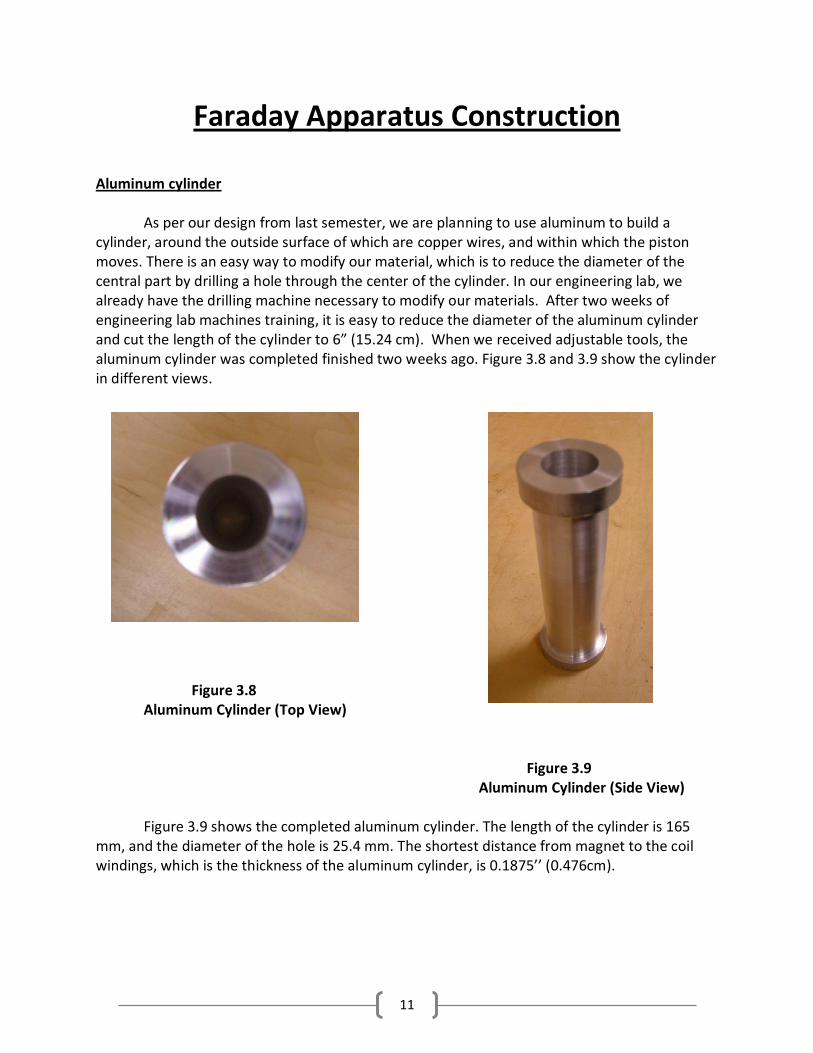
Faraday Apparatus Construction
Aluminum cylinder
As per our design from last semester, we are planning to use aluminum to build a cylinder, around the outside surface of which are copper wires, and within which the piston moves. There is an easy way to modify our material, which is to reduce the diameter of the central part by drilling a hole through the center of the cylinder. In our engineering lab, we already have the drilling machine necessary to modify our materials. After two weeks of engineering lab machines training, it is easy to reduce the diameter of the aluminum cylinder and cut the length of the cylinder to 6” (15.24 cm). When we received adjustable tools, the aluminum cylinder was completed finished two weeks ago. Figure 3.8 and 3.9 show the cylinder in different views.
Figure 3.8 Aluminum Cylinder (Top View)
Figure 3.9 Aluminum Cylinder (Side View)
Figure 3.9 shows the completed aluminum cylinder. The length of the cylinder is 165
mm, and the diameter of the hole is 25.4 mm. The shortest distance from magnet to the coil windings, which is the thickness of the aluminum cylinder, is 0.1875’’ (0.476cm).

12
Phenolic Piston For the piston part, we initially decided that the magnet would be fixed to the phenolic piston with the connecting rod. With this connection, the magnet would be strongly held to the piston. However, because we don’t know how hard the magnet is, we were afraid that the magnet would crush while being cut. Due to budget concerns, we did not use our only magnet to test, so we switched to another way involving glue. The process here is to first drill a hole in the piston with 25.4 mm deep and 22.2 mm wide first, as shown in Figure 3.10, and then to put the magnet into the hole and fix it there with glue. At the other side of the piston, a hole which connects to the flywheel with connecting rod will be drilled to allow the piston to move. Furthermore, when all the components are mounted and tested, we will reduce the diameter at the center of the piston to reduce the frictional force experienced, and then measure and evaluate the new total friction. Before the final friction test, we will measure the friction present at the normal diameter, which is 25.4 mm diameter along the piston.
Figure 3.10 Modified Phenolic Piston
13
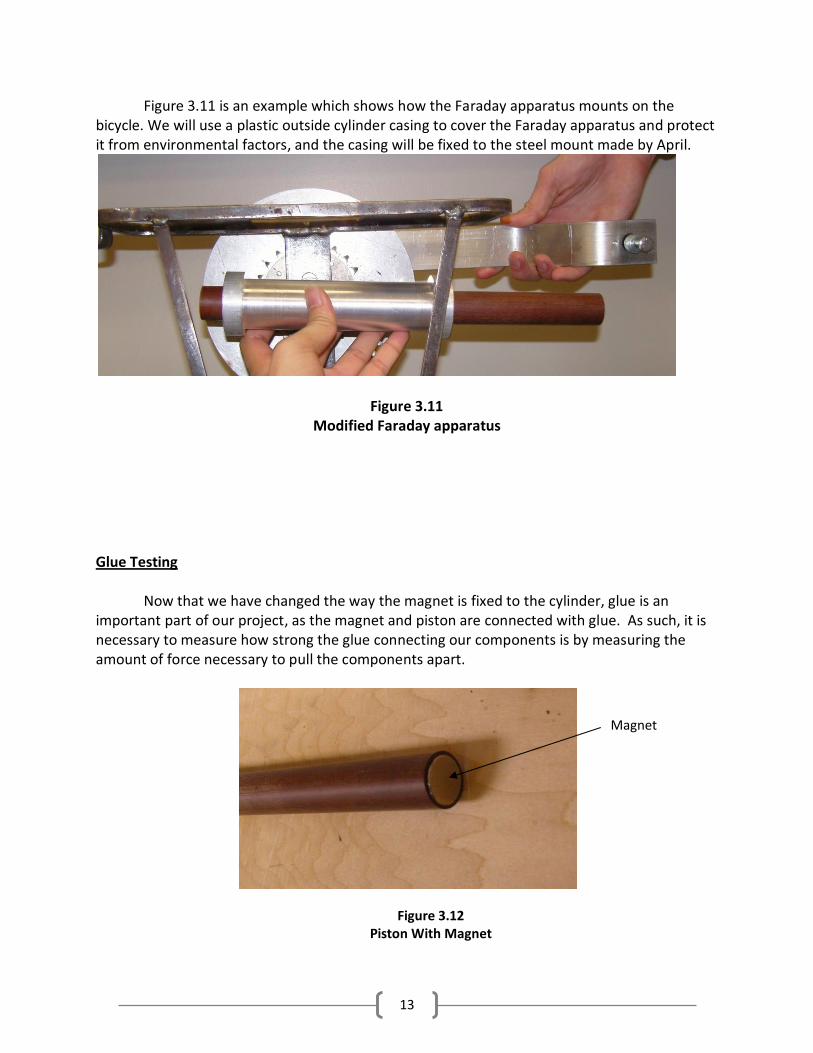
Figure 3.11 is an example which shows how the Faraday apparatus mounts on the bicycle. We will use a plastic outside cylinder casing to cover the Faraday apparatus and protect it from environmental factors, and the casing will be fixed to the steel mount made by April.
Figure 3.11 Modified Faraday apparatus
Glue Testing Now that we have changed the way the magnet is fixed to the cylinder, glue is an important part of our project, as the magnet and piston are connected with glue. As such, it is necessary to measure how strong the glue connecting our components is by measuring the amount of force necessary to pull the components apart.
Figure 3.12 Piston With Magnet
Magnet

14
Figure 3.12 is a shot showing that the magnet is completely fixed in the piston with strong glue.
Because we cannot directly measure how much force is needed to pull the piston and magnet apart, we use two congruently cut segments of aluminum bar in lieu of the piston and magnet. Using different types of adhesive glue to fix these two parts, we will then use an Instron machine to measure how much force is needed to separate the connecting bar. Figures 3.13 and 3.14 show the two pieces of aluminum used in the simulation. This test is very important to our project, because when the piston is moving, the magnet may vibrate strongly, and if the magnet is not fixed well, the magnet probably comes out from the piston. So testing glue can help us make sure that the magnet will come out of the piston or not while the piston is moving.
Figure 3.13
Glue Testing (Separate Halves)
Figure 3.14 Glue Testing (Combined Halves)

15
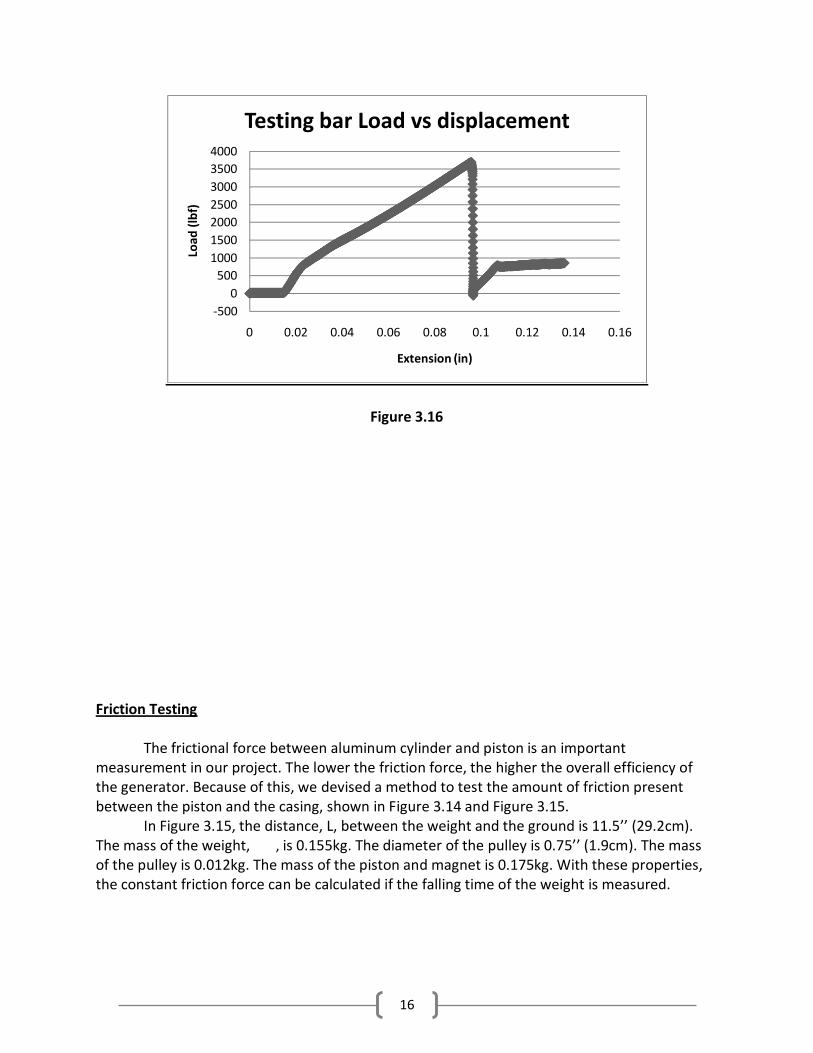
An Instron machine can be used to measure the force that pulls the aluminum bar away. The testing bar was already glued for two days with epoxy glue. Figure 3.15 shows how the aluminum testing bar was set up in the Instron machine before testing. In figure 3.16, the load is increasing while the displacement rises. The maximum load in the testing bar is 3694lbf (16.432 kN). This indicates to us that the glue tested has more than enough tensile strength to fix the magnet to the piston. In our project, none of the forces present will ever come close to exceeding 16.432 kN. The conclusion is that the magnet will securely fastened to the piston using this glue.
Figure 3.15
Instron with glue testing bar
16
Figure 3.16
Friction Testing The frictional force between aluminum cylinder and piston is an important measurement in our project. The lower the friction force, the higher the overall efficiency of the generator. Because of this, we devised a method to test the amount of friction present between the piston and the casing, shown in Figure 3.14 and Figure 3.15.
In Figure 3.15, the distance, L, between the weight and the ground is 11.5’’ (29.2cm). The mass of the weight, , is 0.155kg. The diameter of the pulley is 0.75’’ (1.9cm). The mass of the pulley is 0.012kg. The mass of the piston and magnet is 0.175kg. With these properties, the constant friction force can be calculated if the falling time of the weight is measured.
-5000
5001000150020002500300035004000
0 0.02 0.04 0.06 0.08 0.1 0.12 0.14 0.16
Load
(lbf
)
Extension (in)
Testing bar Load vs displacement

17
Figure 3.17
Frictional Force Experiment
Figure 3.18
Frictional Force Experiment
Weight
Piston
Cylinder Pulley
L

18
We will set up these devices to measure the friction force between the piston and cylinder. Before testing, there are several things that need to be measured: the mass of the weight, the mass of the piston, the height of the weight. Furthermore, we also need to calculate Moment of inertia of the pulley. The only thing need to be measured during the experiment is the time when the weight hit the ground. Equation to calculate the moment of inertia:
=12
Where is the mass of the pulley r is the radius of the pulley Free body diagram
1. For piston
− =
2. For pulley
− =
3. For weight
− =
4. For acceleration
= −
Substituting these four equations, we arrive at the final equation describing the friction present:
=
+ − −
=
( ) Where: is the moment of inertia
Piston Ts Ff
Ts
Tw
Weight
Tw
W

19
is the acceleration of weight is the radius of the pulley is the mass of the weight is the mass of the piston is the weight
t is the duration of weight falling Results We did this experiment twenty times, and the average falling time is 0.38 seconds. Using the equations shown above, the constant friction force is shown to be 1.02 N, which is truly negligible. The low friction force means the coefficient of friction force between aluminum and phenolic is very small. With such a low amount of friction present, the efficiency of the bicycle will surely benefit.

20
Electrical Progress

21
Components Testing
The first step in beginning the construction of the electrical system, as shown in the final design report’s Gantt schedule, was testing components received for condition and correct functionality. Listed are the components whose testing has been completed. Rectifier Diodes – The four rectifier diodes were each tested with a straight DC input to verify the voltage drop across each and then wired in a full-wave rectifier configuration and tested with a 60 Hz, 20 VAC input signal to ensure proper rectification. Full-wave rectification occurred as expected, with a voltage drop of 1.6 V across any path taken through the rectifier. Capacitors – The twelve high voltage 330 µF capacitors were individually tested to verify charge and discharge characteristics, then wired to the rectifier circuit with a 1 kΩ load to test that the rectified signal may filtered to a consistent DC level. The schematic of the test circuit is shown below. After some iteration, it was determined that eight of the capacitors should be placed in parallel after the rectifier to achieve the appropriate amount of filtering (within 10% tolerance of the baseline voltage). The other four capacitors are being placed before and after the SLA in order to level out any signal perturbations which may manifest themselves.
Figure 3.19
Rectifier and Capacitor Test Circuit Multisim Schematic Lead Acid Battery – The SLA was first charged to maximum capacity using a lead acid battery charger at 2 A. Maximum capacity was found to be 13.0 V when measured while disconnected

22
from the charger. The battery was then discharged across a resistive a load to 12 V, and charged back up again, this time at 8 A. No noticeable temperature increase of the battery or any difficulties in charging were detected at that current. Headlight – I tested the headlight quickly with 4 AAA batteries to test functionality, and the headlight functioned correctly. I then took off the headlight’s protective case, found the positive and negative terminals, and successfully powered the headlight by wiring those terminals up to an adjustable power supply set at 6 V. MAX8211 – I breadboarded both MAX8211 chips to test functionality and adjusted resistances to account for tolerances in the resistors and the experimental internal reference voltages of the ICs. After realizing that the output pin of the MAX8211 sinks current instead of supplying it, I successfully measured logical output transitions at the correct thresholds for both the overcharge protection and discharge cutoff systems. The transistors used for the cutoff systems had to be switched from NPN to PNP junctions for the discharge cutoff and vice versa for the overcharge protection after learning that the output pin did in fact sink current. Power Inverter – I successfully tested the power inverter in the car to make sure that it would correctly power a load using my laptop and my cell phone charger. I then took the inverter case apart to find the positive and negative terminals, cut and stripped its power cord, and spliced lab wires on in order to hook the inverter up to the positive and negative terminals of the lead acid battery. Using that setup, I was able to successfully power both my laptop and cell phone again. * The DC/DC converter has not yet been tested because its package is a 10L µMAX, which can’t be breadboarded in a prototyping board

23
Design Considerations
Relay Selection - One of the critical design components which we were never able to locate in the fall is an electronic relay which could be used in the cutoff systems. Finally, we located a solid-state relay denoted KG1010D which met all the performance specifications needed for our system. At $24.95 a unit, it would have been nice to find something cheaper, but nothing else has turned up which might serve as less expensive substitute, and such a cost is within our budget limitations. The data sheet is included in the “Appendices” section. Because the original design for the cutoff systems used “energize to break” type relays, the design for the cutoff systems had to be altered to accommodate the KG1010D, which is a “energize to make” type. The alterations to the design, including the new resistance values determined through experimentation with the MAX8211 voltage detector and changes in transistors, are shown following.
Figure 3.20 Overcharge Protection Multisim Representation

24
For this circuit, when the voltage across the battery is below 13 V, the logical output of the MAX8211 is essentially low, forward biasing the PNP transistor and allowing current flow from the generator to the relay and logic inverter. The logic inverter pulls that signal low, and the LED indicator stays off. The relay is energized, closing the switch and allowing the battery to charge. If the voltage across the battery is greater than or equal to 13 V, the output of the MAX8211 is essentially high, and no current flows from the emitter to the collector of the PNP. Thus, the logic inverter input is pulled to ground across the 300 kΩ resistor and the LED receives a high signal, turning it on. The relay is not energized, such that the switch is open and no current flows from the generator to the battery. Note that ground and supply for the inverter are not drawn, but are included in the PCB layout.
Figure 3.21 Discharge Cutoff Multisim Representation
When the voltage across the battery is above 11.8 V, the logical output of the MAX8211 is essentially high, such that no current may flow from the collector to the emitter of the PNP transistor. The LED is off, and the input of the inverter is pulled low through the 300 kΩ resistor. The inverter then energizes the relay, closing the switch and allowing current flow from the battery to the electrical load. However, if the battery voltage drops below 11.8 V, the logical output of the MAX8211 switches to low, forward biasing the NPN transistor, turning on the LED, and de-energizing the relay. The switch opens, and no current flows from the battery to the load, preventing the battery from undersupplying the load.

25
DC/DC Converter – Although testing for the DC/DC converter will not be possible until it is attached to the PCB, design of the various peripheral circuitry for the MAX1745 still had to be conducted based on the specifications set forth in Maxim’s data sheet.
Figure 3.22 DC/DC Converter Multisim Schematic
The capacitances for C1, C2, and C3 are predefined in the product data sheet, with the stipulation that the capacitors used not be aluminum electrolytics, a construction which is not capable of handling the high frequencies generated by the DC/DC converter as well as ceramic capacitors can. R2 and R3 are voltage dividing resistors which set the output voltage level based on the input to the system, and thus may not be determined until the potential which may be generated by the Faraday apparatus is known. D2 is a standard PN-junction diode, but D1 is a Schottky diode which must be rated for at least 40 V. R1, which has been ordered as a free sample, is the current sensing resistor, and is determined by the following equation:

26
R = V
1.3 ∗I( )
VCS is typically set to be about 100 mV, and IOUT(MAX) was determined to be about 8 A for the Faraday apparatus in calculations made in the fall. Plugging those numbers in yields a resistance of 9.6 mΩ ≈ 10 mΩ. The current sensor was located on an online vendor site for KOA Speer Electronics, and five samples were ordered just to be safe.
The P-channel MOSFET acts as an external switch for the DC/DC converter, allowing it to create a high frequency PWM with a duty cycle set by the voltage divider on the feedback pin. Its qualifications, as set by the data sheet, were a low gate charge (< 80 nC), and drain-to-source resistance comparable to the current sensing resistor. Finally, the 100 µH inductor was selected on the basis of a very low coil resistance (37 mΩ) and a high DC current rating (7 A). These qualifications were best met by a toroidal inductor found on Jameco, so that part was selected for the design. Linear Regulators – Although too inefficient to be applied in regulating the power signal, two points in the electrical system will still require a 5 V supply: the headlight and the logic inverter. To this end, two 5 V linear regulators rated at up to 2.2 A were purchased in order to ensure that those needs are met. PCB Design – After completing the changes to the overcharge protection and discharge cutoff systems and determining the appropriate values and arrangements of the peripheral components for the DC/DC converter, the PCB was ready to be designed. The layout was done using PCB Artist, the software required by 4PCB, which is the company we plan to hire to print off the circuit board for us. The figure is shown below, although not to scale. Actual circuit dimensions will be 4” x 6” (101.6 mm x 152.4 mm).

27
Figure 3.23 Electrical System PCB Layout (using PCB Artist)

28
Updated Budget
Already purchased: Item Vendor Cost Bicycle Wal-Mart $214.92 Headlight B2Cshop24.com $7.34 Headlight Replacement B2Cshop24.com $7.34 Copper wire Smallparts.com $26.59 Magnets Bunting
Magnetics $40.60
LEDs jameco.com $8.08 Phenolic, Aluminum, Plastic
$56.00
Solid-State Relays jameco.com $49.90 Pencil Sharpener (mock-up)
Staples $10.79
Power Inverter Wal-Mart $19.59 Lead Acid Battery BMF Batteries $152.04 12 x 330 µF Capacitors Pololu Robotics $11.15 4 x Rectifier Diodes Allied Electronics $9.68 Chain Sport’s Basement $8.74 Bearings Grainger $25.96 22-Tooth Gear Sport’s Basement $7.65 34 AWG Magnet Wire Powerwerx $13.21 2 x Voltage Detectors Maxim $0.00 (Samples) 2 x DC/DC Convertors Maxim $0.00 (Samples) DC/DC Converter Components
Jameco.com $20.20
Glue Lowe’s $10.00 Total Spent: $733.42
To be purchased:
Item Possible Vendor Cost Circuit Board 4pcb.com $35.00 Power Supply Case Materials
Lowe’s $30.00
Contingencies $51.58 Total Remaining: $116.58

29
Analysis of Budget
As of now, all major components have been purchased with the exception of the PCB board and the materials necessary to manufacture the power supply case. After it has been purchased, approximately $50 will remain for contingency. Because the manufacturing of the mechanical components is nearing completion, and as much testing of mechanical components must wait until the PCB board arrives from 4PCB, most of that contingency will most likely be spent on electrical components. Should we need to order another PCB, we will, time permitting, have the funds necessary to make the appropriate changes and order another one.

30
Updated Schedule
Analysis of Schedule Because of delays caused by parts selection (namely the relays), the learning curve for using the CNC milling machine, and delays in receiving the necessary tooling parts to make the cuts, bevels, drills, etc. that must be made to produce the Faraday apparatus, the project is behind the intended schedule in most aspects of the construction. April’s work on the crankshaft, drive chain, connector rod and power supply mount, however, is well ahead of schedule, allowing her to assist Kun in whatever way necessary, particularly in the construction of the power supply case. This should be an issue that prevents us from completing the project, however. Many of the items listed on the Gantt chart written in December were assigned a longer duration than will be required to see them to completion, giving us time to catch up as soon spring break provided that work is steady. At this point, our greatest concern is completing the Faraday apparatus and testing it to see that it’s working properly. If not, priority on all members will shift to making the proper adjustments to the apparatus to produce an EMF capable of charging the lead acid battery.

31
Plan to Proceed
All major electrical components have been received, with the exception of the LEDs and the KG1010D relays, which have been ordered. The next steps on the electrical side of the project, as reflected in the updated schedule, are the design of the PCB board, the ordering of the PCB board, and the wiring and testing of the cutoff systems. As that’s occurring, testing will begin on the Faraday apparatus as Kun finishes manufacturing it. By spring break, the objective is to have all electrical components assembled, tested, and working as expected to allow charge from the Faraday apparatus and discharge to the inverter. Mechanically, April will continue assembly, attachment, and testing of the crankshaft and drive chain components, as well as testing the mechanical joining of the crankshaft and Faraday apparatus. April will also help Kun complete his assignments as needed. Kun will finish completion of the Faraday apparatus once the necessary tooling parts for the CNC mill have arrived and begin testing with Ben while also working with Ben on the power supply case.

32
Appendices