Embed Size (px)
Citation preview

REQUIREMENTS FOR MODERN GENOME BROWSERS
Asma Mistadi
A thesis
in
The Department
of
Computer Science and Software Engineering
Presented in Partial Fulfillment of the Requirements
For the Degree of Master of Applied Science in Software Engineering
Concordia University
Montreal, Quebec, Canada
June 2015
c© Asma Mistadi, 2015

Concordia UniversitySchool of Graduate Studies
This is to certify that the thesis prepared
By: Asma Mistadi
Entitled: Requirements for Modern Genome Browsers
and submitted in partial fulfillment of the requirements for the degree of
Master of Applied Science in Software Engineering
complies with the regulations of this University and meets the accepted standards with respect to
originality and quality.
Signed by the final examining commitee:
Chair
Dr. Nematollaah Shiri
Examiner
Dr. Constantinos Constantinides
Examiner
Dr. Joey Paquet
Supervisor
Dr. Gregory Butler
Approved byChair of Department or Graduate Program Director
20
Dean of Faculty

Abstract
Requirements for Modern Genome Browsers
Asma Mistadi
Genome browsers are widely used tools for the visualization of a genome and related data. The
demands placed on genome browsers due to the size, variety, and complexity of the data pro-
duced by modern biotechnology is increasing. These demands are poorly understood, and are not
documented. Our study is establishing and documenting a clear set of requirements for genome
browsers.
Our study reviewed all widely used genome browsers, as well as notable research prototypes of
genome browsers. This involved a review of the literature, executing typical uses of the genome
browsers, program comprehension, reverse engineering, and code analysis.
The key outcome of the study is a clear set of requirements in the form of a requirement document
which conforms to the IEEE Std 830-1998 Standard of a Software Requirement Specification. This
contains a domain model of concepts, the functional requirements as use cases, a definition of
visualizations as metaphors, glyphs, or icons, formal specification of the system in Z notation and
a specification of all widely used file formats.
Genome browsers share a set of basic features like display, scroll, zoom, and search. How-
ever, they differ in their performance, maturity level and the implementation technologies. Our
requirements also document the major non-functional requirements.
The outcome of our study can be used in several ways: it can be used as a guide for future
developers of Genome Browsers; it can form the basis of future enhancements of features in existing
genome browsers; and it can motivate the invention of new algorithms, data structures, or file
formats for implementations.
iii

Acknowledgments
First, I would like to thank my supervisor Dr. Gregory Butler for his time, patience and guidance
throughout my thesis. I am very grateful to him he has definitely made it a great academic
experience. I would also like to thank my lab mates Nada Alhirabi, Faizah Aplop, Christine Houry
Kehyayan, Stuart Thiel, Maria Akther, Patricia Hanney, Lin Cheng, Qing Ye, Munira AlBalla and
Stephanie Kamgnia for their academic and personal support. I wish them the best in their academic
and personal lives.
My profound gratitude goes to my family— my husband, Husam for his unconditional love and
support, my son, Yazan for making me smile even when I don’t want to, my mother, Howida for
her constant encouragement and support.
iv
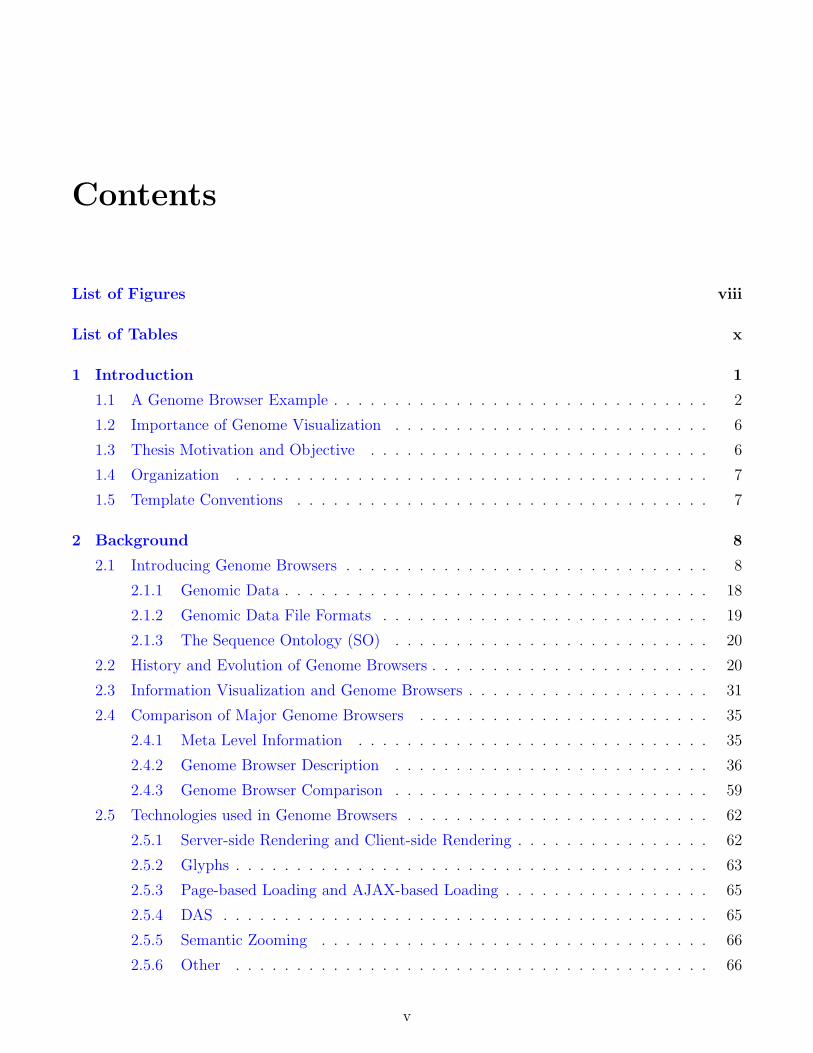
Contents
List of Figures viii
List of Tables x
1 Introduction 1
1.1 A Genome Browser Example . . . . . . . . . . . . . . . . . . . . . . . . . . . . . . . 2
1.2 Importance of Genome Visualization . . . . . . . . . . . . . . . . . . . . . . . . . . 6
1.3 Thesis Motivation and Objective . . . . . . . . . . . . . . . . . . . . . . . . . . . . 6
1.4 Organization . . . . . . . . . . . . . . . . . . . . . . . . . . . . . . . . . . . . . . . 7
1.5 Template Conventions . . . . . . . . . . . . . . . . . . . . . . . . . . . . . . . . . . 7
2 Background 8
2.1 Introducing Genome Browsers . . . . . . . . . . . . . . . . . . . . . . . . . . . . . . 8
2.1.1 Genomic Data . . . . . . . . . . . . . . . . . . . . . . . . . . . . . . . . . . . 18
2.1.2 Genomic Data File Formats . . . . . . . . . . . . . . . . . . . . . . . . . . . 19
2.1.3 The Sequence Ontology (SO) . . . . . . . . . . . . . . . . . . . . . . . . . . 20
2.2 History and Evolution of Genome Browsers . . . . . . . . . . . . . . . . . . . . . . . 20
2.3 Information Visualization and Genome Browsers . . . . . . . . . . . . . . . . . . . . 31
2.4 Comparison of Major Genome Browsers . . . . . . . . . . . . . . . . . . . . . . . . 35
2.4.1 Meta Level Information . . . . . . . . . . . . . . . . . . . . . . . . . . . . . 35
2.4.2 Genome Browser Description . . . . . . . . . . . . . . . . . . . . . . . . . . 36
2.4.3 Genome Browser Comparison . . . . . . . . . . . . . . . . . . . . . . . . . . 59
2.5 Technologies used in Genome Browsers . . . . . . . . . . . . . . . . . . . . . . . . . 62
2.5.1 Server-side Rendering and Client-side Rendering . . . . . . . . . . . . . . . . 62
2.5.2 Glyphs . . . . . . . . . . . . . . . . . . . . . . . . . . . . . . . . . . . . . . . 63
2.5.3 Page-based Loading and AJAX-based Loading . . . . . . . . . . . . . . . . . 65
2.5.4 DAS . . . . . . . . . . . . . . . . . . . . . . . . . . . . . . . . . . . . . . . . 65
2.5.5 Semantic Zooming . . . . . . . . . . . . . . . . . . . . . . . . . . . . . . . . 66
2.5.6 Other . . . . . . . . . . . . . . . . . . . . . . . . . . . . . . . . . . . . . . . 66
v

2.6 Genome Browser Challenges . . . . . . . . . . . . . . . . . . . . . . . . . . . . . . . 66
2.7 Discussion of Non-functional Requirements Issues . . . . . . . . . . . . . . . . . . . 72
2.8 Z Notation . . . . . . . . . . . . . . . . . . . . . . . . . . . . . . . . . . . . . . . . . 74
3 Requirements Document 77
3.1 Introduction . . . . . . . . . . . . . . . . . . . . . . . . . . . . . . . . . . . . . . . . 77
3.1.1 Purpose . . . . . . . . . . . . . . . . . . . . . . . . . . . . . . . . . . . . . . 78
3.1.2 Scope . . . . . . . . . . . . . . . . . . . . . . . . . . . . . . . . . . . . . . . 78
3.1.3 Definitions, Acronyms, and Abbreviations . . . . . . . . . . . . . . . . . . . 78
3.1.4 References . . . . . . . . . . . . . . . . . . . . . . . . . . . . . . . . . . . . . 78
3.1.5 Overview . . . . . . . . . . . . . . . . . . . . . . . . . . . . . . . . . . . . . 78
3.2 Overall Description . . . . . . . . . . . . . . . . . . . . . . . . . . . . . . . . . . . . 79
3.2.1 Product Perspective . . . . . . . . . . . . . . . . . . . . . . . . . . . . . . . 79
3.2.2 Product Functions . . . . . . . . . . . . . . . . . . . . . . . . . . . . . . . . 80
3.2.3 User Characteristics . . . . . . . . . . . . . . . . . . . . . . . . . . . . . . . 81
3.2.4 General Constraints . . . . . . . . . . . . . . . . . . . . . . . . . . . . . . . . 82
3.2.5 Assumptions and Dependencies . . . . . . . . . . . . . . . . . . . . . . . . . 82
3.3 Domain Model . . . . . . . . . . . . . . . . . . . . . . . . . . . . . . . . . . . . . . 83
3.4 Specific Requirements . . . . . . . . . . . . . . . . . . . . . . . . . . . . . . . . . . . 87
3.4.1 External Interface Requirements . . . . . . . . . . . . . . . . . . . . . . . . . 87
3.4.2 Functional Requirements . . . . . . . . . . . . . . . . . . . . . . . . . . . . . 88
3.4.3 Use Cases . . . . . . . . . . . . . . . . . . . . . . . . . . . . . . . . . . . . . 89
3.4.4 Non-Functional Requirements . . . . . . . . . . . . . . . . . . . . . . . . . . 97
3.4.5 Design Constraints . . . . . . . . . . . . . . . . . . . . . . . . . . . . . . . . 98
3.5 Formal Specification of a Genome Browser . . . . . . . . . . . . . . . . . . . . . . . 98
3.5.1 Overview . . . . . . . . . . . . . . . . . . . . . . . . . . . . . . . . . . . . . 98
3.5.2 Basic Types . . . . . . . . . . . . . . . . . . . . . . . . . . . . . . . . . . . . 99
3.5.3 Basic Components of a Genome Browser . . . . . . . . . . . . . . . . . . . . 100
3.5.4 Coordinate Systems . . . . . . . . . . . . . . . . . . . . . . . . . . . . . . . . 103
3.5.5 Genome Browser Configurations . . . . . . . . . . . . . . . . . . . . . . . . . 104
3.5.6 Basic Views of a Genome Browser . . . . . . . . . . . . . . . . . . . . . . . . 113
3.5.7 Genome Browser System . . . . . . . . . . . . . . . . . . . . . . . . . . . . . 118
4 Conclusion and Future Work 121
4.1 Description of Work and Contributions . . . . . . . . . . . . . . . . . . . . . . . . . 121
4.2 Limitations and Recommendations for Future Research . . . . . . . . . . . . . . . . 122
vi

Bibliography 123
A Flat File Format 133
A.1 FASTA File Format . . . . . . . . . . . . . . . . . . . . . . . . . . . . . . . . . . . . 133
A.2 GFF File Format . . . . . . . . . . . . . . . . . . . . . . . . . . . . . . . . . . . . . 136
A.3 GTF File Format . . . . . . . . . . . . . . . . . . . . . . . . . . . . . . . . . . . . . 142
A.4 BED File Format . . . . . . . . . . . . . . . . . . . . . . . . . . . . . . . . . . . . . 144
A.5 BedGraph File Format . . . . . . . . . . . . . . . . . . . . . . . . . . . . . . . . . . 145
A.6 WIG File Format . . . . . . . . . . . . . . . . . . . . . . . . . . . . . . . . . . . . . 147
A.7 The Chain File Format . . . . . . . . . . . . . . . . . . . . . . . . . . . . . . . . . . 151
A.8 The SAM File Format . . . . . . . . . . . . . . . . . . . . . . . . . . . . . . . . . . 153
A.9 VCF Version 4.2 File Format . . . . . . . . . . . . . . . . . . . . . . . . . . . . . . 163
B Binary File Format 173
B.1 Two Bit File Format (2bit) . . . . . . . . . . . . . . . . . . . . . . . . . . . . . . . . 173
B.2 The Tabix index File Format . . . . . . . . . . . . . . . . . . . . . . . . . . . . . . . 175
B.3 The BAM File Format . . . . . . . . . . . . . . . . . . . . . . . . . . . . . . . . . . 177
B.4 BigBed File Format . . . . . . . . . . . . . . . . . . . . . . . . . . . . . . . . . . . . 183
B.5 BigWig File Format . . . . . . . . . . . . . . . . . . . . . . . . . . . . . . . . . . . . 184
B.6 BCF File Format . . . . . . . . . . . . . . . . . . . . . . . . . . . . . . . . . . . . . 192
C Glyghs 201
D Glossary 207
vii

List of Figures
1 Chromosome Helix Structure . . . . . . . . . . . . . . . . . . . . . . . . . . . . . . . 1
2 Picture of C. elegans . . . . . . . . . . . . . . . . . . . . . . . . . . . . . . . . . . . 3
3 A Genome Browser Example . . . . . . . . . . . . . . . . . . . . . . . . . . . . . . . 4
4 An Example of an Input File in Genome Browser . . . . . . . . . . . . . . . . . . . 5
5 Genome Browser Sketch . . . . . . . . . . . . . . . . . . . . . . . . . . . . . . . . . 9
6 Example Track . . . . . . . . . . . . . . . . . . . . . . . . . . . . . . . . . . . . . . 10
7 Example of JBrowse Instance . . . . . . . . . . . . . . . . . . . . . . . . . . . . . . 10
8 Example of JBrowse Sources List . . . . . . . . . . . . . . . . . . . . . . . . . . . . 11
9 Example of JBrowse Sequence List . . . . . . . . . . . . . . . . . . . . . . . . . . . 11
10 Example of Custom Track Upload in JBrowse . . . . . . . . . . . . . . . . . . . . . 12
11 Example of Track Zoom . . . . . . . . . . . . . . . . . . . . . . . . . . . . . . . . . 13
12 Example of Feature Search in JBrowse . . . . . . . . . . . . . . . . . . . . . . . . . 14
13 Example of Track Configuration . . . . . . . . . . . . . . . . . . . . . . . . . . . . . 15
14 Example of Share Genome Browser View . . . . . . . . . . . . . . . . . . . . . . . . 16
15 Example of Region Highlight . . . . . . . . . . . . . . . . . . . . . . . . . . . . . . . 16
16 Example of Save Track Data . . . . . . . . . . . . . . . . . . . . . . . . . . . . . . . 17
17 Genome Browser Timeline . . . . . . . . . . . . . . . . . . . . . . . . . . . . . . . . 22
18 Screenshot of Genome Projector . . . . . . . . . . . . . . . . . . . . . . . . . . . . . 26
19 Traditional Model and AJAX Model for Web Applications . . . . . . . . . . . . . . 29
20 Example of Gene Track . . . . . . . . . . . . . . . . . . . . . . . . . . . . . . . . . . 33
21 Example of a Detail Page . . . . . . . . . . . . . . . . . . . . . . . . . . . . . . . . 33
22 Semantic Zooming Example . . . . . . . . . . . . . . . . . . . . . . . . . . . . . . . 34
23 Screenshot of GBrowse . . . . . . . . . . . . . . . . . . . . . . . . . . . . . . . . . . 37
24 Custom Track Page in GBrowse . . . . . . . . . . . . . . . . . . . . . . . . . . . . . 42
25 Track Sharing in GBrowse . . . . . . . . . . . . . . . . . . . . . . . . . . . . . . . . 43
26 Screenshot of JBrowse . . . . . . . . . . . . . . . . . . . . . . . . . . . . . . . . . . 45
27 Track Configuration in JBrowse . . . . . . . . . . . . . . . . . . . . . . . . . . . . . 48
28 Creating a Combination Track in JBrowse . . . . . . . . . . . . . . . . . . . . . . . 49
viii

29 Screenshot of Dalliance . . . . . . . . . . . . . . . . . . . . . . . . . . . . . . . . . . 52
30 Adding Tracks in Dalliance . . . . . . . . . . . . . . . . . . . . . . . . . . . . . . . . 54
31 Screenshot of Savant . . . . . . . . . . . . . . . . . . . . . . . . . . . . . . . . . . . 55
32 SVG example . . . . . . . . . . . . . . . . . . . . . . . . . . . . . . . . . . . . . . . 64
33 Canvas example . . . . . . . . . . . . . . . . . . . . . . . . . . . . . . . . . . . . . . 64
34 Sequencing Costs per Genome . . . . . . . . . . . . . . . . . . . . . . . . . . . . . . 67
35 Data Explosion . . . . . . . . . . . . . . . . . . . . . . . . . . . . . . . . . . . . . . 68
36 Gene Model Representation . . . . . . . . . . . . . . . . . . . . . . . . . . . . . . . 69
37 Block Diagram of a Genome Browser . . . . . . . . . . . . . . . . . . . . . . . . . . 80
38 Domain Model, Version1 models the basic concepts of a genome browser . . . . . . 84
39 Domain Model, Version2 is the same as Version 1, adding identified types of some of
the main concepts . . . . . . . . . . . . . . . . . . . . . . . . . . . . . . . . . . . . . 86
40 Use Case Model . . . . . . . . . . . . . . . . . . . . . . . . . . . . . . . . . . . . . . 90
41 Diagram of Spacial Concepts in Z Model . . . . . . . . . . . . . . . . . . . . . . . . 101
42 2bit binary file layout . . . . . . . . . . . . . . . . . . . . . . . . . . . . . . . . . . . 175
ix

List of Tables
1 GFF3 File Specification . . . . . . . . . . . . . . . . . . . . . . . . . . . . . . . . . 5
2 A List of Genome Browsers . . . . . . . . . . . . . . . . . . . . . . . . . . . . . . . 23
3 Genome Browser Comparison . . . . . . . . . . . . . . . . . . . . . . . . . . . . . . 61
4 Canvas and SVG Comparison . . . . . . . . . . . . . . . . . . . . . . . . . . . . . . 65
5 Genome Browser Stakeholders . . . . . . . . . . . . . . . . . . . . . . . . . . . . . . 81
6 Actor-Goal Table . . . . . . . . . . . . . . . . . . . . . . . . . . . . . . . . . . . . . 89
11 BED format fields . . . . . . . . . . . . . . . . . . . . . . . . . . . . . . . . . . . . . 145
31 Glygh Library of Point/Interval Features . . . . . . . . . . . . . . . . . . . . . . . . 201
32 Glyphs for Continuous Data . . . . . . . . . . . . . . . . . . . . . . . . . . . . . . . 206
x

Chapter 1
Introduction
The genome of an organism is the complete collection of deoxyribonucleic acid (DNA) in that
organism. It contains all of the information needed to build and maintain that organism. It has
four different molecules called nucleotides Adenine (A), Thymine (T), Cytosine (C), and Guanine
(G), which are the units of DNA. Because of their structure, A can only bind with T, and C can
only bind with G. Inside the nucleus of each cell, the DNA molecule consists of two strands that
wind around each other like a twisted ladder and packaged into compact units called chromosomes
as shown in Figure 1.
Figure 1: Chromosome Helix Structure, source:www. nia. nih. gov
In other words, a genome is a set of DNA sequences, each sequence is a string of four let-
ters/nucleotides [ A , G , C , T ], known as base pairs, or bp, which are the units of measuring a
1

genome’s size [NIH, 2014].
In 1995, the first complete genome of a free-living organism, the bacterium Haemophilus influenzae,
was sequenced. After that, during the past decade or so, new technologies helped sequence the
genomes of thousands of organisms. Genomes can be very long from mega-bases to hundreds of
giga-bases, e.g. the human genome is around 3 billion base pairs. High-throughput sequencing
(HTS) technology or Next-Generation Sequencing (NGS) technology has enabled rapid sequencing
of large stretches of DNA base pairs, which made genome sequencing quicker and more affordable
than ever, with the latest instruments producing hundreds of giga-bases of data in a single run
[NGS, 2014].
More importantly, inside these DNA sequences are regions that play important roles in various
functions of the cell such as cell metabolism, defence, reproduction and signalling. The result of
finding and interpreting functionally significant regions of the genome is called ‘annotation’ and is
now the major focus of the genome project. The annotation of a genome typically generates far
more data than the raw DNA sequence itself, e.g. the whole human genome sequence occupies just
three gigabytes uncompressed, but its current annotation uses many terabytes. There are numerous
types of data collected about genomes such as genes, proteins, transcription data, variation data,
and regulation data.
These massive amounts of sequence data need to be stored, analyzed, and manipulated in so
many ways in order to understand what happens inside the cells of organisms and that’s where
bioinformatics, which is defined as the application of computer science and software engineering
to the problems of biological data management, comes into play. Besides their enormous size,
sequence data are also very complex and although the analysis process can be automated, there is
still a significant need for human interpretation.
Genome browsers are well known bioinformatics tools, that are used for the visualization of the
genome sequence and it annotations. Since looking at the textual representation of genomic data
is not very helpful, visualization techniques and tools significantly aid the study and interpretation
of these complex datasets [Oram and Wilson, 2007, Pevsner, 2009].
1.1 A Genome Browser Example
A Genome browser can be defined as a visualization tool used to display genome data and their
annotations using a graphical user interface. It can help visualize and integrate different genomic
data by displaying a representation of genome information and other data as a function of posi-
tion across the genome sequence. It is an essential tool for organizing and investigating multiple
information about genomes [Pevsner, 2009, Soh et al., 2012].
The Caenorhabditis elegans (C. elegans) is a free-living, transparent nematode (roundworm,
2

earthworm). It is small, growing to about 1 mm in length, and lives in the soil. It survives by
feeding on microbes such as bacteria [Mark Edgley and the Riddle lab, 2014]. A picture of the
C.elegans is shown in Figure 2. The sequence of the 100-Mb genome of C. elegans was published
in 1998, and it has 6 chromosomes (named I, II, III, IV, V and X) [Hillier et al., 2005].
Figure 2: Picture of C. elegans, source: www. news. wisc. edu
In Figure 3, an example of an annotated region of the C. elegans sequence is visually presented
inside a genome browser, specifically GBrowse, which is a mature and capable genome browser that
is distinguished by its use of ‘glyphs’, which are graphical representations of annotations/features of
the genome. This example explains in a brief manner the general layout and functions of a genome
browser.
A genome browser, just like any other software, takes inputs and presents outputs. The inputs
in any genome browser are the sequence and annotation data that are usually stored in specially
formatted files. Today, there are many file format standards used to save different types of genomic
data, such as FASTA format (a standard for saving genome sequences) and GFF3 format (a standard
for storing gene data).
The outputs are a graphical user interface representing each type of data inside a display unit
called ‘tracks’. Tracks are horizontally aligned on top of each other under a unified coordinate
system (the sequence coordinate). Inside each track are a set of features/annotations displayed using
special graphical representations called ‘glyphs’, which are organized according to their positions
on the sequence. In this example, the name of the sequence under investigation is ‘C01F4’, which
is the name/ID of a contig of the C. elegans sequence (a contig being a consensus region of DNA).
The entire contig sequence is displayed in this view from 1..40,000 bp. Data is displayed at three
different levels: overview, region, and details. There are three tracks named ‘ESTs’ (used to display
alignments between C. elegans expressed sequence tags ESTs in GenBank and the genome), ‘Protein-
coding genes’ (used to display the protein-coding genes data), and ‘DNA/GC Content’ (the sequence
track used to display the GC content of the DNA sequence at low resolutions and the individual
DNA base pair at high resolution). The reference ruler is helpful in identifying the location of
genomic features across the sequence. The different data types are inspected in a vertical manner
3

Figure 3: A Genome Browser Example, source: local GBrowse installation
according to their location on the sequence.
To navigate this genome, we could zoom in/out, pan left/right, search for specific features or
an exact location on the genome. The tracks are the essence of a genome browser, which can be
customized by the user. Tracks can be reordered, hidden/shown, added/closed. The graphical
representations of annotations in each track can be customized by changing several attributes of
their appearance such as their color, size and shape. In this example of genome browser, there
is a list of sources to choose from, which is used to change the genome and the datasets under
investigation. As mentioned above, the genome browser inputs are normally specially formatted
files that are used as a standard in the genomic community to save and transmit genomic data.
In Figure 4, an example input file format is shown and contains the underlying data of the
‘Protein-coding genes’ track. The file is in GFF3 format, which is a tab-delimited file format that
has nine columns. A summary of the information stored in each of these columns is in Table 1. The
data in this file is easily parsed for information and the graphical representations are presented to
the user.
4

Figure 4: An Example of an Input File in Genome Browser
Column Description
Seqid This is the id of the landmark, which establishes the coordinate system for the annotation
or current feature. This is usually the name of a chromosome, clone, or contig.
Source The column lists the source of the annotation or describes how the feature was derived.
Type This column describes the feature type.
Start This column lists the position that the feature starts at, relative to the reference sequence.
The first base of the reference sequence is position 1.
End This column lists the end of the feature, again relative to the reference sequence. The end
is always greater than or equal to start.
Score For features that have a numeric score, such as sequence similarities, this field holds the
score.
Strand For features that are strand-specific, this field is the strand on which the annotation
resides. It is ‘+’ for forward strand, ‘−’ for reverse strand, or ‘.’ for annotations that are
not stranded.
Phase For CDS features that encode proteins, this field describes the part of the codon on which
the first base falls. The field is a number from 0 to 2, where 0 means that the first base
of the feature corresponds to the start of the codon, 1 means that the second base of the
feature corresponds to the start of the codon, and 2 means that the third base of the
feature corresponds to the start of the codon.
Attributes A list of feature attributes in the format tag=value. Multiple tag=value pairs are separated
by semicolons. 1
Table 1: GFF3 File Specification
1The full GFF3 specification can be found at http://www.sequenceontology.org/gff3.shtml.
5

1.2 Importance of Genome Visualization
Genome browsers address the problem of how to visualize the genome and its various annotations.
Visualization of genomic data can aid the analysis of this information in a more natural and inter-
pretable way compared to their textual representation [Fiume et al., 2010]. According to [Fiume
et al., 2010]:
“ Visualization can facilitate a number of tasks including:
i The integration of multiple related data into a single view, to gain insight into the interaction
between genomic features.
ii Algorithm development, where visualization of many putative calls (e.g. genomic variants,
promoter sites, intron/exon boundaries, etc.) helps with debugging and identification of true
and false positives.
iii Exploration of various genomic regions for specific signatures of functional sites that may be
difficult to describe within a computer program. ”
Accordingly, genome browsers are very powerful research tools that can help investigate sequence
data and test any hypothesis generated by multiple sources of evidence. They also provide a
collaborative framework for researchers to share, retrieve, and view their own annotations in the
context of the genome. There are many existing genome browsers, that are different in their
implementations and focus. Many of these tools are not properly documented or supported and
they lack the proper application of correct and rigorous software engineering practices [Okonechnikov
et al., 2012]. Today, genome browsers face numerous challenges and demands that should be
accounted for. Therefore, there is a constant need to document these demands and build some clear
set of requirements for this valuable bioinformatics tool.
1.3 Thesis Motivation and Objective
The motivation of our work is based on the importance of genome browsers in the bioinformatics
field. A genome browser today is considered an indispensable visualization tool, as it facilitates the
investigation of complex and huge genomic datasets. The term genome browser is largely used but
there is no clear set of requirements to specify what a genome browser really is.
The main objective of this thesis is to have a usable requirements document for the development
of a software system that embodies the key elements of what the community considers a “genome
browser” so that it is responsive to the demands of today’s datasets, and the possible introduction
of new data formats and associated visualizations. Genome browsers have been around for some
time now, therefore we work under the assumption that the existing genome browsers provide a
6

complete set of adequate features. In our choice of requirements, we focus on the basic functionality
and specifications that any genome browser should have. We discuss the major challenges facing
this type of tool and the available technologies used in implementing genome browsers.
The process involves investigating a number of genome browsers, reviewing literature, program
comprehension, reverse engineering, and code analysis. The key outcome of the study is a clear
set of requirements in the form of a requirements document which conforms to the IEEE Std 830-
1998 Standard for Software Requirements Specification. This includes a domain model of concepts,
the functional requirements as use cases, a definition of visualizations as metaphors, glyphs, or
icons, and a specification of widely used file formats. We also wrote a formal specification model of
genome browsers in Z notation. During the process of conducting this thesis we faced a number of
challenges. The main challenge being that most of the tools are under active development and the
number of mature genome browsers is small.
1.4 Organization
This thesis document is organized as follows:
Chapter 2, introduces the background needed to understand the content of this document.
Chapter 3, establishes the Requirement document that includes use cases as functional require-
ments, a Domain Model and a Z specification of genome browsers.
Chapter 4, concludes this document by summarizing our contributions, pointing out its limita-
tions and making suggestions for future work.
Appendices, documents a table of visualization metaphors, a specification of several file formats
and a Glossary of definitions.
1.5 Template Conventions
The following templates/guidelines were used for this thesis:
• IEEE Std 830-1998 Standard of a Software Requirements Specification: [IEEE, 1998], used
for writing the whole Requirement Document.
• Fully Dressed Use Cases template: [Cockburn, A., 2001], used for documenting the use cases.
• Z notation: [Spivey, 1992], used to write formal requirements of a genome browser.
7

Chapter 2
Background
This Chapter introduces the background knowledge needed to understand Genome Browsers. It
covers the definition of a genome browser, the history and evolution of genome browsers, informa-
tion visualization and their relation to genome browsers. Then a documented description and a
comparison of four selected genome browsers are presented. Those genome browsers are GBrowse,
JBrowse, Dalliance and Savant. The first three of the investigated genome browsers are web-based
and the fourth is a stand-alone application. Our main focus is on web-based genome browsers since
they serve a much larger user community. The investigation of those four genome browsers is done
in order to come up with a solid set of requirements for modern genome browsers. After that,
we present a discussion of the technologies used in web-based genome browsers, issues related to
genome browsers, non-functional requirements issues and a simple background of Z notation.
2.1 Introducing Genome Browsers
Genome Browsers are a class of a well known visualization tools in the bioinformatics field. They
provide a unified platform to browse, search, retrieve, analyze and access large amounts of sequence
data. Through a graphical interface, they present a comprehensible, high level, visual representation
of huge textual genomic data. They show both global and detailed view of the genome sequence
and its annotations. They help users analyze, summarize, extract information from various datasets
in the context of genomic DNA sequences [McKay and Cain, 2009, Wang et al., 2013a].
Generally, genome browsers can present any type of information that can be mapped to DNA
sequence coordinates. This information is presented inside ‘tracks’, piled up rows of various data
types, which are basically horizontal graphical units. Figure 5 5 shows a simple sketch that illus-
trates the basic concept of tracks in a genome browser, with each track used to represent a type
of data (a collection of data) on the genomic sequence. Inside those tracks the data is presented
8

using graphical clues or metaphors, known as ‘glyphs’, positioned according to their sequence coor-
dinate. An example track with glyphs is shown in Figure 6, which presents a region of the ‘Curated
Genes’ track of the C.elegans chromosome with the sequence coordinate III:7,500,002..7,550,001
(ch: start..end). Organizing the different data types vertically inside horizontal tracks facilitates
the comparison of diverse data types and also works as a gateway to more detailed information
[Kuhn et al., 2012].
To demonstrate genome browsers capabilities and major functions, we will look into JBrowse
genome browser, which is one of the GMOD (Generic Model Organism Database) tools. JBrowse is
a next-generation web-based genome browser for visualizing genomic data that benefit from modern
web technologies to provide a more interactive user experience than its predecessor GBrowse. In
JBrowse, most of the work involved in visualizing the data is done on the client web-browser: A
JBrowse instance is created by adding genomic data of an organism (sequence and annotations) to
the JBrowse software which is placed on a server, and the end users are allowed to visit the site
from their web browser [Skinner and Holmes, 2010].
Figure 5: Genome Browser Sketch, illustrating the tracks concept.
9

Figure 6: Example Track, Source: the WormBase website http: // www. wormbase. org/ tools/
genome/ gbrowse/ c_ elegans_ PRJNA13758/
Figure 7: Example of JBrowse Instance, showing the primary test data set used in the development (the
Volvox example): (A) A list of available tracks, (B) A menu for selecting another source/organism—displaying
the name of the current source, (C) Panning controls left/right, (D) Zooming controls, (E) A menu for selecting
the current sequence, and a text box (which can be used for searching) showing the exact coordinate of the
visible region, (F) The highlight button, (G) The share button, (H) The track name, (I) A track. Source:
JBrowse demonstration at http: // jbrowse. org
A detailed description of this tool is later mentioned in Section 2.4.2.2. There are many tasks
the users can perform in a genome browser:
• Users can change the current source by selecting a different source from a list. Figure 8, shows
10

an example of sources list found in this JBrowse demonstration.
Figure 8: Example of JBrowse Sources List, showing a list of existing sources. Source: JBrowse demon-
stration at http: // jbrowse. org
• Users can select the sequence they want to investigate, as shown in Figure 9, and tracks of
interest from the list of available tracks, as shown in Figure 7-(A).
Figure 9: Example of JBrowse Sequence List, showing a list of sequences (contigs, chromosomes) belonging
to an organism’s genome. Source: JBrowse demonstration at http: // jbrowse. org
• Users can rearrange the order of tracks, hide/show tracks, or click on tracks for additional
information.
• Users can also upload their own custom tracks, as shown in Figure 10.
• Genome browsers are designed to allow users to view data at any scale in an interactive way
(zooming in/out) using the zooming controls, as in Figure 7-(D)). Users can zoom from single
base pair resolution to a whole chromosome, and the genome browser will try to fit as much
information into the browser view as the scale permits [Kuhn et al., 2012]. Figure 11 shows a
region of a ‘Reference Sequence’ track zoomed in at different scales. This track displays the
individual base pairs at high zoom levels.
11

(a) Open File Option
(b) Open Files Dialog
Figure 10: Example of Custom Track Upload in JBrowse: (a) shows the list containing the open files
option to add custom tracks to JBrowse, (b) shows the dialog presented to the user to upload a custom track
and the various options of upload depending on the location of the file. Source: JBrowse demonstration at
http: // jbrowse. org
12

(a) Low Zoom Level
(b) High Zoom Level
(c) Higher Zoom Level
Figure 11: Example of Sequence Track, zoomed at different zoom levels in JBrowse. Source: JBrowse
demonstration at http: // jbrowse. org
• Users can browse the genome in several ways in genome browsers. They can pan left/right
using panning controls as in Figure 7-(C), or go to specific features or positions using the
searching capability of the genome browser (as shown in Figure 7-(E) and Figure 12, when
the user types any letter, an auto-complete generated list of available features is shown to the
user to navigate to the wanted feature).
13

(a) Entering Search Term
(b) Search Result
Figure 12: Example of Feature Search in JBrowse, (a) showing a generated list of available features matching
the entered name in the search box, and (b) showing the result of the navigation to the feature (f01) location.
Source: JBrowse demonstration at http: // jbrowse. org
14

• Tracks can be configured and customized in different ways, like changing their height or glyph
or pinning them to the top of the display. Figure 13-(a), shows a list of different actions that
the user can do to ‘Reference Sequence’ track and Figure 13-(b), shows a configuration dialog
that the user can use to change the track configurations.
(a) List of Possible Track Manipulation Options
(b) Edit Track Configuration Dialog
Figure 13: Example of Track Configuration, (a) shows a list of track options like Pin to top, Edit config,
Delete track, Save track data and more or less depending on the track type, (b) ‘Reference Sequence’ track
Edit track configuration dialog in JBrowse. Source: JBrowse demonstration at http: // jbrowse. org
• Users can also share their genome view with other research group members by using the
sharing capability of the genome browser. As in JBrowse, this is done by clicking the share
button shown in Figure 7-(G) and this will present a generated link that can be copied to be
sent to other users (see Figure 14).
15

Figure 14: Share Genome Browser View, where a generated link is shown to share the current view in
JBrowse. Source: JBrowse demonstration at http: // jbrowse. org
• Another useful feature is the highlight feature, where the user can select a region to highlight.
In JBrowse, this is done by pressing the highlight button shown in Figure 7-(F) and selecting
a region with the mouse. An example of highlighted region from (15000 bp to 17500 bp) is
shown in Figure 15.
Figure 15: Example of Region Highlight, with a highlighted region (from 15000 to 17500)bp in JBrowse.
Source: JBrowse demonstration at http: // jbrowse. org
• The underlying track data can be downloaded in several file formats for further analysis, as
shown in Figure 16.
16

(a) Save Track Data Option
(b) Save Track Data Dialog
(c) Track Data View
Figure 16: Example of Save Track Data in JBrowse, (a) the option list containing the ‘save track data’
option, (b) the dialog presented to the user to save track’s data, presenting options about the region to save,
the type of file, and the name of the file, (c) a view of the tracks data in GFF3 format. Source: JBrowse
demonstration at http: // jbrowse. org
As the amount of sequenced organisms increase so are the number of available genome browsers.
17

Genome browsers can be classified based on different characteristics including their platform plat-
form (web based or standalone), type of genome (linear or circular), or the number of genomes
displayed (single organism or multiple organisms). There are a large number of genome browsers
out there, including the three most popular ones: the University of California Santa Cruz (UCSC)
Genome Browser (http://genome.ucsc.edu/), Ensembl (http://www.ensembl.org/), and Na-
tional Center for Biotechnology Information (NCBI) Map Viewer (http://www.ncbi.nlm.nih.
gov/mapview/). Their popularity comes from the amount of information they serve since they are
used as repositories for genome projects [Cline et al., 2009].
2.1.1 Genomic Data
Genomes are a huge source of information that is used to shape who we are. They contain all the
information needed to develop and maintain organisms. Genomic data includes the genome sequence
produced by sequencing machines and their manually or automatically generated annotations. This
data can be very noisy and with varying degree of accuracy and as our genomic knowledge expands
so are the types of data and information discovered. Normally, genome related data are produced
by diverse genome research groups and projects. Consequently, they vary in their type, size and
accuracy. Data aggregation and visualization are used in genome browsers to help reduce the
uncertainty of multiple data sources and drive more accurate information [Cline et al., 2009].
Recent technologies has made sequencing of thousands of organisms faster and cheaper than ever.
These advancements resulted in massive amount of DNA sequences and associated annotations.
Consequently, genomic data is very large and continues to grow over time. For instance, the
Arabidopsis thaliana (thane cress, a weed and a model plant species), has a total of 119,146,348 bp as
indicated by the PlantGDB (http://www.plantgdb.org/AtGDB/) and according to the Arabidopsis
Information Resource (TAIR) (http://arabidopsis.org/), the latest version of the Arabidopsis
genome annotation (TAIR10) has around 33,602 total annotations.
2.1.1.1 Genomic Sequence
The genome of any organism is the complete set of DNA within the nucleus of that organism. The
DNA molecule is double stranded and packaged into chromosomes. The genome can be seen as a an
information resource. As mentioned earlier in the context of a genome browser, the sequence can be
chromosomes, plasmids, contigs, scaffolds or any other sequence of interest. “The sequence provides
a reference coordinate system and a natural platform on which to assemble scientific annotations
and genome-mapped data sets from diverse sources” [Nielsen et al., 2010]. Interestingly enough,
there is no correlation between the apparent physical size or complexity of an organism and their
genome size. For example, the human genome contains about 3 billion DNA bases, while a single
wheat genome contains about 17 billion DNA bases.
18

The genome sequence can be seen as a huge text of a four letter alphabet (four bases A, C,
G, T) and in order to understand this text (the genetic code), we need to extract its underlying
information. This process of taking raw genome sequences and attaching biological information
to them is called ‘Genome Annotation’. In fact the genome sequence is only as valuable as its
annotation [Stein, 2001].
2.1.1.2 Genomic Annotation/Features
In general, annotations are some kind of explanatory data or comments attached to a specific
part of the original data. According to [Yandell and Ence, 2012], “genome annotation is a term
used to describe two distinct processes. I- ‘Structural’ genome annotation, which is the process of
identifying genes and their intron-exon structures. II- ‘Functional’ genome annotation, which is the
process of attaching meta-data such as gene ontology terms to structural annotations.” A genomic
feature/annotation can be seen as a tuple containing coordinates on the genome (sequence, strand,
start, and end) augmented by additional data specific to a particular type of feature. Examples of
features includes genes, microarray probe values, peptide measurements, or protein-DNA binding
sites, single-nucleotide polymorphisms (SNPs) and repeats that have positions on the DNA sequence
[Bare et al., 2010].
The genome is a huge information source that encodes our genetic code. It basically has all
the information needed to determine who we are, how we look like, think and grow. Therefore,
annotating the huge sequence of bases is extremely important and a difficult part of genome analysis.
Genomic annotation can also be defined more generally as the process of identifying important
information about a genome. It is how we attach what we know about a genome and this is done
by applying a standardized scientific nomenclature [Kaps et al., 1997]. An annotation example
is a gene that ranges from position 10 to 50 bp. In the case of genomes, annotation is done
by using a structured controlled vocabulary for the parts of a genomic annotation known as the
Sequence Ontology (SO). Huge efforts are made by sequencing centers, model organism databases
and academic/institutional laboratories around the world to annotate the genomes of different model
organisms [Madupu et al., 2010]. Evidently, the quality of the genomic data is mainly determined
by the completeness and correctness of both sequence and annotation [Kaps et al., 1997].
2.1.2 Genomic Data File Formats
Genomic datasets can be taken from various online repositories such as GenBank, EMBL-EBI
Nuclutide sequence database, and it can also be taken from existing genome projects databases like
Ensembl and UCSC, which both have genome browsers interfaces. The data in those repositories
can be saved in archival or relational databases or any other type of databases. The simplest form
of databases are flat-files, which are widely used in the bioinformatics field because they are easy
19

to distribute, easy to handle by computers and comprehensible by humans. Through time, there
has been several introduced flat files (text or binary format) that are used to store genomic data
such as FASTA (for storing genomic sequences), GFF (for storing gene related data), SAM/BAM
(for storing alignment data), Wiggle (for storing quantitative data), VCF(for storing variant data)
and many more [Letovsky, 1999]. The size of data files can range from several megabytes of
processed genomic data (e.g. GFF or VCF) to more than 50 GB of intermediate genomic data (e.g.
exome BAM files, with sizes more than 200 GB in low coverage genomes) [Medina et al., 2013]. A
comprehensive specification for those types of formats is presented in Appendix A and Appendix B.
2.1.3 The Sequence Ontology (SO)
Genomic data is being massively produced by various different research groups and projects around
the world (such as GenBank, UniProt), and because each group hosts their own databases and
uses their own data models to describe their annotations. This will eventually present a real data
inconsistency problem when attempting to compare the annotations of different sources. Besides,
biological terms are very ambiguous in nature (e.g. the same word is often used to describe more
than one thing, as in the case of a stop codon being part of CDS or the 3’-untranslated region (3’
UTR)). These problems motivate the need of a controlled vocabulary for genomic annotations that
will facilitate data management, exchange and analysis.
As a result, the sequence ontology project began with a group of scientists and developers from
the model organism databases (FlyBase, WormBase, Ensembl, SGD and MG) that got together to
collect and unify the terms they used in their sequence annotation. The result was a well controlled
vocabulary of terms or concepts with a restricted set of relationships between those terms. The
scope of the sequence ontology project is the description of the features and properties of biological
sequence [Eilbeck et al., 2005]. As described by [Eilbeck et al., 2005] ], “the Sequence Ontology
(SO) is a well known, open source, structured and controlled vocabulary for the various parts of a
genomic annotation.” Genome browsers use the sequence ontology to control the naming of different
annotations and to correctly specify their relationships, which helps in their visualization.
2.2 History and Evolution of Genome Browsers
Before genome browsers existed, genomes of today were made available to science because of the
huge discovery made in 1977 by two scientists, Walter Gilbert and Frederick Sanger, who invented
the first DNA sequencing technology. They were awarded the Nobel Prize three years later. It
was certain that their discovery would have enormous implication for science. This sequencing
technology known as the ‘Sanger method’ was very expensive (e.g. the human genome costs 3
billion dollars and around 13 years to sequence with this technology). Still, this did not stop
20

biologists from making advancements in this new and exciting field [Hutchison, 2007].
The first genome to be sequenced was that of the bacterium Haemophilus influenzae in 1995.
After that several genome sequencing projects were established to sequence many other organisms.
As a result several genomes have been sequenced including Baker’s yeast (Saccharomyces cevevisiae),
Nematode worm (Caenorhabditis elegans), Thale cress or Arabidopsis (Arabidopsis thaliana) and
many others.
In 1990, the Human Genome Project, which was one of the largest international collaboration
ever undertaken in biology, was initiated with thousands of scientists involved. The initial goal was
to sequence the human genome and deliver it to the public by 2005. In 2000, the completion of
the first draft of the human genome was announced. Two years ahead of schedule, in 2003, the
human genome has been sequenced, as mentioned in the timeline of the Human Genome Project
(http://www.yourgenome.org/facts/timeline-the-human-genome-project).
Today, with the rapid growth of genome sequencing projects, the ‘Genome Browser’ has become
a standard and an indispensable tool for exploring genomes and their data [Nielsen et al., 2010],
since it plays an essential role in genomics by providing comprehensible visualizations that elicit the
understanding and the analysis of genome sequences and their annotated features (e.g., chromosomal
position, genes, protein/nucleotide sequences, structures of exon/intron, and promoters) [Jung et al.,
2008]. It even provides a common platform for researchers to share, store, and publish scientific
discoveries [Nielsen et al., 2010, Kong et al., 2012]. A genome browser is also used as a gateway to
more detailed information. It allows viewing data at any scale, from single base pair resolution to
a whole chromosome, and shows as much information into the Browser view as the scale permits.
Basically any data that can be mapped to genomic coordinates can be presented in the genome
browser [Kuhn et al., 2012].
Nowadays, there are almost as many genome browsers as there are genome projects. A simple
and comprehensible timeline is shown in Figure 17, which illustrates the chronology of introducing
several reviewed genome browsers and some milestones affecting their developments.
21

Figure 17: Genome Browser Timeline, displaying the chronology of available genome browsers.
22

Table 2: A List of Genome Browsers
Name Date Description URL Reference
Web-Based Genome Browsers
ABrowse 2010 A customizable genome browser framework with
google-map like navigation, rich functions and flexi-
ble configuration to facilitate various genome research
projects.
http://www.abrowse.org [Kong et al., 2012]
Annmap/
X:Map
2007 A free genome browser that shows Affymetrix Exon
Microarray hit locations alongside the gene, transcript
and exon data on a Google Maps API.
http://annmap.picr.man.
ac.uk/
[Yates et al., 2008]
Anno-J v1.0 2008 A Web 2.0 application designed for visualizing deep se-
quencing data and other genome annotation data. It is
intended to run in modern W3C compliant browsers,
and allows flexible configuration of plugins and data
streams from providers located anywhere on the inter-
net.
http://www.annoj.org [Lister et al., 2008]
BioViews 1998 An intuitive, platform-independent, Java-based
Genome browser prototype developed for the BDGP
and runs as an applet in any Java-enabled web
browser.
N/A∗ [Helt et al., 1998]
ChromoZoom 2012 A flexible, fluid, next-generation web-based genome
browser. It uses a local installation of the UCSC
Genome Browser to generate and pre-cache tiled PNG
images.
http://chromozoom.org/ [Pak and Roth, 2013]
Dalliance 2010 A fast, interactive, next-generation genome visualiza-
tion tool and DAS client, that is easy to embed in web
pages and applications.
http://www.
biodalliance.org
[Down et al., 2011]
Ensembl 2000 A online genome browser developed collaboratively
by the European Bioinformatics Institute and Sanger
Center for the human genome project to be used as a
single point access to annotated genomes.
http://www.ensembl.org/ [Birney et al., 2004]
Gaggle
Genome
Browser
(GGB)
2010 The Gaggle Genome Browser is a cross-platform desk-
top program for interactively visualizing high through-
put data in the context of the genome.
http://gaggle.
systemsbiology.
net/docs/geese/
genomebrowser/
[Bare et al., 2010]
GBrowse 2001 An open-source browser developed as part of the
Generic Model Organism Database project.
http://gmod.org/wiki/
Gbrowse
[Stein et al., 2002]
Genome Maps 2012 A next-generation web-based genome browser. It uses
highly efficient technologies from the new HTML5
standard, such as scalable vector graphics, that op-
timize workloads at both server and client sides and
ensure future scalability.
http://www.genomemaps.
org
[Medina et al., 2013]
Genome Pro-
jector
2009 A web-based gateway for genomics information with
a zoomable user interface using Google Maps API
equipped with four seamlessly accessible and search-
able views: a circular genome map, a traditional
genome map, a biochemical pathways map, and a
DNA walk map.
http://www.g-language.
org/g3/
[Arakawa et al., 2009]
Genoverse
interac-
tive genome
browser
2013 Genoverse is a portable, customizable, back-end in-
dependent JavaScript and HTML5 based genome
browser which allows the user to explore data in a
dynamic and interactive manner.
http://www.genoverse.
org
Not published yet
23

JBrowse 2008 A Javascript-based genome browser that provides a
fast, highly interactive interface for visualizing ge-
nomic data.
http://jbrowse.org/ [Skinner et al., 2009,
Westesson et al., 2012]
myKaryoView 2010 A web tool for visualization of genomic data specif-
ically designed for direct-to-consumer genomic data
that uses publicly available data distributed through-
out the Internet. It does not require data to be held
locally and it is capable of rendering any feature as
long as it conforms to DAS specifications.
http://mykaryoview.com [Jimenez et al., 2011]
NCBI Map
Viewer
2000 Vertically oriented viewer, integrated with NCBI re-
sources and tools.
http://www.ncbi.nlm.
nih.gov/mapview/
[Dombrowski and Ma-
glott, 2002]
OmicBrowse 2006 A genome browser designed as a scalable system for
maintaining numerous genome annotation datasets. It
is a Flash-based high-performance graphics interface
for genomic resources.
http://gremlinViz.org [Toyoda et al., 2007,
Matsushima et al.,
2009]
STAR 2013 An integrated web application that enables online
management, visualization and track-based analysis of
next-generation Sequence data.
http://wanglab.ucsd.
edu/star/browser
[Wang et al., 2013b]
SViewer N/A∗ NCBI’s new Sequence Viewer is the graphical display
for the Nucleotide and Protein databases.
http://www.ncbi.nlm.
nih.gov/projects/
sviewer/
Not published yet
TGAC Browser 2013 A new open-source Genomic Browser developed to
visualise genome annotation from Ensembl Database
Schema.
http://tgac-browser.
tgac.ac.uk
Not published yet
Trackster 2012 A visual analysis environment for next-generation se-
quencing data that tightly couples interactive visual-
ization with data analysis.
http://galaxyproject.
org
[Goecks et al., 2012]
UCSC 2000 An on-line genome browser hosted by the University
of California, Santa Cruz (UCSC). It is an interactive
website offering access to genome sequence data from a
variety of vertebrate and invertebrate species and ma-
jor model organisms, integrated with a large collection
of aligned annotations.
http://genome.ucsc.edu/
cgi-bin/hgGateway
[Kent et al., 2002,
Kuhn et al., 2012,
Rosenbloom et al.,
2015]
VEGA 2004 The Vertebrate Genome Annotation (Vega) database
is a community resource for browsing manual annota-
tion from a variety of vertebrate genomes of finished
sequence. Vega is based on the Ensembl schema.
http://vega.sanger.ac.
uk/index.html
[Loveland, 2005]
WashU
EpiGenome
Browser
2013 A next-generation web-based genomic data visualiza-
tion system.
http://
epigenomegateway.wustl.
edu/browser/
[Zhou et al., 2011],
[Zhou et al., 2013]
Stand-alone Genome Browsers
Avadis NGS/
v 2.0 Strand
NGS
2011 Strand NGS - Formerly Avadis NGS is commercial, in-
tegrated platform developed by Strand Life Sciences to
provide analysis, management and visualization tools
for next-generation sequencing data. It supports work-
flows for RNA-Seq, DNA-Seq, ChIP-Seq, Methyl-Seq
and small RNA-Seq experiments.
http://www.strand-ngs.
com/features/
genome-browser
Not published yet
CGView 2004 A circular Genome Viewer, a Java application that
can be used to generate both static and interactive
graphical maps of circular DNA molecules, such as
plasmids and bacterial genomes.
http://wishart.biology.
ualberta.ca/cgview/
[Stothard and Wishart,
2005]
∗N/A=Not Available
24

GenPlay 2011 A desktop genome analyzer and visualizer that was
written in Java used for high-throughput data that is
being developed by the Stem Cell Genomic Unit at the
Albert Einstein College of Medicine
http://www.genplay.net [Lajugie and Bouhas-
sira, 2011]
Golden Helix
GenomeBrowse
2012 A free, desktop tool that delivers visualizations of ge-
nomic data. It has a high performance backend that
is paired with an intuitive user interface.
http://www.goldenhelix.
com/GenomeBrowse/
Not published
Integrated
Genome
Browser (IGB)
2003 An open source, desktop graphical display tool imple-
mented in Java. It is a highly customizable genome
browser that can be used to view and explore genomic
data and annotations, especially RNA-Seq and ChIP-
Seq data sets.
http://igb.bioviz.org [Nicol et al., 2009]
MochiView
Genome
Browser
2009 A Java software that integrates browsing of genomic
sequences, features, and data with DNA motif visual-
ization and analysis.
http://johnsonlab.ucsf.
edu/mochi.html
[Homann and Johnson,
2010]
Savant 2010 A next-generation genome browser designed for the
latest generation of genome data.
http://genomesavant.
com/p/savant/index
[Fiume et al., 2010,
2012]
The Genome
Environment
Browser (GEB)
2008 The Genome Environment Browser (GEB) is a Java
application developed to visualise distribution of ge-
nomic features in high resolution.
http://web.
bioinformatics.ic.
ac.uk/geb/
[Huntley et al., 2008]
Viral Genome
Organizer
(VGO)
2000 A genome browser providing visualization and analy-
sis tools for annotated whole genomes from the eleven
virus families in the VBRC (Viral Bioinformatics Re-
source Center) databases.
http://athena.
bioc.uvic.ca/
virology-ca-tools/vgo/
[Upton et al., 2000]
Back in 1996, the first reference of a genome browser named Genomebrowser was introduced
by[Heumann et al., 1996], and is a web-based genome browser developed for the visualization of
homologies within the S. cevevisiae genome [Kaps et al., 1997]. This genome browser follows a
top-down approach of presenting the genome data [Heumann et al., 1996]. After that, several other
genome browsers were introduced. Some are web-based genome browsers, such as GBrowse [Stein
et al., 2002], JBrowse [Skinner et al., 2009] and Dalliance [Down et al., 2011]. Others are standalone
applications, such as Savant [Fiume et al., 2010] and the Integrated Genome Browser (IGB) [Nicol
et al., 2009].
Besides their platforms, genome browsers can be divided according to the type of genome they
represent: circular and linear. There are a few circular genome browsers, such as CGView [Stothard
and Wishart, 2005], Leproma [Jones et al., 2001] and Genome Projector [Arakawa et al., 2009](a
screenshot of Genome Projector is shown in Figure 18), which are all used to represent circular
genomes, usually bacteria. Most genome browsers are used to represent linear genomes, since they
represent a much wider number of organisms. In linear genome browsers, a one dimensional coor-
dinate system is used to map genomic data and annotations. This coordinate system corresponds
to the base positions in the genome sequence. Typically, the different types of annotations are
organized inside tracks [Gel Moreno and Messeguer Peypoch, 2014]. While most genome browsers
follow a horizontal orientation of the data tracks under the coordinate system, a few follow a vertical
orientation, a good example being the well known NCBI’s Map Viewer [Dombrowski and Maglott,
2002]. They also have zooming and panning capability to navigate to interesting regions. The linear
25

genome browsers implement a one-dimensional zooming (only the chromosome or the sequence scale
changes) [Gel Moreno and Messeguer Peypoch, 2014].
Figure 18: Screenshot of Genome Projector, a zoomable circular genome browser based on the G-
Language and the Google Maps technology, displaying the genome of Escherichia coli.source: http: // www.
g-language. org/ g3/
Stand-alone browser programs are installed locally and provide better visualization and inter-
activity but they burden users with keeping data up-to-date, constantly having to download and
reformat data. They are not suited for distributive and collaborative research approaches [Mader
et al., 2014]. In contrast, web-based genome browsers do not require the user to download, install
or update. Typically they delegate computational load to remote servers, and store data centrally
for all users to immediately dive into the data [Wang et al., 2013b].
Since genomic data like DNA sequences and protein sequences and their annotations are mainly
stored in online databases like GenBank (http://www.ncbi.nlm.nih.gov/genbank/), DDBJ (DNA
Data Bank of Japan, http://www.ddbj.nig.ac.jp), and the European Bioinformatics Institute
(http://www.ebi.ac.uk/about), web-based genome browsers have a much larger community than
26

standalone applications that are more dedicated to fulfill the needs of individual users. Online re-
sources and analysis are increasing, which results in the pressing need to design integrative genome
browsers that provide open data access [Kong et al., 2012].
In this document we are mostly focusing on web-based genome browsers. The main platform
of this type of genome browsers is the client’s web browser. As such, web-based genome browsers
largely depend on the advancements of web technology. During the Web 1.0 paradigm, the web
was about navigating through a set of static web pages. Therefore, genome browsers during that
time were page-based applications that rendered static images of the current region of the genome
and sent it to the client web-browser. The main approach used by major genome browsers was to
let the server do all the work of querying databases, integrating information, and creating bitmap
image files and displaying them through the user’s web browser [Down et al., 2011].
Several popular web-based browsers, such as the University of California, Santa Cruz (UCSC)
genome browser [Kent et al., 2002], and the Ensembl genome browser [Birney et al., 2004] were used
to access huge databases and create visual representations of that data. Those genome browsers
took advantage of the server capabilities and their main approach was to let the servers suffer
all the computational costs of rendering a static pictorial image of the requested region, which the
client’s web browser just passively displayed. They also used the Common Gateway Interface (CGI)
protocol, which poses a page-based model of viewing the data. For instance, in GBrowse, the main
approach is to let the server query a database of genomic features and render the HTML and graphics
files needed to display a region of the genome [Skinner et al., 2009]. As a result, those early and
classical genome browsers lacked the interactivity found in stand-alone applications. Since the first-
generation technologies suffered from server-side rendering delays and static page-based transition,
it could not support smooth navigation through large genomic regions and annotations. As such,
every user action would result in the server rendering an image which is passively delivered to the
client web browser [Mungall, 2011]. It also did not benefit from the clients computational power
and disrupted the user attention [Wang et al., 2013b, Kong et al., 2012].
After that, data representation improved over the years, as well as data access, with the intro-
duction of distributed sources via DAS [Dowell et al., 2001] or other means, but the interactivity
was still limited by the Web 1.0 technologies [Gel Moreno and Messeguer Peypoch, 2014]. The basic
functions provided by earlier browsers are a graphical interface to view different data types in the
context of genomic sequences, basic navigation (panning and zooming) through page-based transi-
tions, searching for regions of interests, and adding third party annotation by uploading data files
in standard supported formats, and configuring the display by manipulating tracks (like hide/show
tracks, reorder, change track appearance (glyph shape/color/size)) [Stein et al., 2002].
Hybrid approaches, such as Java applets, were developed to overcome the limits of HTML and
provide more interactivity. Those applets can be downloaded from a server and run in a Java virtual
27

machine on the user’s computer. One of the early examples of that is BioViews [Helt et al., 1998].
Nevertheless, Java applets suffering from their own problems and limitations, this approach was not
adopted by other genome browsers [Loraine and Helt, 2002, Gel Moreno and Messeguer Peypoch,
2014].
In recent years and with the introduction of the second-generation (Web 2.0) technologies such
as JavaScript, Asynchronous Javascript and XML (AJAX), RESTful architecture, client-side ren-
dering and HTML5 technologies, a new class of web applications were introduced named ‘Rich
Internet applications’. These applications decouple server and user interactions (communication
between the web browser and the server takes place asynchronously in the background), and move
from the page-based model to a more interactive solution. This approach is achieved by tech-
niques such as client-side scripting (using JavaScript and related dynamic HTML technologies)
and structured data representation (using file formats like XML and JSON). These techniques are
often collectively called AJAX(Asynchronous JavaScript and XML; http://www.adaptivepath.
com/ideas/essays/archives/000385.php), Figure 19 showing the traditional model for web ap-
plications compared to the AJAX model [Skinner et al., 2009].
Around 2005, next-generation sequencing technologies have emerged and provided cheaper and
faster genome sequencing solutions. For example, the current 454 Life Sciences (Roche) GS FLX
system can produce 100 million bases per run in less than eight hours, is hundreds of times faster and
over 10 times cheaper than the conventional Sanger sequencing. Another example is the Illumina
sequencing (formerly Solexa sequencing) technology, which is able to generate over 1 billion bases
of high-quality DNA sequence per run at less than 1 % of the cost of Sanger sequencing. These new
technologies have produced massive amount of sequence data, which presented another challenge
for genome visualization and analysis tools [Huang and Marth, 2008].
In the same year, 2005, Google Maps API was launched (http://maps.google.com/), which
was one of the earliest examples of AJAX applications. Google Maps demonstrated the possibility
of creating a rich web application that can provide direct image manipulations by using AJAX
to provide more interactivity to web applications [Gel Moreno and Messeguer Peypoch, 2014].
”Google Maps achieves this by pre-rendering an image of the entire world map at multiple zoom
levels, breaking this image into tiles of 256 X 256 pixels, and having a JavaScript client, which runs
in the user’s web browser, downloading only those tiles visible in the current view“ [Skinner et al.,
2009].
28

Figure 19: The traditional model for web applications (left) compared to the AJAX model (right). source:
http: // www. adaptivepath. com/ ideas/ ajax-new-approach-web-applications/
Soon after, this improvement in web technologies had impacted genome browsers and intro-
duced new AJAX and HTML5 based genome browsers that became the ‘Next-generation genome
browsers’. Three examples of implementing Google Maps approach in genome browsers are XMap
[Yates et al., 2008], ABrowse [Kong et al., 2012] and Genome Projector [Arakawa et al., 2009]. All
three genome browsers follow the Google Maps approach of pre-rendering, such that each track is
rendered and broken up into tiles which are served up on demand depending on the genome region
that the user is viewing [Skinner et al., 2009, Medina et al., 2013, Pak and Roth, 2013]. However,
Genome Projector only shows bacterial genomes and both XMap and Genome Projector genome
browsers do not support zooming to view individual DNA bases. This is due to the space required
to store pre-rendered image tiles on the server [Skinner et al., 2009]. Another example that follows
Google Maps approach is ChromoZoom [Pak and Roth, 2013], which also pre-renders and caches
general-use tracks into tiled images on the server and serves them in an interactive web interface
with inertial scrolling and zooming via the mouse wheel or trackpad. ChromoZoom is the first
online genome browser to provide client-side parsing and rendering of user-provided custom data
[Pak and Roth, 2013].
Another example of these next-generation browsers is Genome Maps [Medina et al., 2013],
which also takes advantage of new HTML5 standard, specially the scalable vector graphics (SVG)
and the FileReader API. At that time, this was the only web-based solution that allows users to
upload local large BAM or VCF files and navigate through them dynamically on the client side
29

[Medina et al., 2013]. Another feature to genome browsers was implemented in JBrowse version
1.10.0 (http://jbrowse.org/jbrowse-1-10-0/), which is the creation of ‘combination tracks’ that
can combine data from multiple other tracks using range, arithmetic, or masking operations. For
example, a BigWig track can be masked to highlight only regions that lie within features from a
BAM track, or the intersection of two or more feature tracks can be calculated.
Several recent genome browsers avoid the cost of pre-rendering in several different ways. For
instance, the NCBI Sequence Viewer (http://www.ncbi.nlm.nih.gov/projects/sviewer) uses
the CGI-based traditional approach of rendering an image of the current region on the server and
sending it to the client, but it also allows dragging the image from side to side, as in Google Maps.
After user drags the image, the server renders a new image representing the new region. This
approach is not a big improvement from the traditional genome browsing and it also suffers from
server-side computational costs. Another example is Anno-J [Lister et al., 2008], which implements
a different strategy that relieves the server from the costs of rendering, by rendering the genomic
information on the client’s web browser using the ‘canvas’ HTML element. Still, the database
query costs remains. The second version of GBrowse [Stein, 2013] improves the user experience by
benefiting from AJAX to dynamically load, reorder, and update browser tracks without triggering
a full page reload. However, it still does not support smooth panning and zooming and suffers
the cost of server-side rendering. On the other hand, JBrowse [Skinner et al., 2009] implements a
different strategy where both database-query (determining what genomic features are in the region
of interest) and rendering those features using standard HTML and JavaScript functionality are all
done by the client [Skinner et al., 2009]. Both Anno-J and JBrowser render genomic data on the
browser-side, the former drawing pixels on HTML5 Canvas elements and the latter manipulating
standard HTML elements. However, both require pre-processing of custom data by an administrator
before it can be rendered within the browser [Pak and Roth, 2013]. Several other web-based
genome browser examples have been presented, which offer a more interactive and smoother genome
browsing experience. This is due to the distribution of work between the server and the client which
reduces network loading time and does not require page reloading. Such as myKaryoView [Jimenez
et al., 2011](a genome browser and DAS client with client side data rendering based on HTML
elements), Dalliance [Down et al., 2011] (an interactive genome browser and DAS client with client
side data rendering based on SVG, and the WashU epigenome browser) [Zhou et al., 2011, Wang
et al., 2013b, Sen et al., 2010, Gel Moreno and Messeguer Peypoch, 2014].
The UCSC Genome Browser (http://genome.ucsc.edu.) [Kent et al., 2002], Ensembl (http:
//www.ensembl.org/) [Birney et al., 2004], and NCBI Map Viewer (http://www.ncbi.nlm.nih.
gov/projects/mapview) [Dombrowski and Maglott, 2002] are the most widely used genome browsers,
since they are gateways to genome projects and serve a large amount of data.
30

The Ensembl genome browser was launched by the Sanger Centre and EMBL-European Bioin-
formatics Institute in the year 2000 [Brooksbank et al., 2003]], the year after the University of
California, Santa Cruz (UCSC) launched its Human Genome Browser [Rosenbloom et al., 2015].
Table 2 provides a reference to view a list of the available and reviewed genome browsers.
The development of a fully functional genome browser is a time-consuming and tedious process.
A well designed genome browser framework, like the widely known and used GBrowse [Stein et al.,
2002]], and the reuse of readily available open-source genome browser implementations are very
important aspects [Kong et al., 2012].
There are several examples of software reuse in genome browsers. For instance, the Ensembl
code has been reused on sites such as the Gramene rice genome (http://www.gramene.org/), the
Vega curated annotation browser (http://vega.sanger.ac.uk/) and VectorBase (http://www.
vectorbase.org) [Stalker et al., 2004, McKay and Cain, 2009].
In addition, several genome browser toolkits and libraries, that help in the development and
implementation of genome browsers, have been introduced, such as: the UTGB Toolkit [Saito
et al., 2009]] (which offers easy ready-to-use functions to develop genome browsers and can act as
a DAS client), Scribl [Miller et al., 2013] (an HTML5 Canvas-based graphics library for visualizing
genomic data over the web) [Gel Moreno and Messeguer Peypoch, 2014], SVGenes [Etherington
and MacLean, 2013](a library for rendering genomic features in scalable vector graphic format).
There also have been several reviews of genome browsers including [Cline et al., 2009], [Nielsen
et al., 2010], [Wang et al., 2013a], [Karnik and Meissner, 2013], [Pabinger et al., 2013] and even a
framework [Lacroix et al., 2011] for the evaluation and comparison of genome browsers has been
created [Gel Moreno and Messeguer Peypoch, 2014].
2.3 Information Visualization and Genome Browsers
Since the genomic era and the completion of the human genome project, the quantity of biological
data and information has been vastly growing, causing a problem in investigating and analyzing this
plethora of data. In order to solve this problem, Information Visualization (IV) provides various
techniques to aid the analysis of these huge amounts of data. In general, information visualization
techniques can be defined according to [Tao et al., 2004] as:
Computerized methods that involve selecting, transforming and representing data
in a visual form that facilitates human interaction for exploring and understanding the
data.
Information visualization techniques take advantage of two properties of the human visual system.
First, its ability to deal with very large amount of information at a time (large bandwidth). Second,
31

its ability to distinguish trends and patterns within visual fields, like location, shape, size, and color
of objects.
In general, information visualization techniques can be used to serve two goals: first, to visualize
large amounts of information; second, to aid and accelerate the analysis of massive amounts of
information by the recognition of patterns and trends [Tao et al., 2004].
Genome browsers, as defined in Section 2.1, are a well known visualization tool, which is used to
visualize the genome of any organism and its annotations. Analyzing the genome of any organism
in their original textual format is a very challenging task. The human genome for instance, is about
3 billion base pairs, which is like going through a huge text book of a very long sequence of A, C, G,
T (base pairs). Looking at this massive text is not helpful, since we cannot keep a global overview
of the data and still get interesting detailed information. Therefore, there is a huge demand for
tools that can help biologists analyze genomes and their annotations. Genome browsers are an
essential visualization tool used on a daily basis by biologists investigating genomes and related
information. Information visualization techniques are used in genome browsers to facilitate the
analysis of genomic datasets [Tao et al., 2004].
The principles used in designing and implementing genome browsers are based on the fact
that spatial relationships often indicate functional relationships in genomes. They are therefore
used to visually show the spatial relationships between different pieces of genomic data as shown in
Figure 20, which shows the position and structure of a gene named ‘lin-12’ in C.elegans chromosome
III:9060242..9071760 (following the format used to indicate the exact position of any feature on the
genome chr:start..end).
It is evident that good representations of data can greatly help us understand and generate some
useful knowledge. It is important that the representations used are meaningful and suitable for the
type of data being presented and the kind of information we want to extract from it, e.g. line graphs
are used to represent GC content of a sequence data type and rectangles connected with lines are
used to represent gene position and structure (see Figure 22-(a) and Figure 20). This visual repre-
sentation of different data types helps users form hypotheses about their functional relationships.
They also help to visually compare and correlate information from several different sources, thus it
is used to evaluate multiple forms of evidence, looking at interesting biological cases, linking out to
more detailed sources of information, such as genomic databases. For example, the user can click
on a gene feature, as in Figure 20, and it will open another page presenting more detailed informa-
tion as in Figure 21. They are also helpful in communicating information to collaborators, visually
preparing publication figures, and their availability on the web provides a link with numerous other
web-based sources of information [Skinner et al., 2009].
32

(a) Gene Track
Figure 20: Example of Gene Track, screen shot taken from the WormBase website http://www.wormbase.
org/tools/genome/gbrowse/c_elegans_PRJNA13758/
(a) Detail Page
Figure 21: Example of a Detail Page, screen shot taken from the WormBase website http://www.
wormbase.org/species/c_elegans/transcript/R107.8#05--10
The basic approach used by most genome browsers is to represent the genome and all its other
data along the DNA sequence in a linear, one dimensional representation, since most of the genomes
are considered as linear data, with the DNA sequence being the main coordinate. The other types
of annotation information are represented as parallel piled up “tracks” under the same coordinate
along the Y-axis. Visual hints like “glyphs” are designed to represent the type of information on
the tracks. For example, colored rectangles could be used for coding exons and thin lines for coding
introns, as shown in Figure 20.
It is important that the right level of detail is emphasized while other distracting aspects of the data
are hidden. Since an over complex representation will show more distracting information and an over
simplified representation will discard important information [Gel Moreno and Messeguer Peypoch,
2014]. In the context of genome browsers, it is extremely helpful to show information in different
33

levels of detail, each level emphasizing different aspects of the data in a seamless and interactive
way. In order to accomplish this, one of the key information visualization techniques, ‘dynamic
semantic zooming’ , is used in genome browsers: it automatically changes the semantics of the
displayed content based on different levels of zooming, which helps view genomes in different levels
of detail, such as the chromosome level, locus level, gene level and DNA bases level. An example of
this is shown in Figure 22 [Tao et al., 2004, Wang et al., 2013a].
(a) Low Zoom
(b) High Zoom
Figure 22: (a) DNA track at low resolution shows the GC content. (b) The same track as (a) but at high
resolution (or zoom levels) shows the individual DNA base pairs.
The strategy used in implementing most visualization tools in bioinformatics including genome
browsers consist of the same three main steps for implementing any general information visualization
system as summarized by [Lang et al., 1996], which include data acquisition, data mapping, and
rendering. The first step is to acquire data and perform any needed pre-processing operation so
that the data is in the appropriate format ready to be mapped to visual spaces. This is available
in genome browsers in the form of pre-processing code, which takes data in a special file format,
or from databases, and format it to be usable by the browser. The second step is to map the
pre-processed data to visualizable geometrical shapes with appropriate attributes, such as location,
color, and size. In our example, the pre-processed data can be mapped to glyphs of different sizes,
colors, and shapes. Different groups of data could be encoded using different glyphs with specified
size and color. The last step is to render the final output images to a visible graphical view. In
the genome browsers case, the genomic data available is rendered into tracks under a sequence
34

coordinate and presented to the user [Tao et al., 2004].
2.4 Comparison of Major Genome Browsers
2.4.1 Meta Level Information
We chose four specific genome browsers for our study, because they are well known research pro-
totypes. The description of the four investigated genome browsers (GBrowse, JBrowse, Dalliance
and Savant) follow the same layout with 4 main sections that comes after a brief introduction of
each genome browser. The 4 main sections are: user interface, implementation, functionality and
features (which in turn is divided into 8 subsections that are dedicated to a particular aspect or
functionality of a genome browser), and the final section is the non-functional requirements section.
User Interface section, contains a screenshot annotated with the various parts of the user inter-
face of a genome browser, followed by a description of the user interface look and design.
Implementation section, describes general implementation details like the programming lan-
guages used, the basic architecture of the implementation and sometimes describes some used
data structures.
Functionality and Features section, describes the various functionalities of each of the inves-
tigated genome browsers, which are divided into 8 important functionality aspects that are
considered in our work.
Visualization, describes the basic layout of the display and the visualization aspect of each
genome browser and how they visualize the genome and its related annotations.
Supported Data Files and Sources, lists the supported data files and sources of each
genome browser.
Navigation, talks about the various ways of navigating through the genomic view of each
genome browser.
Customization, discusses the customization options that is available to the end user of each
genome browser.
Third-party Annotations, talks about how each genome browser will help end users view
third-party annotations.
Searching Capabilities, explains the search capabilities of each genome browser.
Sharing Annotations, talks about the available sharing options of each genome browser.
Data Retrieval, talks about data access and retrieval options found in the genome browsers.
35

Non-Functional Requirements section, mentions the supported non-functional requirements
of each genome browser.
2.4.2 Genome Browser Description
2.4.2.1 GBrowse
The GBrowse is short for the Generic Genome Browser. It is a combination of databases and
interactive web pages for displaying annotations and other features on genomes. It is a mature,
open source and web-based genome browser which can be deployed on public and private websites.
It was originally developed for WormBase (www.wormbase.org) and then released as a standalone
project in January 2002 and its latest release (version 2.54) was available in 2012. It is one of
the first web-based genome browsers and it was the first genome browser to be used outside its
original site. It is one of the most popular tools of the Generic Model Organism Database (GMOD)
project (www.gmod.org/). GBrowse is very popular and is used by many public sites including
WormBase (wormbase.org/), COSMIC (www.sanger.ac.uk/perl/genetics/CGP/cosmic), mod-
ENCODE (www.modencode.org), the human HapMap project (www.hapmap.org), BeeBase (www.
beebase.org), FlyBase (flybase.org), the Database of Genetic Variants (projects.tcag.ca/
variation) and many others. GBrowse is well supported by a mailing list, a WIKI, a help desk
and both physical and online tutorials. As of 2012 there were no major new features being added
to GBrowse. Instead, new development efforts were going to JBrowse, GBrowse’s designated re-
placement in the GMOD suite [Stein, 2013, Mao and McEnhimer, 2010]. In this section we are
investigating this genome browser to capture its main functionality and user interface design, which
will give us more knowledge about this type of tool and help drive the first set of requirements.
2.4.2.1.1 User Interface
The main interface of GBrowse is the genome browser page with the tracks aligned horizontally
along the Y-axis under the same genomic coordinate. The following information was found on
GBrowse’s help page. The browser display has three panels as shown in Figure 23.
(A) The overview panel: This panel displays the genomic context, typically an entire assembled
chromosome or a large portion of the sequence assembly such as a scaffold or contig.
(B) The region panel: This panel displays a portion of the genome surrounding the region of
interest.
(C) The detail panel: This panel displays a zoomed-in view of the genome corresponding to
the overview’s selection rectangle. The detail panel consists of one or more tracks showing
annotations and other features that have been placed on the genome.
36

Figure 23: Screenshot of GBrowse, illustrating the various parts of the user interface. (A) The overview
panel, (B) The region panel, (C) The detail panel, (D) The tabbed menu, (E) The search box, (F) The data
sources menu, (G) The navigation control panel, (H) The track control buttons. Source: local installation of
GBrowse
At the top of the genome browser page there is a tabbed menu, as in Figure 23-(D), which
consists of several tabs that can take us to other useful pages.
The list of tabs are (numbered from left to right):
(D.1) Browser tab: This is the genome browser’s page that displays the genome with its annotation
tracks.
(D.2) Select Tracks tab: This is the page of the list of existing predefined tracks that the user can
select to display in the browser.
37

(D.3) Snapshots tab: This is where the user goes to take snapshots of the display for presentation
or publication usage.
(D.4) Community Tracks tab: This is where public or community tracks are kept and it is used to
share files between users from a community repository of available tracks. This was introduced
starting GBrowse version 2.20 and above.
(D.5) Custom Tracks tab: This is where the user goes if he wants to display third party annotation
and features by either uploading a file, creating their own tracks using one of the supported
file formats or pasting the URL of a remote file.
(D.6) Preferences tab: This is the place where users can change their preferences like the size of the
region, the size of the genome browser image or whether or not to cache tracks.
There are several navigation controls on the top right of the browser’s page above the overview panel
shown in Figure 23-(G), which are used to scroll and zoom to regions of interest. There are two
configured speeds of scrolling left or right and several configured zoom levels and, for fine zooming,
the + and − signs are used. In Figure 23-(E), a search box can be used to directly navigate to
interesting regions or search for specific features or annotations. From Figure 23-(F) the user can
change the displayed dataset from a list of available data sources (This is helpful to change the
organism that is being investigated or even just change the source of data if there are multiple
sources). Several control and configuration buttons are found next to each track’s name, as shown
in Figure 23-(H).
2.4.2.1.2 Implementation
In general, GBrowse is a web application that has differently implemented server and client sides.
The server side is written in Perl using two libraries, BioPerl and Bio::Graphics, and a little C
code to accelerate critical functions like reading sequence or feature files, calculating alignments
or even writing tracks’ data in special formatted files to be viewed and downloaded by the user.
The server side manages a series of databases containing genome annotation information, receives
requests from the web browser to view regions of interest and renders these regions as PNG, SVG
or PDF images.
The client side has a series of Javascript functions to handle the user interface, allowing the user
to pan and zoom across the genome, select a region via click-and-drag, configure tracks via popup
menus and upload track data [Stein, 2013].
GBrowse has a 3 layer architecture.
First layer: This layer has the CGI (Common Gateway Interface) script named gbrowse which
is the main component, it is responsible for accepting user requests and processing them,
managing the user interface and displaying rendered images of annotated regions.
38

Second layer: This layer has two software libraries BioPerl and Bio::Graphics. The first library
is responsible for interceding between the CGI script and the underlying database, while the
second is responsible for rendering the genome images and uses the GD module which is a
Perl library that is capable of generating many image formats such as JPEG, WBMP, PNG.
Third layer: This layer is a relational database, MySQL, which is responsible for storing and
retrieving features [Stein et al., 2002].
GBrowse uses simple configuration text files (.conf) where the data administrator can configure var-
ious aspect of the browser’s workings and user interactions like specifying the different datasources,
tracks and their configurations, directory information and more.
2.4.2.1.3 Functionality and Features
Visualization
Aggregating different types of genomic data and annotations into one graphical view is the main
function of every genome browser. GBrowse does this by providing three annotation views with
different scales. Those views are the chromosome view, a regional view and a detailed view. In
GBrowse, those views are called “panels” and their purpose is to ease the spatial correlation between
the features and their location on the sequence. GBrowse’s display of annotations and genomic fea-
tures are organized in the form of tracks along the Y-axis and under the same genomic coordinate
which is used as the X-axis.Those tracks contain features of some type in the form of distinctively
shaped “glyphs” and those glyphs are graphical objects that determine the shape of each of the
displayed genomic features associated with a specific GBrowse track. Those glyphs present a con-
figurable set of parameters specific to their type allowing further control over the display of features
such as height, color, width etc. GBrowse has a open source library of almost 79 glyphs of different
shapes and behaviours and this library continues to grow. The use of glyphs distinguishes GBrowse
user interface from the UCSC and Ensembl browsers, which rely more heavily on color to distinguish
different genomic features [Wang et al., 2013a, Stein et al., 2002].
Supported Data Files and Sources
GBrowse supports the following types of file formats: GFF, GFF3, BED for simple data and Wiggle
(WIG) for dense quantitative data. It also accepts simple internal format called feature file format
(FFF) and, as of version 2.0, GBrowse also supports next-generation sequencing data by displaying
SAM and BAM sequence alignment files [Stein, 2013].
GBrowse can display annotations and genomic features from multiple types of data sources like flat
39

files, or different databases including MySQL, BioSQL and Chado. It can also act as a DAS client
or a DAS server [Stein, 2013].
Navigation
GBrowse offers zooming and scrolling capabilities and this can be done in several ways like using the
search box to navigate to a particular region or feature, jumping from region to region by clicking in
the overview panel, scrolling or zooming with the navigation bar controls described in Figure 23-(G)
[Stein et al., 2002].
Customization
There are several ways to customize the view in GBrowse. For the administrative user, there are
specially formatted configuration files (.conf) that are used to customize GBrowse and its local data.
Using the ‘Preferences tab’, as shown in Figure 23-(D.6), the end-user can change his preferences
like, the size of the region, the size of the genome browser image or whether or not to cache tracks.
For more specific customizations of the display, the user can configure the display of tracks in several
ways:
• Selecting a set of tracks to display using the list of checkboxes;
• Changing the order of the tracks by simple drag and drop;
• Hide/show or even close tracks in the detailed region; and
• Change the appearance of the track by manipulating its glyphs, which is done by changing
several attributes of the glyphs display like the color, size, height and width etc.
Semantic zooming does further customization of the display, GBrowse demonstrates this by first
inhibiting the display of feature labels and descriptions, and then deactivates collision control to
allow glyphs to overlap densely. Some glyphs will also change appearance during semantic zooming.
GBrowse can remember the user’s settings between sessions so that at the user’s next visit to the
GBrowse page, his or her preferences in terms of tracks, track options, track order, display width,
and genomic region of interest are automatically restored to their previous values. There is a reset
button located to the right of the navigation bar, that will restore the standard settings. The next
section will discuss one of the most important customizations of GBrowse which is the ability to
add private user tracks [Stein et al., 2002].
Third-party Annotations
One of the most important features of GBrowse is the ability to display third-party local or remote
annotations. This is done by a set of controls. The user can create their annotations and write
40

them in a provided textfield by using the ‘From Text’ option. GBrowse accepts either the full nine-
column GFF format or a simplified three-column version. Both formats allow the user to create
complex multipart features. Local annotations can be added to the genome by uploading one or
more user prepared text files describing the nature and position of the annotations to GBrowse
using a standard file upload accessed from the ‘From a file’ option. The user can also control the
way that the features are formatted by specifying their glyph, color, height, and other graphical
attributes. Once a feature file is uploaded, it persists on the GBrowse server for a period of time
established by the database administrator, typically 60 days since the last time the uploaded file
was accessed. Then end-users can manipulate the uploaded files, modify them, or delete them.
Those files are only accessible via a secret key that is stored in a cookie on the end-user’s machine.
In the case of remote files all the user needs to do is paste the URL of the file and import it to
GBrowse using the ‘From a URL’ option. Both uploaded and remotely located feature files are
stored at the server side as a set of flat files [Stein et al., 2002]. Figure 24, shows the Custom Track
page and the various ways of adding custom tracks.
Searching Capabilities
GBrowse provides a very flexible search functionality. It can search by annotation ID, name,
or comment. It accepts multiple types of search terms such as a chromosome name using the
nomenclature, a contig name, a clone accession number, a GenBank accession number, a gene
symbol, a genetic marker name, an SNP ID, or any other unique feature name that is known to the
database.
By default, after the search is complete, GBrowse will fit the entire landmark into the detailed view,
and if a search term was found in multiple locations, the browser will display an intermediate screen
that graphically shows the regions and prompts the user to select one to view. In the case that the
selected region is too large, the browser will show the region in the “overview panel” (Figure 23-(A))
and will ask the user to zoom in. Also if the searched landmark does not correspond to a feature
name, GBrowse will perform a keyword search on the underlying database, presenting the user with
a list of matching features and their genomic coordinates [Stein et al., 2002].
41

(a) Custom Track Page
(b) Track Upload Options
Figure 24: Custom Track Page in GBrowse, (a) the user enters this page to add custom tracks, (b) the
different ways of adding user’s annotations
Sharing Annotations
GBrowse provides different ways of sharing tracks or files. It works on the basis that every file has
a permission setting which is a kind of sharing policy that specifies exactly who can access a file.
The user can use one of the following policies of sharing:
• Public/community: the users can add their tracks to a community tracks repository which is
available to all users.
• Casual: The user can click on the sharing icon found above each track and GBrowse will
provide a sharing link that the user can copy and send to other users. This can be done to
42

all the selected tracks as shown in Figure 25-(a).
• Group sharing: is a more secure way for an owner to share a track with a specific user.
This can be done by simply entering the username or user ID of the user that the owner of the
track wishes to share the file with, and hitting ‘Add’. That user will have the track automatically
added to their session so he/she can use it. This is accessed by the Custom Tracks tab found in
Figure 23-(D.5) under a track’s sharing section as shown in Figure 25-(b) [GMOD, 2015].
(a) Track Casual Sharing
(b) Track Group Sharing
Figure 25: Track Sharing in GBrowse, (a) ‘Casual’ sharing, (b)‘Group’ sharing.
43

Data Retrieval
GBrowse can help the user retrieve data by either using the ‘save track’ data control found in the
track controls (Figure 23-H) to save the data associated to a particular track or by using a variety
of available dumper plug-ins.
Gbrowse has three types of plug-ins:
1. Dumper plug-in: dumps the currently displayed region of the genome in a text, HTML or
another format. Example, FASTA and GFF dumping functions implementation.
2. Finder plug-in: searches the underlying databases for features, returns a list of features or
genomic regions found, then displays the results. For example, OligoFinder plug-in.
3. Annotator plug-in: adds annotations to the current view, for example standard restriction
map generator [Stein et al., 2002].
2.4.2.1.4 Non-Functional Requirements
GBrowse focuses on several non-functional requirements including extensibility, portability and
performance. Extensibility, as it was designed to be easily extended at the database layer (to
communicate to other databases), at the data model layer (to add new sequence objects with
different relationships), at the graphics rendering layer (to create new Glyph modules), and at
the topmost application layer (to add plugins that extends the GBrowse capabilities). Portability,
as it was designed to be modular and easily portable (depends on readily available software).
Performance, hence C code is used on server side to accelerate critical functions [Stein et al., 2002].
2.4.2.2 JBrowse
JBrowse is an open source JavaScript-based genome browser, hence the name JBrowse. It is also
a GMOD project being developed as the successor of GBrowse. Its first version 1.0 was developed
in 2009, as the first online publication of JBrowse suggests, and its second version 1.1 was released
in September 2010, which was the first in a planned series of quarterly releases. It is still under
active maintenance and development and it is actively documented and supported by a mailing list,
bug-tracking, request-tracking system and tutorials. There is an Amazon virtual machine image
available at the tool’s official site (http://jbrowse.org). Until now only two web-sites are using
JBrowse as their genome browser: Personal Genomic website (http://genomesunzipped.org/)
and the 150 Tomato Genome ReSequencing project (http://www.tomatogenome.net).
This section will discuss JBrowse looking at several aspects of the tool.
2.4.2.2.1 User Interface
44

Figure 26: Screenshot of JBrowse, illustrating the various parts of its user interface. (A) A list of available
tracks, (B) The genome view, (C) The name of the track, (D) A menu for selecting a dataset—displaying the
name of the current dataset , (E) The tool panel, (F) The reference ruler, (G) Panning controls left/right,
(H) Zooming controls, (I) A menu for selecting the current sequence, (J) A text box (which can be used for
searching) showing the exact coordinate of the visible region, (K) The highlight button, (L) The share button
Source: JBrowse demonstration at http: // jbrowse. org
A reference ‘ruler’ at the top of the window indicates the chromosome, with the current viewing
area encapsulated by a red box. A pane on the left of the display stores the available tracks which
the user can select for display in the viewing area. The user can also move the tracks vertically to
reorder them in the viewing area. The panning and zooming controls are used to pan and zoom to
interesting regions of the genome.
2.4.2.2.2 Implementation
JBrowse is a client-server application that works over the Internet. The server-side is implemented
45

in Perl using the BioPerl library and the client-side is implemented in JavaScript using the Dojo li-
brary. JBrowse uses client-side rendering, which means that the client does all the work, determines
what features are in a region of interest and renders those features using HTML and JavaScript
functionality (it draws those features live). In fact, all track manipulation is done live with no page
reload, by using AJAX technology. The only server-side work is preparing new data for JBrowse
to use, by sending static files to the client browser routines. Those static files are organized in
a way that enables the client browser to do the work done by the server in traditional genome
browsers. Like GBrowse, the server requires preprocessing of tracks before serving them to clients
and this is done by available Perl script. Those scripts preprocess raw annotation files (GFF/GFF3
for simple/compound feature tracks, WIG for quantitative tracks, and FASTA for sequence tracks)
and generate the relevant files that are downloaded by the client (JSON files for simple/compound
feature tracks, PNG images for quantitative tracks, and chunked strings for sequence tracks). Be-
sides flat files, the annotations can be fetched from a BioPerl genome database (BioTDB, BioTDasI,
etc.), in which case a configuration file (styled after the GBrowse configuration file, but using the
JSON format) identifies the database and determines the track listing and types.
In JBrowse, there are different data structures used to make loading and querying data faster.
Feature tracks are stored in Nested Containment Lists (NCLists) [Alekseyenko and Lee, 2007] data
structure for indexing features. This data structure is an efficient way of determining the intervals
contained within a given query interval. In the genome browser case, we use it to determine the
features contained within a viewing region. On the other hand, Patricia tries data structures are
used to store gene names and other text navigable labels and then index them on the server.
JBrowse implements a strategy where the server divides large data sets into small regional chunks
which helps provide quicker downloads.
There are two types of basic tracks in JBrowse: ‘feature’ tracks (for discrete features with start
and end points), and ‘image’ tracks (for quantitative (wiggle) tracks) that are rendered as image files
displayed along the genome. JBrowse is modular and it can be embedded in other web-applications
like a wiki or a blog. It works on most modern browsers like Firefox (version 2 or later), Safari
(version 3 or later), or Internet Explorer (version 6 or later) [Skinner et al., 2009].
2.4.2.2.3 Functionality and Features
Visualization
JBrowse is also a track-oriented browser, where features are drawn inside tracks and the layout of
tracks under a reference sequence coordinate is the same as many genome browsers layout. However,
the technologies used to render the features are different. JBrowse uses HTML5 canvas to represent
features and a number of feature classes built into JBrowse using HTML CSS. JBrowse displays data
46

at various scales (from chromosome levels to base paris levels) which can be changed by zooming
in/out, this being called semantic zooming [Skinner et al., 2009].
Supported Data Files and Sources
JBrowse’s data can be drawn from flat files. The supported file formats are FASTA (for sequence
files), GFF , BED files (for simple discrete feature tracks), GFF3 files (for compound feature tracks),
WIG files (for quantitative per-base annotation tracks), BAM binary files (for alignment features).
Alternatively, data can be imported from a BioPerl database (Bio::DB, Bio::DasI, etc) or others like
Chado database. JBrowse also comes with a script that automatically downloads track data from
the UCSC human genome database and uses it to initialize a JBrowse instance. It can also display
data from a SPARQL endpoint, MAKER results and BioSQL [Skinner et al., 2009, Westesson et al.,
2012, Skinner and Holmes, 2010].
Navigation
JBrowse supports the basic navigation capabilities provided in GBrowse but much smoother (no
page reload) due to the client-side rendering and the AJAX technology. The user can navigate
by dragging the display left and right, up or down or by clicking the navigation arrow buttons.
Figure 26-(G) shows how to move the view left or right, ‘+’ and ‘−’ buttons, Figure 26-(H) shows
how to zoom in and out, or use the text box, Figure 26-(J) shows how to navigate directly to a
region or feature by typing the exact coordinate or the name of the feature into the search box
[Westesson et al., 2012].
Customization
Flexible configuration files (styled after the GBrowse configuration file, but using the JSON format)
allow the database administrator to customize the tracks and their behaviour and other aspects like
glyphs and feature-click actions. As for end-users, they can customize the display as follows: reorder
tracks, hide/show tracks, pin some tracks to the top of the display, add their own tracks and change
tracks visualization attribute (like glyph shape, color), and change the layout options of some types
of tracks. A list of several track manipulation controls are available in a menu by the track name
Figure 27.
47

Figure 27: Track Configuration in JBrowse, shows a list of various track configuration and manipulation
options Source: JBrowse demonstration at http: // jbrowse. org
The user can also highlight a region of interest (Figure 26-(K)) for further investigation and the
state of the browser can be preserved by the use of HTTP cookies. The navigation state, track
selection and ordering are saved for future investigation.
A new kind of track named “a combination track” was introduced in (version 1.10.0). This track
is used to combine data from multiple other tracks using range, arithmetic, or masking operations.
For example, a BigWig track can be masked to highlight only regions that lie within features from a
BAM track or the intersection of two or more feature tracks. Creating a combination track is done
by selecting ‘File—>Add combination track’ from the menu bar (Figure 28), then adding tracks to
the new combination track by dragging them into it [Skinner et al., 2009, Westesson et al., 2012,
Skinner and Holmes, 2010].
48

(a) Add Combination Track Option
(b) Combination Track Dialog
Figure 28: Creating a Combination Track in JBrowse, (a) shows the list containing the add combination
track option to add combination tracks to JBrowse, (b) shows the dialog presented to the user to create
a combination track and the various options used for combining the two selected tracks. Source: JBrowse
demonstration at http: // jbrowse. org
Third-party Annotations
JBrowse allows the end user to add their own annotation files to display as a track under the same
coordinate sequence aligned with other tracks. Those annotation files can be of any of the supported
49

file formats [Skinner et al., 2009]. This was previously demonstrated in Section 2.1, Figure 10.
Searching Capabilities
JBrowse allows searching for features by entering a part of the feature’s name into the navigation
text box which will display a list of available features matching the entered part. The user then
selects one to be displayed. This creates a navigation effect to view the desired feature into the
viewing area. This is done by feature name indexing of the entire available feature names using
Patricia trie or radix trie [Skinner et al., 2009]. This was previously demonstrated in Section 2.1,
Figure 12.
Sharing Annotations
JBrowse users can share the entire view of the JBrowse by clicking on the share button (Figure 26-
(L)), which will bring an assembled URL for the user to copy and send to other users [Skinner et al.,
2009]. This was previously demonstrated in Section 2.1, Figure 14.
Data Retrieval
Since 1.7.0 release of November, 2012, genomic data can be downloaded to the client machine by
exporting and saving sequence and annotation data in FASTA, GFF3, bed, bedGraph, and Wiggle
formats. This is done by turning on the desired track and clicking on its track label to bring up a
new menu of the tasks you can perform with that track, one of which is ‘Save track data’ [Skinner
et al., 2009]. This was previously demonstrated in Section 2.1, Figure 16.
2.4.2.2.4 Non-Functional Requirements
JBrowse focuses on the following non-functional requirements:
• Fast response, interactivity: demonstrated in the use of new web technologies like AJAX to
aid the continuity of user attention.
• Modularity: JBrowse implements the Model-View-Controller design paradigm: the users ac-
tions in the View (browser) prompt the Controller (Javascript on the client and Perl on the
server) to interact with the Model (MySQL database tables on the server) to accomplish
specific tasks.
• Interoperability: JBrowse is interoperable with various GMODs tools.
• Extensibility: JBrowse can be extended to view more data types and more glyphs.
• Portability: JBrowse is portable to many web browsers including Mozilla Firefox (10 and
later), Google Chrome (17 and later), Apple Safari (5 and later, 6 required for BAM, Big-
Wig, VCF+Tabix), Microsoft Internet Explorer (9 and later, 10 required for BAM, BigWig,
50

VCF+Tabix).
2.4.2.3 Dalliance
Dalliance is a new genome browser that is written in JavaScript and uses new technologies like DAS
and SVG. It is still under development by Thomas Down, Matias Piipari and Tim Hubbard. Its
first public version 0.4.0 was released in August, 2010 and its latest version at the time of writing
this document (V 0.13) was released in February, 2015 and it is being updated every few months.
It can be easily embedded in web pages and applications and it integrates data from a wide variety
of sources, including popular genomics file formats like bigWig, BAM, and VCF. Dalliance can be
built using only a standard web server and a directory of files, with no databases or server-side
support code. The official website of this tool is (http://www.biodalliance.org/index.html). ).
There are three public sites known to use Biodalliance: Mouse phenotyping consortium, OpenSNP,
and GenomeRNAi [Down et al., 2011].
2.4.2.3.1 User Interface
The main interface of Dalliance is the genome browser page with the tracks aligned horizontally
along the Y-axis under the same genomic coordinate.
At the top of the browser, there is a toolbar on the right of the display (Figure 29-(C)) that is
used to add tracks, configure them, and export options (e.g. export an image of the current view
of the browser). Also there is some indicators of the current genomic location and a text box for
searching (Figure 29-(A)), a slider to control zoom levels (Figure 29-(B)), and also a left and right
panning control (Figure 29-(D)) located at the top left and right corners of the display. The rest of
the view should be a familiar genome display. After launching Dalliance, the user can add tracks
from the DAS registry or from local or remote files and start browsing and navigating to interesting
regions of the genome.
2.4.2.3.2 Implementation
Dalliance is implemented in JavaScript and it uses recent extensions to web standards “HTML5” to
offer a higher level of interactivity than most previous genome viewers. It uses SVG to represent the
genomic features, which offers more interactive rich graphics that is easily exported as SVG graphics
and pdf. It uses the standard DAS distributed annotation system protocol to add sequences,
features, and alignments from servers around the network and support all the glyph types from
the DAS stylesheet specification. The source code is freely available and written to be a self-
contained Javascript. It is possible to change several aspects of the view and the configurations
using JavaScript and it can also be extended and customized using the plugin API. In Dalliance,
each ‘track’ is fetched using a separate and usually concurrent network request, and is displayed as
51

Figure 29: Screenshot of Dalliance, illustrating (A) The locator section which displays the exact coordinate
of the viewed region, (B) The zoom slider used to zoom in/out, (C) The tool bar , (D) The panning controls
to pan left or right, (E) The genome view containing the tracks, and (F) The name of a track.
soon as the data arrives, therefore one slow data source does not hold up the display of the rest of
the data. It works on Mozilla Firefox (3.6 or later), Safari (5.0 or later) and Google Chrome (5.0
or later) but not Microsoft Internet Explorer, which does not currently include SVG support, but
it is promised for version 9 [Down et al., 2011].
2.4.2.3.3 Functionality and Features
Visualization
Dalliance is a track-oriented genome viewer, like most genome browsers (e.g. Ensembl, UCSC,
or GBrowse). Therefore, it displays the sequence and annotation tracks along the Y-axis under
the same genomic coordinate which is treated as the X-axis and the features are represented as
glyphs inside these tracks. Furthermore, Dalliance uses new technologies like SVG (scalable vector
graphics) model for integrating data, which improves the genome browser interactivity and pro-
vides some high-quality graphics. Dalliance also includes a full implementation of the glyph types
of DAS style sheet systems, which controls how the data appears to the end user [Down et al., 2011].
52

Supported Data Files and Sources
Dalliance was built mainly to display genomic data (e.g. sequences, features, and alignments)
from servers around the network using the standard DAS distributed annotation system protocol,
which means that it doesn’t need a server-side database to function. Nowadays, it also supports
some flat file sources and the following types of file formats: bigBed, bigWig, BAM, .2bit , VCF,
BED and WIG. Data can be fetched from the Ensembl-REST API (since version 0.9) and also from
JBrowse-REST API [Down et al., 2011].
Navigation
Users can navigate in multiple ways in Dalliance. The simplest way is by dragging the display left
or right or by using the pan left and right buttons on the user interface (Figure 29-(D)). While the
zoom in/out can be done by dragging the tab of the zoom slider (Figure 29-(B)), at the highest
zoom level the user can see the actual sequence of the genome. While zooming in and out, any
feature directly underneath the blue guideline remains centred and double-clicking on any feature
can center it.
In some tracks, the user can navigate between features. This is called “leaping”. Leaping is
activated by clicking the ‘left’ and ‘right’ buttons on the toolbar. For tracks containing simple
features (like genes, peak calls, etc), leaping will take you to the next feature in the selected
direction. Quantitative tracks support a variant of leaping where you can select a threshold, and
leap to the next region containing scores greater than the selected threshold. If this is available, a
red line is seen, indicating the threshold that can be adjusted in the track editor [Down, 2014].
Customization
The user can customize the display of Dalliance in several ways: General customization of the
genome view, such as changing tracks order, adding/deleting tracks, changing the location of the
blue vertical guideline; Track specific customization, such as changing several attributes — depend-
ing on the track type — like their height, name, max and min values. This is done by selecting
a track then clicking the track button to open the track editor from the tool bar (Figure 29-(C)).
Currently, quantitative tracks are the easiest to customize [Down et al., 2011].
Third-party Annotations
Dalliance’s main way of adding third party tracks is by using DAS, which is straight forward since
Dalliance is a DAS client and can access DAS registry. Therefore, anyone can add their own data
by running a DAS server and hosting data on that server to be added to Dalliance. Another way
of adding data to Dalliance is by uploading indexed binary data in a supported format hosted on
an accessible server or located on the user machine. Integrating data from certain types of indexed
53

binary file directly, is considered the easiest way of adding user data to Dalliance, since it can be
viewed directly from the disk with no server requirements needed [Down, 2014].
Figure 30: Adding Tracks in Dalliance, with several options of adding tracks. From DAS registry, binary
files, and several others.
Searching Capabilities
Dalliance implements simple searching mechanism to navigate directly to specific coordinates, or
to search for a named feature. This can be done by typing in the location box in the toolbar
(Figure 29-(A)). If a named feature can be found in any searchable active track, it will be displayed
and highlighted in the browser [Down et al., 2011].
Sharing Annotations
Not supported for now.
Data Retrieval
Not supported for now.
2.4.2.3.4 Non-Functional Requirements
Dalliance focuses on the following requirement:
• Fast response and interactivity, as it uses SVG and HTML5 technology to offer a faster and
more interactive genome browsing experience to aid the continuity of user attention.
• Portability: Dalliance is a self-contained Javascript object which can be inserted into almost
any web page and can work on any web browser that support HTML5 technology.
54

2.4.2.4 Savant
Savant is short for the Sequence Annotation, Visualization and ANalysis Tool, which is a desktop
visualization and analysis browser for genomic data. It is an open source software supported by a
large and growing community and it was designed to be extensible through a rich plugin framework.
The Savant platform was written by Marc Fiume, James Vlasblom, Eric Smith, Andrew Brook,
Vanessa Williams, Orion Buske, Misko Dzamba, and Michael Brudno of the Computational Biology
Lab at the University of Toronto. The first version of Savant was released on 2010 and the latest one,
V 2.0.4, was released on November, 2013, is still under active development and is being updated
every couple of months or more and extended with new plugins. The official site of this tool is
http://genomesavant.com/p/home/index.
2.4.2.4.1 User Interface
Savant has a simple interface which can be seen in Figure 31.
Figure 31: Screenshot of Savant. (A) and (B) Range controls, (A ) text fields for fine navigation; (B)
Selection, zoom and pan controls for coarse navigation. (C) The cytogenetic representation of the current
chromosome. (D) Tracks, these ones represent the data in current range. (E) Bookmarks module. (F) Table
View module.
As it can be seen from the screenshot, Savant follows the basic layout of a standard genome
browser with the navigation controls (Figure 31-(A) and (B)) on the top of the screen, the basic
55

buttons of zooming and panning and a text field that shows the exact sequence coordinate, and
undo/redo buttons to go back to a previous position or to redo the navigation and return to the
new position or scale.
Savant uses a cytogenetic representation (Figure 31-(C)) of the current chromosome, which
is based on a distinctive pattern of bands created when chromosomes are stained with certain
chemicals. This is used for navigation and as an overview of the sequence with the current viewed
region on the chromosome (shown in blue rectangles). Figure 31-(D) shows the tracks representing
the data shown in the current region.
There are two shown modules: (i) the bookmarking module in Figure 31-(E), which is located
on the right side of the interface and used to save the current region for later reference; (ii) The
table view module in Figure 31-(F), which represents the underlying textual data of the tracks in
a table format. Savant also provides another module called the variation module, which can be
opened by clicking the “Variation tab” at the right side of the user interface. This last module
provides a variety of ways of exploring variation data.
When the user first launches Savant, he/she will be presented with the start screen, which shows
a list of recent projects and a feed of news stories from the Savant web-site, then, the first thing
the user should do is ‘choose File > Load Genome’ to tell Savant what reference genome he/she
wants to work with. Then the user can add any number of annotation tracks, local or remote, by
choosing ‘File > Load Track’. After that he/she can navigate through the sequence and investigate
interesting regions [Fiume and Smith, 2012].
2.4.2.4.2 Implementation
Savant was written in Java, which makes it portable to many platforms including Windows, Mac
OSX and Linux. For optimum performance it should run on a computer with at least 2GB of RAM
and internet connection. Savant was designed under the Model-View-Controller software engineering
paradigm and it was also designed to be extensible via a rich plugin framework, allowing developers
to add extra functionality to the software. Furthermore, most of Savant analytical functionality
are implemented through plug-in and its API provides visualization, analytical, navigation and
datasource functionality to plug-in development.
Savant was also designed to be fast, therefore some text files containing genomic annotation
are formatted and this formatting involves converting text records into an indexed binary data
structure specific to each data type. Sequence and continuous tracks are stored as fixed-width
records, enabling direct lookup of records of interest. Annotation ranges (such as genes) are stored
using a binning scheme similar to the one used in the UCSC Browser [Fiume, 2010].
2.4.2.4.3 Functionality and Features
56
Visualization
Savant offers the same horizontal layout as most of the genome browsers but it has several extra
features related to visualization of the data. It shows both nucleotide and genome-scale visualization
of tracks. It even offers several display modes for specific track types, which helps emphasize different
aspects of the data. For example, interval annotations can be squished together on a single line or
packed neatly so that none overlap (mimicking the squish and pack modes of the UCSC browser).
The variant and strand modes for read alignments, for instance, use colors to emphasize mismatches
in reads and the strands to which reads are mapped, respectively. There is a “Variation module”
which groups together four different ways of viewing aggregated variant data. The visualization
on the Variation module comprises data from all currently-open variant tracks and it has its own
visible range, which is distinct from the visible range of the main track display area. The variation
module also has its own Zoom In and Zoom Out buttons to alter its visible range.
Supported Data Files and Sources
Savant works with local files and supports a number of common text-based file formats includ-
ing sequence (FASTA), the common standards for read alignment (SAM/BAM), genetic variants
(VCF), interval (BED, GFF, Tabix) and continuous-valued (WIG, BigWig, TDF) data and any
tab-delimited text file containing positional annotations. Savant automatically formats, indexes
and compresses all these data types to provide fast random access.
In addition Savant also supports the use of remote (through the internet) files and data sources.
Those remote resources are cached locally, to enable rapid visualization upon re-loading of a previ-
ously visited region. Tracks can also be quickly loaded directly from the UCSC Genome Database,
by using the plugin framework and without a need for manual download [Fiume et al., 2012].
Navigation
There are several ways to navigate in Savant:
• Course navigation: by using the selection panel whose horizontal length represents the length
of the genome. It is a cytogenetic representation of the current chromosome, which can be
used to choose subranges using the mouse.
• Fine navigation: by entering the desired range or feature ID into the location field (e.g textual
search of features name), and also through bookmarks.
• Zooming in/out and panning left and right by buttons, Mouse or keyboard [Fiume et al.,
2012].
Customization
Savant users can configure the interface in several ways due to some of Savant embedded design
57

features. One of those features is that Savant uses a modular docking framework, like the one used
in most Integrated Development Environments (IDEs) such that each module within the application
appears as a separate window that can be shown, hidden, maximized, minimized, resized, closed
or rearranged in any configuration the user desires. Furthermore, each track is considered as a
separate module that can do all the above and it can also be detached from the main interface and
moved to a separate location, which can be helpful. It also has a Bookmarking functionality to save
favourite locations in the genome. The user can even Lock tracks and use them as overview tracks
[Fiume et al., 2010].
Third-party Annotations
Savant is a desktop application so it was basically designed to visualize the user annotations.
Therefore, it supported adding local or remote files such that their format is one of the supports
data formats mentioned earlier [Fiume et al., 2010].
Searching Capabilities
Savant can search for feature names using the location text field Figure 31-(A).
Sharing Annotations
In Savant, sharing capabilities are not implemented directly as part of the main implementation
but through the use of export options. For instance, user sessions can be saved for later use, or
exported for sharing among users (by using the bookmark module), ensuring that collaborators
have identical views of the same data. Savant also has an export option that saves the relevant
track information to an image file to use in presentations or publications [Fiume et al., 2010].
Data Retrieval
As previously mentioned, most of Savant’s analytical functionality comes with its wide range of
available plug-ins, so for example, in order to export data from Savant, we use a plug-in module
like the Data Table plug-in which is installed as part of Savant by default. The data being viewed
in the Data Table can be exported to a text file by clicking the Export button. The format of the
resulting text file depends on the type of the track being exported. Sequence tracks are exported as
Fasta files, BAM alignment tracks are exported as SAM files, and all other track types are simply
exported as tab-delimited text. Savant also provides a variety of ways of exploring and analyzing
variation data which is available in the variation module [Fiume and Smith, 2012].
2.4.2.4.4 Non-Functional Requirements
Savant was designed to be fast, interactive, accessible and extensible. As mentioned in [Fiume et al.,
2010],
58

“Savant feature set was guided by three key design principles: (i) Ease of use: users can easily
install the application, obtain and load data, and navigate to specific regions of interest. The
general layout of data mirrors the standard genome browsers to shorten the learning curve. (ii)
Speed and efficiency: the program quickly and dynamically sifts through very large datasets while
maintaining a reasonable memory footprint. (iii) Access and extensibility: the underlying data is
readily accessible from within the tool itself, and users can extend the application by adding any
number of plug-ins for specific tasks.”
2.4.3 Genome Browser Comparison
After briefly introducing the four investigated genome browsers, a comparison between those four
can be very helpful, to summarize the main differences between them, and is documented in the
form of a table.
As it can be noted from Table 3, both GBrowse and JBrowse are GMOD tools. GBrowse being the
most mature browser of the four and Dalliance being the most immature one. All of the first three
are web-based and Savant is a desktop application. It can be noted that those four browsers share a
large amount of similarities in their layout and user interface design and they are all track-oriented
browsers, such that each track represents a type of features located in the genome and it is aligned
horizontally with the other tracks under the same coordinate system which is the genome sequence.
There is also an obvious overlap both in terms of functionality and in types of accessible data,
shared functionality includes zooming, panning, searching, uploading of private tracks and a simple
interactive customization settings for the user display.
Regarding the needed requirements to download theses browsers, all four are platform indepen-
dent so they can be installed on most operating systems and the first three requires a server to
work properly and longer setup time than Savant (a desktop application). The first three web-
based browsers mainly differ in their implementations and in the set of technologies used to render
features and their tracks.
GBrowse has some great benefits over other genome browsers: it is a very mature genome
browser which has most of the features of a genome browser like track uploading, sharing and
configuration, semantic zooming and limited track panning. It also supports quantitative (e.g.
CG content) and qualitative (e.g. genes) tracks and next-generation sequencing (NGS) data by
supporting SAM and BAM sequence alignment files. GBrowse is very appropriate for collaborative
environments in which groups can display and share genome annotations in an accessible format.
It can be installed on public web sites, as well as the web sites of small-to-medium groups. Other
benefits are that it is open source,relays on available components, can easily be installed using
basic command line knowledge and works well with any web browser that supports HTML level
4.0 or higher and cascading style-sheets level 2 or higher. This includes Netscape 4.0 and higher,
59

Internet Explorer 5.0 and higher, and many other popular browsers such as Opera and Mozilla.
GBrowse is easily portable, configurable and extensible with plug-ins. It also integrates easily with
other components of GMOD and since version 2.0, GBrowse uses AJAX to improve the original
user interface. GBrowse 2.0 can dynamically load, reorder, and update browser tracks without
triggering a full page reload and uses a “rubber band” interface to select and zoom into a region of
interest faster [Stein et al., 2002, Stein, 2013, Skinner et al., 2009].
On the other hand, it has some drawbacks related to the use of CGI, which imposes a page-based
model (a static model) of viewing the data such that every action will trigger a reload of the entire
genome browser page. This means that the user will have to wait after every action for the genome
browser to reload. GBrowse uses server-side rendering and this means that the server is responsible
of all the computational costs of rendering a genomic region. The client in GBrowse just passively
display a rendered image of the genomic region. This server-side rendering costs will become worse
with the increase of the number of users and the amount of genomic data viewed. As a result,
GBrowse does not support smooth zooming and panning [Stein et al., 2002, Stein, 2013, Skinner
et al., 2009].
JBrowse uses AJAX and client-side rendering where the client does all the work usually done
by the server such that it is responsible of determining and then rendering the features located in a
region of interest using standard HTML and JavaScript functionality. JBrowse provides smoother
zooming and panning than its predecessor GBrowse and works on almost all modern web browsers.
JBrowse can also integrate with the GMOD suite of tools [Skinner et al., 2009].
Despite the benefits of this approach, it has the following drawbacks: the main one being that the
environments for server-side web applications are far more mature and reliable than those for client-
side applications. Since client-side applications cannot be properly tested and since the quality of
the visualization depends largely on the capabilities of client web browser and hardware, this will
properly impose some unpredicted limitations on JBrowse that cannot be measured. However, the
limits can be any of the following: slower animations, longer download waits, and garbage collection
pause times [Skinner et al., 2009, Westesson et al., 2012].
Dalliance on the other hand, follow the DAS model which means that users can show their own
data without hosting copies of the data. It also uses SVG which gives a rich graphics platform with
smooth zooming and panning. In Dalliance, each track is fetched using a separate and concurrent
network request. So one slow data source does not affect the display of others. Dalliance is still
under development and it is still missing some important features like sharing and retrieving data
[Down et al., 2011].
60

Table
3:
Gen
ome
Bro
wse
rC
omp
aris
on
Nam
eG
Bro
wse
JB
row
seD
allia
nce
Savant
Typ
ew
eb-b
ase
dw
eb-b
ase
dw
eb-b
ase
dst
an
dalo
ne
pro
gra
m
Wri
tten
inP
erl
Clien
tin
JavaS
crip
t+se
rver
inP
erl
JavaS
crip
tJava
Dev
elop
edB
y/d
ate
GM
OD
,2001
GM
OD
,2008
Th
om
as
Dow
n,
2010
Un
iver
sity
of
Toro
nto
,2010
Use
dlib
rari
esB
ioP
erl
Clien
tth
eD
ojo
lib
rary
,S
erver
the
Bio
Per
llib
rary
N/A
∗N
/A
∗
Sta
tus
matu
re.
un
der
dev
elop
men
t.u
nd
erd
evel
op
men
t.u
nd
erd
evel
op
men
t.
Vis
ualiza
tion
tech
nolo
-
gie
s
Gly
ph
s,B
itm
ap
images
.H
TM
Lel
emen
ts(f
or
sim
ple
fea-
ture
s),T
iled
images
(for
qu
anti
ta-
tive
data
).
SV
G.
N/A
∗
Ren
der
ing
typ
eS
erver
-sid
e.C
lien
t-si
de.
Clien
t-si
de.
Clien
t-si
de.
Navig
ati
on
Sin
ceG
Bro
wse
2.0
,Map
-lik
e
Bro
wsi
ng
wit
hin
alim
ited
regio
n.
Map
-lik
eb
row
sin
galo
ng
wh
ole
gen
om
e
Map
-lik
eb
row
sin
galo
ng
wh
ole
gen
om
e
Map
-lik
eb
row
sin
galo
ng
wh
ole
gen
om
e
Inp
ut
file
form
at
•FA
ST
A.
•B
ED
.
•G
FF
.
•G
FF
3.
•W
iggle
(WIG
).
•S
AM
.
•B
AM
.
•F
FF
.
•FA
ST
A.
•B
ED
.
•G
TF
.
•G
FF
3.
•W
iggle
(WIG
).
•B
igW
ig.
•S
AM
.
•B
AM
.
•V
CF
(wit
hta
bix
).
•B
ED
.
•W
iggle
(WIG
).
•B
igW
ig.
•b
igC
hain
.
•B
AM
.
•V
CF
.
•FA
ST
A.
•B
ED
.
•G
TF
.
•G
FF
.
•G
FF
3.
•W
iggle
(WIG
).
•B
igW
ig.
•B
edG
rap
h.
•S
AM
.
•B
AM
.
•V
CF
.
•T
ab
ix.
•T
DF
.
Ref
eren
ces
http://gmod.org/wiki/GBrowse-
[Ste
inet
al.,
2002,
Ste
in,
2013]
http://jbrowse.org-
[Skin
ner
etal.
,2009,
Wes
tess
on
etal.,
2012]
http://www.biodalliance.org/
index.html
-[D
ow
net
al.,
2011]
http://genomesavant.com/p/home/
index
-[F
ium
eet
al.,
2010,
2012]
∗ N/A
=N
otA
vail
able
61

Savant is different in the sense that it is a desktop application that it is not constrained by the
user web browser environment and the server-client architecture and that can take full advantage
of the users operating system in such a way that makes the application much more interactive and
responsive than usual web-based genome browsers which suffers from limitations imposed by the
web environment. So, once the data are loaded into Savant, there is no need to ask a server for more
information to zoom or pan, therefore there is no network related latency and it does not require
uploading the data to websites in order to view them. Notable shortcomings of Savant include the
need to download annotation files as well as the user’s responsibility to keep annotations up-to-date
[McKay and Cain, 2009, Pabinger et al., 2013].
In this thesis we focus on web-based genome browsers since genomic data is mainly accessible
through the web. Therefore, web-based genome browsers facilitate data investigation in the con-
text of readily available annotations and data tracks. Web-based genome browsers are accessible
and support collaboration within or between different research groups or communities. Web-based
genome browsers provide a valuable service to the research community by providing tools for inves-
tigating genomic data and supporting the complex and robust informatics infrastructure required
to make the data accessible. Most important is their main objective, which is the visualization of
genomic data that gives researchers the benefit of looking at information in a more natural and in-
terpretable way compared with other textual representations of the data [Fiume et al., 2010, McKay
and Cain, 2009, Pabinger et al., 2013].
2.5 Technologies used in Genome Browsers
Web-based genome browsers are implemented using a server-client architecture, using the HTTP
protocol to send client requests and receive server responses. Therefore, they can take advantage
of new web advances and technologies. In this section, we discuss several web related technologies
that are used in genome browser implementations.
2.5.1 Server-side Rendering and Client-side Rendering
We have established so far that one of the key genome browser functions is rendering visual represen-
tations of the genomic data inside tracks. The rendering process can happen either in the server-side
or the client-side. Traditional genome browsers (e.g. GBrowse, UCSC genome browser and En-
sembl genome browser) use the first approach, while modern next-generation genome browsers uses
the second approach (e.g. JBrowse and Dalliance). This section will discuss the main differences
between the two approaches and both their advantages and disadvantages:
62

Server-side Rendering
In server-side rendering, the server generally does most of the work involved in showing genomic
data to users. A genome browser using this type of rendering can typically be described as a
program running on the server, which queries a database for genomic data in the region viewed by
the user, and then renders a static pictorial representation of that region, which the web browser
(the client) passively displays.
The main drawback of this approach is that the server suffers the majority of the computational
expense, which increases with the number of users and with the amount of genomic data. As that
computational expense increases, so does the amount of time the user has to wait for each new
page, which will negatively affect the interactivity of the system [Skinner et al., 2009].
Client-side Rendering
In client-side rendering, the user’s web browser does most of the work. The client’s web browser
is responsible of arranging the browser’s display, which both minimizes the amount of client-server
communication and enables many viewers to view the same centralized data without overloading
the server.
The main drawback of this approach is that its performance is dependent on the capabilities of the
client machine and web browser. Those limitations may affect the scaling of the genome browser im-
pose slower animations, longer download waiting time, and garbage collection pause times [Skinner
et al., 2009].
2.5.2 Glyphs
Glyphs are visual representations of individual features which are drawn inside tracks such that
each track contains a collection of features of the same type. Glyphs can be drawn using different
technologies: it can be drawn in the server side using graphical libraries (e.g. Bio::Graphics used
in GBrowse), or it can be drawn using web graphics technologies like Canvas and SVG which is
discussed below.
For more visual details and examples of some existing glyphs refer to table Table 31 found in
Appendix C.
2.5.2.1 SVG
Scalable Vector Graphics (SVG) is a declarative, vector based graphical language for describing two-
dimensional graphics in XML. It is used to describe geometrical primitives via DOM elements. It
was developed by the World Wide Web Consortium (W3C) since 1999 so it is much older technology
than canvas. SVG images and their behaviour are defined in XML text files. This means that every
63

element is within the SVG DOM so they can be searched, indexed, scripted, and compressed. SVG
images can be created and edited with any text editor, but are more often created with drawing
software. They are used by some genome browsers (e.g Dalliance) to render the display of the
genome view [Erik Dahlstrom and Watt, 2011].
Figure 32: SVG example
2.5.2.2 Canvas
The Canvas is an HTML5 element <canvas>, that is used to draw 2D graphics and bitmap images
on the fly on a web page by scripting, usually using JavaScript. It is only a container for graphics
and a script is used to actually draw the graphics. Some genome browsers use the <canvas>
element to render some genomic features on the client web browser. It was originally introduced
by Apple in WebKit builds. Nowadays Internet Explorer 9+, Firefox, Opera, Chrome, and Safari
support the <canvas> element, but IE8 and earlier versions do not support the <canvas> element
[W3Schools, 2014a]. The main differences between SVG and Canvas is summarized in Table 4 found
in [W3Schools, 2014b].
Figure 33: Canvas example
64

Canvas SVG
Resolution dependent Resolution independent
No support for event handlers Support for event handlers
Poor text rendering capabilities Best suited for applications with large
rendering areas (Google Maps)
You can save the resulting image as
.png or .jpg
Slow rendering if complex.
Well suited for graphic-intensive games Not suited for game applications
Table 4: Canvas and SVG Comparison
2.5.3 Page-based Loading and AJAX-based Loading
Page-based Loading
The page-based model of viewing data over the web is one of the oldest methods used in Web 1.0,
which basically view the data in static web pages. This means that the client’s send requests and the
server’s responses are static web pages. Most current web-based genome browsers are implemented
using the Common Gateway Interface (CGI) protocol (e.g. GBrowse), which provides a mechanism
for a web server to generate a web page to send to the user which imposes a page-based model of
user interaction. This approach can disrupt the user attention with each navigation or interaction
event [Westesson et al., 2012].
AJAX-based Loading
AJAX (Asynchronous JavaScript and XML) is a collection of techniques that shift the overhead from
the server to the client and enables users to interact with web applications without the overhead
of waiting for server response, since the communication with the server happens asynchronously in
the background. Those techniques are client-side scripting (using JavaScript and related HTML
technologies) and structured data representations (using data formats like XML and JSON).
Therefore, using AJAX in web-based genome browsers creates smooth panning and zooming transi-
tions which can help keep the user oriented and focused on exploring and investigating the genomic
data. JBrowse is one example of AJAX-based genome browsers [Skinner et al., 2009].
2.5.4 DAS
The Distributed Annotation System (DAS) is a widely adopted network protocol for exchanging
biological data. DAS is a simple client-server network protocol that was developed by WormBase
65

for sharing genome annotations, and was adopted by several projects after that including genome
browsers. It is mainly used to share annotations of genomes and protein sequences and to dy-
namically integrate a wide range of biological data from geographically diverse sources. The key
motivation for heving DAS protocol is data integration, therefore its basic functionality is to define
how data should be represented and communicated. It has a “dumb server, clever client” architec-
ture: the DAS server may host a number of sources, each differing in the services provided and the
type of underlying data; the DAS client issues an HTTP request of a specific URL format, called
(a DAS command ) used to ask for a class of data like a sequence or annotations; the server re-
sponds with an XML document representing the requested data. Furthermore, due to the growth of
the publicly available DAS sources, a discovery mechanism was implemented called DAS Registry.
This service allows data providers to publish their DAS sources to allow their automatic discovery
by DAS clients. Most genome browsers today support the DAS protocol including Dalliance and
GBrowse, which makes integration of data simpler than hosting their own data [Prlic et al., 2007,
Jenkinson et al., 2008].
2.5.5 Semantic Zooming
Semantic zooming means representing the data differently at different zoom levels in order to ease
user interpretation, a feature that is implemented in most genome browsers. For example, in
GBrowse the gene glyph shows the internal intron/exon structure at high magnification. But, at
low magnification, it is rendered as a solid arrow pointing in the direction of transcription and the
‘dna’ glyph shows the literal DNA sequence at very high levels of magnification and the GC content
histogram at lower levels [Stein et al., 2002].
2.5.6 Other
Other technologies or utilities are “Track Hubs” which are used in UCSC genome browser. Track
hubs are web-accessible directories of genomic data that can be viewed on the UCSC genome browser
as defined on the UCSC website http://genome.ucsc.edu/goldenpath/help/hgTrackHubHelp.
html. They are very useful for visualizing a large number of genome-wide data sets.
2.6 Genome Browser Challenges
The first human genome was a 3 billion dollar project that spanned a decade, to complete in
2003. With the introduction of next-generation sequencing technologies (e.g Illumina, ABI and
Roche 454), we are able to sequence and analyze an entire genome in a few hours for less than a
66

thousand dollars [Costa, 2012]. This revolution in DNA sequencing technology has made sequencing
genomes faster and cheaper than ever (compared to the previous ‘Sanger sequencing method’),
Figure 34 showing the decrease in the cost of sequencing. All this will result in the production of
massive amounts of genomic data that will continue to grow and present unpredictable challenges
in bioinformatics.
Figure 34: Sequencing Costs per Genome, illustrating the decrease of sequencing costs per genome from
2001 to 2013. Source: NIH National Human Genome Research Institute.
According to [Marx, 2013], one of the world’s largest biology data repositories, “the European
Bioinformatics Institute” (EBI), part of the European Molecular Biology Laboratory, currently
stores 20 petabytes (1 petabyte is 1015 bytes) of data and back-ups about genes, proteins and small
molecules. Genomic data accounts for 2 peta-bytes of that, a number that more than doubles
every year as shown in Figure 35. Today, the limiting factor has shifted from data acquisition to
data analysis. Accordingly, there has been a change in the type of sequence data being generated.
Instead of the traditional relatively long reads produced by Sanger sequencing, a large amount of
short reads is now the output coming out of these new sequencing machines. These changes in data
quantity and format is providing a challenge for bioinformatics, which will affect how sequence data
is stored, managed and visualized [Batley and Edwards, 2009].
67

Figure 35: Data Explosion, illustrating data explosion around 2008. Source : EMBL-EBI.
The amount of information generated by these technologies compares to the enormous data
produced by astronomy and high-energy physics (petabytes in size= 1000 terabytes) [Batley and
Edwards, 2009]. This will result in both computational and representational challenges [Nielsen
et al., 2010].
Generally, everything related to genomic data, from data formats, data storage to data visualiza-
tion, is being redesigned and reformatted to accommodate the huge demands of ever more growing
genomic data [Baker, 2010].
Since every new sequencing platform relies on a different technology and uses different file
types to store their sequence data, this will result in wasting resources to make these different
file outputs compatible [Baker, 2010]. There are several new file formats that are being used to
store these read alignment data, including the Sequence Alignment Map (SAM), adopted for the
1,000 Genomes Project, as well as the Compact Alignment Format, CALF (http://www.phrap.
org/phredphrap/calf.pdf). Binary files are also used to aid the fast retrieval of data and reduce
memory requirements, such as BAM files (the binary version of SAM) [Nielsen et al., 2010].
As sequencing throughput increases and costs decrease, sequencing human genome has become
an attainable and has led to the initiation of genome projects such as the 1,000 Genomes project
(http://www.1000genomes.org/, with the goal of sequencing 1000 human genomes [Nielsen et al.,
2010].
There is a constant need to store all the data produced by these many genome projects. As
a result, cloud-computing emerged to deal with the storage of massive biological datasets. In
fact, cloud computing is the only current storage model that can provide the needed flexible scale
for next-generation DNA sequencing technologies, and that exceeds Moore’s Law (the doubling of
computer power every two years) [Costa, 2012]. Cloud computing allows scientists to rent both
storage and processing power virtually by accessing servers as per their needs, so that they do
68

not have to buy their own hardware and maintain it on site [Marx, 2013, Baker, 2010]. Several
genome databases from Ensembl, GenBank and preliminary data from the 1000 Genomes Project
are already accessible via clouds [Baker, 2010]. As an example, DNAnexus, a cloud-based genome
informatics and data management platform, has an innovative genome browser benefiting from
cloud computing [Baker, 2010].
Third-generation sequencing technologies are now on the horizon, which will possibly decrease
the cost and time of sequencing even more. They are promising longer reads, which will improve
data quality and make sequence assembly easier, but they will not solve the fundamental issue of
data overload that far exceeds conventional solutions [Baker, 2010].
Genome browsers are already an essential tool in bioinformatics, and will gain more importance
as more genomes and genomic data become available. However, the massive data produced by
next-generation sequencing technologies is affecting the efficiency of traditional genome browsers
[Medina et al., 2013].
There are many challenges that genome browsers face, that require the introduction of high
throughput technologies. With the advent of these new technologies, these challenges grow bigger
and more prominent than ever. They can be categorized into the following.
Data visualization challenges: The visual representation of any data can either hinder or help
the user to correctly interpret those data. Visualization approaches need to represent the
data in a coherent and concise way that makes the understanding and interpretation of data
easier [Pavlopoulos et al., 2013]. Therefore, one of the first challenges in designing genome
browsers is deciding on a comprehensible graphical representation of the underlying data.
This basically means, encoding the various genomic data into colours and shapes or transform
them into different scales like representing gene models, as shown in Figure 36, with lines for
introns and rectangles for exons [Nielsen et al., 2010].
Figure 36: Gene Model Representation, lines for introns and rectangles for exons. Source: MaizeGDB
Maze Genetics and Genomics Database. http: // www. maizegdb. org/
There are a number of issues that can make the visualization of sequence data a nontrivial
task. The fact that genomic data is produced by various sources and research groups, using
different techniques and tools, each with its own experimental errors, dictates the existence
69

of different data types that are increasing with the advancement of our knowledge. A lot of
the data produced by these various experimental methods are error-prone. Those technical
uncertainties and their resulting inconsistencies need to be somehow accounted for in their
visual representations. Another issue is related to the huge and growing size of biological data
(e.g. a single sequenced human genome is around 140 gigabytes in size), which makes some
of those data unavailable due to their prohibitive online storage requirements. In addition,
enabling real-time interaction with large-scale datasets is nontrivial. Also, biological data are
inherently complex, which is the result of many different types of experiments and studies that
produce various datasets, such as sequences, transcription data, variant data and alignment
data and many others. Researchers and scientists need to investigate this heterogeneous data
inside a single representation and this requires genome browsers to be able to present both
a high-level overview of the data and an interactive representation to the underling details
of data. Performing meaningful aggregation and summarization that highlight only the most
well-supported connections is a daunting challenge. All this makes the representation of
genomic data one of the main challenges of any genome browser [Wang et al., 2013a, Nielsen
et al., 2010, Marx, 2013].
Data management challenges: The simple facts that are stated above are also causing data
management challenges. A large number of genome projects that are producing various ge-
nomic datasets are creating different data formats to store them. This is causing a challenge
on how to integrate those different data types stored in different formats. Also there is still
so much to know about genomic data, that can be mapped to the genome sequence, so we are
left with this open-ended problem that presents some serious challenges in the bioinformatics
community. As a result, the bioinformatics community has designed a multitude of databases
ranging from simple flat files to sophisticated relational databases and will continue to design
more to accommodate the expanding data. Consequently, genomic data used in a genome
browser can be obtained from various sources and in various formats, such as text files (e.g
GFF, GTF, BED,SAM) and binary files (e.g BigBed, BigWig, BAM). Both the sources and
the formats are continuously changing, which poses a real problem on genome browsers being
able to manage those various data types and formats and aggregate them into a unified display
[Wang et al., 2013a, Gollery, 2011].
Data transmission challenges: Most genome browsers, like GBrowse, UCSC and Ensembl, re-
quire the user to upload their custom data to their servers to be able to visualize them in
the context of available data [Mader et al., 2014]. Still, the definition of appropriate data
exchange formats is largely unresolved. This makes the fast and safe transmission of sequence
related data more challenging as their sizes continue to grow, which puts high demands on the
70

server capacity and network bandwidth [Wang et al., 2013a]. Possible solutions presented by
[Wang et al., 2013a], includes the implementation of high-speed network facilities, powerful
servers. Placing both the genome browser and the bioinformatics application platform on a
cloud environment and allowing them to share the same storage could be a possible solution
to avoid heavy data transmission. Cloud solutions is also presenting data transmission chal-
lenges manifesting in the transmission of data between the cloud and the researcher [Baker,
2010].
Data security and privacy challenges: The current requirement to transmit private data over
the web to be able to visualize them in the context of other data inside the genome browser
presents serious security and privacy threats. This is not an issue for standalone applications
because they do not need to transmit data over the web, since everything is located on the
users machine [Costa, 2012]. Possible solutions to this issue is the use of direct access of local
files presented by several genome browsers that do not require uploading files to the servers.
Other solutions presented by [Costa, 2012], include the use of better security systems with
advanced encryption algorithms, connecting forms that allow study participants or patients
to openly share the data generated on them and the use of local hardware solutions instead of
cloud computing which could also ease the implementation of big data with more information
protection [Costa, 2012]. Using cloud-based solutions means that valuable and private data
are being entrusted to a distant service provider who may be subject to power outages or
other disruptions [Marx, 2013].
Performance challenges: Developing genome browsers that achieve fast performance on common
desktop computers is also a challenge due to the size and complexity of genomic data. Next
generation web-based genome browsers benefit from advancements in web technology and
exploit the computational power of the user’s web browser. They tend to divide the work
between the server and the client, use indexed and compact data structures, and cache data
to provide faster user experience. While standalone genome browsers use multithreading,
innovative data structures, pre-loading the data to be visualized into the main memory in
order to accomplish better performance, still the rate of DNA sequencing technologies far
exceeded the current computational power [Lajugie and Bouhassira, 2011]. Genome browsers
are also moving to cluster servers, mirror implementations and cloud environments to achieve
better performance [Wang et al., 2013a]. The Ensembl Genome Browser presents an obvious
example of such solutions. “The main Ensembl site is based on hardware in the United
Kingdom, but when users in the United States and Japan had difficulty accessing the data
quickly, the EBI resolved the bottleneck by hosting mirror sites at three of the many remote
data centres that are part of Amazon Web Services Elastic Compute Cloud (EC2). Since
71

Amazon’s data centres are geographically closer to the users than the EBI base, it gives
researchers quicker access to the information they need” [Marx, 2013].
2.7 Discussion of Non-functional Requirements Issues
According to [ISO, 2011], “a product quality model categorizes system/software product quality
properties into eight characteristics: functional suitability, performance efficiency, compatibility,
usability, reliability, security, maintainability and portability (which are further subdivided into
sub-characteristics) that relate to static properties of software and dynamic properties of the com-
puter system”. The ISO/IEC 25010 document in general is useful for specifying requirements,
establishing measures, and performing quality evaluations. We used this document as a guideline
to the statements of the non-functional requirements in Chapter 3 — Section 3.4.4. Non-functional
requirements define the overall qualities or attributes of the resulting system. Existing genome
browsers support a combination of the following non-functional requirements: performance, exten-
sibility, interoperability, portability, usability and security.
We have collected the data on the non-functional requirements from studying the code and doc-
umentation of several existing implementations of genome browsers, including GBrowse, JBrowse,
Savant and Dalliance. We have further investigated several mailing lists of those genome browsers
to come up with the most important and wanted non-functional requirements of the user commu-
nity. Performance requirements mainly concern the speed of operation of a system, in our case the
system being a genome browser. Performance requirements have several types, including response
requirements — how quickly the genome browser reacts to a user input, throughput requirements —
how much the system can accomplish within a specified amount of time, availability requirements
— is the system available for service when requested by end-users?
Extensibility, according to [Suryanarayana et al., 2014],“is the ease with which a design fragment
can be enhanced or extended (without ripple effects) for supporting new functionality”. In genome
browsers, this requirement is an important one since genomic data types and formats are continu-
ously increasing and will require the need to extend the genome browser to accept and process new
data formats, add new visualizations (glyphs) and new tracks to view those data types.
Interoperability, according to [ISO, 2011], “is the degree to which two or more systems, products or
components can exchange information and use the information that has been exchanged”. Genome
browsers should be interoperable to work with other software. For example, The Gaggle Genome
Browser is interoperable. By connecting to the Gaggle framework the genome browser joins a suite
of interconnected bioinformatics tools for analysis and visualization with connectivity to major pub-
lic repositories of sequences, interactions and pathways.
72

Portability, according to [ISO, 2011], “is the degree of effectiveness and efficiency with which a sys-
tem, product or component can be transferred from one hardware, software or other operational or
usage environment to another”. Genome browsers today run on most popular platforms including
Linux, Windows and OS X. We do not document portability requirements.
Usability, according to [ISO, 2011], “is the degree to which a product or system can be used by
specified users to achieve specified goals with effectiveness, efficiency and satisfaction in a specified
context of use”. Most existing genome browsers’ user interfaces have a familiar look and feel, aimed
at easing the learning process. Unfortunately usability is one of the hardest requirements to quan-
tify. We do not attempt to record usability requirements.
Security, according to [ISO, 2011], “is the degree to which a product or system protects information
and data so that persons or other products or systems have the degree of data access appropriate
to their types and levels of authorization”. In genome browsers, users who want to view their own
data alongside the available genomic data are required to upload their data files to servers through
the web, which imposes security issues for sensitive and private data. Therefore, there has to be an
authentication or a restriction process to ensure that these data will not be shown to unauthorized
individuals. In this work, we did not document security requirements since they are orthogonal to
the genome browser core functionality.
We document both performance and extensibility requirements, since they are important aspects
of any genome browser. It is important to understand that this work is a first step to document the
requirements of a genome browser. We do not attempt to create solid or unchangeable requirements.
Our main concern being to establish a clear starting point to understand what a genome browser
is, depending on available research genome browser prototypes.
According to [Nielsen, 1993], response time guidelines for web-based applications are the same
for all other applications: 0.1 second for direct manipulation, 1 second for free navigation and 10
seconds to keep the user attention. We use these guidelines to determine the response times of a
genome browser bearing in mind the challenge of the huge size and complexity of genomic datasets.
The entire list of performance requirements was derived from testing the following genome
browsers: GBrowse, JBrowse, Dalliance, UCSC and Ensembl. Most of these browsers took 1 second
to execute general functions and at most 5 seconds loading data files. The UCSC [Rosenbloom et al.,
2015], which is one of the biggest repositories of sequence data, can host a 2 terabyte dataset that
belongs to a track named ‘100-way multiple alignment on hg19’. Some of the tested genome browsers
are able to serve at least 100 datasets to the users and handle 10,000 tracks without performance
loss as indicated by a GBrowse wiki page http://gmod.org/wiki/GBrowse_FAQ. Most of these
genome browsers can handle at least 10 concurrent users.
Generally speaking, genome browsers do not have actual limit on the size of datasets being used
or the number of tracks. They adapt and improve depending on the users’ needs and the existing
73

technologies. In the case of the number of concurrent users and response times, a lot of genome
browsers develop mirror sites for both better response times and larger bandwidth. Others use
server farms to distribute the work and expand the storage size.
Extensibility requirements are documented using the amount of working person days. We set 6
working days as a requirement to extend a data format or a visualization (glyph and track), and
we assume that the developer works from scratch and does not reuse any available code.
2.8 Z Notation
Z is a formal specification language used for describing and modelling computing systems. It is
based on the standard mathematical notation used in axiomatic set theory, lambda calculus, and
first-order predicate logic. Z describes what the system must do without saying how it is to be
done. The main ingredient in Z are ‘schemas’, which is used to represent software systems piece by
piece. In Z, schemas are used to describe both static and dynamic aspects of a system, the static
aspects include: the states it can occupy; the invariant relationships that are maintained as the
system moves from state to state. The dynamic aspects include: the operations that are possible;
the relationship between their inputs and outputs; the changes of state that happen [Spivey, 1992].
A schema consists of: a name, which identifies the schema; a declaration part, which introduces
local state variables; a predicate part, constraining the values of the variables.
A system specification in Z consists of some state variables, an initialization, and a set of operations
on the state variables. The state variables will also have some invariants associated with them
representing “healthiness conditions” which must always be satisfied.
Example: Here is an example of a Birthday Book system which records people’s birthdays men-
tioned in [Spivey, 1992]:
[NAME, DATE]
BirthdayBook
known : PNAME
birthday : NAME 7→ DATE
known = dom birthday
Every system has a special state in which it starts up. In Z this state is described by a schema
conventionally named Init
74

InitBirthdayBook
BirthdayBook
known = ∅
The first operation is to add a new birthday, and we describe it with a schema:
AddBirthday
∆BirthdayBook
name? : NAME
date? : DATE
name? /∈ known
birthday′ = birthday ∪ {name? 7→ date?}
The declaration ∆ BirthdayBook means a state change: it introduces four variables known, birthday,
known’ and birthday’. The first two are the state before the change, and the last two are the state
after the change. Each pair of variables is implicitly constrained to satisfy the invariant, so it must
hold both before and after the operation. Next come the declarations of the two inputs to the
operation. By convention, the names of inputs end in a question mark ‘?’. The part of the schema
below the line gives a pre-condition for the success of the operation. The name to be added must
not already be one of those known to the system. The second line says that the birthday function
is extended to map the new name to the given date. Another operation is to find the birthday of a
person known to the system.
FindBirthday
ΞBirthdayBook
name? : NAME
date! : DATE
name? ∈ known
date! = birthday(name?)
This operation schema illustrates two new notations. The declaration Ξ BirthdayBook indicates an
operation that does not change the state: the values known’ and birthday’ after the operation are
equal to their values known and birthday before the operation.
We used Z notation, a mature formal language that uses a graphical notation ‘schemas’, to
model a genome browser specifications and to describe what the system must do, which improves
its readability and encourages incremental development of specifications compared to other formal
75

languages, such as the Vienna Development Method (VDM) [Alagar and Periyasamy, 2011], which
involves the use of a number of specialized symbols that must be memorized, leading to a significant
learning curve. Z has what we need to represent a genome browser system, apart from the details of
any programming language paradigm such as Object-Z [Smith, 2000] which is an extension of the
Z formal specification language to accommodate object orientation. Z is also widely known, used
and understood, was standardized in 2002 and is now supported by a wide range of tools.
Z specifications can also be validated. We may reason about Z specifications using the proof
techniques of mathematical logic. This is a compelling property because if we reason about a
specification, and we attempt to construct proofs about its properties, then we are more likely to
detect problems at an early stage of system development. The process of constructing proofs can
help us understand the requirements upon a system and can assist us in identifying any hidden
assumptions. In addition, validation at the specification stage can make a significant contribution
to the quality of software. In Z, the validation process attempts to prove that the specification
is correct and consistent. It also ensures that its internal structure is sound and free from logical
defects. This is done by reasoning about the specification. Proving that the operations with their
pre-conditions and post-conditions do not contradict the state invariants is one consistency check.
It is referred to as proof obligations [Woodcock and Davies, 1996].
76

Chapter 3
Requirements Document
3.1 Introduction
The requirements document conforms to the IEEE Std 830-1998 Standard of a Software Require-
ment Specification. Generally speaking a genome browser is a visualization tool designed to view
genomes and their numerous annotations. It can show a graphical representation of specific regions
of the genome and its various functional elements. The basic principle of a genome browser is to
display various annotations inside a piled up list of tracks each containing a single type of feature or
annotation like genes, SNPs and the DNA sequence itself. Virtually anything that can be mapped
to a genomic coordinate can be viewed inside a genome browser. Using genome browsers, users can
analyze the different and various annotation data and infer their functions and importance [Wang
et al., 2013a]. These type of tools are becoming a big part of the daily routine of every genomic
researcher since the visualization of genomic data gives them the advantage of looking at the com-
plex genomic information in an easily interpretable way compared with their textual representation
[Fiume et al., 2010].
Today genome browsers face many challenges with the recent advances of biotechnology that is
producing a plethora of genomic data that needs to be visualized, integrated and investigated. The
growing increase in both the type of annotation produced by research communities and the type
of designed file formats and databases used to save them, is putting a lot of pressure on available
genome browsers to meet this open-ended problem of sequence data visualization. Having a clear
set of requirements for this tool can really help their development and advancement in various ways
to face the challenges that lie ahead, therefore this document is written to establish this ground
set of requirements for this tool. Here we are focusing on web-based genome browsers for several
reasons. First of all, genomic databases that serve genome and protein sequences and annotations
are available on the web. Secondly, they serve a much larger user community than standalone ap-
plications. Third, they support sharing and collaborative research environments. Finally, they do
77

not require the inconvenience of installing and maintaining the software and its data on the user’s
local computer.
3.1.1 Purpose
The present document serves many purposes: it can be used as a guide for future developers
of Genome Browsers, it can form the basis of future feature enhancements in existing genome
browsers and it can motivate the invention of new algorithms, data structures, or file formats
implementations. It is intended for use by bioinformatics developers and scientists.
3.1.2 Scope
This document is designed to establish a clear set of requirements for the widely used tool ‘genome
browser’, we focus on web-based genome browsers . We assume that the existing genome browsers
possess a complete set of adequate features, therefore we do not suggest new features or functions
of genome browsers. The scope of the requirements cover both the server and the client part of the
genome browser.
This Requirements Document discusses the basic functional and non-functional requirements
that any genome browser must have independent of the technology and the technical or imple-
mentation details. The requirements related to security, user authentication, search, user session
management and the addition of user defined datasets files is not part of the present specifications
and is outside the scope of this document.
3.1.3 Definitions, Acronyms, and Abbreviations
For organization purposes, the definitions are mentioned in the Appendix D.
3.1.4 References
The references used in this chapter are mentioned at the end of the document under the bibliography
section.
3.1.5 Overview
Section 3.2 (Overall Description) documents the general factors that may affect genome browsers
and their requirements. It does not necessarily state specific requirements. It only provides a
background for those requirements, which makes them easier to understand.
Section 3.3 (Domain Model) establishes the main concepts of a genome browser.
Section 3.4 (Specific Requirements) contains the functional and the non-functional requirements for
78

genome browsers, using use cases to describe the functional requirements.
Section 3.5 (Formal Specification of a Genome Browser) introduces a formal specification of genome
browsers in Z notion.
3.2 Overall Description
3.2.1 Product Perspective
Genome browsers are well known, useful and already existing class of tools in the bioinformatics
field. A genome browser is widely used by a growing community of geneticists in the form of
individuals or research groups around the world. The genome browser is normally open source and
it can be either a standalone desktop application or a web-based application, but we are going to
focus on the web-based ones for reasons mentioned earlier in this document, in Section 3.1.
Furthermore, a web-based genome browser is a web application that all users can access and use
by a web browser over a network. The web browser will be the main user interface through which
the user can access an instance of the genome browser software. This makes it accessible to a large
number of users and communities since they only need a web browser to access the application.
After installing the genome browser data and software on a server, other users can access the
application by their web browser via typing the URL address of the installed instance of the software
located on a server. The application’s main function is integrating genomic data taken from various
sources into a unified display of tracks with a common sequence coordinate.
The administrator of a genome browser installs a genome browser system on a server, adds
genomic datasets and creates tracks using the command line to run available code. The datasets
that are being visualized are stored in either local or remote database servers which can be relational
databases or flat file databases. Datasets can be viewed from DAS sources as well. Figure 37, shows
a block diagram illustrating the genome browser context and components.
79

Figure 37: Block Diagram of a Genome Browser, illustrating the basic components and context of a genome
browser
3.2.2 Product Functions
This section provide a summary of the major functions that a genome browser must perform The
functionalities of the product can be summarized under the following categories:
User sessions: The genome browser will create a session id to each user session to keep a reference
to that session. The genome browser will also provide a way to save those user sessions for
future use.
Configurations: The genome browser will provide flexible customization options to the adminis-
trator of a genome browser instance and to the end user sessions.
Navigation: The genome browser will support the following types of navigation over the genome:
browsing, panning, zooming, and scrolling so the user will be able to view the genome sequence
at different levels of details or resolutions from mega-bases to individual DNA bases.
Downloading: The genome browser will provide data downloading options for individual tracks
in several file formats and with different ranges. It will also provide saving capabilities of
the current view as images of different formats, a minimal list of those format includes PNG,
JPG, SVG and PDF for use in publications or presentations.
80

Data sources: The genome browsers will support and accept data from standard file formats used
by most sequence data, DAS sources, and common relational database schemas.
Track Management: The genome browser will provide several ways to manage tracks including
hide/show tracks, reorder tracks, upload user tracks, create combination tracks(track display-
ing several datasets).
Search: The genome browser will also allow users to search for features (by key word or ID search)
and navigate to them.
3.2.3 User Characteristics
There are two types of users that will interact with the genome browser tool:
The Scientist: who is using the genome browser on a regular basis to accomplish his genomic
data analysis and research. This user normally possesses biological knowledge and has some
knowledge about genome browser functionality.
The Administrator: who will download and install the genome browser software, create a working
instance of the genome browser and have the responsibility of maintaining it. This user
possesses basic to advance knowledge of computer systems so that he would be able to perform
the installation and configuration.
It is also important to mention all the stakeholders, which will include the two mentioned above,
for the system to be able to protect their interests when documenting the system requirements. A
list of stakeholders of this tool can be summarized in Table 5:
Stakeholder Description
Research Group A group of geneticists of small to medium size, working
on a shared topic of interest.
Research Community A large research group, sharing the same topic of re-
search and collaborating to achieve useful results.
Data Provider Single researchers or research groups or large community
that produce curated or experimental data.
Scientist A researcher who is interested in genetics.
Administrator A scientist or any individual or a team with basic to
advanced knowledge in computer science.
Table 5: Genome Browser Stakeholders
81

3.2.4 General Constraints
The genome browser software is constrained by the web browser since it is the main interface be-
tween the user and the genome browser application.
The Internet connection is also a constraint since the genome browser software mainly exists on a
web server that is accessed by the client’s web browser by a HTTP/HTTPS request to fetch data
from either a database or files on other servers over the Internet. It is crucial that there is an
Internet connection for the application to function at a suitable bandwidth.
A genome browser is a web application so it has to conform to the HTTP protocol and to the DAS
protocol.
The system shall be in compliance with all accessibility, web design, data exchange format, HTML
and security standards and policies applicable.
3.2.5 Assumptions and Dependencies
Minimum System Requirements:
Depending on some existing genome browsers we can present a list of the minimal requirements
needed to install and use a genome browser software:
Note: the list of minimum requirements were driven from existing genome browsers’ requirements.
The two modes (single user and multiple users) are mentioned because some individual users need
to view their own data and they are not part of a group.
Hardware:
• Client side: Unix, Windows, or Macintosh workstation on desktop or laptop computers with
an Internet connection.
• Server side: a minimum of 2 GHz processor, 8 GB of RAM and 200 GB of free disk space.
Software:
• Client side: a web browser with HTML 4.0 or higher.
• Server side: an HTTP web server.
It is assumed that those system requirements will be met in order for the genome browser to work
properly on the user’s system.
Application mode Assumptions:
We assume that the architecture design of the genome browser will follow either one of these modes:
1. Single user Standalone.
82

(a) This is a single-user, local server.
(b) The database will reside on the user’s workstation.
This mode is used for visualizing the genomic data of a single user.
2. Multiple users Network (client/server).
(a) The genome browser instance will be set up on the data provider server.
(b) The client user has a web browser to access the genome browser page.
(c) The database will reside on the data provider server.
This mode can be used by a research group or research community.
User Interface Assumptions:
We assume that the general layout of the genome browser main interface will conform to the com-
mon layout used by most genome browsers, which is a list of horizontal tracks containing features
that belongs to a genomic sequence and uses this sequence as the main coordinate system. The
page will have navigation controls used by most browsers like panning and zooming which the user
will use to navigate to regions of interest. A search box is also present in this interface to search
for features and navigate to them.
Existing Dependencies:
The technologies used to render the genome browser display will determine the version of the web
browser needed to meet the intended visualizations.
Depending on the type of monitor used by the client, the quality of the graphical items displayed
to the user will change.
The speed of accessing remote/centrally-stored data is inevitably limited by the bandwidth of remote
data servers.
3.3 Domain Model
Representing the vocabulary and the key concepts of genome browsers is helpful for understanding
the problem domain. This is an attempt to gather all the major concepts related to a genome
browser, it is not intended to be used as a definitive model of the problem area. We have arrived at
two versions of the domain model: the first version models the key concepts of a genome browser
(Figure 38), the second version will add some identified types of some of the main concepts.
83

Figure 38: Domain Model, Version1 models the basic concepts of a genome browser
Genome browsers have interwinding concepts that are presented in the domain model, those
concepts are either computer related, biological terms or visualization concepts. A Genome Browser
Installed System models the entire genome browser system and it is comprised of several Genome
Browser Instances. Each Genome Browser Instance has several Datasets that belongs to one Genome.
A Genome Browser Instance can have several user Sessions and it also has a Configuration default
configuration Admin Configuration and session-specific configuration Session Configuration. The Ad-
min Configuration represents the permanent default configurations of a genome browser instance. It
contains information about the genome under investigation, the set of available tracks with their
underlying datasets, the default viewed genomic region and the visible tracks. It also contains
the directory information of the sessions and datasets. The Session Configuration represents the
84

temporary session configurations of a genome browser instance that is related to a session.
Each Genome Browser Instance is visualized in a Virtual View, both Virtual View and Actual View
being visual components of a genome browser. They respectively represent the entire genomic view
containing the entire genomic sequence with the whole list of selected tracks. The view that the
user sees is basically a projection of the Virtual View. Both views have a Window Coordinate and a
Sequence Coordinate. Users can browse the genome by performing operations that changes either
Session Configuration or the Actual View. Those operations either directly or implicitly change the
Actual View seen by the user.
A Genome consists of a single or multiple Sequences and every Sequence is used as a Sequence
Coordinate that is used to map Features to their locations on the Sequence.
Every Dataset has several Features and it is used to create one or more tracks, such that each
Track is an aggregate of features of a single type that are stored in a Dataset and conform to the
Sequence Ontology. Every Track has a Feature Visualization capability that visualizes the features
inside that track.
85

Figure 39: Domain Model, Version2 is the same as Version 1, adding identified types of some of the main
concepts
In the second version of the domain model (Figure 39) we have identified several types of
some of the main concepts. A Feature can be a Gene Feature (fundamental information units of
DNA), a Transcript Feature (a sequence of RNA produced by transcription from a DNA template),
an Alignment Feature (consists of nucleotide sequence alignments), a Quantitative Feature (dense,
continuous data such as alignment scores).
A Sequence can be a Chromosome, a Contig (a contiguous length of genomic sequence in which the
order of bases is known to a high confidence level), a Scaffold (a portion of the genome sequence re-
constructed from end-sequenced whole-genome shotgun clones). The Sequence Coordinate/locations
on the sequence can be a Point Coordinate (a location that spans a single base pair position), an
86

Interval Coordinate (a location that has a start and end position on the sequence and spans more
than one base pair position), or a Continuous Coordinate(a location that spans the whole length of
a sequence).
3.4 Specific Requirements
3.4.1 External Interface Requirements
3.4.1.1 User Interfaces
The user interface will be consistent and simple to use by the intended users, without the need of
previous training, and it should work on modern web browsers such as Internet Explorer, Firefox,
Google Chrome, Safari and Netscape. It will use the common and familiar layout of most modern
genome browsers using a widely used and understood terminology by the intended users of the tool.
The main user interface would be the genome browser’s page. The header will have the name and
coordinate of the genome under investigation and it will have a search field and the rest of the
navigation control like zooming and scrolling.
The body of the page will have the piled up set of tracks with the main track being the one
containing the genome sequence. A set of configuration controls will be associated with each track
in order to provide a lot of customization capabilities for the intended user.
In the case of errors, the system should provide comprehensible error messages to the user and
error log files as well. The error messages shall be accurate and simple to understand. There shall
be a help menu. There is a file upload dialog to walk through the uploading steps with the user
with clear and simple instructions. A list of all the available tracks shall be presented to the user
with clear classification of the type and content of the provided available tracks.
3.4.1.2 Hardware Interfaces
Server Side: The genome browser will be hosted on any available machine with a working HTTP
web server, usually the web server is listening on the web standard port, port 80, or any other
available port.
Client Side: The genome browser is a client-server application therefore, in order to access it, the
user will need a computer with an Internet connection, which means that hardware interfaces
are required to connect to the internet, like wireless or Ethernet network connection devices
(e.g. Internet Service Provider (ISP) or DSL and a Modem).
87

3.4.1.3 Software Interfaces
In order for the genome browser to work properly it needs several software components:
Server Side:
A HTTP Server Application: like Apache.
A Relational Database Management System, or file based databases: for storing genomic data like
MYSQL database.
Command line: the command line is used to run external code to prepare the genomic data to be
displayed inside tracks of the genome browser and also for other purposes.
Client Side:
A Web Browser: The genome browser’s main user interface will be on the users web browser,
therefore any modern web browser should work just fine.
3.4.1.4 Communications Interfaces
The HTTP protocol will be used to facilitate communications between the client (web browser) and
server, as well as the TCP/IP protocol for transferring data. The system can be accessed via any
available port. It also uses the DAS protocol to communicate with DAS sources [Prlic et al., 2007].
3.4.2 Functional Requirements
This section describes specific requirements for modern genome browsers, that will be described in
two forms: statements and use cases.
SR 1: The genome browser shall allow the administrator to add new datasets and update/delete
existing datasets.
SR 2: The genome browser shall allow the administrator to create tracks from the added datasets.
SR 3: The genome browser shall allow the administrator to define the system default settings and
configurations.
SR 4: The genome browser shall provide several genomes to browse. Each genome is associated
with its annotation datasets and the genome browser displaying the annotations of a specific genome
is called a genome browser instance. A genome browser installed system has several genome browser
instances, each displaying one specific genome along with its annotation tracks.
SR 5: The genome browser shall display genomic data in several level of details or perspectives to
ease the user understanding of complex genomic data.
SR 6: The genome browser shall provide navigation capabilities to browse different regions of the
genome.
88

SR 7: The genome browser shall provide flexible customization to a genome browser instance.
SR 8: The genome browser shall provide user sessions saving capabilities.
3.4.3 Use Cases
The section presents the rest of the genome browser requirements as use cases.
3.4.3.1 Actor-Goal List
Actor Goal
Administrator Manage configurations of a Genome Browser instance.
Scientist
Navigate.
Save session state.
Export data.
Manage configurations of a Genome Browser instance.
Table 6: Actor-Goal Table
Comments:
The documented use cases are considered high-level with the focus of understanding the basic
functionality of a genome browser. As mentioned previously, security requirements, such as authen-
tication, log-in and log-out, are not considered. We also do not cover the searching of features and
it is assumed that there is only one genome in a genome browser instance associated with several
feature tracks. In the extension part of the use cases, low level errors associated with internal server
errors or inexperienced users and administrators are not considered.
89

3.4.3.2 Use Case Model
Figure 40: Use Case Model
3.4.3.3 Fully Dressed Use-Cases
ID: UC-1
Use Case: Manage configurations of a Genome Browser instance.
Level: User-goal
Primary Actor: Administrator
Stakeholders and Interests:
1.Research Group members: They need the Genome Browser instance to contain genomic se-
quences and data in their field of research and to be correctly visualized, maintained (up to
date), easily accessible and interpretable.
Preconditions:
1.The Genome Browser software is successfully installed on a server machine.
2.The server is successfully running.
3.Data sources are accessible.
90

Minimal Guarantees: The system keeps a log.
Success Guarantees: The Genome Browser instance is set up and ready for use.
Trigger: The administrator defines the configuration of a Genome Browser instance.
Main Success Scenario:
1.The administrator adds the datasets.
2.The Administrator creates the tracks from the datasets.
3.The Administrator defines the global/Admin configurations.
4.The Administrator creates a genome browser instance visualization from the configuration and
the tracks.
ID: UC-2
Use Case: Browse the Genome.
Level: Summary-goal
Primary Actor: Scientist
Stakeholders and Interests:
1.Research Group members: They need to be able to choose the sequence that they need to
investigate with their available annotation tracks.
Preconditions:
1.The Genome Browser is accessible.
Minimal Guarantees: The Scientist can return to the default view.
Success Guarantees: The Scientist is able to view specific regions of interest.
Trigger: The Scientist selects a genome to browse.
Main Success Scenario:
1.The Scientist selects one of the available sequences of that genome.
2.The Genome Browser displays the selected sequence with public tracks in the Actual View.
3.The Scientist selects one of the extended use cases to perform.
ID: UC-2.a
Use Case: Navigate.
Level: User-goal
Primary Actor: Scientist
Stakeholders and Interests:
91

1.Research Group members: They need to be able to navigate to interesting regions of the
genome.
Preconditions:
1.The Genome Browser is accessible.
Minimal Guarantees: The user can return to the default view.
Success Guarantees: The Scientist is able to navigate to regions of interest.
Trigger: The Scientist navigates to interesting regions of the genome.
Main Success Scenario:
1.The Scientist navigates to interesting regions of the genome.
2.The Genome Browser presents the annotations of the selected region in the Actual View.
Comments:
1.In this Use Case, Navigates, includes scrolling, zooming, returning to the default view, spec-
ifying specific coordinates or features to view. This is documented in the sub function use
cases.
2.Presents can be handled differently depending on the Genome Browser initial configurations.
ID: UC-2.b
Use Case: Save session state.
Level: User-goal
Primary Actor: Scientist
Stakeholders and Interests:
1.Research Group members: They need to be able to access their session to continue their work.
Preconditions:
1.The Scientist changes the default settings of the genomic view.
Minimal Guarantees: The state of the user current session is available to the user.
Success Guarantees: The Scientist can refer or access their session using the session ID.
Trigger: The Scientist chooses to save his session.
Main Success Scenario:
1.The Scientist selects to save the state of his session.
92

2.The Genome Browser creates a copy of the session, assigns a session ID and stores it in a
permanent storage.
ID: UC-2.c
Use Case: Export data.
Context of Use: The user wants to extract the sequence itself, or all the data in the selected
tracks, or even just the annotations found in a single track.
Level: User-goal
Primary Actor: Scientist
Stakeholders and Interests:
1.Research Group members: They need to be able to export data from the Genome Browser
instance in various formats.
2.Research community: They need to export data from Genome Browser instances in order to
share them among the community members.
Preconditions:
1.The Scientist is viewing a genomic region with a set of annotation tracks.
Minimal Guarantees: The sequence track’s data is available for exporting.
Success Guarantees: A file containing the selected data in the appropriate format is created.
Trigger: The Scientist selects to export data from tracks.
Main Success Scenario:
1.The Scientist selects to export data.
2.The Scientist chooses the range of data to be exported and the format of exporting.
3.The Genome Browser exports the selected data according to the selected format.
ID: UC-2.d
Use Case: Manage configurations of a Genome Browser instance.
Level: User-goal
Primary Actor: Scientist
Stakeholders and Interests:
93

1.Research Group members: They need to be able to customize the Genome Browser instance
and change the default configurations for the duration of their session.
Preconditions:
1.The Scientist is viewing a genomic region with a set of annotation tracks with the default
configurations.
Minimal Guarantees: The Scientist can always go back to the default configurations.
Success Guarantees: The Scientist creates a new configuration.
Trigger: The Scientist chooses to change the configurations.
Main Success Scenario:
1.The Scientist defines a new session configuration.
2.The Genome Browser applies the configurations in the context of a session.
Comments:
1.This use case, uses “Save sessions state” use case, , meaning the new defined user configuration
can be saved using the ”Save session state” use case.
2.To define new configurations means that the user can do the following:
•Show/hide tracks.
•Reorder tracks.
•Change the appearance of features inside tracks like colour, size, shape, etc.
ID: UC-2a.1
Use Case: Position.
Level: Sub-function
Primary Actor: Scientist
Stakeholders and Interests:
1.Research Group members: They need to be able to position the Genome Browser view to
specific regions or features.
Preconditions:
1.The Scientist is viewing a genomic region with a set of annotation tracks.
94

Minimal Guarantees: The user can always go back to the default position.
Success Guarantees: The Scientist is able to change the current viewed region.
Trigger: The Scientist chooses to change the current viewed region.
Main Success Scenario:
1.The Scientist specifies a new position.
2.The Genome Browser determines the sequence coordinate of the new region.
3.The Genome Browser presents the annotations of the new region in the Actual view.
Comments:
1.In this use case, a new position could be a feature name/ID, a specific region coordinate in
the form of ch: start..end, or a point location.
ID: UC-2a.2
Use Case: Changing level of detail.
Level: Sub-function
Primary Actor: Scientist
Stakeholders and Interests:
1.Research Group members: They need to be able to view data at different levels of detail.
Preconditions:
1.The Scientist is viewing a genomic region with a set of annotation tracks.
Minimal Guarantees: The user can always go back to the default level of detail.
Success Guarantees: The Scientist is able to navigate in increasing/decreasing level of detail
while allowing to concentrate on a restricted slice of data with more details shown
Trigger: The Scientist chooses to change the current level of detail of the viewed region.
Main Success Scenario:
1.The Scientist chooses a new level of detail (Scale Factor) for viewing the data.
2.The Genome Browser determines the sequence coordinate of the new region.
3.The Genome Browser presents the annotations of the new region in the Actual View.
95

Comments:
1.In this use case, chooses means either setting a new scale or just zooming In/Out using
pre-configured zoom settings.
ID: UC-2a.3
Use Case: Changing the viewed region.
Level: Sub-function
Primary Actor: Scientist
Stakeholders and Interests:
1.Research Group members: They need to be able to navigate to regions of interests by panning
the view left or right.
Preconditions:
1.The Scientist is viewing a genomic region with a set of annotation tracks.
Minimal Guarantees: The user can always go back to the default view.
Success Guarantees: The Scientist is able to navigate to other regions of the genome.
Trigger: The Scientist chooses to navigate to other regions of the genome.
Main Success Scenario:
1.The Scientist navigates horizontally to view other interesting regions.
2.The Genome Browser determines the sequence coordinate of the new region.
3.The Genome Browser presents the annotations of the new region in the Actual View.
ID: UC-2a.4
Use Case: Setting a perspective.
Level: Sub-function
Primary Actor: Scientist
Stakeholders and Interests:
1.Research Group members: They need to be able to view a large number of tracks.
Preconditions:
96

1.The Scientist is viewing a genomic region with a set of annotation tracks, the set of tracks
exceeds the user’s view (not all tracks are shown).
Minimal Guarantees: The user can always go back to the default view perspective.
Success Guarantees: The Scientist is able to view wanted annotation tracks.
Trigger: The Scientist wants to view the annotations belonging to out of view tracks.
Main Success Scenario:
1.The Scientist sets a new perspective.
2.The Genome Browser determines the window coordinate and annotations of the Actual View.
3.The Genome Browser presents those annotations in the Actual View.
Comments:
1.This use case is needed in the case that the list of selected tracks exceeds the height of the
user’s view.
2.sets a new perspective, means navigating longitudinally in the data to view other wanted
tracks of data.
3.4.4 Non-Functional Requirements
3.4.4.1 Performance Requirements
SR 9: Number of users: The genome browser shall support at least 10 concurrent users.
SR 10: General Response time: The response time of the genome browser functions shall not
exceed 1 second.
SR 11: Loading time: The loading time of data files shall not exceed 5 seconds.
SR 12: Size of a single dataset: The genome browser shall be able to display the features
contained in at least 2 terabytes of data inside a track.
SR 13: Number of datasets or tracks: The system should be able to serve at least 100
datasets to the user. It should be able to display 10000 tracks.
Note: This does not imply that it can host 10000 tracks of 2 terabyte datasets; it means that it
can handle the visualization of 10000 tracks without performance loss.
97

3.4.4.2 Extensibility Requirements
SR 14: The system shall be extendable to add new data formats and new visualizations (new
glyphs and tracks).
SR 15: A developer shall spend a maximum of 6 working days in order to extend a genome browser
with one data format or one visualization (glyph and track).
3.4.5 Design Constraints
The genome browser shall use and conform to the genomic file format standards and specifications,
since the genome browser will use those files as inputs that will be parsed to draw genomic features
inside their designated tracks. The minimal set of data formats that need to be supported by a
genome browser is (FASTA, GFF, BED, WIG, SAM/BAM, BegBed and BigWig) documented in
both Appendix A and Appendix B. The minimal set of visualizations supported is (Generic, DNA,
Alignment, Arrow, Box, CDS, Gene, Processed Transcript, Protein, Transcripts, XY Plot, Wiggle
density), which can be found in Appendix C. The genome browser shall be compatible with multiple
genomic databases like MYSQL or BioMysql, since they are commonly used to save genomic data.
The genome browser’s underlying naming of data types and their relationships should conform
to the sequence ontology, since the user will use them in the searching capability of the genome
browser.
3.5 Formal Specification of a Genome Browser
This section establishes a formal specification of a genome browser in “Z Notation”. We introduce
the different components of the system in an incremental manner, starting with the basic types,
and then the various components represented as state schemas, after that the operations and finally
the validation. The validation process checks proof obligations: that the pre-conditions and post-
conditions do not contradict the state invariants.
3.5.1 Overview
A Genome Browser complexity arises from the complexity of the genomic data that it represents,
since we cannot separate the computer aspects of the system (e.g. window, datasets) from both
the visual (e.g. tracks, feature visualization) and the biological aspects (e.g. genome, sequence,
feature). We needed to have a flexible and easily comprehensible specification model that relates
98

those aspects or concepts in a meaningful way, which can be later used in designing and verifying
that the genome browser conforms to the specifications.
We are trying to represent a visualization tool where the visualized data is very big and complex.
In genome browsers, the genome sequence is used as the main coordinate system for the biological
data and annotations that are grouped, according to their types, inside horizontally aligned tracks
and visualized using glyphs or icons inside those tracks. The specifications are organized into the
following sections: Section 3.5.2 identifies the basic types used to model our system; Section 3.5.3
models the basic components of a genome browser including Sequence, Genome, Feature, DataSet,
FeatureVisulization and Track; Section 3.5.4 models the two coordinate systems used in genome
browsers; Section 3.5.5 models the different configurations of the system, their operations and
associated validation; Section 3.5.6 models the views used in our system, their operations and
associated validation; Figure 41 shows a sketch that represents our views and their coordinates and
illustrates their special relationships. Section 3.5.7 models the genome browser instance and the
genome browser installed system, their initialization, operations and associated validation.
3.5.2 Basic Types
We start the specification by introducing several basic types:
[SEQNAME,FEATURE, SCALE, SESSION,GLYPH,TYPE,NAME]
STRAND ::= − | +
NUCLEOTIDE ::= A | C | G | T
DNAsequence == seq1 NUCLEOTIDE
A genome browser system will need, SEQNAME, to represent the set of all sequence names available
in the system and FEATURE, to model the set of all possible feature types available in the system.
We also must have a variable of type SCALE to represent the scale that is used to map base pairs
to window units on the screen. The end-user needs to save his/her session SESSION is used to
represent a user session.
In genome browsers, each track uses a different icon or glyph to visualize the features, so to represent
those different types of graphical representations we use GLYPH. Also there are several dataset types
(e.g. genes and transcript datasets) that can be visualized in a genome browser, so TYPE is used to
represent the set of all possible dataset types. There are different tracks in a genome browserNAME
is used to represent the set of all possible track names. Genomic features can reside on the positive
strand or the negative strand of a sequence STRAND is used to reflect that. The genomic sequence
99

is a sequence of nucleotides, represented by DNAsequence, and NUCLEOTIDE models any one of the
DNA nucleotides { A, C , G , T}.
There is a constant to model the maximum region size that can be viewed in a genome browser
MaxViewWidth.
MaxViewWidth : N1
3.5.3 Basic Components of a Genome Browser
There are two essential biological data types including Sequence and Feature, two visual data types
that are a Track and FeatureVisulization, and a computer related aspect which is a DataSet. There-
fore, we need to define a schema type for each of them. Features belonging to a sequence have
locations on that sequence and each type of feature is presented inside horizontal tracks.
100

Figure 41: Diagram of Spacial Concepts in Z Model, shows the different spacial distribution of concepts
and their spacial relationships.
A Sequence schema type is defined to represent a genomic sequence that can be a chromosome, a
contig or a scaffold, actually any sequence belonging to an organism’s genome. A Sequence basically
has several variables: a name, the actual sequence of nucleotides sequenceText, the start and end
coordinate of the sequence and the length of the sequence SeqLength.
101

Sequence
name : SEQNAME
sequenceText : DNAsequence
start, end : N1
SeqLength : N1
start ≤ end
start = 1
end = #sequenceText
SeqLength = end− start + 1
A Genome Browser can have a number of sequences which together form the Genome of an organism.
Genome == P Sequence
BasePairPos model the base pair positions on the sequence. We are using a one-based coordinate
to number the sequence bases such that the first base has the position of 1.
BasePairPos == 1..SeqLength
The Feature schema type has several variables including their type, and a location which is defined
by 4 attributes strand, seqName sequence name, start and end.
Feature
type : FEATURE
strand : STRAND
seqName : SEQNAME
start : BasePairPos
end : BasePairPos
start ≤ end
A DataSet represents the data underlying a track which can be taken from a file, a DAS source
or even a database. Each DataSet belongs to a genome and has a type like a gene model data or
expression data.
DataSet
genome : GENOME
type : TYPE
102

A FeatureVisualization schema models the visualization of features inside tracks and has a glyph
variable that defines the glyph used to visualize the features.
FeatureVisualization
glyph : GLYPH
The Track schema type represents a visual aspect of the system. Each track in the system has a
Name, a TrackHeight with a set of all the features it contains, a featureType that is used to specify
the type of the features in the track (allowing only one type of features in each track, as emphasized
in the predicate part). Every track in a genome browser belongs to a dataset that represents the
underlying textual data of a track. Another variable, visualizationType, is used to specify the type
of visualization used to visualize the features in the track.
Track
name : NAME
TrackHeight : N1
features : PFeature
featureType : FEATURE
dataset : DataSet
visualizationType : FeatureVisualization
∀ f : Feature | f ∈ features • f.type = featureType
3.5.4 Coordinate Systems
In a genome browser, we need two coordinate systems: the sequence coordinate in base pairs and
the window coordinate in an arbitrary window unit. The size of the sequence coordinate is normally
bigger than any screen size, so we need to convert between those two coordinate systems and this
is done using a scale factor. For instance, the human genome consists of over 3 billion nucleotide
base pairs, which requires a many-to-one mapping of bases to window units on modern displays
[O’Brien et al., 2010]. A schema type named SequenceCoordinate models the sequence coordinate
of a genome browser. This has several variables used to specify the locations of features on the
sequence and the start and end of the viewed region of the genome. These include the name of the
sequence seqName, the strand, the minBP position and the maxBP position. The only constraint is
that the minBP is less than or equal to the maxBP. We are assuming that the sequence coordinate
uses the one-base genomic coordinate.
103

SequenceCoordinate
seqName : SEQNAME
strand : STRAND
minBP,maxBP : BasePairPos
minBP ≤ maxBP
The second coordinate system named WindowCoordinate is used to specify the positions of tracks
in the user’s display. We used an arbitrary window unit to represent positions on the WindowCoor-
dinate.
The display is a fixed size bounded rectangle in the X-Y plane [Bowen, 1992], where left and right
are the start and the end range on the X coordinate, while top and bottom are the start and the
end range on the Y coordinate. Xsize represents the width of the display and Ysize is the height of
the display. Xrange and Yrange are used to define the range of window units of our WindowCoordi-
nate. The WindowCoordinate has 4 different variables, the left and right, the top and bottom of the
WindowCoordinate, with the constraints that left is less than right and top is less than bottom.
Xsize,Ysize : N1
Xrange == 0..Xsize− 1
Yrange == 0..Ysize− 1
WindowCoordinate
left, right : Xrange
top, bottom : Yrange
(left < right) ∧ (top < bottom)
3.5.5 Genome Browser Configurations
The genome browser has two types of configurations that are used to configure the genome browser
instance Admin Configuration and Session Configuration. A genome browser instance represents
a single organism/genome as modelled in Section 3.5.7. Before we can define the two types of
configurations we need to define the genome browser zoom levels which are used to scale the sequence
coordinate to the more limited window coordinate. A scale is in window units per base pairs. There
are several configured zoom levels in a genome browser which are modelled in availableZoomLevels.
These zoom levels include a MaxZoom and a MinZoom, which respectively represent the maximum
104

zoom level and the minimum zoom level available. Those two model the highest and lowest zoom
levels in our system. It is important to know that there is no repetitive zoom levels and every zoom
level is either the MaxZoom or MinZoom or a zoom level value in between.
availableZoomLevels : P SCALE
MaxZoom : SCALE
MinZoom : SCALE
MaxZoom ∈ availableZoomLevels
MinZoom ∈ availableZoomLevels
∀ z, x : SCALE | z ∧ x ∈ availableZoomLevels • (z 6= x) ∧ (z < x) ∨ (z > x)
∀ z : SCALE | z ∈ availableZoomLevels • (z ≤ MaxZoom) ∧ (z ≥ MinZoom)
After having identified the availableZoomLevels, we need to order them and save them in some sort
of array data structure for easy access during zooming operations. So we have defined an Index to
number our zoom level array from 0 to the size of (availableZoomLevels − 1). Then we created our
data array structure of ZoomLevels such that the availableZoomLevels is ordered from MinZoom to
MaxZoom.
Index == 0..#availableZoomLevels− 1
ZoomLevels : Index 7� availableZoomLevels
ZoomLevels(0) = MinZoom
ZoomLevels(#availableZoomLevels− 1) = MaxZoom
∀ i, j : Index | 0 ≤ i < j ≤ (#availableZoomLevels− 1) • ZoomLevels(i) < ZoomLevels(j)
3.5.5.1 Admin Configuration schema
Now we model the two types of configurations: the AdminConfiguration is the permanent/default
configuration of our instance defined by the administrator of the system, while the SessionConfig-
uration is our changing/temporary configuration defined by the user of the genome browser. Both
configurations have the same set of variables: genome to identify the genome under investigation,
refseq to define our exact default reference sequence presented to the user. Variable availableDatasets
models all the underlying datasets of our tracks. The scaleFactor identifies the default zoom level
used to map base pairs to window units. regionStart andregionEnd define the coordinate of our
default viewed region of the genome, while availableTracks, selectedTracks and unselectedTracks re-
spectively represent all the available tracks in our instance, all the default or currently selected
tracks, and all the unselected tracks.
105

Several constraints exist, including the fact that the scaleFactor is part of availableZoomLevels;
refseq variable is part of the genome under investigation; The set of availableTracks is all the tracks
in selectedTracks and unselectedTracks; The tracks in either selectedTracks or unselectedTracks is not
part of the other; The regionStart and regionEnd is between the start and end values of our refseq;
All the availableDatasets are containing data of our current genome and every track in the set of
availableTracks belong to a dataset that is part of our availableDatasets.
AdminConfiguration
genome : Genome
refseq : Sequence
availableDatasets : PDataSet
scaleFactor : SCALE
regionStart, regionEnd : BasePairPos
availableTracks, selectedTracks, unselectedTracks : PTrack
scaleFactor ∈ availableZoomLevels
refseq ∈ genome
selectedTracks ∪ unselectedTracks = availableTracks
selectedTracks ∩ unselectedTracks = ∅refseq.start ≤ regionStart < regionEnd ≤ refseq.end
∀ d : availableDatasets • d.genome = genome
∀ t : Track | t ∈ availableTracks • t.dataset ∈ availableDatasets
3.5.5.2 Session Configuration schema
The SessionConfiguration has the same set of variables and predicates as the AdminConfiguration.
The only difference is that AdminConfiguration represents the default settings of our instance and
SessionConfiguration represents our user session settings.
106

SessionConfiguration
genome : Genome
refseq : Sequence
availableDatasets : PDataSet
scaleFactor : SCALE
regionStart, regionEnd : BasePairPos
availableTracks, selectedTracks, unselectedTracks : PTrack
scaleFactor ∈ availableZoomLevels
refseq ∈ genome
selectedTracks ∪ unselectedTracks = availableTracks
selectedTracks ∩ unselectedTracks = ∅refseq.start ≤ regionStart ≤ regionEnd ≤ refseq.end
∀ d : availableDatasets • d.genome = genome
∀ t : Track | t ∈ availableTracks • t.dataset ∈ availableDatasets
3.5.5.3 Session Configuration Operations and Validation
Show Track Operation
ShowTrack operation changes the SessionConfiguration and consequently the VirtualView (introduced
in Section 3.5.6) by adding track? to the set of selectedTracks, which will update the TrackList. This
increases the virtualHeight by the trackHeight?.
ShowTrack
∆SessionConfiguration
track? : Track
trackHeight? : N1
track? ∈ unselectedTracks
selectedTracks′ = selectedTracks ∪ track?
unselectedTracks′ = unselectedTracks \ track?
virtualHeight′ = virtualHeight + trackHeight?
Validation:
This validation is introduced to prove that ShowTrack operation does not contradict the Session-
Configuration state invariants:
107

selectedTracks ∪ unselectedTracks = availableTracks
selectedTracks ∩ unselectedTracks = ∅
The pre-condition of the ShowTrack operation is: track? ∈ unselectedTracks
From the invariant the following is also true: track? /∈ selectedTracks
This means that the ShowTrack operation will only be used in the case where the track being shown
is part of the unselectedTracks and not of the selectedTracks.
We expect that at the conclusion of a ShowTrack operation, the availableTracks would be un-
changed.That is:
selectedTracks’ ∪ unselectedTracks’ = selectedTracks ∪ unselectedTracks
We can prove that this is indeed the case using the following argument:
selectedTracks’ ∪ unselectedTracks’
=(selectedTracks ∪ track?) ∪ (unselectedTracks \ track?)
[from post-conditions of ShowTrack] (1)
=(unselectedTracks \ track?) ∪ (selectedTracks ∪ track?) [union is commutative] (2)
=(unselectedTracks \ track?) ∪ (track? ∪ selectedTracks) [union is commutative] (3)
=((unselectedTracks \ track?) ∪ track?) ∪ selectedTracks [union is associative] (4)
=(unselectedTracks ∪ track?) ∪ selectedTracks [law relating set difference to union] (5)
=unselectedTracks ∪ selectedTracks [from pre-condition of ShowTrack] (6)
Hide Track Operation
HideTrack operation changes the SessionConfiguration and consequently the VirtualView (introduced
in Section 3.5.6). It takes a track? from the selectedTracks set and add it to the unselectedTracks,
which will update the TrackList. This will result in hiding the track from the list of visible tracks
and decreasing the virtualHeight by trackHeight?.
108

HideTrack
∆SessionConfiguration
track? : Track
trackHeight? : N1
track? ∈ selectedTracks
selectedTracks′ = selectedTracks \ track?
unselectedTracks′ = unselectedTracks ∪ track?
virtualHeight′ = virtualHeight− trackHeight?
Validation:
This validation is introduced to prove that HideTrack operation does not contradict the SessionCon-
figuration state invariants:
selectedTracks ∪ unselectedTracks = availableTracks
selectedTracks ∩ unselectedTracks = ∅
The pre-condition of the HideTrack operation is: track? ∈ selectedTracks
From the invariant the following is also true: track? /∈ unselectedTracks
This means that the HideTrack operation will only be used in the case where the track being shown
is part of the selectedTracks and not of the unselectedTracks.
We expect that at the conclusion of a HideTrack operation, the availableTracks would be un-
changed.That is:
selectedTracks’ ∪ unselectedTracks’ = selectedTracks ∪ unselectedTracks
We can prove that this is indeed the case using the following argument:
selectedTracks’ ∪ unselectedTracks’
=(selectedTracks \ track?) ∪ (unselectedTracks ∪ track?)
[from post-conditions of ShowTrack] (1)
=(selectedTracks \ track?) ∪ (track? ∪ unselectedTracks) [union is commutative] (2)
=((selectedTracks \ track?) ∪ track?) ∪ unselectedTracks [union is associative] (3)
=(selectedTracks ∪ track?) ∪ unselectedTracks [law relating set difference to union] (4)
=selectedTracks ∪ unselectedTracks [from pre-condition of ShowTrack] (5)
109

Pan Operation
The following set of operations will cover the navigation aspect of a genome browser. The Pan
operation implicitly navigates the ActualView (introduced in Section 3.5.6) horizontally, which we
represented by a variable named panDistance? of type Z, so that positive values demonstrate right
panning and negative values have a left panning effect. This navigation changes two state variables
of the SessionConfiguration regionStart and regionEnd, which implicitly changes the seqCoor of the
ActualView which in turn changes the position of the ActualView on the viewCoor.
Pan
∆SessionConfiguration
panDistance? : Z
panDistance? ≤ (refseq.end− regionEnd)
panDistance? ≥ (refseq.start− regionStart)
regionStart′ = regionStart + panDistance?
regionEnd′ = regionEnd + panDistance?
Validation:
This validation is introduced to prove that Pan operation does not contradict the SessionConfigura-
tion state invariant:
refseq.start ≤ regionStart ≤ regionEnd ≤ refseq.end
The pre-conditions of the Pan operation are:
panDistance? ≤ (refseq.end − regionEnd )
panDistance? ≥ (refseq.start − regionStart )
This means: (refseq.start − regionStart) ≤ panDistance? ≤ (refseq.end − regionEnd)
(refseq.start − regionStart) ≤ (refseq.end − regionEnd) [Transitive Property, if a<b and b<c, then
a<c], which makes sure that we do not pan over the start and end of the reference sequence.
We need to prove that regionStart’ ≤ regionEnd’ is true and does not contradict with regionStart ≤regionEnd.
We can prove this using the following argument:
regionStart’ ≤ regionEnd’
≡ regionStart + panDistance? ≤ regionEnd + panDistance?
[from post-conditions of Pan] (1)
≡ regionStart ≤ regionEnd [since the same value is added to both sides] (2)
≡ true (3)
110

Set Scale Operation
After that, there are three very similar zooming operations, all of them implicitly affect the Vir-
tualView presented in Section 3.5.6. The first operation is SetScale, which is done by selecting a
newScale? factor that will affect the size and seqCoor of the viewed region.
SetScale
∆SessionConfiguration
newScale? : SCALE
newScale? ∈ availableZoomLevels
scaleFactor′ = newScale?
regionStart′ = viewCenter − (viewWidth div scaleFactor′) div 2
regionEnd′ = viewCenter + (viewWidth div scaleFactor′) div 2
Validation:
This validation is introduced to prove that SetScale operation does not contradict the SessionCon-
figuration state invariants:
refseq.start ≤ regionStart ≤ regionEnd ≤ refseq.end
scaleFactor ∈ availableZoomLevels
The SetScale pre-condition is: newScale? ∈ availableZoomLevels, which means that the SetScale
operation can only work if newScale? is part of the availableZoomLevels.
This operation affects scaleFactor, regionStart and regionEnd and from the pre-condition we have
established that the state invariant scaleFactor ∈ availableZoomLevels is satisfied.
We need to prove that regionStart’ ≤ regionEnd’ is true.
We can prove this using the following argument:
regionStart’ ≤ regionEnd’
≡ (viewCenter − (viewWidth div scaleFactor′)) div 2) ≤
(viewCenter + (viewWidth div scaleFactor′) div 2) [from post-conditions of SetScale] (1)
≡ true (2)
111

Zoom In Operation
The second zooming operation is ZoomIn, which increments the zoom level by selecting the next
level of zoom from the ZoomLevels, if it is not already in the MaxZoom.
ZoomIn
∆SessionConfiguration
scaleFactor 6= MaxZoom
scaleFactor′ = ZoomLevels(ZoomLevels∼(scaleFactor) + 1)
regionStart′ = viewCenter − (viewWidth div scaleFactor′) div 2
regionEnd′ = viewCenter + (viewWidth div scaleFactor′) div 2
Validation:
This validation is introduced to prove that ZoomIn operation does not contradict the SessionCon-
figuration state invariants:
refseq.start ≤ regionStart ≤ regionEnd ≤ refseq.end
scaleFactor ∈ availableZoomLevels
The ZoomIn pre-condition is: scaleFactor 6= MaxZoom, which means that the ZoomIn operation can
only work if scaleFactor is not the maximum zoom level.
The operation only affects scaleFactor, regionStart and regionEnd. After the operation scaleFactor’
is still part of availableZoomLevels.
We need to prove that regionStart’ ≤ regionEnd’ is true.
We can prove this using the following argument:
regionStart’ ≤ regionEnd’
≡ (viewCenter − (viewWidth div scaleFactor′)) div 2) ≤
(viewCenter + (viewWidth div scaleFactor′) div 2) [from post-conditions of ZoomIn] (1)
≡ true (2)
Zoom Out Operation
The third zooming operation is ZoomOut, which decrements the zoom level by selecting the previous
level of zoom from the ZoomLevels, if it is not already in the MinZoom.
112

ZoomOut
∆SessionConfiguration
scaleFactor 6= MinZoom
scaleFactor′ = ZoomLevels(ZoomLevels∼(scaleFactor)− 1)
regionStart′ = viewCenter − (viewWidth div scaleFactor′) div 2
regionEnd′ = viewCenter + (viewWidth div scaleFactor′) div 2
Validation:
This validation is introduced to prove that ZoomOut operation does not contradict the SessionCon-
figuration state invariants:
refseq.start ≤ regionStart ≤ regionEnd ≤ refseq.end
scaleFactor ∈ availableZoomLevels
The ZoomOut pre-condition: scaleFactor6= MinZoom, which means that the ZoomOut operation can
only work if scaleFactor is not the minimum zoom level.
The operation only affects scaleFactor, regionStart and regionEnd. After the operation scaleFactor’
is still part of availableZoomLevels.
We need to prove that regionStart’ ≤ regionEnd’ is true.
We can prove this using the following argument:
regionStart’ ≤ regionEnd’
≡ (viewCenter − (viewWidth div scaleFactor′)) div 2) ≤
(viewCenter + (viewWidth div scaleFactor′) div 2) [from post-conditions of ZoomOut] (1)
≡ true (2)
3.5.6 Basic Views of a Genome Browser
In order to represent the genome browser view of genomic regions, we have modelled two views: (i)
The virtual view that contains the entire reference sequence and all visible tracks (this view does
not have any constraint on the sequence size or on the number of tracks); (ii) The actual view seen
by the user that displays a region of the genome with its annotations in tracks. Nevertheless, before
we represent both views, we need to identify the list of visible tracks that occupy our views in this
schema TrackList. In order to do that, we have defined an Order for each of the selectedTracks.
TrackOrder is used to assign an Order for each of the selectedTracks. Once the track is part of the
113

selectedTracks, that means that it has a coordinate TrackCoor on our window. Every one of the
features that belongs to a track have a coordinate on the SequenceCoordinate.
The domain of both TrackOrder and TrackCoor represents all the set of selectedTracks. The TrackCoor
of each track is less than the coordinate of the higher track in order. For instance, the first track
coordinate is less than every other track and the second track coordinate is less than the 3rd or 4th
track window coordinate.
Order == 1..#selectedTracks
TrackList
TrackOrder : Track 7� Order
TrackCoor : Track 7� WindowCoordinate
FeatureCoor : Feature 7→ SequenceCoordinate
dom TrackOrder = selectedTracks
dom TrackCoor = selectedTracks
∀ i, j : Order; t, s : dom TrackOrder | 1 ≤ i < j ≤ #visibleTracks;
TrackOrder(t) = i ∧ TrackOrder(s) = j • TrackCoor(t) < TrackCoor(s)
∀ f : Feature; t : Track | f ∈ t.features •FeatureCoor(f).minBP = f.start ∧ FeatureCoor(f).maxBP = f.end
3.5.6.1 Virtual View schema
Now we model the VirtualView of a genome browser. The VirtualView has the TrackList organized
horizontally on top of each other, the sequence under investigation. It also has a width and a
height in terms of our window coordinate represented by virtualWidth and virtualHeight, respectively.
The virtualWidth spans the whole length of the sequence on the X coordinate. Accordingly, the
tracks in the TrackList also span the same length. The virtualHeight is the summation of the
selectedTracks heights in TrackList and can accommodate the entire set of available tracks. The
virSeqCoor represents the sequence coordinate of the VirtualView, while virtualCoor is used as the
window coordinate of the VirtualView. The virRegionLength represents the length of our sequence.
The virSeqCoor spans the whole length of the sequence. The left and right of our virtualCoor spans
from 0 to the our last base.
114

VirtualView
TrackList
sequence : Sequence
virtualWidth : N1
virtualHeight : N1
virSeqCoor : SequenceCoordinate
virtualCoor : WindowCoordinate
virRegionLength : N1
virSeqCoor.minBP = sequence.start
virSeqCoor.maxBP = sequence.end
virRegionLength = sequence.end− sequence.start + 1
3.5.6.2 Actual View schema
The ActualView models the current visible view seen by the user. It includes the VirtualView, since
it displays a portion of that view, and the SessionConfiguration, since it is being configured using
it. Like the VirtualView, it has a width and a height modelled by these two variables, respectively
viewWidth and viewHeight. It also has a viewCenter to model the base at the centre of the view, this
being needed in several operations on that view, including zooming and panning. It also models
the RegionLength, which is basically the size of the viewed region in bp. seqCoor is the sequence
coordinate of the ActualView and viewCoor is the window coordinate of the ActualView.
Several variables are set using the current SessionConfiguration, including the sequence on the Vir-
tualView, the seqCoor, the RegionLength and the viewCenter on the ActualView. It is important to
restrict the RegionLength to the constant MaxViewWidth. Both the virtualWidth and virtualHeight
are larger than or equal to the viewWidth and viewHeight, respectively.
115

ActualView
VirtualView
SessionConfiguration
viewWidth : N1
viewHeight : N1
viewCenter : BasePairPos
RegionLength : N1
seqCoor : SequenceCoordinate
viewCoor : WindowCoordinate
sequence = refseq
seqCoor.minBP = regionStart
seqCoor.maxBP = regionEnd
RegionLength = regionEnd− regionStart + 1
RegionLength ≤ MaxViewWidth
(virtualWidth ≥ viewWidth)
(virtualHeight ≥ viewHeight)
viewCenter = seqCoor.minBP + (RegionLength div 2)
viewCoor.left = regionStart ∗ scaleFactor
viewCoor.right = regionEnd ∗ scaleFactor
3.5.6.3 Actual View Operations and Validation
Scroll Operation:
Scroll operation is presented, which demonstrates vertical navigation of the ActualView, navigation
that only affects the window coordinate viewCoor of the ActualView. The input in this case is
scrollDistance? where positive values represent scrolling down and negative values scrolling up, an
operation that is only needed if the virtualHeight exceeds the viewHeight.
116

Scroll
∆ActualView
scrollDistance? : Z
virtualHeight > viewHeight
scrollDistance? ≤ (virtualcoor.bottom− viewCoor.bottom)
scrollDistance? ≥ (virtualcoor.top− viewCoor.top)
viewCoor.top′ = viewCoor.top + scrollDistance?
viewCoor.bottom′ = viewCoor.bottom + scrollDistance?
Validation:
This validation is introduced to prove that Scroll operation does not contradict the ActualView state
invariant:
(virtualHeight ≥ viewHeight).
The pre-condition of the Scroll operation is virtualHeight > viewHeight, which satisfies the state
invariant.
Consider the effect of scrolling on the state invariants. At the end of a Scroll operation, we expect
that:
virtualHeight’ ≥ viewHeight’
We can prove that by the following argument:
virtualHeight’ ≥ viewHeight’
≡ virtualHeight ≥ (viewCoor.bottom′ − viewCoor.top′)
[since virtualHeight’=virtualHeight] (1)
≡ virtualHeight ≥ (viewCoor.bottom + scrollDistance?)−
(viewCoor.top + scrollDistance?) [from post-conditions of Scroll] (2)
≡ virtualHeight ≥ (viewCoor.bottom + scrollDistance?−
viewCoor.top− scrollDistance?) (3)
≡ virtualHeight ≥ (viewCoor.bottom− viewCoor.top) (4)
≡ virtualHeight ≥ viewHeight [definition of viewHeight] (5)
117

3.5.7 Genome Browser System
3.5.7.1 Genome Browser Instance schema
A GenomeBrowserInstance models a genome browser with a single organism or genome. It has a set
of sessions availableSessions and every user session has a configuration modelled in SessionConfig,
such that the domain of SessionConfig is the set of availableSessions.
GenomeBrowserInstance
genome : Genome
availableSessions : P SESSION
SessionConfig : SESSION 7→ SessionConfiguration
dom SessionConfig = availableSessions
3.5.7.1.1 Initialization of Genome Browser Instance schema
At the initialization of every genome browser instance there is no AvailableSessions and the Ses-
sionConfiguration is set to the defaults of the AdminConfiguration.
InitGenomeBrowserInstance
GenomeBrowserInstance
SessionConfiguration
AdminConfiguration
AvailableSessions = ∅θSessionConfiguration = θAdminConfiguration
3.5.7.1.2 Genome Browser Instance schema Operations and Validation
Save Session State Operation
SaveSessionState operation is performed on the GenomeBrowserInstance. This operation saves the
session of the user with its configurations. This is performed on new sessions only.
118

SaveSessionState
∆GenomeBrowserInstance
newSession? : SESSION
currentConfig? : SessionConfiguration
newSession? /∈ availableSessions
availableSessions′ = availableSessions ∪ newSession?
SessionConfig′ = SessionConfig ⊕ {newSession? 7→ currentConfig?}
Validation:
This validation proves that the SaveSessionState operation does not contradict the GenomeBrowserIn-
stance state invariant:
dom SessionConfig = availableSessions
dom SessionConfig’= availableSessions’ should be true. We can prove this using the following argu-
ment:
dom SessionConfig’
= dom(SessionConfig ⊕ {newSession? 7→ currentConfig?})
[from post-condition of SaveSessionState] (1)
= (dom SessionConfig) ∪ (dom({newSession? 7→ currentConfig?}))
[dom law, if Q and R are sets, then dom(Q ⊕ R) = (dom Q) ∪ (dom R)] (2)
= availableSessions ∪ newSession? [fact of dom] (3)
= availableSessions′ [from post-condition of SaveSessionState] (4)
3.5.7.2 Genome Browser Installed System schema
GenomeBrowserInstalledSystem models the entire Genome Browser System, which is also the installed
genome browser that has several organisms to choose from, modelled by the set of AvailableInstances.
There is a single working instance modelled by currentInstance, which is part of the AvailableInstances.
GenomeBrowserInstalledSystem
AvailableInstances : PGenomeBrowserInstance
currentInstance : GenomeBrowserInstance
currentInstance ∈ AvailableInstances
119

3.5.7.2.1 Initialization of Genome Browser Installed System schema
When the user first initializes the genome browser system, there is no currentInstance and the
first thing the user has to do is to select an organism genome/an instance to work with.
InitGenomeBrowserInstalledSystem
GenomeBrowserInstalledSystem
currentInstance = ∅
3.5.7.2.2 Genome Browser Installed System schema Operations and Validation
Select Instance Operation
SelectInstance operation is used to select a genome/instance to work with. Such that this instance
selectedInstance? is part of the set of AvailableInstances.
SelectInstance
∆GenomeBrowserInstalledSystem
selectedInstance? : GenomeBrowserInstance
selectedInstance? ∈ AvailableInstances
currentInstance′ = selectedInstance?
AvailableInstances′ = AvailableInstances
Validation:
This validation proves that SelectInstance operation does not contradict the state invariant of
GenomeBrowserInstalledSystem:
currentInstance ∈ AvailableInstances
From the pre-condition of SelectInstance operation: selectedInstance? ∈ AvailableInstances and from
the post-conditions currentInstance’ = selectedInstance? and AvailableInstances’ = AvailableInstances.
Hence,
currentInstance’ ∈ AvailableInstances’
≡ selectedInstance? ∈ AvailableInstances′ (1)
≡ selectedInstance? ∈ AvailableInstances (2)
≡ true (3)
120

Chapter 4
Conclusion and Future Work
4.1 Description of Work and Contributions
Genome browsers are one of the most important tools in the bioinformatics field. This work has
been dedicated to documenting the different requirements of this tool. The contributions made in
this thesis are:
• Comparative analysis of some prominent research genome browsers prototypes.
• A requirements document that conforms to the IEEE Std 830-1998 Standard of a Software
Requirements Specification, that documents both the functional and the non-functional re-
quirements of a genome browser.
• Use cases to document functional requirements.
• A domain model of a genome browser’s key concepts.
• A formal specification of genome browsers in Z notation.
• A definition of visualizations as metaphors, glyphs, or icons.
• A Specification of data formats, documented in the Appendixes.
Our work started with the investigation of genome browsers functions and features and their
various input formats. We looked into four genome browsers (GBrowse, JBrowse, Dalliance, Savant)
gathering information on their common features, supported input file formats and their internal
workings. Then we documented several aspects of these four tools including their user interface,
implementation, features and supported non-functional requirements. In this work we focused on
web-based genome browsers since they have a larger user community. Then we summarized both
the key challenges faced by these tools and some available technologies used by them.
121

During this process, we had to determine which of the features are essential and which are not.
After that, we came up with a clear set of requirements documented in the form of a “Require-
ments Document” that conforms to the IEEE Std 830-1998 Standard of a Software Requirements
Specification. This requirements document includes the functional requirements in the form of use
cases, since use cases offer a simple and comprehensible way to describe the functions of a soft-
ware such as genome browsers. Those functional requirements illustrate the basic functions of a
genome browser like managing configurations, panning and zooming. We have also documented
some performance-related non-functional requirements of web-based genome browsers.
The requirements document can be used independently, as an SRS for genome browsers. Also a
domain model has been introduced to summarize and connect the basic concepts found in genome
browsers, which included interwinding of biological, computer related data representations and
visualization concepts. We have also introduced a formal specification model for genome browsers
documented in Z notation. The specification fully formalizes the basic concepts and operations
of a genome browser. It can serve as a convenient reference for understanding genome browsers
and their various aspects. This work also includes documenting several file format specifications
and presenting a library of available glyphs for both quantitative and qualitative data. In the non-
functional requirements, we were able to document some important performance and extensibility
related non-functional requirements.
During our study, we came to realize that genome browsers can fall into different and sometimes
overlapping kinds or categories like circular genome browsers, linear genome browsers, general
genome browsers, species-specific genome browsers, horizontally-oriented and vertically-oriented
genome browsers that differ in the type and number of genomes and datasets served, the visual
representations used and the layout of those representations. We also noted that genome browsers
are widely addressed as collaborative environments but they are really used to serve the needs of a
single user.
The non-functional requirements were one of the challenging aspects of our work, owing to their
lack of documentation and their challenging measurements, especially on a web platform subject to
many different implementation varieties and many more assumptions and affecting factors.
4.2 Limitations and Recommendations for Future Research
The requirements analysis in this thesis was focused on web-based genome browsers. Those browsers
are limited by the capabilities of the web environment and the client’s web browser. The scope of our
requirements did not include authentication and security aspects of the system and also searching
was not part of the functional requirements. The set of non-functional requirements only focused
on performance and extensibility requirements of the system.
122

The Z specification operations of the genome browser conforms with the scope of the requirements,
and they can be further extended to cover other operations like adding custom tracks, downloading
tracks data, searching for features and sharing genome view.
Both the requirements and the Z specification could be further extended or modified to model
comparative genome browsers, which are used to compare between several genomes, or basically
any other type of genome browser. They also can be used as a source of developing new file formats,
data structures and algorithms.
123

Bibliography
[Alagar and Periyasamy, 2011] Alagar, V. and Periyasamy, K. (2011). Vienna development method. In
Specification of Software Systems, Texts in Computer Science, pages 405–459. Springer London.
[Alekseyenko and Lee, 2007] Alekseyenko, A. V. and Lee, C. J. (2007). Nested Containment List
(NCList): a new algorithm for accelerating interval query of genome alignment and interval
databases. Bioinformatics, 23(11):1386–1393.
[Arakawa et al., 2009] Arakawa, K., Tamaki, S., Kono, N., Kido, N., Ikegami, K., Ogawa, R., and Tomita,
M. (2009). Genome Projector: zoomable genome map with multiple views. BMC bioinformatics,
10(1):31.
[Baker, 2010] Baker, M. (2010). Next-generation sequencing: adjusting to data overload. Nature methods,
7(7):495–499.
[Bare et al., 2010] Bare, J. C., Koide, T., Reiss, D. J., Tenenbaum, D., and Baliga, N. S. (2010). Inte-
gration and visualization of systems biology data in context of the genome. BMC bioinformatics,
11(1):382.
[Batley and Edwards, 2009] Batley, J. and Edwards, D. (2009). Genome sequence data: management,
storage, and visualization. Biotechniques, 46(5):333–336.
[Birney et al., 2004] Birney, E., Andrews, D., Bevan, P., Caccamo, M., Cameron, G., Chen, Y., Clarke,
L., Coates, G., Cox, T., Cuff, J., et al. (2004). Ensembl 2004. Nucleic Acids Research, 32(suppl
1):D468–D470.
[Bowen, 1992] Bowen, J. P. (1992). X: Why Z? Computer Graphics Forum, 11(4):221–234.
[Brooksbank et al., 2003] Brooksbank, C., Camon, E., Harris, M. A., Magrane, M., Martin, M. J., Mul-
der, N., O’Donovan, C., Parkinson, H., Tuli, M. A., Apweiler, R., et al. (2003). The European
Bioinformatics Institute’s data resources. Nucleic Acids Research, 31(1):43–50.
[Cline et al., 2009] Cline, M. S., Kent, W. J., et al. (2009). Understanding genome browsing. Nature
biotechnology, 27(2):153.
124

[Cockburn, A., 2001] Cockburn, A. (2001). Writing Effective Use Cases. Crystal collection for software
professionals. Addison-Wesley.
[Collins, 2014] Collins, F. S. (2014). National Institutes of Health. National Human Genome Research
Institute. “Talking Glossary of Genetic Terms.”. http://www.genome.gov/glossary/.
[Costa, 2012] Costa, F. F. (2012). Big Data in Genomics: Challenges and Solutions. G.I.T. Laboratory
Journal 11-12/2012, pages 2–4.
[Dombrowski and Maglott, 2002] Dombrowski, S. M. and Maglott, D. (2002). Using the Map Viewer to
explore genomes. The NCBI handbook.
[Dowell et al., 2001] Dowell, R. D., Jokerst, R. M., Day, A., Eddy, S. R., and Stein, L. (2001). The
distributed annotation system. BMC bioinformatics, 2(1):7.
[Down, 2014] Down, T. (2014). BioDalliance. http://www.biodalliance.org/index.html.
[Down et al., 2011] Down, T. A., Piipari, M., and Hubbard, T. J. P. (2011). Dalliance: interactive genome
viewing on the web. Bioinformatics, 27(6):889–90.
[Eilbeck et al., 2005] Eilbeck, K., Lewis, S. E., Mungall, C. J., Yandell, M., Stein, L., Durbin, R., and
Ashburner, M. (2005). The Sequence Ontology: a tool for the unification of genome annotations.
Genome biology, 6(5):R44.
[Erik Dahlstrom and Watt, 2011] Erik Dahlstrom, Patrick Dengler, A. G. C. L. C. M. D. S. and Watt, J.
(2011). Scalable vector graphics (svg) 1.1 Specification. http://www.w3.org/TR/SVG/Overview.
html.
[Etherington and MacLean, 2013] Etherington, G. J. and MacLean, D. (2013). SVGenes: a library for
rendering genomic features in scalable vector graphic format. Bioinformatics, 29(15):1890–1892.
[Fiume, 2010] Fiume, M. (2010). Savant Genome Browser: Developer Manual. [email protected].
[Fiume and Smith, 2012] Fiume, M. and Smith, E. (2012). Savant Genome Browser: User Manual.
[Fiume et al., 2012] Fiume, M., Smith, E. J. M., Brook, A., Strbenac, D., Turner, B., Mezlini, A. M.,
Robinson, M. D., Wodak, S. J., and Brudno, M. (2012). Savant Genome Browser 2: visualization
and analysis for population-scale genomics. Nucleic Acids Research, 40(Web Server issue):W615–
21.
[Fiume et al., 2010] Fiume, M., Williams, V., Brook, A., and Brudno, M. (2010). Savant: genome browser
for high-throughput sequencing data. Bioinformatics, 26(16):1938–1944.
125

[Gel Moreno and Messeguer Peypoch, 2014] Gel Moreno, B. and Messeguer Peypoch, X. (2014). Dissem-
ination and Visualisation of Biological Data. PhD thesis, Universitat Polit‘ecnica de Catalunya.
[GMOD, 2015] GMOD (2015). GBrowse User Uploads. http://gmod.org/mediawiki/index.php?
title=GBrowse_User_Uploads&oldid=16348.
[Goecks et al., 2012] Goecks, J., Coraor, N., Nekrutenko, A., Taylor, J., Team, G., et al. (2012). NGS
analyses by visualization with Trackster. Nature biotechnology, 30(11):1036–1039.
[Gollery, 2011] Gollery, M. (2011). What to do about data? Bioinformation, 5(9):367.
[Helt et al., 1998] Helt, G. A., Lewis, S., Loraine, A. E., and Rubin, G. M. (1998). BioViews: Java-based
tools for genomic data visualization. Genome research, 8(3):291–305.
[Heumann et al., 1996] Heumann, K., Harris, C., and Mewes, H.-W. (1996). A Top-Down Approach to
Whole Genome Visualization. In ISMB, pages 98–108.
[Hillier et al., 2005] Hillier, L. W., Coulson, A., Murray, J. I., Bao, Z., Sulston, J. E., and Waterston,
R. H. (2005). Genomics in C. elegans: so many genes, such a little worm. Genome research,
15(12):1651–1660.
[Homann and Johnson, 2010] Homann, O. R. and Johnson, A. D. (2010). MochiView: versatile software
for genome browsing and DNA motif analysis. BMC biology, 8(1):49.
[Huang and Marth, 2008] Huang, W. and Marth, G. (2008). EagleView: a genome assembly viewer for
next-generation sequencing technologies. Genome research, 18(9):1538–1543.
[Huntley et al., 2008] Huntley, D., Tang, Y. A., Nesterova, T. B., Butcher, S., and Brockdorff, N. (2008).
Genome Environment Browser (GEB): a dynamic browser for visualising high-throughput exper-
imental data in the context of genome features. BMC bioinformatics, 9(1):501.
[Hutchison, 2007] Hutchison, C. A. (2007). DNA sequencing: bench to bedside and beyond. Nucleic
Acids Research, 35(18):6227–6237.
[Illuminal, 2013] Illuminal (2013). An Introduction to Next-Generation Sequencing Technology. http:
//www.illumina.com/Documents/products/IlluminaSequencingIntroduction.pdf.
[ISO, 2011] ISO, I. (2011). Iec 25010: 2011: Systems and software engineering–systems and software
quality requirements and evaluation (square)–system and software quality models. International
Organization for Standardization.
126

[Jenkinson et al., 2008] Jenkinson, A. M., Albrecht, M., Birney, E., Blankenburg, H., Down, T., Finn,
R. D., Hermjakob, H., Hubbard, T. J., Jimenez, R. C., Jones, P., et al. (2008). Integrating
biological data–the distributed annotation system. BMC bioinformatics, 9(Suppl 8):S3.
[Jimenez et al., 2011] Jimenez, R. C., Salazar, G. A., Gel, B., Dopazo, J., Mulder, N., and Corpas,
M. (2011). myKaryoView: a light-weight client for visualization of genomic data. PloS one,
6(10):e26345.
[Jones et al., 2001] Jones, L., Moszer, I., and Cole, S. (2001). Leproma: a Mycobacterium leprae genome
browser. Leprosy review, 72(4):470–477.
[Jung et al., 2008] Jung, K., Park, J., Choi, J., Park, B., Kim, S., Ahn, K., Choi, J., Choi, D., Kang,
S., and Lee, Y.-H. (2008). SNUGB: a versatile genome browser supporting comparative and
functional fungal genomics. BMC genomics, 9(1):586.
[Kaps et al., 1997] Kaps, A., Heumann, K., Frishman, D., Bahr, M., and Mewes, H. (1997). Visualization
and Analysis of the Complete Yeast Genome. In Hofestadt, R., Lengauer, T., Loffler, M., and
Schomburg, D., editors, Bioinformatics, volume 1278 of Lecture Notes in Computer Science, pages
178–188. Springer Berlin Heidelberg.
[Karnik and Meissner, 2013] Karnik, R. and Meissner, A. (2013). Browsing (Epi) genomes: a guide to
data resources and epigenome browsers for stem cell researchers. Cell stem cell, 13(1):14–21.
[Kent et al., 2002] Kent, W. J., Sugnet, C. W., Furey, T. S., Roskin, K. M., Pringle, T. H., Zahler, A. M.,
and Haussler, D. (2002). The human genome browser at UCSC. Genome research, 12(6):996–
1006.
[Kent et al., 2010] Kent, W. J., Zweig, A. S., Barber, G., Hinrichs, A. S., and Karolchik, D. (2010). Big-
Wig and BigBed: enabling browsing of large distributed datasets. Bioinformatics, 26(17):2204–7.
[Kong et al., 2012] Kong, L., Wang, J., Zhao, S., Gu, X., Luo, J., and Gao, G. (2012). ABrowse-a
customizable next-generation genome browser framework. BMC bioinformatics, 13(1):2.
[Kuhn et al., 2012] Kuhn, R. M., Haussler, D., and Kent, W. J. (2012). The UCSC genome browser and
associated tools. Briefings in bioinformatics, page bbs038.
[Lacroix et al., 2011] Lacroix, T., Loux, V., Gendrault, A., Gibrat, J.-F., and Chiapello, H. (2011).
CompaGB: An open framework for genome browsers comparison. BMC research notes, 4(1):133.
[Lajugie and Bouhassira, 2011] Lajugie, J. and Bouhassira, E. E. (2011). GenPlay, a multipurpose
genome analyzer and browser. Bioinformatics, 27(14):1889–1893.
127

[Lang et al., 1996] Lang, U., Grinstein, G., and Bergeron, R. (1996). Visualization related metadata. In
Wierse, Andreas and Grinstein, GeorgesG. and Lang, Ulrich, editor, Database Issues for Data
Visualization, volume 1183 of Lecture Notes in Computer Science, pages 26–34. Springer Berlin
Heidelberg.
[Letovsky, 1999] Letovsky, S. (1999). Bioinformatics: databases and systems. Springer.
[Lister et al., 2008] Lister, R., O’Malley, R. C., Tonti-Filippini, J., Gregory, B. D., Berry, C. C., Millar,
A. H., and Ecker, J. R. (2008). Highly Integrated Single-Base Resolution Maps of the Epigenome
in Arabidopsis. Cell, 133(3):523–536.
[Loraine and Helt, 2002] Loraine, A. E. and Helt, G. A. (2002). Visualizing the genome: techniques for
presenting human genome data and annotations. BMC bioinformatics, 3(1):19.
[Loveland, 2005] Loveland, J. (2005). VEGA, the genome browser with a difference. Briefings in bioin-
formatics, 6(2):189–193.
[Mader et al., 2014] Mader, M., Simon, R., and Kurtz, S. (2014). FISH Oracle 2: a web server for
integrative visualization of genomic data in cancer research. Journal of clinical bioinformatics,
4(1):5.
[Madupu et al., 2010] Madupu, R., Brinkac, L. M., Harrow, J., Wilming, L. G., Bohme, U., Lamesch, P.,
and Hannick, L. I. (2010). Meeting report: a workshop on Best Practices in Genome Annotation.
Database (Oxford), 2010:baq001.
[Mao and McEnhimer, 2010] Mao, W. and McEnhimer, S. (2010). Survey: The Application of GMOD
in Bioinformatics Research. In Bioinformatics and Biomedical Engineering (iCBBE), 2010 4th
International Conference, pages 1–4. IEEE.
[Mark Edgley and the Riddle lab, 2014] Mark Edgley and the Riddle lab (2014). What is C. elegans?
https://www.cbs.umn.edu/research/resources/cgc/what-c-elegans.
[Marx, 2013] Marx, V. (2013). Biology: The big challenges of big data. Nature, 498(7453):255–260.
[Matsushima et al., 2009] Matsushima, A., Kobayashi, N., Mochizuki, Y., Ishii, M., Kawaguchi, S., Endo,
T. A., Umetsu, R., Makita, Y., and Toyoda, T. (2009). OmicBrowse: a Flash-based high-
performance graphics interface for genomic resources. Nucleic Acids Research, 37(suppl 2):W57–
W62.
[McEntyre and Ostell, 2002] McEntyre, J. and Ostell, J. (2002). The NCBI handbook. The National
Library of Medicine.
128

[McKay and Cain, 2009] McKay, S. and Cain, S. (2009). Genome Browsers. In Bioinformatics, pages
39–63. Springer.
[Medina et al., 2013] Medina, I., Salavert, F., Sanchez, R., de Maria, A., Alonso, R., Escobar, P., Bleda,
M., and Dopazo, J. (2013). Genome Maps, a new generation genome browser. Nucleic Acids
Research, 41(W1):W41–W46.
[Miller et al., 2013] Miller, C. A., Anthony, J., Meyer, M. M., and Marth, G. (2013). Scribl: an
HTML5 Canvas-based graphics library for visualizing genomic data over the web. Bioinformatics,
29(3):381–383.
[Mungall, 2011] Mungall, C. (2011). Next-generation information systems for genomics. PhD thesis,
University of Edinburgh.
[National Library of Medicine (US), 2014] National Library of Medicine (US) (2014). Genetics Home
Reference. http://ghr.nlm.nih.gov/handbook/basics/chromosome.
[Nicol et al., 2009] Nicol, J. W., Helt, G. A., Blanchard, S. G., Raja, A., and Loraine, A. E. (2009).
The Integrated Genome Browser: free software for distribution and exploration of genome-scale
datasets. Bioinformatics, 25(20):2730–2731.
[Nielsen et al., 2010] Nielsen, C. B., Cantor, M., Dubchak, I., Gordon, D., and Wang, T. (2010). Visual-
izing genomes: techniques and challenges. Nature methods, 7:S5–S15.
[Nielsen, 1993] Nielsen, J. (1993). Response times: The 3 important limits. Usability Engineering.
[NIH, 2014] NIH (2014). National Institutes of Health. National Human Genome Research Institute.
Talking Glossary of Genetic Terms. http://www.genome.gov/glossary/.
[O’Brien et al., 2010] O’Brien, T. M., Ritz, A. M., Raphael, B. J., and Laidlaw, D. H. (2010). Grem-
lin: an interactive visualization model for analyzing genomic rearrangements. Visualization and
Computer Graphics, IEEE Transactions, 16(6):918–926.
[Okonechnikov et al., 2012] Okonechnikov, K., Golosova, O., Fursov, M., et al. (2012). Unipro UGENE:
a unified bioinformatics toolkit. Bioinformatics, 28(8):1166–1167.
[Oram and Wilson, 2007] Oram, A. and Wilson, G. (2007). Beautiful Code. O’reilly.
[Pabinger et al., 2013] Pabinger, S., Dander, A., Fischer, M., Snajder, R., Sperk, M., Efremova, M.,
Krabichler, B., Speicher, M. R., Zschocke, J., and Trajanoski, Z. (2013). A survey of tools for
variant analysis of next-generation genome sequencing data. Briefings in bioinformatics, page
bbs086.
129

[Pak and Roth, 2013] Pak, T. R. and Roth, F. P. (2013). ChromoZoom: a flexible, fluid, web-based
genome browser. Bioinformatics, 29(3):384–386.
[Pavlopoulos et al., 2013] Pavlopoulos, G. A., Oulas, A., Iacucci, E., Sifrim, A., Moreau, Y., Schneider,
R., Aerts, J., and Iliopoulos, I. (2013). Unraveling genomic variation from next generation
sequencing data. BioData mining, 6(1).
[Pearson, 2013] Pearson, B. (2013). The FASTA program package. http://faculty.virginia.edu/
wrpearson/fasta/fasta_guide.pdf.
[Pevsner, 2009] Pevsner, J. (2009). Bioinformatics and Functional Genomics. John Wiley & Sons.
[Podicheti et al., 2009] Podicheti, R., Gollapudi, R., and Dong, Q. (2009). WebGBrowse–a web server
for GBrowse. Bioinformatics, 25(12):1550–1.
[Prlic et al., 2007] Prlic, A., Down, T. A., Kulesha, E., Finn, R. D., Kahari, A., and Hubbard, T. J.
(2007). Integrating sequence and structural biology with DAS. BMC bioinformatics, 8(1):333.
[Rosenbloom et al., 2015] Rosenbloom, K. R., Armstrong, J., Barber, G. P., Casper, J., Clawson, H.,
Diekhans, M., Dreszer, T. R., Fujita, P. A., Guruvadoo, L., Haeussler, M., et al. (2015). The
UCSC Genome Browser database: 2015 update. Nucleic Acids Research, 43(D1):D670–D681.
[Saito et al., 2009] Saito, T. L., Yoshimura, J., Sasaki, S., Ahsan, B., Sasaki, A., Kuroshu, R., and Mor-
ishita, S. (2009). UTGB toolkit for personalized genome browsers. Bioinformatics, 25(15):1856–
1861.
[Sen et al., 2010] Sen, T. Z., Harper, L. C., Schaeffer, M. L., Andorf, C. M., Seigfried, T. E., Campbell,
D. A., and Lawrence, C. J. (2010). Choosing a genome browser for a Model Organism Database:
surveying the maize community. Database (Oxford), 2010:baq007.
[Skinner and Holmes, 2010] Skinner, M. E. and Holmes, I. H. (2010). Setting Up the JBrowse Genome
Browser. Current Protocols in Bioinformatics, pages 9–13.
[Skinner et al., 2009] Skinner, M. E., Uzilov, A. V., Stein, L. D., Mungall, C. J., and Holmes, I. H. (2009).
JBrowse: a next-generation genome browser. Genome research, 19(9):1630–8.
[Smith, 2000] Smith, G. (2000). The Object-Z specification language, volume 101. Kluwer Academic.
[Soh et al., 2012] Soh, J., Gordon, P., and Sensen, C. (2012). Genome Annotation. Chapman & Hall/CRC
Mathematical & Computational Biology. Taylor & Francis.
[Spivey, 1992] Spivey, J. M. (1992). The Z notation: a reference manual. International Series in Computer
Science.
130

[Stalker et al., 2004] Stalker, J., Gibbins, B., Meidl, P., Smith, J., Spooner, W., Hotz, H.-R., and Cox,
A. V. (2004). The Ensembl Web site: mechanics of a genome browser. Genome research,
14(5):951–955.
[Stein, 2001] Stein, L. (2001). Genome annotation: from sequence to biology. Nature reviews genetics,
2(7):493–503.
[Stein, 2013] Stein, L. D. (2013). Using GBrowse 2.0 to visualize and share next-generation sequence
data. Brief Bioinform, 14(2):162–71.
[Stein et al., 2002] Stein, L. D., Mungall, C., Shu, S., Caudy, M., Mangone, M., Day, A., Nickerson, E.,
Stajich, J. E., Harris, T. W., Arva, A., and Lewis, S. (2002). The generic genome browser: a
building block for a model organism system database. Genome research, 12(10):1599–610.
[Stothard and Wishart, 2005] Stothard, P. and Wishart, D. S. (2005). Circular genome visualization and
exploration using CGView. Bioinformatics, 21(4):537–539.
[Suryanarayana et al., 2014] Suryanarayana, G., Sharma, T., and Samarthyam, G. (2014). Refactoring
for software design smells. Elsevier Science.
[Tao et al., 2004] Tao, Y., Liu, Y., Friedman, C., and Lussier, Y. A. (2004). Information visualization
techniques in bioinformatics during the postgenomic era. Drug Discovery Today: BIOSILICO,
2(6):237–245.
[The Institute of Electrical and Electronics Engineers, 1998] The Institute of Electrical and Electronics
Engineers, editor (1998). IEEE Recommended Practice for Software Requirements Specifications.
Institute of Electrical and Electronics Engineers.
[Toyoda et al., 2007] Toyoda, T., Mochizuki, Y., Player, K., Heida, N., Kobayashi, N., and Sakaki,
Y. (2007). OmicBrowse: a browser of multidimensional omics annotations. Bioinformatics,
23(4):524–526.
[Upton et al., 2000] Upton, C., Hogg, D., Perrin, D., Boone, M., and Harris, N. L. (2000). Viral genome
organizer: a system for analyzing complete viral genomes. Virus research, 70(1):55–64.
[W3Schools, 2014a] W3Schools (2014a). HTML5 Canvas. http://www.w3schools.com/html/html5_
canvas.asp.
[W3Schools, 2014b] W3Schools (2014b). HTML5 SVG. http://www.w3schools.com/html/html5_svg.
asp.
[Wang et al., 2013a] Wang, J., Kong, L., Gao, G., and Luo, J. (2013a). A brief introduction to web-based
genome browsers. Brief Bioinform, 14(2):131–43.
131

[Wang et al., 2013b] Wang, T., Liu, J., Shen, L., Tonti-Filippini, J., Zhu, Y., Jia, H., Lister, R., Ecker,
J., Millar, A. H., Ren, B., et al. (2013b). STAR: an integrated solution to management and
visualization of sequencing data. Bioinformatics, page btt558.
[Westesson et al., 2012] Westesson, O., Skinner, M., and Holmes, I. (2012). Visualizing next-generation
sequencing data with JBrowse. Briefings in bioinformatics, page bbr078.
[Woodcock and Davies, 1996] Woodcock, J. and Davies, J. (1996). Using Z: Specification, Refinement,
and Proof. Prentice-Hall international series in computer science. Prentice Hall.
[Yandell and Ence, 2012] Yandell, M. and Ence, D. (2012). A beginner’s guide to eukaryotic genome
annotation. Nature Reviews Genetics, 13(5):329–342.
[Yates et al., 2008] Yates, T., Okoniewski, M. J., and Miller, C. J. (2008). X: Map: annotation and
visualization of genome structure for Affymetrix exon array analysis. Nucleic Acids Research,
36(suppl 1):D780–D786.
[Zainol and Wang, 2011] Zainol, Z. and Wang, B. (2011). A Formal Specification of G-DTD: A Concep-
tual Model to Describe XML Documents. In ICSEA 2011, The Sixth International Conference
on Software Engineering Advances, pages 338–347.
[Zhou et al., 2013] Zhou, X., Lowdon, R. F., Li, D., Lawson, H. A., Madden, P. A., Costello, J. F.,
and Wang, T. (2013). Exploring long-range genome interactions using the WashU Epigenome
Browser. Nature methods, 10(5):375–376.
[Zhou et al., 2011] Zhou, X., Maricque, B., Xie, M., Li, D., Sundaram, V., Martin, E. A., Koebbe, B. C.,
Nielsen, C., Hirst, M., Farnham, P., et al. (2011). The human epigenome browser at Washington
University. Nature methods, 8(12):989–990.
132

Appendix A
Flat File Format
In bioinformatics, Flat Files are text files used to store and transfer various biological data and there
are numerous file formats used to represent those various types of information. These files normally
contain records each record correspond to a row in a table and these records have no structured
relationships and to interpret these files, the format properties of the file should be known [McEntyre
and Ostell, 2002]. Nonetheless ,they are considered as the basic data representation of biological data
due to their simplicity and ease of distribution. Consequently,they became the center of data flow
in molecular biology and as a result,today every biological data collection has to be represented as
flat files since most of the biological analysis programs use them as their main data source including
Genome Browsers [Letovsky, 1999]. A lot of file formats are used by Genome browsers as their main
input or data source so knowing those format is very important.Therefore, this section is dedicated
to gather and document the specification of the different flat file formats.
A.1 FASTA File Format
A.1.1 Definition
FASTA is a text-based format for representing either nucleotide sequences or peptide sequences, in
which nucleotides or amino acids are represented using single-letter codes. The format also allows
for sequence names and comments to precede the sequences. It originates from the FASTA software
package, but has now become a standard in the field of bioinformatics.FASTA is pronounced ”fast
A”, and stands for ”FAST-All”, because it works with any alphabet,The FASTA format is sometimes
also referred to as the ”Pearson” format (after the author of the FASTA program).The simplicity
of FASTA format makes it easy to manipulate and parse sequences using text-processing tools and
scripting languages like Python, Ruby, and Perl.The information provided here are gathered from
two sources http://zhanglab.ccmb.med.umich.edu/FASTA/ and [Pearson, 2013].
133

A.1.2 Description
The FASTA format specification are listed below: FASTA format files consist of a description line,
beginning with a (”>”) character, followed by the sequence itself:
>sequence name and description 1
A F A S Y T .... actual sequence.
F S S .... second line of sequence.
>sequence name and description 2
PMILTYV ... sequence 2
FASTA format files from major sequence distributors, like the NCBI and EBI, have specially
formatted description lines, e.g.:
>gi|54321|ref|np 12345| example NCBI refseq sequence
or
>sw:gstm1 human P01234 glutathione transferase GSTM1 - human
Sequences are expected to be represented in the standard IUB/IUPAC amino acid and nucleic acid
codes, with these exceptions:
• lower-case letters are accepted and are mapped into upper-case.
• a single hyphen or dash can be used to represent a gap of indeterminate length.
• in amino acid sequences, U and * are acceptable letters (see below).
• any numerical digits in the query sequence should either be removed or replaced by appropriate
letter codes (e.g., N for unknown nucleic acid residue or X for unknown amino acid residue).
A.1.3 Details
The detail specification of FASTA files are listed below:
• A sequence in FASTA format begins with a single-line description, followed by lines of sequence
data.
• The description line is distinguished from the sequence data by a greater-than (”>”) symbol
in the first column, followed by a sequence identification code which optionally can be followed
by a textual description of the sequence.
134

• A file in FASTA format may comprise more than one sequence.
• There is no standard file extension for a text file containing FASTA formatted sequences.
• There should be no space between the ”>” and the first letter of the identifier.
• It is recommended that all lines of text be shorter than 80 characters.
• The sequence ends if another line starting with a ”>” appears; this indicates the start of
another sequence.
• Blank lines are not allowed in the middle of FASTA input.
• Normally, identifiers are simply protein accession, name or Entrez gi’s (e.g., Q5I7T1, AG10B HUMAN,
129295), but a bar-separated NCBI sequence identifier (e.g., gi—129295) will also be accepted.
• There are no standard file extension for FASTA files all the following are treated as FASTA
files in most programs .fa(most commonly used extension), .fasta, .fast, .seq, .dna.
An example sequence in FASTA format is:
>crab_anapl ALPHA CRYSTALLIN B CHAIN (ALPHA(B)-CRYSTALLIN).
MDITIHNPLIRRPLFSWLAPSRIFDQIFGEHLQESELLPASPSLSPFLMR
SPIFRMPSWLETGLSEMRLEKDKFSVNLDVKHFSPEELKVKVLGDMVEIH
GKHEERQDEHGFIAREFNRKYRIPADVDPLTITSSLSLDGVLTVSAPRKQ
SDVPERSIPITREEKPAIAGAQRK
The accepted nucleic acid codes are:
A → adenosine M → A C (amino)
C → cytidine S → G C (strong)
G → guanine W → A T (weak)
T → thymidine B → G T C
U → uridine D → G A T
R → G A (purine) H→ A C T
Y→ T C (pyrimidine) V → G C A
K → G T (keto) N → A G C T (any)
- gap of indeterminate length.
135

The accepted amino acid codes are:
A alanine P proline
B aspartate or asparagine Q glutamine
C cystine R arginine
D aspartate S serine
E glutamate T threonine
F phenylalanine U selenocysteine
G glycine V valine
H histidine W tryptophan
I isoleucine Y tyrosine
K lysine Z glutamate or glutamine
L leucine X any
M methionine * translation stop
N asparagine - gap of indeterminate length
A.2 GFF File Format
A.2.1 Definition
GFF is one of the standard and widely used plain text file format for transferring and storing of
genomic data. GFF stands for ‘Gene-Finding Format’ or ‘General Feature Format’. This format
has been proposed by Richard Durbin and David Haussler as a protocol for transferring of feature
information. In this file format each feature is described in one line without order relevance in a
record-based structure that has nine required fields or columns that must be tab-separated. A GFF
record is an extension of the basic (name, start, end) or ‘NSE’ tuple that can be used to identify
substring of a biological sequence. It is basically implemented to be easy to parse and proceed by
different programs and languages .
This file format has undergone three version changes until now and the last version being
GFF3. Furthermore, the following specification are gathered from their original sources as the
specification of the first two versions (GFF and GFF2) are found at the Sanger Institute website
https://www.sanger.ac.uk/resources/software/gff/spec.html while the specification of the
third version GFF3 is on the Sequences Ontology website http://www.sequenceontology.org/
resources/gff3.html.
136

A.2.2 Description of GFF version1 and 2
This section describes the GFF version 1 and version 2 file format which is basically a simpletab-separates text file that has nine required fields. All values of the mandatory fields should notinclude whitespace (i.e. the strings for < seqnam>, < source> and < feature> fields). The fieldsof a GFF file are:
< seqname> <source> <feature> <start> <end> < score> < strand> <frame> [attribute] [comments]
With the changes taking place to version 2 of the format, the feature sets can be defined over
RNA and Protein sequences, as well as genomic DNA.
A.2.3 Details of GFF version1 and 2
Column Desceiption
<seqname> The name of the sequence. This column is normally filled with the sequence identi-
fier in a fasta format file or in a public database, such as the accession numbers in an
EMBL/Genbank/DDBJ databases.
< source> The source of this feature. This field is used to indicate the program that is making
the prediction, or if the feature comes from a public database annotation, or if it is
experimentally verified, etc.
< feature> The feature type name. The name of this type of feature.
< start>, <
end>
< start> is the starting position of the feature in the sequence while < end> is the ending
position of the feature (inclusive). < start> and < end> are integer values such that <
start> must be less or equal to < end>. Sequence numbering start at 1, so < start> and
< end> should be between 1 and the length of the relevant sequence, inclusive.
< score> This field takes a floating-point value. In the case of no score a ‘.’ is used.
< strand> This field takes ,‘+’ for positive strand, or ‘-’ for negative strand, or ‘.’ when the strand
is not relevant such in the case of dinucleotide repeats.
< frame> This field is used to indicate the reading frame of the first base in the case of a coding
exon feature in that case it should be a number between 0-2. If the feature is not a coding
exon, the value should be ‘.’. So this field takes one of ‘0’ ,‘1’, ‘2’, ‘.’ . ‘0’ indicates that
the specified region is in frame, i.e. that its first base corresponds to the first base of a
codon. ‘1’ indicates that there is one extra base, i.e. that the second base of the region
corresponds to the first base of a codon, and ‘2’ means that the third base of the region is
the first base of a codon. If the strand is ‘-’, then the first base of the region is value of <
end>, because the corresponding coding region will run from < end> to < start> on the
reverse strand. As with < strand>, if the frame is not relevant then set < frame> to ‘.’.
137

[attribute] From version 2 onwards, the attribute field must have a tag value structure following the
syntax used within objects in a .ace file, flattened onto one line by semicolon separators.
Tags must be standard identifiers ([A-Za-z][A-Za-z0-9]*). Free text values must be quoted
with double quotes. Note: all nonprinting characters in such free text value strings (e.g.
newlines, tabs, control characters, etc) must be explicitly represented by their C (UNIX)
style backslash escaped representation (e.g. newlines as ‘\n’, tabs as ‘\t’). As in ACEDB,
multiple values can follow a specific tag.
[Comments]
Comments are allowed and they start with # so everything follows the # until the end of the line
is ignored. Comments can be either at the beginning of a line to make the whole line a comment
or it can be after all the required fields of the line.
There is a set of standardized (i.e parsable) ## line types that can be optionally used at the top
of a GFF file, the proposed ## lines are as follows:
Gff-version ##gff-version 2
Specifies the GFF verion.
Source-
version
##source-version <source> <version text>
Records what version of a program or package was used to make the data in this file. It
is suggested that the version is text without whitespaces.
Date ##date <date>
The date the file was made. It has been suggested to use astronomical format like 1997-11-
08 for two reasons first, because they sort properly and second, to avoid any US/European
bias.
Type ##Type <type> [<seqname>]
The type of host sequence described by the features. Standard types are ‘DNA’, ‘Protein’
and ‘RNA’. The optional <seqname> allows multiple ##Type definitions describing mul-
tiple GFF sets in one file, each of which have a distinct type.
DNA ##DNA <seqname>
##acggctcggattggcgctggatgatagatcagacgac
##...
##end-DNA
Used to give a DNA sequence because it was thought of as being convenient yet very little
used since the sequence name is a well known identifier to an easily retrievable sequence
located in a database or in another file.
RNA ##RNA <seqname>
138

##acggcucggauuggcgcuggaugauagaucagacgac
##...
##end-RNA
This is similar to DNA. Creates an implicit ##Type RNA <seqname> directive.
Protein ##Protein <seqname>
##MVLSPADKTNVKAAWGKVGAHAGEYGAEALERMFLSF
##...
##end-Protein
Also similar to DNA. Creates an implicit ##Type Protein <seqname> directive.
Sequence-
region
##sequence-region <seqname> <start> <end>
Used to indicate that this file only contains entries for the specified sub-region of a se-
quence.
A.2.4 Description of the GFF3 file format
GFF3 files are nine-column, tab-delimited, plain text files.
Undefined fields in a GFF3 file are replaced with the“.” character, as described in the original GFF
specification.
The GFF3 file formats has the following properties:
1. Adds a mechanism for representing more than one level of hierarchical grouping of features
and sub-features.
2. Separates the ideas of group membership and feature name/id.
3. Constrains the feature type field to be taken from a controlled vocabulary.
4. Allows a single feature, such as an exon, to belong to more than one group at a time.
5. Provides an explicit convention for pairwise alignments.
6. Provides an explicit convention for features that occupy disjunct regions.
The GFF3 file contents may include any character in the set supported by the operating environ-
ment, although for portability with other systems, use of Latin-1 or Unicode are recommended.
The nine columns of the GFF3 file record are described bellow:
<seqid> <source> <type> <start> <end> <score> <strand> <phase> [attributes]
139

A.2.5 Details of the GFF3 file format
Column Desceiption
<seqid> The ID of the landmark used to establish the coordinate system for the current fea-
ture. IDs may contain any characters, but must escape any characters not in the set
[a-zA-Z0-9.:^ *$@!+_?- |]. In particular, IDs may not contain unescaped whitespace and must
not begin with an unescaped “ > ”.
<source> The source is a free text qualifier intended to describe the algorithm or operating procedure that
generated this feature. Typically this is the name of a piece of software.
<type> The type of the feature. This column is constrained to be either: a term from the “lite” version
of the Sequence Ontology or a SOFA, a term from the full Sequence Ontology,or SO accession
number.
<start>,<end>The start and end coordinates of the feature are given in positive 1-based integer coordinates,
relative to the landmark given in column 1. Start is always less than or equal to end. For features
that cross the origin of a circular feature (e.g. most bacterial genomes, plasmids, and some viral
genomes), the requirement for start to be less than or equal to end is satisfied by making end =
the position of the end + the length of the landmark feature. For zero-length features, such as
insertion sites, start equals end and the implied site is to the right of the indicated base in the
direction of the landmark.
<score> The score of the feature, a floating point number. As in earlier versions of the format, the semantics
of the score are ill-defined. It is strongly recommended that E-values be used for sequence similarity
features, and that P-values be used for ab initio gene prediction features.
<strand> The strand of the feature. + for positive strand (relative to the landmark), - for minus strand, and
. for features that are not stranded. In addition, ? can be used for features whose strandedness is
relevant, but unknown.
<phase> For features of type “CDS”, the phase indicates where the feature begins with reference to the
reading frame. The phase is one of the integers 0, 1, or 2, indicating the number of bases that
should be removed from the beginning of this feature to reach the first base of the next codon. In
other words, a phase of “0” indicates that the next codon begins at the first base of the region
described by the current line, a phase of “1” indicates that the next codon begins at the second
base of this region, and a phase of “2” indicates that the codon begins at the third base of this
region. This is NOT to be confused with the frame, which is simply start modulo 3. For forward
strand features, phase is counted from the start field. For reverse strand features, phase is counted
from the end field. The phase is REQUIRED for all CDS features.
[attributes] A list of feature attributes in the format tag=value. Multiple tag=value pairs are separated by
semicolons. URL escaping rules are used for tags or values containing the following characters:
“,=;”. Spaces are allowed in this field, but tabs must be replaced with the %09 URL escape.
Attribute values do not need to be and should not be quoted. The quotes should be included as
part of the value by parsers and not stripped.
The tags of the attributes filed have predefined meanings which is listed below:
Tag Description
140

ID Indicates the ID of the feature. IDs for each feature must be unique within the scope of
the GFF file.
Name Display name for the feature. This is the name to be displayed to the user. Unlike IDs,
there is no requirement that the Name be unique within the file.
Alias A secondary name for the feature. It is suggested that this tag be used whenever a
secondary identifier for the feature is needed, such as locus names and accession numbers.
Unlike ID, there is no requirement that Alias be unique within the file.
Parent Indicates the parent of the feature. A parent ID can be used to group exons into tran-
scripts, transcripts into genes, an so forth. A feature may have multiple parents. Parent
can *only* be used to indicate a partof relationship.
Target Indicates the target of a nucleotide-to-nucleotide or protein-to-nucleotide alignment. The
format of the value is “target id start end [strand]”, where strand is optional and may be
“+” or “-”. If the target id contains spaces, they must be escaped as hex escape %20.
Gap The alignment of the feature to the target if the two are not collinear (e.g. contain
gaps). The alignment format is taken from the CIGAR format described in the Exonerate
documentation.
Derives from Used to disambiguate the relationship between one feature and another when the relation-
ship is a temporal one rather than a purely structural ”part of” one. This is needed for
polycistronic genes.
Note A free text note.
Dbxref A database cross reference.
Ontology termA cross reference to an ontology term.
Is circular A flag to indicate whether a feature is circular.
Multiple attributes of the same type are indicated by separating the values with the comma ”,”
character, as in:
Parent=AF2312,AB2812,abc-3
In addition to Parent, the Alias, Note, Dbxref and Ontology term attributes can have multiple
values. Note that attribute names are case sensitive. ”Parent” is not the same as ”parent”. All
attributes that begin with an uppercase letter are reserved for later use. Attributes that begin with
a lowercase letter can be used freely by applications.
A.2.6 The main differences between the three GFF versions
Version 1 note:
In version 1 each string had to be under 256 characters long, and the whole line should under 32k
141

long. This was to make things easier for guaranteed conforming parsers, but seemed unnecessary
given modern languages.
Version 2 changes:
• Version 2 tolerates values of <start> and <end> that extend outside the reference sequence.
• In the <score> field in case of no score 0 was used in version 1.
• <strand> and <frame> fields are left empty ‘.’ in the case of RNA and protein features.
• In version 1 the attribute field was called the group field, with the following specification: The
[group] field is an optional string-valued field that can be used as a name to group together
a set of records. This field was used typically to group the introns and exons in one gene
prediction (or experimentally verified gene structure), or to group multiple regions of match
to another sequence, such as an EST or a protein.
Version 3 changes:
• The naming of some columns have been changed: <seqname> is now <seqid>, <feature> is
now <type> and <frame> in now <phase>.
• Backslash and other ad-hoc escaping conventions are not allowed.
• Literal use of tab, newline, carriage return, the percent (%) sign, and control characters must
be encoded using RFC 3986 Percent-Encoding and no other characters may be encoded. like
the following:
; semicolon (%3B)
= equals (%3D)
& ampersand (%26)
, comma (%2C)
• In this version unescaped spaces are allowed within fields, which means that parsers must
split on tabs, not spaces.
• The use of the plus ‘+’ character to encode spaces is no longer allowed.
A.3 GTF File Format
A.3.1 Definition
GTF (Gene Transfer Format) is a file format used to hold information about gene structure. It is a
tab-delimited text format based on the general feature format (GFF), but contains some additional
142

conventions specific to gene information. A significant feature of the GTF is that it is validatable:
given a sequence and a GTF file, one can check that the format is correct. The specification of this
format can be found at http://mblab.wustl.edu/GTF22.html.
A.3.2 Description
The GTF files follows the same structure as GFF. The only difference is in its use of the attribute
filed. An example is mentioned below.
Example:-
Here is a simple example with 3 translated exons.
AB000381 Twinscan CDS 380 401 . + 0 gene_id "001"; transcript_id "001.1";
AB000381 Twinscan CDS 501 650 . + 2 gene_id "001"; transcript_id "001.1";
AB000381 Twinscan CDS 700 707 . + 2 gene_id "001"; transcript_id "001.1";
AB000381 Twinscan start_codon 380 382 . + 0 gene_id "001"; transcript_id "001.1";
AB000381 Twinscan stop_codon 708 710 . + 0 gene_id "001"; transcript_id "001.1";
A.3.3 Details
The GTF (General Transfer Format) is identical to GFF version 2. So they both have the samefields and their fields must be separated by a single TAB and no white space.
<seqname> <source> <feature> <start> <end> <score> <strand> <frame> [attributes] [comments]
To refer to the detail definition of each of this fields, it can be found in the table at page 138.
In both GTF and GFF version 2 each attribute consists of a type/value pair and attributes must
end in a semi-colon, and it must be separated from any following attribute by exactly one space.
In GTF, the attribute list must begin with the two mandatory attributes:
gene id value A globally unique identifier for the genomic locus of the transcript. If empty, no
gene is associated with this feature.
transcript id value A globally unique identifier for the predicted transcript. If empty, no tran-
script is associated with this feature.
These attributes are designed for handling multiple transcripts from the same genomic region. Any
other attributes or comments must appear after these two and will be ignored. Attributes must end
in a semicolon which must then be separated from the start of any subsequent attribute by exactly
one space character (NOT a tab character). Textual attributes should be surrounded by double
quotes.
143

A.4 BED File Format
A.4.1 Definition
The BED (Browser Extensible Data) format is is a tab-delimated text file, that has been developed
by UCSC for displaying transcript structures in the genome browser and their full description
can be found on their website, which was used as the main source for writing this section http:
//genome.ucsc.edu/FAQ/FAQformat.html.The BED (.bed) format is a flexible format to define
the data lines that are displayed in an annotation track. It is now widely supported in almost every
genome browser.
A.4.2 Description
The BED format consists of one line per feature, each containing 3-12 columns of data, plus optional
track definition lines. The first three fields are required and remaining nine are optional fields.
In this format the number of fields per line must be consistent throughout any single set of data in
an annotation track.
A.4.3 Details
As mentioned in the description the first three fields in each feature line are required.The nine
additional fields are optional.
Note: The order of the optional fields is binding and the columns cannot be empty lower-numbered
fields must always be populated if higher-numbered ones are used. The following table will provide
a description of the 12 fields of the BED format.
# Name Description
1 chrom Name of chromosome (e.g. chr1, chr2, etc.) or scaffold (e.g.
scaffold1).
2 chromStart Start position of the feature in standard chromosomal coor-
dinates (the first base is numbered 0).
3 chromEnd End position of a feature in a the chromosome or scaffold.
4 name Name of the feature.
5 score A number between 0 and 1000 that controls shading of item
(0 if unused).
6 strand Defines the strand + (forward) or - (reverse)(or . for un-
known).
7 thickStart The starting position at which the feature is drawn thickly
(for example, the start codon in gene displays).
144

8 thickEnd The ending position at which the feature is drawn thickly
(for example, the stop codon in gene displays).
9 itemRgb Comma-separated list of red, green, blue values from 0-255
(0 if unused).
10 blockCount For multipart items, the number of blocks corresponds to
exons for genes.
11 blockSizes Comma-separated list of block sizes. Must include final
comma.The number of items in this list should correspond
to blockCount.
12 blockStarts Comma-separated list of block starts relative to chrom-
Start.The number of items in this list should correspond
to blockCount.
Table 11: The standard predefined BED fields.Note:the mandatory field are emphasized
Example:-
Here’s an example ( from the UCSC website ) of an annotation track that uses a complete BED
definition:
track name=pairedReads description="Clone Paired Reads" useScore=1
chr22 1000 5000 cloneA 960 + 1000 5000 0 2 567,488, 0,3512
chr22 2000 6000 cloneB 900 - 2000 6000 0 2 433,399, 0,3601
A.5 BedGraph File Format
A.5.1 Definition
The bedGraph format is line-oriented text files developed by UCSC to allow the display of continuous-
valued data in track format. This display type is useful for probability scores and transcriptome
data. This track type is similar to the WIG format, but unlike the WIG format, data exported in
the bedGraph format are preserved in their original state. The following description of this format
is taken from http://genome.ucsc.edu/goldenPath/help/bedgraph.html
Note: Any valid seq region name can be used, and chromosome names can be given with or without the ’chr’prefix.
The chromEnd base is not included in the display of the feature. For example, the first 100 bases of a chromosomeare defined as chromStart=0, chromEnd=100, and span the bases numbered 0-99 (chromEnd - chromStart = size).
This is used in the track lines to configure the display style of the scored data. While in UCSC If the track lineuseScore attribute is set to 1 for this annotation data set, the score value will determine the level of gray in whichthis feature is displayed (higher numbers = darker gray).
If the track line itemRgb attribute is set to ”On”, this RBG value will determine the display color of the datacontained in this BED line.
145

A.5.2 Description
BedGraph format is a line oriented textual files, which is suitable for displaying moderate amounts
of scored data. It is a BED variant in which the fourth column is a floating point value that is
associated with all the bases between the chromStart and chromEnd positions.
The general structure of these files:
Track definition lines proceed the BedGraph data, which uses a number of options for controlling
the default display of this track. Following the track definition line are the track data in a four
column BED format.
chromA chromStartA chromEndA dataValueA
chromB chromStartB chromEndB dataValueB
This format is based on the BED format with the following differences:
• The score is placed in column 4, not column 5.
• Track lines are compulsory, and must include type=bedGraph.
A.5.3 Details
The Parameters for bedGraph track definition lines
All options are placed in a single line separated by spaces:
track type=bedGraph name=track_label description=center_label visibility=display_mode color=r,g,b altColor=r,g,b priority=priority autoScale=on|off
alwaysZero=on|off gridDefault=on|off maxHeightPixels=max:default:min graphType=bar|points viewLimits=lower:upper yLineMark=real-value
yLineOnOff=on|off windowingFunction=maximum|mean| minimum smoothingWindow=off|2-16
Note: The above example is spread across multiple lines in order to fit into paper, so if you
copy/paste the above example, you have to remove the carriage returns.
The track type is REQUIRED, and must be bedGraph:
type=bedGraph
The remaining values are OPTIONAL.
146

Data Values:
Bedgraph track data values can be integer or real, positive or negative values. Chromosome positions
are specified as 0-relative. The first chromosome position is 0. The last position in a chromosome
of length N would be N - 1. Only positions specified have data. Positions not specified do not have
data and will not be graphed. All positions specified in the input data must be in numerical order.
The bedGraph format has four columns of data:
chrom chromStart chromEnd dataValue
Note: These coordinates are zero-based, half-open.
Example:-
This example specifies 9 separate data points in three tracks on chr19 in the region 49,302,001 to
49,304,701. This example is specific to the UCSC genome browser.
browser position chr19:49302001-49304701
browser hide all
browser pack refGene encodeRegions
browser full altGraph
# 300 base wide bar graph, autoScale is on by default == graphing
# limits will dynamically change to always show full range of data
# in viewing window, priority = 20 positions this as the second graph
# Note, zero-relative, half-open coordinate system in use for bedGraph format
track type=bedGraph name="BedGraph Format" description="BedGraph format" visibility=full color=200,100,0 altColor=0,100,200 priority=20
chr19 49302000 49302300 -1.0
chr19 49302300 49302600 -0.75
chr19 49302600 49302900 -0.50
chr19 49302900 49303200 -0.25
chr19 49303200 49303500 0.0
chr19 49303500 49303800 0.25
chr19 49303800 49304100 0.50
chr19 49304100 49304400 0.75
chr19 49304400 49304700 1.00
A.6 WIG File Format
A.6.1 Definition
A WIG file OR Wiggle format (.wig) is a text file that defines either a feature or data track. It
is an older format of the more widely used BigWig format. This format allows the display of
dense, continuous data such as GC percent, probability scores, and transcriptome data in a track
format. The format specification written here is taken from the UCSC Genome Bioinformatics web
147

site: http://genome.ucsc.edu/goldenPath/help/wiggle.html. Wiggle data elements must be
equally sized.
A.6.2 Description
Wiggle format is line-oriented. According to the UCSC, the first line of wiggle custom tracks must
be a track definition line, which designates the track as a wiggle track and adds a number of options
for controlling the default display. The Wiggle format in general is composed of declaration lines
and data lines.
There are two options for formatting wiggle data:
variableStep and fixedStep. These formats were developed to allow the file to be written as compactly
as possible.
• variableStep is for data with irregular intervals between new data points and is the more
commonly used wiggle format. It begins with a declaration line and is followed by two columns
containing chromosome positions and data values:
variableStep chrom=chrN [span=windowSize]
chromStartA dataValueA
chromStartB dataValueB
... etc ... ... etc ...
The declaration line starts with the word variableStep and is followed by a specification for
a chromosome. The optional span parameter (default: span=1) allows data composed of
contiguous runs of bases with the same data value to be specified more succinctly. The span
begins at each chromosome position specified and indicates the number of bases that data
value should cover. For example, this variableStep specification:
variableStep chrom=chr2
300701 12.5
300702 12.5
300703 12.5
300704 12.5
300705 12.5
148

is equivalent to:
variableStep chrom=chr2 span=5
300701 12.5
Both versions display a value of 12.5 at position 300701-300705 on chromosome 2.
Caution for sparse variableStep data The wiggle format was designed for quickly display-
ing data that is quite dense. The variableStep format, in particular, becomes very inefficient
when there are only a few data points per 1,024 bases. If variableStep data points (i.e., chrom-
Starts) are greater than about 100 bases apart, it is advisable to use BedGraph format.
• fixedStep is used for data with regular intervals between new data values and it is the more
compact wiggle format. It begins with a declaration line and is followed by a single column
of data values:
fixedStep chrom=chrN start=position step=stepInterval [span=windowSize]
dataValue1
dataValue2
... etc ...
The declaration line starts with the word fixedStep and includes specifications for chromosome,
start coordinate, and step size. The span specification has the same meaning as in variableStep
format. For example, this fixedStep specification:
fixedStep chrom=chr3 start=400601 step=100
11
22
33
displays the values 11, 22, and 33 as single-base regions on chromosome 3 at positions 400601,
400701, and 400801, respectively. Adding span=5 to the declaration line:
149

fixedStep chrom=chr3 start=400601 step=100 span=5
11
22
33
causes the values 11, 22, and 33 to be displayed as 5-base regions on chromosome 3 at positions
400601-400605, 400701-400705, and 400801-400805, respectively.
Note that for both variableStep and fixedStep formats, the same span must be used throughout the
dataset. If no span is specified, the default span of 1 is used.
As the name suggests, fixedStep wiggles require the same size step throughout the dataset. If
not specified, a step size of 1 is used.
Data Values:
Wiggle track data values can be integer or real, positive or negative values. Chromosome posi-
tions are specified as 1-relative. For a chromosome of length N, the first position is 1 and the last
position is N. Only positions specified have data. Positions not specified do not have data and will
not be graphed. All positions specified in the input data must be in numerical order.
Example:-
This example specifies 19 separate data points in two tracks in the region chr19:49,304,200-49,310,700. This example is specific to the UCSC genome browser.
browser position chr19:49304200-49310700
browser hide all
# 150 base wide bar graph at arbitrarily spaced positions,
# threshold line drawn at y=11.76
# autoScale off viewing range set to [0:25]
# priority = 10 positions this as the first graph
# Note, one-relative coordinate system in use for this format
track type=wiggle_0 name="variableStep" description="variableStep format" visibility=full autoScale=off viewLimits=0.0:25.0 color=50,150,255
yLineMark=11.76 yLineOnOff=on priority=10
variableStep chrom=chr19 span=150
49304701 10.0
49304901 12.5
49305401 15.0
49305601 17.5
49305901 20.0
49306081 17.5
49306301 15.0
49306691 12.5
49307871 10.0
# 200 base wide points graph at every 300 bases, 50 pixel high graph
# autoScale off and viewing range set to [0:1000]
# priority = 20 positions this as the second graph
# Note, one-relative coordinate system in use for this format
track type=wiggle_0 name="fixedStep" description="fixedStep format" visibility=full autoScale=off viewLimits=0:1000 color=0,200,100 maxHeightPixels=100:50:20
graphType=points priority=20
150

fixedStep chrom=chr19 start=49307401 step=300 span=200
1000
900
800
700
600
500
400
300
200
100
A.7 The Chain File Format
A.7.1 Definition
The chain format describes a pairwise alignment that allow gaps in both sequences simultaneously.
Each set of chain alignments starts with a header line, contains one or more alignment data lines,
and terminates with a blank line. The format is deliberately quite dense. This specification is found
on the UCSC website https://genome.ucsc.edu/goldenPath/help/chain.html.
A.7.2 Description
This format has header lines and alignment data lines which can be seen in the following example.Example:-
chain 4900 chrY 58368225 + 25985403 25985638 chr5 151006098 - 43257292 43257528 1
9 1 0
10 0 5
61 4 0
16 0 4
42 3 0
16 0 8
14 1 0
3 7 0
48
chain 4900 chrY 58368225 + 25985406 25985566 chr5 151006098 - 43549808 43549970 2
16 0 2
60 4 0
10 0 4
70
151

A.7.3 Details
This section will mention the details of this format.
Header Lines:
The initial header line starts with the keyword chain, followed by 11 required attribute values, and
ending with a blank line.
chain score tName tSize tStrand tStart tEnd qName qSize qStrand qStart qEnd id
Those 11 attributes are:
score chain score.
tName chromosome (reference sequence).
tSize chromosome size (reference sequence).
tStrand strand (reference sequence).
tStart alignment start position (reference sequence).
tEnd alignment end position (reference sequence).
qName chromosome (query sequence).
qSize chromosome size (query sequence).
qStrand strand (query sequence).
qStart alignment start position (query sequence).
qEnd alignment end position (query sequence).
id chain ID.
The alignment start and end positions are represented as zero-based half-open intervals. For
example, the first 100 bases of a sequence would be represented with start position = 0 and end
position = 100, and the next 100 bases would be represented as start position = 100 and end
position = 200. When the strand value is ”-”, position coordinates are listed in terms of the
reverse-complemented sequence.
Alignment Data Lines:
Alignment data lines contain three required attribute values:
size dt dq
152

size the size of the ungapped alignment.
dt the difference between the end of this block and the beginning of the next block (reference
sequence).
dq the difference between the end of this block and the beginning of the next block (query sequence).
NOTE: The last line of the alignment section contains only one number: the ungapped alignment
size of the last block.
A.8 The SAM File Format
SAM stands for Sequence Alignment/Map format. It is a TAB-delimited text format consisting of
a header section, which is optional, and an alignment section. If present, the header must be prior
to the alignments. Header lines start with ‘@’, while alignment lines do not. Each alignment line
has 11 mandatory fields for essential alignment information such as mapping position, and variable
number of optional fields for flexible or aligner specific information. The master version of this
document can be found at https://github.com/samtools/hts-specs.
An example
Suppose we have the following alignment with bases in lower cases clipped from the alignment.
Read r001/1 and r001/2 constitute a read pair; r003 is a chimeric read; r004 represents a split
alignment.
Coor 12345678901234 5678901234567890123456789012345
ref AGCATGTTAGATAA**GATAGCTGTGCTAGTAGGCAGTCAGCGCCAT
+r001/1 TTAGATAAAGGATA*CTG
+r002 aaaAGATAA*GGATA
+r003 gcctaAGCTAA
+r004 ATAGCT..............TCAGC
-r003 ttagctTAGGC
-r001/2 CAGCGGCAT
The corresponding SAM format is:
153

@HD VN:1.5 SO:coordinate
@SQ SN:ref LN:45
r001 99 ref 7 30 8M2I4M1D3M = 37 39 TTAGATAAAGGATACTG *
r002 0 ref 9 30 3S6M1P1I4M * 0 0 AAAAGATAAGGATA *
r003 0 ref 9 30 5S6M * 0 0 GCCTAAGCTAA * SA:Z:ref,29,-,6H5M,17,0;
r004 0 ref 16 30 6M14N5M * 0 0 ATAGCTTCAGC *
r003 2064 ref 29 17 6H5M * 0 0 TAGGC * SA:Z:ref,9,+,5S6M,30,1;
r001 147 ref 37 30 9M = 7 -39 CAGCGGCAT * NM:i:1
Terminologies and Concepts
Template A DNA/RNA sequence part of which is sequenced on a sequencing machine or assembled
from raw sequences.
Segment A contiguous sequence or subsequence.
Read A raw sequence that comes off a sequencing machine. A read may consist of multiple
segments. For sequencing data, reads are indexed by the order in which they are sequenced.
Linear alignment An alignment of a read to a single reference sequence that may include inser-
tions, deletions, skips and clipping, but may not include direction changes (i.e. one portion
of the alignment on forward strand and another portion of alignment on reverse strand). A
linear alignment can be represented in a single SAM record.
Chimeric alignment An alignment of a read that cannot be represented as a linear alignment.
A chimeric alignment is represented as a set of linear alignments that do not have large
overlaps. Typically, one of the linear alignments in a chimeric alignment is considered the
“representative” alignment, and the others are called “supplementary” and are distinguished
by the supplementary alignment flag. All the SAM records in a chimeric alignment have the
same QNAME and the same values for 0x40 and 0x80 flags (see Section 1.4). The decision
regarding which linear alignment is representative is arbitrary.
Read alignment A linear alignment or a chimeric alignment that is the complete representation
of the alignment of the read.
Multiple mapping The correct placement of a read may be ambiguous, e.g. due to repeats. In
this case, there may be multiple read alignments for the same read. One of these alignments
is considered primary. All the other alignments have the secondary alignment flag set in the
154

SAM records that represent them. All the SAM records have the same QNAME and the
same values for 0x40 and 0x80 flags. Typically the alignment designated primary is the best
alignment, but the decision may be arbitrary.
1-based coordinate system A coordinate system where the first base of a sequence is one. In this
coordinate system, a region is specified by a closed interval. For example, the region between
the 3rd and the 7th bases inclusive is [3, 7]. The SAM, VCF, GFF and Wiggle formats are
using the 1-based coordinate system.
0-based coordinate system A coordinate system where the first base of a sequence is zero. In
this coordinate system, a region is specified by a half-closed-half-open interval. For example,
the region between the 3rd and the 7th bases inclusive is [2, 7). The BAM, BCFv2, BED, and
PSL formats are using the 0-based coordinate system.
Phred scale Given a probability 0 < p 6 1, the phred scale of p equals −10 log10 p, rounded to
the closest integer.
A.8.1 The header section
Each header line begins with character ‘@’ followed by a two-letter record type code. In the header,
each line is TAB-delimited and except the @CO lines, each data field follows a format ‘TAG:VALUE’
where TAG is a two-letter string that defines the content and the format of VALUE. Each header line
should match: /^@[A-Za-z][A-Za-z](\t[A-Za-z][A-Za-z0-9]:[ -~]+)+$/ or /^@CO\t.*/. Tags containing
lowercase letters are reserved for end users.
The following table give the defined record types and tags. Tags with ‘*’ are required when the
record type is present.
Tag Description
@HD The header line. The first line if present.
VN* Format version. Accepted format : /^[0-9]+\.[0-9]+$/.
A chimeric alignment is primarily caused by structural variations, gene fusions, misassemblies, RNA-seq orexperimental protocols. It is more frequent given longer reads. For a chimeric alignment, the linear alignmentsconsisting of the aligment are largely non-overlapping; each linear alignment may have high mapping quality andis informative in SNP/INDEL calling. In contrast, multiple mappings are caused primarily by repeats. They areless frequent given longer reads. If a read has multiple mappings, all these mappings are almost entirely overlappingwith each other; except the single-best optimal mapping, all the other mappings get mapping quality <Q3 and areignored by most SNP/INDEL callers.
155

SO Sorting order of alignments. Valid values: unknown (default), unsorted,
queryname and coordinate. For coordinate sort, the major sort key is the
RNAME field, with order defined by the order of @SQ lines in the header. The
minor sort key is the POS field. For alignments with equal RNAME and POS,
order is arbitrary. All alignments with ‘*’ in RNAME field follow alignments with
some other value but otherwise are in arbitrary order.
@SQ Reference sequence dictionary. The order of @SQ lines defines the alignment sort-
ing order.
SN* Reference sequence name. Each @SQ line must have a unique SN tag. The value of
this field is used in the alignment records in RNAME and PNEXT fields. Regular
expression: [!-)+-<>-~][!-~]*
LN* Reference sequence length. Range: [1,231-1]
AS Genome assembly identifier.
M5 MD5 checksum of the sequence in the uppercase, excluding spaces but including
pads (as ‘*’s).
SP Species.
UR URI of the sequence. This value may start with one of the standard protocols,
e.g http: or ftp:. If it does not start with one of these protocols, it is assumed to
be a file-system path.
@RG Read group. Unordered multiple @RG lines are allowed.
ID* Read group identifier. Each @RG line must have a unique ID. The value of ID is
used in the RG tags of alignment records. Must be unique among all read groups
in header section. Read group IDs may be modified when merging SAM files in
order to handle collisions.
CN Name of sequencing center producing the read.
DS Description.
DT Date the run was produced (ISO8601 date or date/time).
FO Flow order. The array of nucleotide bases that correspond to the nu-
cleotides used for each flow of each read. Multi-base flows are encoded in IU-
PAC format, and non-nucleotide flows by various other characters. Format :
/\*|[ACMGRSVTWYHKDBN]+/
KS The array of nucleotide bases that correspond to the key sequence of each read.
LB Library.
PG Programs used for processing the read group.
PI Predicted median insert size.
PL Platform/technology used to produce the reads. Valid values: CAPILLARY, LS454,
ILLUMINA, SOLID, HELICOS, IONTORRENT and PACBIO.
PU Platform unit (e.g. flowcell-barcode.lane for Illumina or slide for SOLiD). Unique
identifier.
156

SM Sample. Use pool name where a pool is being sequenced.
@PG Program.
ID* Program record identifier. Each @PG line must have a unique ID. The value of ID
is used in the alignment PG tag and PP tags of other @PG lines. PG IDs may be
modified when merging SAM files in order to handle collisions.
PN Program name
CL Command line
PP Previous @PG-ID. Must match another @PG header’s ID tag. @PG records may be
chained using PP tag, with the last record in the chain having no PP tag. This
chain defines the order of programs that have been applied to the alignment. PP
values may be modified when merging SAM files in order to handle collisions of
PG IDs. The first PG record in a chain (i.e. the one referred to by the PG tag
in a SAM record) describes the most recent program that operated on the SAM
record. The next PG record in the chain describes the next most recent program
that operated on the SAM record. The PG ID on a SAM record is not required to
refer to the newest PG record in a chain. It may refer to any PG record in a chain,
implying that the SAM record has been operated on by the program in that PG
record, and the program(s) referred to via the PP tag.
DS Description.
VN Program version
@CO One-line text comment. Unordered multiple @CO lines are allowed.
A.8.2 The alignment section: mandatory fields
In the SAM format, each alignment line typically represents the linear alignment of a segment. Each
line has 11 mandatory fields. These fields always appear in the same order and must be present, but
their values can be ‘0’ or ‘*’ (depending on the field) if the corresponding information is unavailable.
The following table gives an overview of the mandatory fields in the SAM format:
157

Col Field Type Regexp/Range Brief description
1 QNAME String [!-?A-~]{1,255} Query template NAME
2 FLAG Int [0,216-1] bitwise FLAG
3 RNAME String \*|[!-()+-<>-~][!-~]* Reference sequence NAME
4 POS Int [0,231-1] 1-based leftmost mapping POSition
5 MAPQ Int [0,28-1] MAPping Quality
6 CIGAR String \*|([0-9]+[MIDNSHPX=])+ CIGAR string
7 RNEXT String \*|=|[!-()+-<>-~][!-~]* Ref. name of the mate/next read
8 PNEXT Int [0,231-1] Position of the mate/next read
9 TLEN Int [-231+1,231-1] observed Template LENgth
10 SEQ String \*|[A-Za-z=.]+ segment SEQuence
11 QUAL String [!-~]+ ASCII of Phred-scaled base QUALity+33
1. QNAME: Query template NAME. Reads/segments having identical QNAME are regarded to
come from the same template. A QNAME ‘*’ indicates the information is unavailable. In a
SAM file, a read may occupy multiple alignment lines, when its alignment is chimeric or when
multiple mappings are given.
2. FLAG: bitwise FLAG. Each bit is explained in the following table:
Bit Description
0x1 template having multiple segments in sequencing
0x2 each segment properly aligned according to the aligner
0x4 segment unmapped
0x8 next segment in the template unmapped
0x10 SEQ being reverse complemented
0x20 SEQ of the next segment in the template being reversed
0x40 the first segment in the template
0x80 the last segment in the template
0x100 secondary alignment
0x200 not passing quality controls
0x400 PCR or optical duplicate
0x800 supplementary alignment
• For each read/contig in a SAM file, it is required that one and only one line associated
with the read satisfies ‘FLAG & 0x900 == 0’. This line is called the primary line of the
read.
• Bit 0x100 marks the alignment not to be used in certain analyses when the tools in use
are aware of this bit. It is typically used to flag alternative mappings when multiple
mappings are presented in a SAM.
158

• Bit 0x800 indicates that the corresponding alignment line is part of a chimeric alignment.
A line flagged with 0x800 is called as a supplementary line.
• Bit 0x4 is the only reliable place to tell whether the read is unmapped. If 0x4 is set,
no assumptions can be made about RNAME, POS, CIGAR, MAPQ, bits 0x2, 0x10, 0x100
and 0x800, and the bit 0x20 of the previous read in the template.
• If 0x40 and 0x80 are both set, the read is part of a linear template, but it is neither the
first nor the last read. If both 0x40 and 0x80 are unset, the index of the read in the
template is unknown. This may happen for a non-linear template or the index is lost in
data processing.
• If 0x1 is unset, no assumptions can be made about 0x2, 0x8, 0x20, 0x40 and 0x80.
3. RNAME: Reference sequence NAME of the alignment. If @SQ header lines are present, RNAME
(if not ‘*’) must be present in one of the SQ-SN tag. An unmapped segment without coordinate
has a ‘*’ at this field. However, an unmapped segment may also have an ordinary coordinate
such that it can be placed at a desired position after sorting. If RNAME is ‘*’, no assumptions
can be made about POS and CIGAR.
4. POS: 1-based leftmost mapping POSition of the first matching base. The first base in a
reference sequence has coordinate 1. POS is set as 0 for an unmapped read without coordinate.
If POS is 0, no assumptions can be made about RNAME and CIGAR.
5. MAPQ: MAPping Quality. It equals −10 log10 Pr{mapping position is wrong}, rounded to the
nearest integer. A value 255 indicates that the mapping quality is not available.
6. CIGAR: CIGAR string. The CIGAR operations are given in the following table (set ‘*’ if
unavailable):
Op BAM Description
M 0 alignment match (can be a sequence match or mismatch)
I 1 insertion to the reference
D 2 deletion from the reference
N 3 skipped region from the reference
S 4 soft clipping (clipped sequences present in SEQ)
H 5 hard clipping (clipped sequences NOT present in SEQ)
P 6 padding (silent deletion from padded reference)
= 7 sequence match
X 8 sequence mismatch
• H can only be present as the first and/or last operation.
159

• S may only have H operations between them and the ends of the CIGAR string.
• For mRNA-to-genome alignment, an N operation represents an intron. For other types
of alignments, the interpretation of N is not defined.
• Sum of lengths of the M/I/S/=/X operations shall equal the length of SEQ.
7. RNEXT: Reference sequence name of the primary alignment of the NEXT read in the template.
For the last read, the next read is the first read in the template. If @SQ header lines are present,
RNEXT (if not ‘*’ or ‘=’) must be present in one of the SQ-SN tag. This field is set as ‘*’ when
the information is unavailable, and set as ‘=’ if RNEXT is identical RNAME. If not ‘=’ and the
next read in the template has one primary mapping (see also bit 0x100 in FLAG), this field
is identical to RNAME at the primary line of the next read. If RNEXT is ‘*’, no assumptions
can be made on PNEXT and bit 0x20.
8. PNEXT: Position of the primary alignment of the NEXT read in the template. Set as 0 when
the information is unavailable. This field equals POS at the primary line of the next read. If
PNEXT is 0, no assumptions can be made on RNEXT and bit 0x20.
9. TLEN: signed observed Template LENgth. If all segments are mapped to the same reference,
the unsigned observed template length equals the number of bases from the leftmost mapped
base to the rightmost mapped base. The leftmost segment has a plus sign and the rightmost
has a minus sign. The sign of segments in the middle is undefined. It is set as 0 for single-
segment template or when the information is unavailable.
10. SEQ: segment SEQuence. This field can be a ‘*’ when the sequence is not stored. If not a ‘*’,
the length of the sequence must equal the sum of lengths of M/I/S/=/X operations in CIGAR.
An ‘=’ denotes the base is identical to the reference base. No assumptions can be made on
the letter cases.
11. QUAL: ASCII of base QUALity plus 33 (same as the quality string in the Sanger FASTQ
format). A base quality is the phred-scaled base error probability which equals −10 log10
Pr{base is wrong}. This field can be a ‘*’ when quality is not stored. If not a ‘*’, SEQ must
not be a ‘*’ and the length of the quality string ought to equal the length of SEQ.
A.8.3 The alignment section: optional fields
All optional fields follow the TAG:TYPE:VALUE format where TAG is a two-character string that
matches /[A-Za-z][A-Za-z0-9]/. Each TAG can only appear once in one alignment line. A TAG containing
lowercase letters are reserved for end users. In an optional field, TYPE is a single case-sensitive letter
which defines the format of VALUE:
160

Type Regexp matching VALUE Description
A [!-~] Printable character
i [-+]?[0-9]+ Singed 32-bit integer
f [-+]?[0-9]*\.?[0-9]+([eE][-+]?[0-9]+)? Single-precision floating number
Z [ !-~]+ Printable string, including space
H [0-9A-F]+ Byte array in the Hex format
B [cCsSiIf](,[-+]?[0-9]*\.?[0-9]+([eE][-+]?[0-9]+)?)+ Integer or numeric array
For an integer or numeric array (type ‘B’), the first letter indicates the type of numbers in the
following comma separated array. The letter can be one of ‘cCsSiIf’, corresponding to int8 t
(signed 8-bit integer), uint8 t (unsigned 8-bit integer), int16 t, uint16 t, int32 t, uint32 t
and float, respectively. During import/export, the element type may be changed if the new type
is also compatible with the array.
Predefined tags are shown in the following table. You can freely add new tags, and if a new
tag may be of general interest, you can email [email protected] to add
the new tag to the specification. Note that tags starting with ‘X’, ‘Y’ and ‘Z’ or tags containing
lowercase letters in either position are reserved for local use and will not be formally defined in any
future version of this specification.
Tag Type Description
X? ? Reserved fields for end users (together with Y? and Z?)
AM i The smallest template-independent mapping quality of segments in the rest
AS i Alignment score generated by aligner
BC Z Barcode sequence, with any quality scores stored in the QT tag.
BQ Z Offset to base alignment quality (BAQ), of the same length as the read
sequence. At the i-th read base, BAQi = Qi − (BQi − 64) where Qi is the
i-th base quality.
CC Z Reference name of the next hit; ‘=’ for the same chromosome
CM i Edit distance between the color sequence and the color reference (see also
NM)
CO Z Free-text comments
CP i Leftmost coordinate of the next hit
CQ Z Color read quality on the original strand of the read. Same encoding as
QUAL; same length as CS.
CS Z Color read sequence on the original strand of the read. The primer base
must be included.
For example, a byte array {0x1a,0xe3,0x1} corresponds to a Hex string ‘1AE301’.Explicit typing eases format parsing and helps to reduce the file size when SAM is converted to BAM.
161
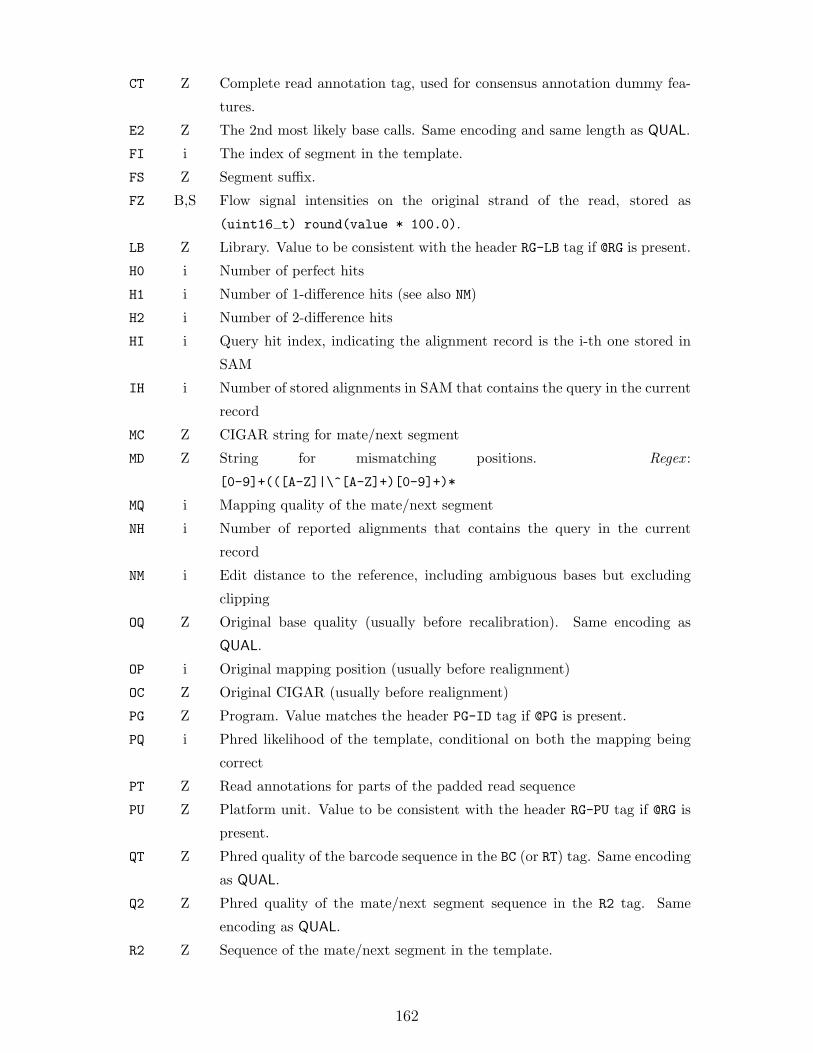
CT Z Complete read annotation tag, used for consensus annotation dummy fea-
tures.
E2 Z The 2nd most likely base calls. Same encoding and same length as QUAL.
FI i The index of segment in the template.
FS Z Segment suffix.
FZ B,S Flow signal intensities on the original strand of the read, stored as
(uint16 t) round(value * 100.0).
LB Z Library. Value to be consistent with the header RG-LB tag if @RG is present.
H0 i Number of perfect hits
H1 i Number of 1-difference hits (see also NM)
H2 i Number of 2-difference hits
HI i Query hit index, indicating the alignment record is the i-th one stored in
SAM
IH i Number of stored alignments in SAM that contains the query in the current
record
MC Z CIGAR string for mate/next segment
MD Z String for mismatching positions. Regex :
[0-9]+(([A-Z]|\^[A-Z]+)[0-9]+)*
MQ i Mapping quality of the mate/next segment
NH i Number of reported alignments that contains the query in the current
record
NM i Edit distance to the reference, including ambiguous bases but excluding
clipping
OQ Z Original base quality (usually before recalibration). Same encoding as
QUAL.
OP i Original mapping position (usually before realignment)
OC Z Original CIGAR (usually before realignment)
PG Z Program. Value matches the header PG-ID tag if @PG is present.
PQ i Phred likelihood of the template, conditional on both the mapping being
correct
PT Z Read annotations for parts of the padded read sequence
PU Z Platform unit. Value to be consistent with the header RG-PU tag if @RG is
present.
QT Z Phred quality of the barcode sequence in the BC (or RT) tag. Same encoding
as QUAL.
Q2 Z Phred quality of the mate/next segment sequence in the R2 tag. Same
encoding as QUAL.
R2 Z Sequence of the mate/next segment in the template.
162

RG Z Read group. Value matches the header RG-ID tag if @RG is present in the
header.
RT Z Deprecated alternative to BC tag originally used at Sanger.
SA Z Other canonical alignments in a chimeric alignment, in the format of:
(rname,pos,strand,CIGAR,mapQ,NM ;)+. Each element in the semi-colon
delimited list represents a part of the chimeric alignment. Conventionally,
at a supplementary line, the first element points to the primary line.
SM i Template-independent mapping quality
TC i The number of segments in the template.
U2 Z Phred probility of the 2nd call being wrong conditional on the best being
wrong. The same encoding as QUAL.
UQ i Phred likelihood of the segment, conditional on the mapping being correct
A.9 VCF Version 4.2 File Format
VCF stands for the Variant Call Format, it is a text file format (most likely stored in a compressed
manner) used in bioinformatics for storing gene sequence variations.By using the variant call format
only the variations need to be stored along with a reference genome. It contains meta-information
lines, a header line, and then data lines each containing information about a position in the genome.
The format also has the ability to contain genotype information on samples for each position. The
The GS, GC, GQ, MF, S2 and SQ are reserved for backward compatibility.The CT tag is intended primarily for annotation dummy reads, and consists of a strand, type and zero or more
key=value pairs, each separated with semicolons. The strand field has four values as in GFF3, and supplementsFLAG bit 0x10 to allow unstranded (‘.’), and stranded but unknown strand (‘?’) annotation. For these andannotation on the forward strand (strand set to ‘+’), do not set FLAG bit 0x10. For annotation on the reversestrand, set the strand to ‘-’ and set FLAG bit 0x10. The type and any keys and their optional values are all percentencoded according to RFC3986 to escape meta-characters ‘=’, ‘%’, ‘;’, ‘|’ or non-printable characters not matchedby the isprint() macro (with the C locale). For example a percent sign becomes ‘%2C’. The CT record matches:“strand ;type (;key (=value ))*”.
The MD field aims to achieve SNP/indel calling without looking at the reference. For example, a string ‘10A5^AC6’means from the leftmost reference base in the alignment, there are 10 matches followed by an A on the referencewhich is different from the aligned read base; the next 5 reference bases are matches followed by a 2bp deletion fromthe reference; the deleted sequence is AC; the last 6 bases are matches. The MD field ought to match the CIGARstring.
The PT tag value has the format of a series of tags separated by |, each annotating a sub-region of theread. Each tag consists of start, end, strand, type and zero or more key=value pairs, each separated withsemicolons. Start and end are 1-based positions between one and the sum of the M/I/D/P/S/=/X CIGAR op-erators, i.e. SEQ length plus any pads. Note any editing of the CIGAR string may require updating the‘PT’ tag coordinates, or even invalidate them. As in GFF3, strand is one of ‘+’ for forward strand tags, ‘-’for reverse strand, ‘.’ for unstranded or ‘?’ for stranded but unknown strand. The type and any keysand their optional values are all percent encoded as in the CT tag. Formally the entire PT record matches:“start ;end ;strand ;type (;key (=value ))*(\|start ;end ;strand ;type (;key (=value ))*)*”.
163

following specification is describing VCF version 4.2 file format. The master version of this docu-
ment can be found at https://github.com/samtools/hts-specs.
An example
##fileformat=VCFv4.2
##fileDate=20090805
##source=myImputationProgramV3.1
##reference=file:///seq/references/1000GenomesPilot-NCBI36.fasta
##contig=<ID=20,length=62435964,assembly=B36,md5=f126cdf8a6e0c7f379d618ff66beb2da,species="Homo sapiens",taxonomy=x>
##phasing=partial
##INFO=<ID=NS,Number=1,Type=Integer,Description="Number of Samples With Data">
##INFO=<ID=DP,Number=1,Type=Integer,Description="Total Depth">
##INFO=<ID=AF,Number=A,Type=Float,Description="Allele Frequency">
##INFO=<ID=AA,Number=1,Type=String,Description="Ancestral Allele">
##INFO=<ID=DB,Number=0,Type=Flag,Description="dbSNP membership, build 129">
##INFO=<ID=H2,Number=0,Type=Flag,Description="HapMap2 membership">
##FILTER=<ID=q10,Description="Quality below 10">
##FILTER=<ID=s50,Description="Less than 50% of samples have data">
##FORMAT=<ID=GT,Number=1,Type=String,Description="Genotype">
##FORMAT=<ID=GQ,Number=1,Type=Integer,Description="Genotype Quality">
##FORMAT=<ID=DP,Number=1,Type=Integer,Description="Read Depth">
##FORMAT=<ID=HQ,Number=2,Type=Integer,Description="Haplotype Quality">
#CHROM POS ID REF ALT QUAL FILTER INFO FORMAT NA00001 NA00002 NA00003
20 14370 rs6054257 G A 29 PASS NS=3;DP=14;AF=0.5;DB;H2 GT:GQ:DP:HQ 0|0:48:1:51,51 1|0:48:8:51,51 1/1:43:5:.,.
20 17330 . T A 3 q10 NS=3;DP=11;AF=0.017 GT:GQ:DP:HQ 0|0:49:3:58,50 0|1:3:5:65,3 0/0:41:3
20 1110696 rs6040355 A G,T 67 PASS NS=2;DP=10;AF=0.333,0.667;AA=T;DB GT:GQ:DP:HQ 1|2:21:6:23,27 2|1:2:0:18,2 2/2:35:4
20 1230237 . T . 47 PASS NS=3;DP=13;AA=T GT:GQ:DP:HQ 0|0:54:7:56,60 0|0:48:4:51,51 0/0:61:2
20 1234567 microsat1 GTC G,GTCT 50 PASS NS=3;DP=9;AA=G GT:GQ:DP 0/1:35:4 0/2:17:2 1/1:40:3
This example shows (in order): a good simple SNP, a possible SNP that has been filtered out
because its quality is below 10, a site at which two alternate alleles are called, with one of them (T)
being ancestral (possibly a reference sequencing error), a site that is called monomorphic reference
(i.e. with no alternate alleles), and a microsatellite with two alternative alleles, one a deletion of 2
bases (TC), and the other an insertion of one base (T). Genotype data are given for three samples,
two of which are phased and the third unphased, with per sample genotype quality, depth and
haplotype qualities (the latter only for the phased samples) given as well as the genotypes. The
microsatellite calls are unphased.
A.9.1 Meta-information lines
File meta-information is included after the ## string and must be key=value pairs. It is strongly
encouraged that information lines describing the INFO, FILTER and FORMAT entries used in the
body of the VCF file be included in the meta-information section. Although they are optional, if
these lines are present then they must be completely well-formed.
164

File format
A single ‘fileformat’ field is always required, must be the first line in the file, and details the VCF
format version number. For example, for VCF version 4.2, this line should read:
##fileformat=VCFv4.2
Information field format
INFO fields should be described as follows (first four keys are required, source and version are
recommended):
##INFO=<ID=ID,Number=number,Type=type,Description="description",Source="source",Version="version">
Possible Types for INFO fields are: Integer, Float, Flag, Character, and String. The Number entry
is an Integer that describes the number of values that can be included with the INFO field. For
example, if the INFO field contains a single number, then this value should be 1; if the INFO field
describes a pair of numbers, then this value should be 2 and so on. There are also certain special
characters used to define special cases:
• If the field has one value per alternate allele then this value should be ‘A’.
• If the field has one value for each possible allele (including the reference), then this value
should be ‘R’.
• If the field has one value for each possible genotype (more relevant to the FORMAT tags)
then this value should be ‘G’.
• If the number of possible values varies, is unknown, or is unbounded, then this value should
be ‘.’.
The ‘Flag’ type indicates that the INFO field does not contain a Value entry, and hence the
Number should be 0 in this case. The Description value must be surrounded by double-quotes.
Double-quote character can be escaped with backslash \ and backslash as \\. Source and Version
values likewise should be surrounded by double-quotes and specify the annotation source (case-
insensitive, e.g. “dbsnp”) and exact version (e.g. “138”), respectively for computational use.
Filter field format
FILTERs that have been applied to the data should be described as follows:
##FILTER=<ID=ID,Description="description">
165

Individual format field format
Likewise, Genotype fields specified in the FORMAT field should be described as follows:
##FORMAT=<ID=ID,Number=number,Type=type,Description="description">
Possible Types for FORMAT fields are: Integer, Float, Character, and String (this field is
otherwise defined precisely as the INFO field).
Alternative allele field format
Symbolic alternate alleles for imprecise structural variants:
##ALT=<ID=type,Description=description>
The ID field indicates the type of structural variant, and can be a colon-separated list of types and
subtypes. ID values are case sensitive strings and may not contain whitespace or angle brackets.
The first level type must be one of the following:
• DEL Deletion relative to the reference
• INS Insertion of novel sequence relative to the reference
• DUP Region of elevated copy number relative to the reference
• INV Inversion of reference sequence
• CNV Copy number variable region (may be both deletion and duplication)
The CNV category should not be used when a more specific category can be applied. Reserved
subtypes include:
• DUP:TANDEM Tandem duplication
• DEL:ME Deletion of mobile element relative to the reference
• INS:ME Insertion of a mobile element relative to the reference
In addition, it is highly recommended (but not required) that the header include tags describing
the reference and contigs backing the data contained in the file. These tags are based on the SQ
field from the SAM spec; all tags are optional (see the VCF example above).For all of the ##INFO, ##FORMAT, ##FILTER, and ##ALT metainformation, extra fields
can be included after the default fields. For example:
##INFO=<ID=ID,Number=number,Type=type,Description="description",Source="description",Version="128">
In the above example, the extra fields of “Source” and “Version” are provided. Optional fields
should be stored as strings even for numeric values.
166

Assembly field format
Breakpoint assemblies for structural variations may use an external file:
##assembly=url
The URL field specifies the location of a fasta file containing breakpoint assemblies referenced
in the VCF records for structural variants via the BKPTID INFO key.
Contig field format
As with chromosomal sequences it is highly recommended (but not required) that the header include
tags describing the contigs referred to in the VCF file. This furthermore allows these contigs to come
from different files. The format is identical to that of a reference sequence, but with an additional
URL tag to indicate where that sequence can be found. For example:.
##contig=<ID=ctg1,URL=ftp://somewhere.org/assembly.fa,...>
Sample field format
It is possible to define sample to genome mappings as shown below:
##SAMPLE=<ID=S_ID,Genomes=G1_ID;G2_ID; ...;GK_ID,Mixture=N1;N2; ...;NK,Description=S1;S2; ...;SK>
Pedigree field format
It is possible to record relationships between genomes using the following syntax:
##PEDIGREE=<Name_0=G0-ID,Name_1=G1-ID,...,Name_N=GN-ID>
or a link to a database:
##pedigreeDB=<url>
A.9.2 Header line syntax
The header line names the 8 fixed, mandatory columns. These columns are as follows:
1. #CHROM
2. POS
3. ID
4. REF
167

5. ALT
6. QUAL
7. FILTER
8. INFO
If genotype data is present in the file, these are followed by a FORMAT column header, then
an arbitrary number of sample IDs. The header line is tab-delimited.
A.9.3 Data lines
Fixed fields
There are 8 fixed fields per record. All data lines are tab-delimited. In all cases, missing values are
specified with a dot (‘.’). Fixed fields are:
1. CHROM - chromosome: An identifier from the reference genome or an angle-bracketed ID
String (“<ID>”) pointing to a contig in the assembly file (cf. the ##assembly line in the
header). All entries for a specific CHROM should form a contiguous block within the VCF
file. The colon symbol (:) must be absent from all chromosome names to avoid parsing errors
when dealing with breakends. (String, no white-space permitted, Required).
2. POS - position: The reference position, with the 1st base having position 1. Positions are
sorted numerically, in increasing order, within each reference sequence CHROM. It is permit-
ted to have multiple records with the same POS. Telomeres are indicated by using positions 0
or N+1, where N is the length of the corresponding chromosome or contig. (Integer, Required)
3. ID - identifier: Semi-colon separated list of unique identifiers where available. If this is a
dbSNP variant it is encouraged to use the rs number(s). No identifier should be present in
more than one data record. If there is no identifier available, then the missing value should
be used. (String, no white-space or semi-colons permitted)
4. REF - reference base(s): Each base must be one of A,C,G,T,N (case insensitive). Multiple
bases are permitted. The value in the POS field refers to the position of the first base in the
String. For simple insertions and deletions in which either the REF or one of the ALT alleles
would otherwise be null/empty, the REF and ALT Strings must include the base before the
event (which must be reflected in the POS field), unless the event occurs at position 1 on the
contig in which case it must include the base after the event; this padding base is not required
(although it is permitted) for e.g. complex substitutions or other events where all alleles have
168

at least one base represented in their Strings. If any of the ALT alleles is a symbolic allele
(an angle-bracketed ID String “<ID>”) then the padding base is required and POS denotes
the coordinate of the base preceding the polymorphism. Tools processing VCF files are not
required to preserve case in the allele Strings. (String, Required).
5. ALT - alternate base(s): Comma separated list of alternate non-reference alleles called on at
least one of the samples. Options are base Strings made up of the bases A,C,G,T,N,*, (case
insensitive) or an angle-bracketed ID String (“<ID>”) or a breakend replacement string as
described in the section on breakends. The ‘*’ allele is reserved to indicate that the allele
is missing due to a upstream deletion. If there are no alternative alleles, then the missing
value should be used. Tools processing VCF files are not required to preserve case in the
allele String, except for IDs, which are case sensitive. (String; no whitespace, commas, or
angle-brackets are permitted in the ID String itself)
6. QUAL - quality: Phred-scaled quality score for the assertion made in ALT. i.e. −10log10
prob(call in ALT is wrong). If ALT is ‘.’ (no variant) then this is −10log10 prob(variant), and
if ALT is not ‘.’ this is −10log10 prob(no variant). If unknown, the missing value should be
specified. (Numeric)
7. FILTER - filter status: PASS if this position has passed all filters, i.e. a call is made at this
position. Otherwise, if the site has not passed all filters, a semicolon-separated list of codes
for filters that fail. e.g. “q10;s50” might indicate that at this site the quality is below 10 and
the number of samples with data is below 50% of the total number of samples. ‘0’ is reserved
and should not be used as a filter String. If filters have not been applied, then this field should
be set to the missing value. (String, no white-space or semi-colons permitted)
8. INFO - additional information: (String, no white-space, semi-colons, or equals-signs permit-
ted; commas are permitted only as delimiters for lists of values) INFO fields are encoded as a
semicolon-separated series of short keys with optional values in the format: <key>=<data>[,data].
Arbitrary keys are permitted, although the following sub-fields are reserved (albeit optional):
• AA : ancestral allele
• AC : allele count in genotypes, for each ALT allele, in the same order as listed
• AF : allele frequency for each ALT allele in the same order as listed: use this when
estimated from primary data, not called genotypes
• AN : total number of alleles in called genotypes
• BQ : RMS base quality at this position
• CIGAR : cigar string describing how to align an alternate allele to the reference allele
169

• DB : dbSNP membership
• DP : combined depth across samples, e.g. DP=154
• END : end position of the variant described in this record (for use with symbolic alleles)
• H2 : membership in hapmap2
• H3 : membership in hapmap3
• MQ : RMS mapping quality, e.g. MQ=52
• MQ0 : Number of MAPQ == 0 reads covering this record
• NS : Number of samples with data
• SB : strand bias at this position
• SOMATIC : indicates that the record is a somatic mutation, for cancer genomics
• VALIDATED : validated by follow-up experiment
• 1000G : membership in 1000 Genomes
The exact format of each INFO sub-field should be specified in the meta-information (as described
above). Example for an INFO field: DP=154;MQ=52;H2. Keys without corresponding values are
allowed in order to indicate group membership (e.g. H2 indicates the SNP is found in HapMap 2).
It is not necessary to list all the properties that a site does NOT have, by e.g. H2=0. See below
for additional reserved INFO sub-fields used to encode structural variants.
Genotype fields
If genotype information is present, then the same types of data must be present for all samples. First
a FORMAT field is given specifying the data types and order (colon-separated alphanumeric String).
This is followed by one field per sample, with the colon-separated data in this field corresponding
to the types specified in the format. The first sub-field must always be the genotype (GT) if it is
present. There are no required sub-fields.
As with the INFO field, there are several common, reserved keywords that are standards across
the community:
• GT : genotype, encoded as allele values separated by either of / or |. The allele values are
0 for the reference allele (what is in the REF field), 1 for the first allele listed in ALT, 2 for
the second allele list in ALT and so on. For diploid calls examples could be 0/1, 1 | 0, or 1/2,
etc. For haploid calls, e.g. on Y, male non-pseudoautosomal X, or mitochondrion, only one
allele value should be given; a triploid call might look like 0/0/1. If a call cannot be made
for a sample at a given locus, ‘.’ should be specified for each missing allele in the GT field
170

(for example ‘./.’ for a diploid genotype and ‘.’ for haploid genotype). The meanings of the
separators are as follows (see the PS field below for more details on incorporating phasing
information into the genotypes):
◦ / : genotype unphased
◦ | : genotype phased
• DP : read depth at this position for this sample (Integer)
• FT : sample genotype filter indicating if this genotype was “called” (similar in concept to the
FILTER field). Again, use PASS to indicate that all filters have been passed, a semi-colon
separated list of codes for filters that fail, or ‘.’ to indicate that filters have not been applied.
These values should be described in the meta-information in the same way as FILTERs (String,
no white-space or semi-colons permitted)
• GL : genotype likelihoods comprised of comma separated floating point log10-scaled likelihoods
for all possible genotypes given the set of alleles defined in the REF and ALT fields. In
presence of the GT field the same ploidy is expected and the canonical order is used; without
GT field, diploidy is assumed. If A is the allele in REF and B,C,... are the alleles as ordered
in ALT, the ordering of genotypes for the likelihoods is given by: F(j/k) = (k*(k+1)/2)+j.
In other words, for biallelic sites the ordering is: AA,AB,BB; for triallelic sites the ordering
is: AA,AB,BB,AC,BC,CC, etc. For example: GT:GL 0/1:-323.03,-99.29,-802.53 (Floats)
• GLE : genotype likelihoods of heterogeneous ploidy, used in presence of uncertain copy num-
ber. For example: GLE=0:-75.22,1:-223.42,0/0:-323.03,1/0:-99.29,1/1:-802.53 (String)
• PL : the phred-scaled genotype likelihoods rounded to the closest integer (and otherwise
defined precisely as the GL field) (Integers)
• GP : the phred-scaled genotype posterior probabilities (and otherwise defined precisely as the
GL field); intended to store imputed genotype probabilities (Floats)
• GQ : conditional genotype quality, encoded as a phred quality −10log10 p(genotype call is
wrong, conditioned on the site’s being variant) (Integer)
• HQ : haplotype qualities, two comma separated phred qualities (Integers)
• PS : phase set. A phase set is defined as a set of phased genotypes to which this genotype
belongs. Phased genotypes for an individual that are on the same chromosome and have the
same PS value are in the same phased set. A phase set specifies multi-marker haplotypes
for the phased genotypes in the set. All phased genotypes that do not contain a PS subfield
171

are assumed to belong to the same phased set. If the genotype in the GT field is unphased,
the corresponding PS field is ignored. The recommended convention is to use the position of
the first variant in the set as the PS identifier (although this is not required). (Non-negative
32-bit Integer)
• PQ : phasing quality, the phred-scaled probability that alleles are ordered incorrectly in a
heterozygote (against all other members in the phase set). We note that we have not yet
included the specific measure for precisely defining “phasing quality”; our intention for now
is simply to reserve the PQ tag for future use as a measure of phasing quality. (Integer)
• EC : comma separated list of expected alternate allele counts for each alternate allele in the
same order as listed in the ALT field (typically used in association analyses) (Integers)
• MQ : RMS mapping quality, similar to the version in the INFO field. (Integer)
If any of the fields is missing, it is replaced with the missing value. For example if the FORMAT
is GT:GQ:DP:HQ then 0 | 0 : . : 23 : 23, 34 indicates that GQ is missing. Trailing fields can be
dropped (with the exception of the GT field, which should always be present if specified in the
FORMAT field).
See below for additional genotype fields used to encode structural variants. Additional Genotype
fields can be defined in the meta-information. However, software support for such fields is not
guaranteed.
172

Appendix B
Binary File Format
B.1 Two Bit File Format (2bit)
B.1.1 Definition
A 2bit file format is called a 2bit because it uses 2 bits to represent a single DNA base. It is a
binary file that is used in the bioinformatics field to store multiple DNA sequences (up to 4 Gb in
total) in a compact and accessible format. This type of file contains the DNA and masking infor-
mation. The specification of this format is described in the UCSC website(http://genome.ucsc.edu).
B.1.2 Description
The 2bit binary file has 3 main sections:
1. The first section is the header:
The size of this section is 16-byte and has four fields:
• signature: the number 0x1A412743 in the architecture of the machine that created the
file.
• version: zero for now.
• sequenceCount: the number of sequences in the file.
• reserved: always zero for now.
All fields are 4bytes (32bits) and if the signature value is not as given, the reader program
should byte-swap the signature and check if the swapped version matches. If so, all multiple-
byte entities in the file will have to be byte-swapped. This enables these binary files to be
used unchanged on different architectures.
173

2. The second section is the index:
This section contains one entry for each sequence and each index entry has three fields:
• nameSize: this field has one byte containing the length of the name field.
• name: this field has the sequence name itself, of variable length depending on nameSize
• offset: this field has a 4byte (32-bit) offset of the sequence data relative to the start of
the file.
3. The third section is the sequence records:
This section has nine fields:
• dnaSize: this field has the number of DNA bases in the sequence.
• nBlockCount: this contains the number of blocks of Ns in the file (N- representing
unknown sequence).
• nBlockStarts: an array of length nBlockCount of 32-bit integers indicating the starting
position of a block of Ns.
• nBlockSizes: an array of length nBlockCount of 32-bit integers indicating the length
of a block of Ns.
• maskBlockCount: the number of masked (lower-case) blocks.
• maskBlockStarts: an array of length maskBlockCount of 32-bit integers indicating the
starting position of a masked block.
• maskBlockSizes: an array of length maskBlockCount of 32-bit integers indicating the
length of a masked block.
• reserved: always zero for now.
• packedDna: the DNA packed to two bits per base, represented as: T - 00, C - 01, A -
10, G - 11. The first base is in the most significant 2-bit byte and the last base is in the
least significant 2 bits. For example, the sequence TCAG is represented as 00011011.
174

Figure 42: 2bit binary file layout
B.2 The Tabix index File Format
This file format document was written by Heng Li. The following table describe the details of this
format. This specification can be found at the samtools website http://samtools.github.io/
hts-specs/tabix.pdf
175

Field Descrption Type Value
magic Magic string char[4] TBI\1n ref # sequences int32 t
format Format (0: generic; 1: SAM; 2: VCF) int32 t
col seq Column for the sequence name int32 t
col beg Column for the start of a region int32 t
col end Column for the end of a region int32 t
meta Leading character for comment lines int32 t
skip # lines to skip at the beginning int32 t
l nm Length of concatenated sequence names int32 t
names Concatenated names, each zero terminated char[l nm]
List of indices (n=n ref)
n bin # distinct bins (for the binning index) int32 t
List of distinct bins (n=n bin)
bin Distinct bin number uint32 t
n chunk # chunks int32 t
List of chunks (n=n chunk)
cnk beg Virtual file offset of the start of the chunk uint64 t
cnk end Virtual file offset of the end of the chunk uint64 t
n intv # 16kb intervals (for the linear index) int32 t
List of distinct intervals (n=n intv)
ioff File offset of the first record in the interval uint64 t
Notes:
• The index file is BGZF compressed.
• All integers are little-endian.
• When (format&0x10000) is true, the coordinate follows the BED rule (i.e. half-closed-half-
open and zero based); otherwise, the coordinate follows the GFF rule (closed and one based).
• For the SAM format, the end of a region equals POS plus the reference length in the alignment,
inferred from CIGAR. For the VCF format, the end of a region equals POS plus the size of the
deletion.
• Field col beg may equal col end, and in this case, the end of a region is end=beg+1.
• Example. For GFF, format=0, col seq=1, col beg=4, col end=5, meta=‘#’ and skip=0.
For BED, format=0x10000, col seq=1, col beg=2, col end=3, meta=‘#’ and skip=0.
176

B.3 The BAM File Format
SAM is a TAB-delimited text format. It is easy to understand, easy to parse, easy to generate and
easy to check for errors. However, SAM is a bit slow to parse. Therefore a a binary equivalent
to SAM, called BAM was introduced , for intensive data processing. It was envisioned that BAM
will be used in most production pipelines, but that SAM, which is simpler to parse and can be
produced by streaming from BAM, may be useful for interconversion with external applications
and for exploratory analyses. The master version of this document can be found at https://
github.com/samtools/hts-specs.
B.3.1 The BGZF compression format
BGZF is block compression implemented on top of the standard gzip file format. The goal of BGZF
is to provide good compression while allowing efficient random access to the BAM file for indexed
queries. The BGZF format is ‘gunzip compatible’, in the sense that a compliant gunzip utility can
decompress a BGZF compressed file.
A BGZF file is a series of concatenated BGZF blocks. Each BGZF block is itself a spec-compliant
gzip archive which contains an “extra field” in the format described in RFC1952. The gzip file
format allows the inclusion of application-specific extra fields and these are ignored by compliant
decompression implementation. The gzip specification also allows gzip files to be concatenated.
The result of decompressing concatenated gzip files is the concatenation of the uncompressed data.
Each BGZF block contains a standard gzip file header with the following standard-compliant
extensions:
1. The F.EXTRA bit in the header is set to indicate that extra fields are present.
2. The extra field used by BGZF uses the two subfield ID values 66 and 67 (ascii ‘BC’).
3. The length of the BGZF extra field payload (field LEN in the gzip specification) is 2 (two
bytes of payload).
4. The payload of the BGZF extra field is a 16-bit unsigned integer in little endian format. This
integer gives the size of the containing BGZF block minus one.
On disk, a complete BGZF file is a series of blocks as shown in the following table. (All integers
are little endian as is required by RFC1952.)
It is worth noting that there is a known bug in the Java GZIPInputStream class that concatenated gzip archivescannot be successfully decompressed by this class. BGZF files can be created and manipulated using the built-inJava util.zip package, but naive use of GZIPInputStream on a BGZF file will not work due to this bug.
177

Field Description Type Value
List of compression blocks (until the end of the file)
ID1 gzip IDentifier1 uint8 t 31
ID2 gzip IDentifier2 uint8 t 139
CM gzip Compression Method uint8 t 8
FLG gzip FLaGs uint8 t 4
MTIME gzip Modification TIME uint32 t
XFL gzip eXtra FLags uint8 t
OS gzip Operating System uint8 t
XLEN gzip eXtra LENgth uint16 t
Extra subfield(s) (total size=XLEN)
Additional RFC1952 extra subfields if present
SI1 Subfield Identifier1 uint8 t 66
SI2 Subfield Identifier2 uint8 t 67
SLEN Subfield LENgth uint16 t 2
BSIZE total Block SIZE minus 1 uint16 t
Additional RFC1952 extra subfields if present
CDATA Compressed DATA by zlib::deflate() uint8 t[BSIZE-XLEN-19]
CRC32 CRC-32 uint32 t
ISIZE Input SIZE (length of uncompressed data) uint32 t
B.3.1.1 Random access
BGZF files support random access through the BAM file index. To achieve this, the BAM file index
uses virtual file offsets into the BGZF file. Each virtual file offset is an unsigned 64-bit integer,
defined as: coffset<<16|uoffset, where coffset is an unsigned byte offset into the BGZF file
to the beginning of a BGZF block, and uoffset is an unsigned byte offset into the uncompressed
data stream represented by that BGZF block. Virtual file offsets can be compared, but subtraction
between virtual file offsets and addition between a virtual offset and an integer are both disallowed.
B.3.1.2 End-of-file marker
An end-of-file (EOF) trailer or marker block should be written at the end of BGZF files, so that
unintended file truncation can be easily detected. The EOF marker block is a particular empty
BGZF block encoded with the default zlib compression level setttings, and consists of the following
28 hexadecimal bytes:
1f 8b 08 04 00 00 00 00 00 ff 06 00 42 43 02 00 1b 00 03 00 00 00 00 00 00 00 00
00
178

The presence of this EOF marker at the end of a BGZF file indicates that the immediately following
physical EOF is the end of the file as intended by the program that wrote it. Empty BGZF blocks
are not otherwise special; in particular, the presence of an EOF marker block does not by itself
signal end of file.
The absence of this final EOF marker should trigger a warning or error soon after opening
a BGZF file where random access is available. When reading a BGZF file in sequential streaming
fashion, ideally this EOF check should be performed when the end of the stream is reached. Checking
that the final BGZF block in the file decompresses to empty or checking that the last 28 bytes of the
file are exactly the bytes above are both sufficent tests; each is likely more convenient in different
circumstances.
B.3.2 The BAM format
BAM is compressed in the BGZF format. All multi-byte numbers in BAM are little-endian,
regardless of the machine endianness. The format is formally described in the following table
where values in brackets are the default when the corresponding information is not available; an
underlined word in uppercase denotes a field in the SAM format.
Field Description Type Value
magic BAM magic string char[4] BAM\1
l text Length of the header text, including any NULL
padding
int32 t
text Plain header text in SAM; not necessarily NULL
terminated
char[l text]
n ref # reference sequences int32 t
List of reference information (n=n ref)
l name Length of the reference name plus 1 (including
NULL)
int32 t
name Reference sequence name; NULL terminated char[l name]
l ref Length of the reference sequence int32 t
List of alignments (until the end of the file)
block size Length of the remainder of the alignment record int32 t
Empty in the sense of having been formed by compressing a data block of length zero.An implementation that supports reopening a BAM file in append mode could produce a file by writing headers
and alignment records to it, closing it (adding an EOF marker); then reopening it for append, writing more alignmentrecords, and closing it (adding an EOF marker). The resulting BAM file would contain an embedded insignificantEOF marker block that should be effectively ignored when it is read.
It is useful to produce a diagnostic at the beginning of reading a file, so that interactive users can abort lengthyanalysis of potentially-corrupted files. Of course, this is only possible if the stream in question supports randomaccess.
179

refID Reference sequence ID, −1 ≤ refID < n ref; -1
for a read without a mapping position.
int32 t [-1]
pos 0-based leftmost coordinate (= POS− 1) int32 t [-1]
bin mq nl bin<<16|MAPQ<<8|l read name; bin is
computed by the reg2bin() function;
l read name is the length of read name be-
low (= length(QNAME) + 1).
uint32 t
flag nc FLAG<<16|n cigar op; n cigar op is the number
of operations in CIGAR.
uint32 t
l seq Length of SEQ int32 t
next refID Ref-ID of the next segment (−1 6 mate refID <
n ref)
int32 t [-1]
next pos 0-based leftmost pos of the next segment (=
PNEXT− 1)
int32 t [-1]
tlen Template length (= TLEN) int32 t [0]
read name Read name, NULL terminated (QNAME plus a
tailing ‘\0’)
char[l read name]
cigar CIGAR: op len<<4|op.
‘MIDNSHP=X’→‘012345678’
uint32 t[n cigar op]
seq 4-bit encoded read: ‘=ACMGRSVTWYHKDBN’→[0, 15]; other characters mapped to ‘N’; high nyb-
ble first (1st base in the highest 4-bit of the 1st
byte)
uint8 t[(l seq+1)/2]
qual Phred base quality (a sequence of 0xFF if absent) char[l seq]
List of auxiliary data (until the end of the alignment block)
tag Two-character tag char[2]
val type Value type: AcCsSiIfZHB, char
value Tag value (by val type)
For backward compatibility, a QNAME ‘*’ is stored as a C string "*\0".An integer may be stored as one of ‘cCsSiI’ in BAM, representing int8 t, uint8 t, int16 t, uint16 t,
int32 t and uint32 t, respectively. In SAM, all single integer types are mapped to int32 t.A ‘B’-typed (array) tag–value pair is stored as follows. The first two bytes keep the two-character tag. The 3rd
byte is always ‘B’. The 4th byte, matching /^[cCsSiIf]$/, indicates the type of an element in the array. Bytes from5 to 8 encode a little-endian 32-bit integer which gives the number of elements in the array. Bytes starting fromthe 9th store the array in the little-endian byte order; the number of these bytes is determined by the type and thelength of the array.
180

B.3.3 Indexing BAM
Indexing aims to achieve fast retrieval of alignments overlapping a specified region without going
through the whole alignments. BAM must be sorted by the reference ID and then the leftmost
coordinate before indexing.
B.3.3.1 Algorithm
Basic binning index The UCSC binning scheme was suggested by Richard Durbin and Lincoln
Stein and is explained by Kent et al. (2002). In this scheme, each bin represents a contiguous
genomic region which is either fully contained in or non-overlapping with another bin; each align-
ment is associated with a bin which represents the smallest region containing the entire alignment.
The binning scheme is essentially a representation of R-tree. A distinct bin uniquely corresponds
to a distinct internal node in a R-tree. Bin A is a child of Bin B if the region represented by A is
contained in B.
To find the alignments that overlap a specified region, we need to get the bins that overlap
the region, and then test each alignment in the bins to check overlap. To quickly find alignments
associated with a specified bin, we can keep in the index the start file offsets of chunks of alignments
which all have the bin. As alignments are sorted by the leftmost coordinates, alignments having
the same bin tend to be clustered together on the disk and therefore usually a bin is only associated
with a few chunks. Traversing all the alignments having the same bin usually needs a few seek calls.
Given the set of bins that overlap the specified region, we can visit alignments in the order of their
leftmost coordinates and stop seeking the rest when an alignment falls outside the required region.
This strategy saves half of the seek calls in average.
In BAM, each bin may span 229, 226, 223, 220, 217 or 214 bp. Bin 0 spans a 512Mbp region, bins
1–8 span 64Mbp, 9–72 8Mbp, 73–584 1Mbp, 585–4680 128Kbp and bins 4681–37449 span 16Kbp
regions.
Reducing small chunks Around the boundary of two adjacent bins, we may see many small
chunks with some having a shorter bin while the rest having a larger bin. To reduce the number of
seek calls, we may join two chunks having the same bin if they are close to each other. After this
process, a joined chunk will contain alignments with different bins. We need to keep in the index
the file offset of the end of each chunk to identify its boundaries.
Combining with linear index For an alignment starting beyond 64Mbp, we always need to
seek to some chunks in bin 0, which can be avoided by using a linear index. In the linear index,
Due to a limitation in the current indexing scheme, a chromosome sequence longer than 229− 1 is not supportedduring indexing.
181

for each tiling 16384bp window on the reference, we record the smallest file offset of the alignments
that start in the window. Given a region [rbeg,rend), we only need to visit a chunk whose end file
offset is larger than the file offset of the 16kbp window containing rbeg.
With both binning and linear indices, we can retrieve alignments in most of regions with just
one seek call.
A conceptual example Suppose we have a genome shorter than 144kbp. we can design a binning
scheme which consists of three types of bins: bin 0 spans 0-144kbp, bin 1, 2 and 3 span 48kbp and
bins from 4 to 12 span 16kbp each:
0 (0–144kbp)
1 (0–48kbp) 2 (48–96kbp) 1 (96–144kbp)
4 (0–16k) 5 (16–32k) 6 (32–48k) 7 (48–64k) 8 (64–80k) 9 (80–96k) 10 11 12
An alignment starting at 65kbp and ending at 67kbp would have a bin number 8, which is the
smallest bin containing the alignment. Similarly, an alignment starting at 51kbp and ending at
70kbp would go to bin 2, while an alignment between [40k,49k] to bin 0. Suppose we want to find
all the alignments overlapping region [65k,71k). We first calculate that bin 0, 2 and 8 overlap with
this region and then traverse the alignments in these bins to find the required alignments. With a
binning index alone, we need to visit the alignment at [40k,49k] as it belongs to bin 0. But with a
linear index, we know that such an alignment stops before 64kbp and cannot overlap the specified
region. A seek call can thus be saved.
182

B.3.3.2 The BAM indexing format
Field Description Type Value
magic Magic string char[4] BAI\1
n ref # reference sequences int32 t
List of indices (n=n ref)
n bin # distinct bins (for the binning index) int32 t
List of distinct bins (n=n bin)
bin Distinct bin uint32 t
n chunk # chunks int32 t
List of chunks (n=n chunk)
chunk beg (Virtual) file offset of the start of the chunk uint64 t
chunk end (Virtual) file offset of the end of the chunk uint64 t
n intv # 16kbp intervals (for the linear index) int32 t
List of intervals (n=n intv)
ioffset (Virtual) file offset of the first alignment in the interval uint64 t
B.4 BigBed File Format
B.4.1 Definition
The BigBed format is a compressed, indexed, binary format of the BED file developed by the
UCSC genome Center. It is normally created from Browser Extensible Data (BED) files using the
UCSC program bedToBigBed resulting in an indexed binary format. It’s main advantage is for
rapid, random access of genomic data by a genome browser or analysis program, either remotely
or locally mainly to make uploading huge data sets faster than regular BED files and that is done
by transferring only portions of these files to display a particular region. The general specification
is displayed on the UCSC website http://genome.ucsc.edu while the Supplementary byte-level
details of the BigWig and BigBed file formats are available at Bioinformatics online.
B.4.2 Description
As previously mentioned BigBed files are compressed binary files created from BED files and stores
annotation items that can either be simple, or a linked collection of exons. The detailed format of
this binary indexed file is described in B.5.3
183

B.5 BigWig File Format
B.5.1 Definition
The bigWig format is for display of dense, continuous data that will be displayed in the Genome
Browser as a graph. BigWig files are created initially from wiggle (wig) type files, using the program
wigToBigWig. Alternatively, bigWig files can be created from bedGraph files, using the program
bedGraphToBigWig. In either case, the resulting bigWig files are in an indexed binary format. The
main advantage of the bigWig files is that only the portions of the files needed to display a particular
region are transferred to UCSC, so for large data sets bigWig is considerably faster than regular
wiggle files. The bigWig file remains on your web accessible server (http, https, or ftp), not on
the UCSC server. Only the portion that is needed for the chromosomal position you are currently
viewing is locally cached as a ”sparse file”.The general specification is displayed on the UCSC
website http://genome.ucsc.edu while the Supplementary byte-level details of the BigWig and
BigBed file formats are available at Bioinformaticsonline. Also parts of the information mentioned
is taken from [Kent et al., 2010] article.
B.5.2 Description
BigWig files are derived from text-formatted wiggle plot (wig) or bedGraph files.They associate a
floating-point number with each base in the genome, and can accommodate missing data points.In
the UCSC Genome Browser, these files are used to create graphs in which the horizontal axis is the
position along a chromosome and the vertical axis is the floating-point data.A wiggly line represents
these graphs, hence the name ”wiggle”.
Three text formats can be used to describe wiggle data at varying levels of conciseness and flex-
ibility. Values may be specified for every base or for regularly spaced fixed-sized windows using
the ”fixedStep” format. The ”variableStep” format encodes fixed-sized windows that are variably
spaced. The ”bedGraph” format encodes windows that are both variably sized and variably spaced.
Data files of fixedStep format are divided into sections, each of which starts with a line of the
form:
fixedStep chrom=chrN start=position step=N span=N
where ”chrom” is the chromosome name, ”start” is the start position on the chromosome, ”step”
is the number of bases between items and ”span” shows the number of bases covered by each item.
Step and span default to 1 if they are not defined. This section line is followed by a line containing
184

a single floating-point number for each item in the section.
The variableStep format is similar, but the section starts with a line of the format:
variableStep chrom=chrN span=N
and each item line contains two fields: the chromosome start position, and the floating point
value associated with each base.
The bedGraph format is a BED variant in which the fourth column is a floating point value
that is associated with all the bases between the chromStart and chromEnd positions. Unlike the
zero-based BED and bedGraph, for compatibility reasons the chromosome start positions in vari-
ableStep and fixedStep are one-based.
B.5.3 Details
This section will have the byte-by-byte details of BigBed and BigWig files in the form of table.The
following table shows the overall structure of both BigBed and BigWig files.
185

Name Size (bytes) Description
bbiHeader 64 Contains high-level information about file and offsets to var-
ious parts of file. See Table 16.
zoomHeaders N*24 One for each level of zoom built into file. See Table 17.
autoSql Varies Zero-terminated string in autoSql format describing formats.
Optional, not used in BigWig.
totalSummary 40 Statistical summary of entire file. See Table 18. Only in
files of version 2 and later.
chromosomeTree Varies B+ tree-formatted index of chromosomes, their sizes, and a
unique ID for each. See Tables 19-22.
dataCount 4 Number of records in data. For BigWig this corresponds
to the number of sections, not the number of floating point
values.
data Varies Possibly compressed data in format specific for file type. See
Tables 23 and 24.
index Varies R tree index of data. See Tables 25 and 26.
zoomInfo Varies One for each zoom level.
Table 15: Overall structure of BigWig and BigBed files.
After describing the common structure of both binary files more on the details of this structure
are presented below.The next table will demonstrate the fields of the Common header for BigWig
and BigBed files.The overall size of the header is 64 bytes.The last four fields are perhaps surpris-
ingly present in BigBed as well in BigWig.In BigBed the values correspond to those of a BigWig
constructed by the depth of coverage of bases.
186

Name Size Type Description
magic 4 uint 0x888FFC26 for BigWig, 0x8789F2EB for BigBed. If byte-
swapped, all numbers in file are byte-swapped.
version 2 uint Currently 3.
zoomLevels 2 uint Number of different zoom summary resolutions.
chromosomeTreeOffset 8 uint Offset in file to chromosome B+ tree index.
fullDataOffset 8 uint Offset to main (unzoomed) data. Points specifically to the
dataCount.
fullIndexOffset 8 uint Offset to R tree index of items.
fieldCount 2 uint Number of fields in BED file. (0 for BigWig)
definedFieldCount 2 uint Number of fields that are predefined BED fields.
autoSqlOffset 8 uint Offset to zero-terminated string with .as spec.
totalSummaryOffset 8 uint Offset to overall file summary data block.
uncompressBufSize 4 uint Maximum size of decompression buffer needed (nonzero on
compressed files). Used only on files of version 3 and later.
reserved 8 uint Reserved for future expansion. Currently 0.
Table 16: Common header for BigWig and BigBed files.
The table below will show the zoom header. One or more of these zoom headers immediately
follow the common header, one for each zoomLevel.
Name Size Type Description
reductionLevel 4 uint Number of bases summarized in each reduction level.
reserved 4 uint Reserved for future expansion. Currently 0.
dataOffset 8 uint Position of zoomed data in file.
indexOffset 8 uint Position of zoomed data index in file.
Table 17: The zoom header.
Total summary block. From these data the mean and the standard deviation can be quickly
calculated. Follows the zoom headers and autoSql string if present. This block exists only in version
2 and later files.
187

Name Size Type Description
basesCovered 8 uint Number of bases for which there is data.
minVal 8 float Minimum value in file.
maxVal 8 float Maximum value in file.
sumData 8 float Sum of all values in file.
sumSquares 8 float Sum of all squares of values in file.
Table 18: Total summary block.
Chromosome B+ tree header. This starts at the offset specified in chromosomeTreeOffset in the
common header.
Name Size Type Description
magic 4 uint 0x78CA8C91. If byte-swapped all numbers in index are
byte-swapped.
blockSize 4 uint Number of children per block (not byte size of block).
keySize 4 uint Number of significant bytes in key. That is the minimum
prefix size needed to distinguish one chromosome name from
another.
valSize 4 uint Size of value being indexed. Currently this is 8.
itemCount 8 uint The number of chromosomes/contigs.
reserved 8 uint Reserved for future expansion, currently 0.
Table 19: Chromosome B+ tree header.
Chromosome B+ tree node format. The first of these (which for chromosome-based assemblies
may in fact be the only one) immediately follows the B+ tree header. It is followed by count items
in the format described in table 21 or 22. Table 10 or 11, depending on the value of isLeaf.
Name Size Type Description
isLeaf 1 byte 1 if a leaf node, 0 otherwise.
reserved 1 byte Reserved for future expansion. Currently 0.
count 2 uint Number of items in node.
Table 20: Chromosome B+ tree node format.
Chromosome B+ tree leaf item format.
188

Name Size Type Description
key keySize bytes First keySize characters of chromosome name, padded with
zeroes if needed.
chromId 4 uint Numerical ID for chromosome/contig.
chromSize 4 uint Number of bases in chromosome/contig.
Table 21: Chromosome B+ tree leaf item format.
Chromosome B+ tree non-leaf item format.
Name Size Type Description
key keySize bytes First keySize characters of chromosome name, padded with
zeroes if needed.
childOffset 8 uint Offset to child node.
Table 22: Chromosome B+ tree non-leaf item format.
Binary BED data format. The data section of a BigBed file consists of dataCount of these
records sorted by chromId, chromStart. In compressed files these records are grouped together in
blocks as specified by the index, and each block is compressed individually.
Name Size Type Description
chromId 4 uint Numerical ID for chromosome/contig.
chromStart 4 uint Start position (starting with 0).
chromEnd 4 uint End of item. Same as chromStart + itemSize in bases.
rest Varies char Zero-terminated string in tab-separated format containing
any BED fields past the first three.
Table 23: Binary BED data format.
Binary WIG section header. The data that follows this header depends on the type. For
fixedStep it is one 32-bit floating point value for each item. For variableStep the item is chromStart
followed by the floating point value. For bedGraph the item is chromStart, chromEnd, value. In
compressed files each section (including the header) is compressed separately.
189

Name Size Type Description
chromId 4 uint Numerical ID for chromosome/contig.
chromStart 4 uint Start position (starting with 0).
chromEnd 4 uint End of item. Same as chromStart + itemSize in bases.
itemStep 4 uint Spaces between start of adjacent items in fixedStep sections.
itemSpan 4 uint Number of bases in item in fixedStep and varStep sections.
type 1 uint Section type. 1 for bedGraph, 2 for varStep, 3 for fixedStep.
reserved 1 uint Currently 0.
itemCount 2 uint Number of items in section.
Table 24: Binary WIG section header.
R tree index header.
Name Size Type Description
magic 4 uint 0x2468ACE0. If byte-swapped all numbers in index are
byte-swapped.
blockSize 4 uint Number of children per block (not byte size of block).
itemCount 8 uint The number of chromosomes/contigs.
startChromIx 4 uint ID of first chromosome in index.
startBase 4 uint Position of first base in index.
endChromIx 4 uint ID of last chromosome in index.
endBase 4 uint Position of last base in index.
endFileOffset 8 uint Position in file where data being indexed ends.
itemsPerSlot 4 uint Number of items pointed to by leaves of index.
Reserved 4 uint Reserved for future expansion. Currently 0.
Table 25: R tree index header.
R tree node format. The first of these (which for chromosome-based assemblies may in fact be
the only one) immediately follows the R tree header. It is followed by count items in the format
describe in tables 27 or reftable:R tree non-leaf item, depending on the value of isLeaf.
190

Name Size Type Description
isLeaf 1 byte 1 if a leaf node, 0 otherwise.
reserved 1 byte Reserved for future expansion. Currently 0.
count 2 uint Number of items in node.
Table 26: R tree node format.
R tree leaf item format.
Name Size Type Description
startChromIx 4 uint ID of first chromosome in item.
startBase 4 uint Position of first base in item.
endChromIx 4 uint ID of last chromosome in item.
endBase 4 uint Position of last base in item.
dataOffset 8 uint Offset to data in this index slot in file.
dataSize 8 uint Size of data in this index slot.
Table 27: R tree leaf item format.
R tree non-leaf item format.
Name Size Type Description
startChromIx 4 uint ID of first chromosome in item.
startBase 4 uint Position of first base in item.
endChromIx 4 uint ID of last chromosome in item.
endBase 4 uint Position of last base in item.
dataOffset 8 uint Offset in file to lower level index node.
Table 28: R tree non-leaf item format.
Overall format of a zoom level.
Name Size Description
zoomCount 4 Number of zoom records in this level.
zoomData Varies See table 30 for record format.
zoomIndex Varies R tree of zoomData. See Tables 26-28.
Table 29: Overall format of a zoom level.
191

Format of a zoomData record.
Name Size Type Description
chromId 4 uint Numerical ID for chromosome/contig.
chromStart 4 uint Start position (starting with 0).
chromEnd 4 uint End of item. Same as chromStart + itemSize in bases.
validCount 4 uint Number of bases for which there is data.
minVal 4 float Minimum value in region.
maxVal 4 float Maximum value in region.
sumData 4 float Sum of all data in region (one value for each base where
there is data).
sumSquares 4 float Sum of squares of all data in region.
Table 30: Format of a zoomData record.
B.6 BCF File Format
VCF is very expressive, accommodates multiple samples, and is widely used in the community. Its
biggest drawback is that it is big and slow. Files are text and therefore require a lot of space on
disk. A normal batch of 100 exomes is a few GB, but large-scale VCFs with thousands of exome
samples quickly become hundreds of GBs. Because the file is text, it is extremely slow to parse.
Overall, the idea behind is BCF2 is simple. BCF2 is a binary, compressed equivalent of VCF
that can be indexed with tabix and can be efficiently decoded from disk or streams. For efficiency
reasons BCF2 only supports a subset of VCF, in that all info and genotype fields must have their
full types specified. That is, BCF2 requires that if e.g. an info field AC is present then it must
contain an equivalent VCF header line noting that AC is an allele indexed array of type integer. The
master version of this document can be found at https://github.com/samtools/hts-specs.
B.6.1 Overall file organization
A BCF2 file is composed of a mandatory header, followed by a series of BGZF compressed blocks
of binary BCF2 records. The BGZF blocks allow BCF2 files to be indexed with tabix.
BGZF blocks are composed of a VCF header with a few additional records and a block of records.
Following the last BGZF BCF2 record block is an empty BGZF block (a block containing zero type
of data), indicating that the records are done.
A BCF2 header follows exactly the specification as VCF, with a few extensions/restrictions:
192

• All BCF2 files must have fully specified contigs definitions. No record may refer to a contig
not present in the header itself.
• All INFO and GENOTYPE fields must be fully typed in the BCF2 header to enable type-
specific encoding of the fields in records. An error should be thrown when converting a VCF
to BCF2 when an unknown or not fully specified field is encountered in the records.
B.6.2 Header
The BCF2 header begins with the “BCF2 magic” 5 bytes that encode BCFXY where X and Y are bytes
indicating the major number (currently 2) and the minor number (currently 1). This magic can be
used to quickly examine the file to determine that it’s a BCF2 file. Immediately following the BCF2
magic is the standard VCF header lines in text format, beginning with ##fileformat=VCFvX.Y.
Because the type is encoded directly in the header, the recommended extension for BCF2 formatted
files is .bcf. BCF2 supports encoding values in a dictionary of strings. The string map is provided
by the keyword ##dictionary=S0,S1,...,SN as a comma-separate ordered list of strings. See the
“Dictionary of strings” section for more details.
B.6.2.1 Dictionary of strings
Throughout the BCF file most string values are be specified by integer reference to their dictionaryvalues. For example, the following VCF record:
##INFO=<ID=ASP,Number=0,Type=Flag,Description="X">
##INFO=<ID=RSPOS,Number=1,Type=Integer,Description="Y">
##INFO=<ID=dbSNPBuildID,Number=1,Type=Integer,Description="Z">
##contig=<ID=20,length=62435964,assembly=B36,md5=f126cdf8a6e0c7f379d618ff66beb2da,species="Homo sapiens">
#CHROM POS ID REF ALT QUAL FILTER INFO
20 10144 rs144773400 TA T . PASS ASP;RSPOS=10145,dbSNPBuildID=134
20 10228 rs143255646 TA T . PASS ASP;RSPOS=10229;dbSNPBuildID=134
would be encoded inline in BCF2 by reference to the relative position of the header line in the header
(ASP=1, RSPOS=2, dbSNPBuildID=3, and PASS implicitly encoded in the last offset PASS=4)
##INFO=<ID=ASP,Number=0,Type=Flag,Description="X">
##INFO=<ID=RSPOS,Number=1,Type=Integer,Description="Y">
##INFO=<ID=dbSNPBuildID,Number=1,Type=Integer,Description="Z">
##contig=<ID=20,length=62435964,assembly=B36,md5=f126cdf8a6e0c7f379d618ff66beb2da,species="Homo sapiens">
#CHROM POS ID REF ALT QUAL FILTER INFO
0 10144 rs144773400 TA T . s0 s1;s2=10145;s3=134
0 10228 rs143255646 TA T . s0 s1;s2=10229;s3=134
Note that the dictionary encoding has the magic prefix ‘s’ here to indicate that the field’s value
is actually in the dictionary entry giving by the subsequent offset. This representation isn’t actually
the one used in BCF2 records but it provides a clean visual guide for the above example. Note also
how the contig has been recoded as a offset into the list of contig declarations.
193

Note that “PASS” is always implicitly encoded as the first entry in the header dictionary. This
is because VCF allows FILTER fields to be PASS without explicitly listing this in the FILTER field
itself.
B.6.2.2 Dictionary of contigs
The CHROM field in BCF2 is encoded as an integer offset into the list of ##contig field headers in
the VCF header. The offsets begin, like the dictionary of strings, at 0. So for example if in BCF2
the contig value is 10, this indicates that the actual chromosome is the 11th element in the ordered
list of ##contig elements. Here’s a more concrete example:
##contig=<ID=20,length=62435964,assembly=B36,md5=f126cdf8a6e0c7f379d618ff66beb2da,species="Homo sapiens">
##contig=<ID=21,length=62435964,assembly=B36,md5=f126cdf8a6e0c7f379d618ff66beb2da,species="Homo sapiens">
##contig=<ID=22,length=62435964,assembly=B36,md5=f126cdf8a6e0c7f379d618ff66beb2da,species="Homo sapiens">
#CHROM POS ID REF ALT QUAL FILTER INFO
20 1 . T A . PASS .
21 2 . T A . PASS .
22 3 . T A . PASS .
the actual CHROM field values in the encoded BCF2 records would be 0, 1, and 2 corresponding
to the first (offset 0) ##contig element, etc.
B.6.3 BCF2 records
In BCF2, the original VCF records are converted to binary and encoded as BGZF blocks. Each
record is conceptually two parts. First is the site information (chr, pos, INFO field). Immediately
after the sites data is the genotype data for every sample in the BCF2 file. The genotype data may
be omitted entirely from the record if there is no genotype data in the VCF file. Note that it’s
acceptable to not BGZF compress a BCF2 file, but not all readers may handle this uncompressed
encoding.
B.6.3.1 Site encoding
BCF2 site information encoding Field Type Notes l shared uint32 t Data length from CHROM to
the end of INFO l indiv uint32 t Data length of FORMAT and individual genotype fields CHROM
int32 t Given as an offset into the mandatory contig dictionary POS int32 t 0-based leftmost
coordinate rlen int32 t Length of the record as projected onto the reference sequence. May be the
actual length of the REF allele but for symbolic alleles should be the declared length respecting
the END attribute n allele info int32 t n info, where n allele is the number of REF+ALT alleles
in this record, and n info is the number of VCF INFO fields present in this record n fmt sample
uint32 t n sample, where n fmt is the number of format fields for genotypes in this record, and
n samples is the number of samples present in this sample. Note that the number of samples
194

must be equal to the number of samples in the header QUAL float Variant quality; 0x7F800001
for a missing value ID typed string REF+ALT list of n allele typed strings the first allele is REF
(mandatory) followed by n alleles - 1 ALT alleles, all encoded as typed strings FILTER Typed
vector of integers a vector of integer offsets into dictionary, one for each FILTER field value. “.” is
encoded as MISSING INFO field key/value pairs n info pairs of typed vectors The first value must
be a typed atomic integer giving the offset of the INFO field key into the dictionary. The second
value is a typed vector giving the value of the field Genotype value block see below see below
B.6.3.2 Genotype encoding
Genotype fields are encoded not by sample as in VCF but rather by field, with a vector of values
for each sample following each field. In BCF2, the following VCF line:
FORMAT NA00001 NA00002 NA00003
GT:GQ:DP 0/0:48:1 0/1:48:8 1/1:43:5
would encoded as the equivalent of:
GT=0/0,0/1,1/1 GQ=48,9,43 DP=1,8,5
Suppose there are i genotype fields in a specific record. Each i is encoded by a triplet:
BCF2 site information encoding
Field Type Notes
fmt key typed int Format key as an offset into the dictionary
fmt type uint8 t+ Typing byte of each individual value, possibly followed by
a typed int for the vector length. In effect this is the same
as the typing value for a single vector, but for genotype
values it appears only once before the array of genotype
field values
fmt values
(by fmt
type)
Array of values The information of each individual is concatenated in the
vector. Every value is of the same fmt type. Variable-
length vectors are padded with missing values; a string is
stored as a vector of char
The value is always implicitly a vector of N values, where N is the number of samples. The type
byte of the value field indicates the type of each value of the N length vector. For atomic values this
is straightforward (size = 1). But if the type field indicates that the values are themselves vectors
(as often occurs, such as with the PL field) then each of the N values in the outer vector is itself
a vector of values. This encoding is efficient when every value in the genotype field vector has the
same length and type.
195

Note that the specific order of fields isn’t defined, but it’s probably a good idea to respect the
ordering as specified in the input VCF/BCF2 file.
If there are no sample records (genotype data) in this VCF/BCF2 file, the size of the genotypes
block will be 0.
B.6.3.3 Type encoding
In BCF2 values are all strongly typed in the file. The type information is encoded in a prefix byte
before the value, which contains information about the low-level type of the value(s) such as int32
or float, as well as the number of elements in the value. The encoding is as follows:
BCF2 type descriptor byte
Bit Meaning
5,6,7,8 bits The number of elements of the upcoming type. For
atomic values, the size must be 1. If the size is set to 15,
this indicates that the vector has 15 or more elements,
and that the subsequent BCF2 byte stream contains a
typed Integer indicating the true size of the vector. If
the size is between 2-14, then this Integer is omitted
from the stream and the upcoming stream begins im-
mediately with the first value of the vector. A size of 0
indicates that the value is MISSING.
1,2,3,4 bits Type
The final four bits encodes an unsigned integer that indicates the type of the upcoming value in
the data stream.
BCF2 types
Lowest 4 bits Hexadecimal encoding Corresponding atomic type
1 0x?1 Integer [8 bit]
2 0x?2 Integer [16 bit]
3 0x?3 Integer [32 bit]
5 0x?5 Float [32 bit]
7 0x?7 Character, ASCII encoded in 8 bits
Note this is not used in BCF2, but its type is reserved in case this becomes necessary. In BCF2
characters are simply represented by strings with a single element 0,4,6,8-15 reserved for future use.
Integers may be encoded as 8, 16, or 32 bit values, in little-endian order. It is up to the encoder
to determine the appropriate ranged value to use when writing the BCF2 file. For each integer size,
196

the value with all bits set (0x80, 0x8000, 0x80000000) for 8, 16, and 32 bit values, respectively)
indicates that the field is a missing value.
Floats are encoded as single-precision (32 bit) in the basic format defined by the IEEE-754-1985
standard. This is the standard representation for floating point numbers on modern computers, with
direct support in programming languages like C and Java (see Java’s Double class for example).
BCF2 supports the full range of values from -Infinity to +Infinity, including NaN. BCF2 needs to
represent missing values for single precision floating point numbers. This is accomplished by writing
the NaN value as the quiet NaN (qNaN), while the MISSING value is encoded as a signaling NaN.
From the NaN wikipedia entry, we have:
For example, a bit-wise example of a IEEE floating-point standard single precision (32-bit) NaN
would be: s111 1111 1axx xxxx xxxx xxxx xxxx xxxx where s is the sign (most often ignored in
applications), a determines the type of NaN, and x is an extra payload (most often ignored in
applications). If a = 1, it is a quiet NaN; if a is zero and the payload is nonzero, then it is a
signaling NaN.
A good way to understand these values is to play around with the IEEE encoder webiste.
BCF2 bit representation for floating point NaN and MISSING
Value 32-bit precision Hexadecimal representation
NaN 0b0111 1111 1100 0000 0000 0000 0000 0000 0x7FC00000
MISSING 0b0111 1111 1000 0000 0000 0000 0000 0001 0x7F800001
Character values are not explicitly typed in BCF2. Instead, VCF Character values should be
encoded by a single character string. As with Strings, UNICODE characters are not supported.
Flags values – which can only appear in INFO fields – in BCF2 should be encoded by any non-
MISSING value. The recommended best practice is to encode the value as an 1-element INT8 (type
0x11) with value of 1 to indicate present. Because FLAG values can only be encoded in INFO fields,
BCF2 provides no mechanism to encode FLAG values in genotypes, but could be easily extended
to do so if allowed in a future VCF version.
String values have two basic encodings. For INFO, FORMAT, and FILTER keys these are
encoded by integer offsets into the header dictionary. For string values, such as found in the ID,
REF, ALT, INFO, and FORMAT fields, strings are encoded as typed array of ASCII encoded bytes.
The array isn’t terminated by a null byte. The length of the string is given by the length of the
type descriptor.
Suppose you want to encode the string ACAC. First, we need the type descriptor byte, which
is the string type 0x07 or’d with inline size (4) yielding the type byte of 0x40 — 0x07 = 0x47.
Immediately following the type byte is the four byte ASCII encoding of “ACAC” 0x41 0x43 0x41
197

0x43. So the final encoding is:
0x47 0x41 0x43 0x41 0x43 String type with inline size of 4 followed by ACAC in ASCII
Suppose you want to encode the string MarkDePristoWorksAtTheBroad, a string of size 27.
First, we need the type descriptor byte, which is the string type 0x07. Because the size exceeds the
inline size (27 > 15) we set the size to overflow, yielding the type byte of 0xF0 — 0x07 = 0xF7.
Immediately following the type byte is the typed size of 27, which we encode by the atomic INT8
value: 0x11 followed by the actual size 0x1B. Finally comes the actual bytes of the string: 0x4D
0x61 0x72 0x6B 0x44 0x65 0x50 0x72 0x69 0x73 0x74 0x6F 0x57 0x6F 0x72 0x6B 0x73 0x41 0x74
0x54 0x68 0x65 0x42 0x72 0x6F 0x61 0x64. So the final encoding is:
0xF7 string with overflow size
0x11 0x1B overflow size encoded as INT8
with value 27
0x4D 0x61 0x72 0x6B 0x44 0x65 0x50 0x72 0x69
0x73 0x74 0x6F 0x57 0x6F 0x72 0x6B 0x73 0x41
0x74 0x54 0x68 0x65 0x42 0x72 0x6F 0x61 0x64
message in ASCII
Suppose you want to encode the missing value ‘.’. This is simply a string of size 0 = 0x07.
In VCF there are sometimes fields of type list of strings, such as a number field of unbounded
size encoding the amino acid changes due to a mutation. Since BCF2 doesn’t directly support
vectors of strings (a vector of character is already a string) we collapse the list of strings into a
single comma-separated string, encode it as a regular BCF2 vector of characters, and on reading
explode it back into the list of strings. This works because strings in VCF cannot contain ‘ ,’ (it’s a
field separator) and so we can safely use ‘,’ to separate the individual strings. For efficiency reasons
we put a comma at the start of the collapsed string, so that just the first character can be examined
to determine if the string is collapsed.
To be concrete, suppose we have a info field around X=[A,B,C,D]. This is encoded in BCF2 as a
single string “,A,B,C,D” of size 8, so it would have type byte 0x87 followed by the ASCII encoding
0x2C 0x41 0x2C 0x42 0x2C 0x43 0x2C 0x44.
Vectors — The BCF2 type byte may indicate that the upcoming data stream contains not a
single value but a fixed length vector of values. The vector values occur in order (1st, 2nd, 3rd,
etc) encoded as expected for the type declared in the vector’s type byte. For example, a vector of
3 16-bit integers would be layed out as first the vector type byte, followed immediately by 3 2-byte
values for each integer, including a total of 7 bytes.
Missing values in vectors are handled slightly differently from atomic values. There are two
possibilities for missing values:
198

One (or more) of the values in the vector may be missing, but others in the vector are not. Here
each value should be represented in the vector, and each corresponding BCF2 vector value either set
to its present value or the type equivalent MISSING value. Alternatively the entire vector of values
may be missing. In this case the correct encoding is as a type byte with size 0 and the appropriate
type MISSING. Suppose we are encoding the record “AC=[1,2,3]” from the INFO field. The AC
key is encoded in the standard way. This would be immediately followed by a typed 8-bit integer
vector of size 3, which is encoded by the type descriptor 0x31. The type descriptor is immediately
followed by the three 8-bit integer values: 0x01 0x02 0x03, for a grant total of 4 bytes: 0x31010203.
Suppose we are at a site with many alternative alleles so AC=[1,2,3,4,5,6,7,8,9,10,11,12,13,14,15,16].
Since there are 16 values, we have to use the long vector encoding. The type of this field is 8 bit
integer with the size set to 15 to indicate that the size is the next stream value, so this has type
of 0xF1. The next value in the stream is the size, as a typed 8-bit atomic integer: 0x11 with value
16 0x10. Each integer AC value is represented by it’s value as a 8 bit integer. The grand total
representation here is:
0xF1 0x01 0x10 8 bit integer vector with overflow
size
0x01 0x02 0x03 0x04 0x05 0x06 0x07 0x08 0x09
0x0A 0x0B 0x0C 0x0D 0x0E 0x0F 0x10
1-16 as hexadecimal 8 bit integers
Suppose this INFO field contains the “AC=.”, indicating that the AC field is missing from a
record with two alt alleles. The correct representation is as the typed pair of AC followed by a
MISSING vector of type 8-bit integer: 0x01.
Vectors of mixed length — In some cases genotype fields may be vectors whose length differs
among samples. For example, some CNV call sets encode different numbers of genotype likelihoods
for each sample, given the large number of potential copy number states, rather padding all samples
to have the same number of fields. For example, one sample could have CN0:0,CN1:10 and another
CN0:0,CN1:10,CN2:10. In the situation when a genotype field contain vector values of different
lengths, these are represented in BCF2 by a vector of the maximum length per sample, with all
values in the each vector aligned to the left, and MISSING values assigned to all values not present
in the original vector. The BCF2 encoder / decoder must automatically add and remove these
MISSING values from the vectors.
For example, suppose I have two samples, each with a FORMAT field X. Sample A has values
[1], while sample B has [2,3]. In BCF2 this would be encoded as [1, MISSING] and [2, 3]. Diving
into the complete details, suppose X is at offset 3 in the dictionary, which is encoded by the typed
INT8 descriptor 0x11 followed by the value 0x03. Next we have the type of the each format field,
which here is a 2 element INT8 vector: 0x21. Next we have the encoding for each sample, A =
199

0x01 0x80 followed by B = 0x02 0x03. All together we have:
0x11 0x03 X dictionary offset
0x21 each value is a 2 element INT8 value
0x01 0x80 A is [1, MISSING]
0x02 0x03 B is [2, 3]
Note that this means that it’s illegal to encode a vector VCF field with missing values; the BCF2
codec should signal an error in this case.
A Genotype (GT) field is encoded in a typed integer vector (can be 8, 16, or even 32 bit if
necessary) with the number of elements equal to the maximum ploidy among all samples at a site.
For one individual, each integer in the vector is organized as (allele + 1) << 1 | phased where allele
is set to -1 if the allele in GT is a dot ‘.’ (thus the higher bits are all 0). The vector is padded with
missing values if the GT having fewer ploidy.
Examples:
0/1 in standard format (0 + 1) << 1 | 0 followed by (1 + 1) <<
1 | 00x02 0x04
0/1, 1/1, and
0/0
three samples encoded consecutively 0x020404040202
0 | 1 (1 + 1) << 1 | 1 = 0x05 preceded by the standard first byte
value 0x04
0x0405
./. where both alleles are missing 0x00 0x00
0 as a haploid it is represented by a single byte 0x02
1 as a haploid it is represented by a single byte 0x04
0/1/2 is tetraploid, with alleles 0x02 0x04 0x06
0/1 | 2 is tetraploid with a single phased allele 0x02 0x04 0x07
0 and 0/1 pad out the final allele for the haploid individual 0x04 0x80 0x02
0x04
The final example is something seen on chrX when we have a haploid male and a diploid female.
The spare male allele is just assigned the missing value.
Misc. notes
A type byte value of 0x00 is an allowed special case meaning MISSING but without an explicit
type provided.
200

Appendix C
Glyghs
Table 31: Glygh Library of Point/Interval Features, most of the descriptions are from this source:http://
webgbrowse.cgb.indiana.edu/webgbrowse/glyphdoc.html and the rest are from http://search.cpan.
org
Name of
GlyghDescription Single Glyph Glyphs in a track
Generic
Generic is identical to the ”box” glyph
except that it will draw the subparts
of features that contain subfeatures.
AlignmentDrawing features that consist of dis-
continuous segments.
Anchored
Arrow
The anchored arrow glyph draws an
arrowhead which is anchored at one or
both ends (has a vertical base) or has
one or more arrowheads. The arrow-
heads indicate that the feature does
not end at the edge of the picture, but
continues.
Arrow
The arrow glyph draws arrows which
can be labeled, be oriented vertically
or horizontally, or can contain major
and minor ticks suitable for use as a
scale.
Box
Box glyph is the most basic glyph. It
draws a filled box, but It does not draw
subparts.
201

Broken
Line
Broken line glyph draws a straight line
whose segment is shifted (sheared) up
or down.
CDS
”cds” glyph draws features associated
with a protein coding region. A se-
ries of color-coded boxes indicating the
translation frame are drawn at high
magnifications. But at low magnifica-
tions, the amino acid sequence of the
resulting protein is drawn.
Christmas
Arrow
The Christmas Arrow glyph draws an
arrow which has a circle (”christmas
ball”) dangling at one end.
Cross BoxCross Box is a box with an ”X” inside
the glyph.
Dashed
Line
The dashed line glyph draws a dashed
line.
Diamond
The diamond glyph draws a diamond
of fixed size, positioned in the center of
the feature.
Dot The dot glyph draws an ellipse.
DumbbellThe dumbbell glyph draws a dumbbell
with the same shapes on both ends.
DNA
This glyph draws DNA sequences. At
high magnifications, this glyph will
draw the actual base pairs of the se-
quence (both strands). At low magni-
fications, the glyph will plot the GC
content.
202

Ellipse
Ellipse is identical to the ”box” glyph
except that it will draw an oval instead
of a box.
ExEx is a box with an ”X” inside the
glyph.
FlagThe flag glyph draws a flag with a text
next to it.
Gene
The gene glyph is used for draw-
ing genes that may have alternatively-
spliced transcripts. The various iso-
forms are stacked on top of each other
and given a single label and description
that apply to the entire stack. The
name of each individual transcript is
optionally printed to the left of the
transcript glyph.
Lightning
The lightning glyph draws a lightning
bolt of specified height with relative
width, with the point of the lightning
bolt centered on the feature. This
glyph was designed to indicate point
mutations on a nucleotide or protein
backbone.
LineThe Line glyph draws a line parallel to
the sequence segment.
Pentagram
The Pentagram glyph draws a penta-
gram with the sharp angle pointing
right.
PInsertion
The Pinsertion glyph was designed
to show P-element insertions in the
Drosophila genome, but in fact is suit-
able for any type of zero-width feature.
203

Primer
The Primers glyph draws two arrows
oriented towards each other and con-
nected by a line of a contrasting color.
The length of the arrows is immate-
rial, but the length of the glyph itself
corresponds to the length of the scaled
feature.
Processed
Transcript
The processed transcript glyph is used
for drawing processed transcripts that
have both CDS and UTR segments.
Protein
The protein glyph draws protein se-
quences. At high magnifications, this
glyph will draw the actual amino acids
of the sequence. At low magnifications,
the glyph will plot the Kyte-Doolite
hydropathy.
Rndrect
(Rounded
Rectangle)
The rndrect glyph is designed to show
sequence features in round edge rect-
angles.
Ruler
Arrow
The ruler arrow glyph draws arrows
which can be labeled 5’ and 3’, be ori-
ented vertically or horizontally, or can
contain major and minor ticks suitable
for use as a scale.
Saw TeethThe saw teeth glyph draws a line of
saw teeth.
Segments
The segments glyph is used for drawing
features that consist of discontinuous
segments.
SpanSpan glyph draws a span with the ends
bordered by vertical lines.
Splice Site
Splice Site glyph was designed to show
an inverted ”L” representing splice
donors and acceptors. The vertical
part of the L points downwards and is
positioned in the center of the range.
204

Text in BoxText in Box glyph draws the specified
text in a rectangular box.
Three Let-
ter
The three letters glyph draws groups
of three letters separated by horizontal
lines.
Tic Tac
Toe
Tic Tac Toe glyph draws a sequence
of either ”xxx”, ”ooo” or ”xoxo”, de-
pending on the value of ”mode”.
Transcript
The Transcript glyph is used for draw-
ing transcripts. The direction of the
transcript is indicated by an arrow at-
tached to the end of the glyph.
Translation
Translation glyph draws the concep-
tual translation of DNA sequences. At
high magnifications, it simply draws
lines indicating open reading frames.
At low magnifications, it draws a con-
ceptual protein translation.
Triangle
Triangle glyph draws an equilateral tri-
angle when -point is defined. It draws
an isoceles triangle otherwise.
Two BoltsTwo bolts glyph draws two ”bolts” on
a line.
Wave The wave glyph draws a sine wave.
Weighted
Arrow
The Weighted Arrow glyph draws an
arrow which has is ”weighted” by a
square on the left side of the glyph or
a ”weight” and a vertical line.
205

Table 32: Glyphs for Continuous Data, most of the descriptions are from this source:http://webgbrowse.
cgb.indiana.edu/webgbrowse/glyphdoc.html and the rest are from http://search.cpan.org
Name of
GlyghDescription Glyphs in a track
XY Plot
XYPlot glyph is used for drawing features that have
a position on the genome and a numeric value. It
can be used to represent gene prediction scores, motif-
calling scores, percent similarity, microarray intensi-
ties, or other features that require a line plot. The X
axis represents the position on the genome, as per all
other glyphs. The Y axis represents the score.
Wiggle
density
This glyph draws quantitative data as a heatmap.
Higher-intensity parts of the feature will be drawn
with more saturation.
wiggle box
This glyph draws genomic features as rectangles. If
the feature contains subfeatures, then the glyph will
draw a single solid box that spans all the subfeatures.
206

Appendix D
Glossary
This section will contain a description or a definition for all the basic concepts used in this disser-
tation:
Annotation: Finding and interpreting functionally significant regions of the genome.
Apache: An open-source web server provided by the Apache Software Foundation.
Base pair: Two bases on opposite strands of a DNA molecule that are held together by weak
chemical bonds. The bp is also the measurement unit of DNA; the human genome contains
more than 3,000,000,000 bp.
Binary file: A computer file that is not a text file; it may contain any type of data, encoded in
binary form for computer storage and processing purposes. Many binary file formats contain
parts that can be interpreted as text.
Client: A computer process that requests a service from another computer and accepts the server’s
responses.
Data aggregation: Any process in which information is gathered and expressed in a summary
form, for purposes such as statistical analysis.
Flat File: A flat file is a data file that contains records (each corresponding to a row in a table);
however, these records have no structured relationships. To interpret these files, the format
properties of the file should be known.
Genome: The complete set of DNA within the nucleus of any organism is called its genome.
Genome Browser: In bioinformatics, a genome browser is a graphical interface for display of
information from a biological database for genomic data.
Geneticist: a biologist who specializes in genetics .
207

Gigabase (Gb): is one thousand million bases (1000,000,000 b or 1000,000,000 bp).
Glyph: is a graphical object that determine the shape of the displayed genomic features associated
with a specic track.
GMOD: is the Generic Model Organism Database project, a collection of interoperable open-
source software components for annotating, visualizing, managing and analyzing biological
data. GMOD is also an active community of software developers and biologists addressing
common challenges with their data.
HTML: Hyper Text Markup Language.
HTTP: HyperText Transfer Protocol.
ISO Standards: Standards established by International Organization for Standardization.
Kilobase (Kb): One thousand bases, or pairs of bases (1000 b or 1000 bp). In molecular biology,
commonly used to describe the length of a DNA/RNA molecule.
MAKER: A genome annotation pipeline that produces annotated eukaryotic genomes.
Megabase (Mb): One million bases or base pairs (1,000,000 b or 1,000,000 bp). In molecular
biology, commonly used to describe the length of a DNA/RNA molecule.
Model Organism: A model organism is a species that has been widely studied, usually because
it is easy to maintain and breed in a laboratory setting and has particular experimental
advantages.
Performance: A quantitative measure characterizing a physical or functional attribute relating to
the execution of a mission/operation or function.
Perl: Practical Extraction and Report Language.
Portability: (1) A term used to describe an object that can be easily moved, such as a portable
computer; (2) When referring to computer software, portability refers to how easy a software
program can be moved between computer Operating Systems.
Track: is a visual representation of one dataset. Each track shows data of a single type, such as a
genome, read alignment, gene set or generic annotation.
Server: A central computer (server) which provides services such as file storage, printing, and
communications in a network.
Semantic zooming: Representing the data differently at different zoom levels.
208

Session: In the computing world, a session refers to a limited time of communication between two
systems. Some sessions involve a client and a server. A common type of client/server session
is a Web or HTTP session. An HTTP session is initiated by a Web browser each time you
visit a website. While each page visit constitutes an individual session, the term is often used
to describe the entire time you spend on the website.
Sequence Ontology (SO): SO is a collaborative ontology project for the definition of sequence
features used in biological sequence annotation.
Sequence: the genomic sequence that represents the genome in the form of base pairs, which used
to define the coordinate system on which track data is plotted.
Sequence Coordinate: the locations on a genomic sequence, which has start and end coordinate
of a sequence. It determines the locations of features on the sequences.
Software requirement: (1) A software capability needed by a user to solve a problem to achieve
an objective; (2) A software capability that must be met or possessed by a system or system
component to satisfy a contract, standard, specification, or other formally imposed document.
SQL: Structured Query Language.
SRS: The Software Requirements Specification is a specification for a particular software product,
program, or set of programs that performs certain functions in a specific environment.
Use cases: A task analysis technique often used in software engineering. For each role of a system,
common tasks are written up with the prerequisites for each task, the steps to take for the user
and the system, and the changes that will be true after the task is completed. Use cases are
especially useful for making sure that common tasks are supported by the system, that they
are relatively straightforward, and that the system architecture reflects the task structure.
User class: A group of users for a system who have similar characteristics and requirements for
the system.
User interface: A user interface(UI) is the visual part of computer application or operating system
through which a user interacts with a computer or a software. It determines how commands
are given to the computer or the program and how information is displayed on the screen.
For examples, the graphical user interfaces (GUIs) – windows, icons, and pop-up menus have
become standard on personal computers.
User requirements: Address what the users need to do their jobs. These requirements are im-
plementation independent and are sometimes called ‘business requirements’.
209