Embed Size (px)
Citation preview

Requirements Engineering for Data Warehouses
Azadeh Nasiri∗,∗∗ 1, Esteban Zimányi∗ Robert Wrembel∗∗ 2
∗Department of Computer and Decision Engineering (CoDE)Université Libre de Bruxelles
{azadeh.nasiri, ezimanyi}@ulb.ac.be∗∗Institute of Computing Science,Poznan University of Technology
{azadeh.nasiri, Robert.Wrembel}@cs.put.poznan.pl
Abstract. Data Warehouses (DWs) aim at supporting the decision-making pro-cess of an organization. In the Requirements Engineering (RE) domain, sev-eral methods were proposed for the development of DWs, most of them basedon the Goal-Oriented Requirements Engineering (GORE) approach. However,there is not yet a comprehensive and unified perspective of the various methodsproposed. In this paper, a coherent view of the GORE approach for the devel-opment of DWs is presented, by classifying existing methods according to thedecision-making process, integrating them together, and linking modeling andanalysis techniques throughout the overall process. The result of our study is anintegrated GORE-based method for the development of DWs. We illustrate themethod with a concrete example from the health care sector.
1 Introduction
Business Intelligence (BI) systems deliver the capability of data analysis in order to contributeto the decision-making process. A Data warehouse (DW) is a fundamental component of BIsystems. A DW helps to identify what is happening and why it is happening in a business byproviding the multidimensional analysis capability of data obtained from different sources. Todevelop a DW, unlike transaction-oriented systems where often repetitive operations have to beanalysed for automation purposes, the analytical requirements supporting the decision-makingprocess in an organisation needs to be captured. These requirements are not easy to elicit andspecify. As a consequence, DW systems are sometimes developed based on an incomplete andinconsistent set of requirements, causing many of these projects to fail. Therefore, the successof the system under the development can be strongly affected by Requirements Engineering(RE) activities (Prakash and Gosain, 2008). RE is defined as the process of discovering the
1 This research is funded by the Erasmus Mundus Joint Doctorate IT4BI-DC.2 Polish National Science Center (NCN), grant No. 2011/01/B/ST6/05169.

Requirements Engineering for Data Warehouse Systems
needs of involved stakeholders and supporting those needs by modeling and documenting themin a form that is analysable and communicable. In order to support RE for DW systems, adedicated method is necessary.
Multiple methods have been proposed in the literature, which are based mainly on the Goal-Oriented Requirements Engineering (GORE) approach, which uses goals for eliciting, mod-eling, analyzing, negotiating, and modifying requirements. However, GORE-based methodsproposed for RE of DWs, are not unified; they have been developed based on different prin-ciples targeting various RE problems in the DW domain. Therefore, it is difficult to give acomprehensive GORE approach in the DW domain where a complete and consistent set of theDW requirements are taken into account. In this paper, we propose a GORE-based method forDW systems.
Our methodology to develop this method is based on the method engineering approach. Methodengineering is the discipline to construct new methods from existing ones. The componentsof the new method are obtained from existing methods and are combined as an activity model(comprising activities, activity structure, and activity sequence) with certain modeling tech-niques and types of documents and probably tools into a consistent structure (Winter andStrauch, 2004). Our methodology includes the following steps:– The components of the proposed method are adopted from existing GORE-based methods
for BI systems (to make it easier to study the existing works, we classify them based on theircontributions to each phase of the decision-making process.
– In each phase of the decision-making process, the appropriate components are selected basedon the best coverage of abstracting the decision-making process in the given phase.
– For each phase, guidelines are proposed including necessary activities for abstracting thedecision-making process, supported by proper goal modeling and analysis techniques.
– Guidelines containing activities, goal modeling and analysis technique, mentioned in theprevious item, are integrated all across the decision-making phases.
The advantages of the proposed method are as follows:– We involve the decision-making process in the early phase of the system development where
the requirements are abstracted. It contributes to the problem addressed in the BI litera-ture, saying that the capabilities offered by DW systems are not matched with the decision-making process.
– According to our knowledge, there is no method in the RE literature for BI that covers allphases of the decision-making process. Our approach covers them all. The majority ofproposed methods focus mainly in the last phase of the decision-making process, where theinformation requirements of the DW are obtained from the goal model. Usually, analysisof the organisational context where different decision alternatives are constructed has beenignored in the literature.
– This methodology gives us the opportunity to take advantage of the contribution of existingworks in the RE for BI systems.
The paper is organised as follows. Section 2 outlines the GORE approach according to thedecision-making process using a running example from the health care sector. Section 3 con-cludes the paper and points to future work.

A. Nasiri et al.
2 GORE and the Decision-Making Process
According to (Herbert, 1960), the decision-making process consists of three phases: (a) search-ing for conditions that call for decision-making, and (b) analysing possible courses of actions,(c) selecting a proper course of action from available options available.
GORE uses goals for eliciting, modeling, analyzing, negotiating, and modifying requirements.A goal is an objective, which the system under consideration should achieve. Goal identifica-tion is not necessarily an easy task. Goals may be formulated at different levels of abstraction,ranging from high-level, strategic concerns to low-level, technical concerns. This differencein goal levels suggests a structuring mechanism for identifying goals. Goal refinement treesprovide such a mechanism. A goal refinement tree or a goal model is a graphical representationof the reduction of goals to sub-goals that elaborate how the goal is achieved. Goal modelingsupports heuristic, qualitative or formal reasoning schemes during RE.
In the following subsections, we clarify how the GORE approach can reflect phases of thedecision-making process. The paper is organised based on the process phases. Each subsec-tion contains: the main objective of the phase, the main existing approaches proposed in theliterature, suitable RE modeling and analysis techniques and then applications to a runningexample. We use the following case study from the health care domain as running example.
In the pharmaceutical industry, Adverse Events (AEs) are crucial in the assessment of drug,and consequently patient safety. According to World Health Organisation (WHO) an AE is anunexpected, or potentially harmful reaction resulting from the use of a prescribed medication.Many AEs are not discovered through limited pre-marketing clinical trials. Instead, they areonly seen in long term, post-marketing surveillance of drug usage. In light of this, pharmaceu-tical companies typically need to collect related data and carry out analytics over these data tomake well-informed decisions in order to avoid AEs. In this regard, we aim to analyse require-ments of an analytical system through which a pharmaceutical company is able to answer thequestion of what happens regarding AEs and why it is happening, to drive decision-making.The target system should help decision-makers gain some descriptive insight regarding AEsoccurrences. Briefly, the analytical system under development should enable the company tofollow up its strategic goals relevant to AEs, to observe the current status regarding goals,and to find the factors influencing them. The company decided to develop a DW to meet theaforementioned requirements.
2.1 Phase 1: Conditions for Decision Making
RE objective and discussion: in the context of BI, requirements are initiated by senior man-agers and executives through high-level statements of strategies. The RE initial challenge is toderive what decisions needs to be made to fulfill a particular strategy. Deriving decisions fromstrategies is not a straightforward process. This needs understanding the cause-effect nature ofdecisions related to that strategy. The strategy needs to be analysed in its business context toclarify these cause-effect relationships. For example, in a pharmaceutical company, the seniormanager states the need to “Increase patient safety” as a high-level strategy. It is vague andneeds analysis in the context of pharmaceutical industry, to clarify what are the decisions that

Requirements Engineering for Data Warehouse Systems
the senior manager needs to take to increase the probability of accomplishing this goal. Thefirst step is to understand what can affects this strategy. In the context of the pharmaceuticalindustry, AEs occurrence is shown to affect patient safety. To “Decrease AEs” firstly one needsto clarify what causes the occurrence of AEs. The lack of patient’s knowledge of how to use adrug or low-quality drugs are some causes.
OR
Increase patients' knowledge
(G3)
Strategy A Strategy C
Training programme
(P1)
Regulatory authority
Pharmaceutical company-
Hurt
+Help
+Help +Help
Strategy B
+Help
Legend:
Influence
Decomposition
Situation
Goal
Contribution relation
Refinement node: AND, OR, XOR
Increase patient safety
(G1)
Decrease AEs(G2)
Increase Patient follow-up
(G4)
Increase drug quality
(G5)
Decrease costs(G6)
Raw material selection
(P2)
Patient communication
(P2)
-
FIG. 1: Goal model representing a strategic goals and associated tasks
The strategy through the RE activity is translated into decisions that need to be made. Inthe above pharmaceutical example, the manager should now decide either to invest in patient’sknowledge or drug quality, in order to decrease AEs and subsequently, increase patients’ safety.
RE modeling and analysis: RE aims to provide formal modeling foundations and proper rep-resentations of variables, which are important for decisions required to be made in a business.RE also presents relationships between variables, and the context for the decision itself. Tothis end, a conceptual model of the business is constructed to give decision makers a compre-hensive view of what they need to take into account. This model captures business objectives,business processes, performance indicators, or any other business related concepts to drivestrategic decision-making. Different approaches were proposed. For example, in (Pourshahidet al., 2009) the model is developed based on the Business Process Improvement (BPI) con-cept. The proposal in (Jiang et al., 2011) was inspired by SWOT analysis. A strategy mapwas the basis for business modeling in (Babar et al., 2010). However, it is important to notethat proposing a detailed methodology of an appropriate business model is beyond the scopeof RE. How to formally model and represent business concepts to abstract the context for thedecision is the RE challenge.
The basis for all proposals is the typically well-established GORE frameworks. Goal modelsare the core of such frameworks. The notion of a goal is used to represent the strategy. Goalrefinement trees are used to abstract possible alternatives to satisfy strategic goals.
Running example: inspired by (Pourshahid et al., 2009, 2011), we show how the cause-effectnature of the decision is modeled and evaluated. Adopted from the User Requirements Nota-tion (URN) framework, various types of elements like goals, tasks (or processes), as well as

A. Nasiri et al.
stakeholders are used for such representation. Elements are linked by AND/OR decompositionand contributions. They help to represent the relationships between the business concepts andsimulating cause-effect relationships in the decision context. Elements influence each otherthrough contributions which are qualitative positive (make, help, some positive) and negative(break, hurt, some negative).
Fig. 1 illustrates some of the above concepts with a health care domain example, where regula-tory authority wants to “Increase patient safety”, which has been refined to a lower-level goal of“Decrease AEs”. This goal is broken down into two non-mutually exclusive goals of “Increasepatient’s knowledge” and “Increase drug quality”. The task of “Training programme” can helpto satisfy “Increase patient’s knowledge”. The “Raw material selection” task can satisfy “In-crease drug quality” goal. However, the latter task can hurt the objective of pharmaceuticalcompany with its goal of “Decrease costs”.
OR
Increase patients' knowledge
(G3)
Strategy A Strategy C
Training programme
(P1)
Regulatory authority
-
+Help
Strategy B Legend:
Influence
Decomposition
Situation
Goal
Contribution relation
Refinement node: AND, OR, XOR
Increase patient safety
(G1)
Decrease AEs(G2)
Increase Patient follow-up
(G4)
Increase drug quality
(G5)
Raw material selection
(P2)
Patient communication
(P2)
Decrease in cost of health care employees
(S2)
Threat
Opportunity
FIG. 2: Goal model of Fig. 1 incorporating SWOT analysis
Depending on various approaches taken to model the business, some new concepts might beadded to the goal model. For example, in (Barone et al., 2011a,b; Jiang et al., 2011; Maté et al.,2012) new concepts called situation-based on the SWOT (strengths, weaknesses, opportunities,and threat) analysis, are involved in the goal model. As it was mentioned earlier, detailedmethodology of the SWOT analysis is not our RE challenge. How to represent and analyse thenew concept of situation (or any other business concepts) in the goal model is the challenge.
Fig. 2 illustrates how the concept of situation adopted from the SWOT analysis is incorporatedwith the goal model. For example, “Increase (R & D) cost” is a potential threat for a pharma-ceutical company. To model this situation, representative symbols are required. Analogouslyto the contribution relationships, there is an “influence” arrow representing the relationshipbetween a situation and any other element in the goal model. Also, analogous to satisfactionlevels for goals, there are occurrence levels for situations, that define the degree to which asituation occurs in the current circumstances.

Requirements Engineering for Data Warehouse Systems
2.2 Phase 2: Analysing Possible Courses of Actions
RE objective and discussion: business strategies were translated into decisions, and alternativesof decisions were determined by clarifying the cause-effect relationships of business concepts(Section 2.2). Now, RE aims to evaluate decision alternatives by quantifying or qualifying theeffect of each alternative on the goal satisfaction. For example, in the pharmaceutical context,it was clarified that the manager has to decide between two alternatives: investing in patients’knowledge or investing in drug quality in order to decrease AEs and subsequently increasepatient safety. Now, the RE objective is to clarify which one of those alternatives has moreeffect on patient safety. To do that, RE needs to evaluate the satisfaction level of the strategicgoal for a given alternative. Qualitative and quantitative evaluations are both covered.
RE modeling and analysis: RE aims to provide a proper analysis foundation to evaluate goalsatisfaction. The analysis is conducted over the business conceptual models constructed in theprevious part (see Section 2.2). This satisfaction value can be presented defining some criteriaas well. In the two following subsections, we discuss how to conduct the analysis to evaluatethe satisfaction levels of goals, and then we show how this analysis differs when a criterion isdefined to measure the satisfaction of goals.
2.2.1 Evaluating Goal Satisfaction
Goal models are the basis for this analysis, as the business conceptual model is built on the goalmodel (Section 2.2). As Fig. 2 illustrates, each branch in the goal refinement tree representsan alternative to satisfy the strategic goal. To see which alternative is the most effective, weneed to evaluate the cause-effect relationships drawn in each branch of the goal refinementtree. Different proposals exist in the literature. Some papers use conventional goal evaluationmethods based on the GORE framework. For example, (Pourshahid et al., 2009, 2011) usedthe URN conventional evaluation method. There are also proposals applying some decisionmaking mechanisms for evaluation. For example, (Jiang et al., 2011), makes the influencediagram with goals and uses probability-based statistics to evaluate satisfaction levels.
Running example: inspired by the (Pourshahid et al., 2009, 2011) approach and based on “GRLevaluation strategies” we evaluate alternatives. The “what-if” analysis is conducted to evaluatethe impact of an alternative solution on a high-level goal. GRL evaluation strategies enablemodelers to assign initial satisfaction values to some of the elements of the goal model andpropagate this information to the other elements through links. Links are assigned a contribu-tion level by experts, defined as qualitative positive (make, help, some positive) or qualitativenegative (break, hurt, some negative). Fore example, quantitative contribution levels on a scalegoing from −100 to +100 might be assigned.
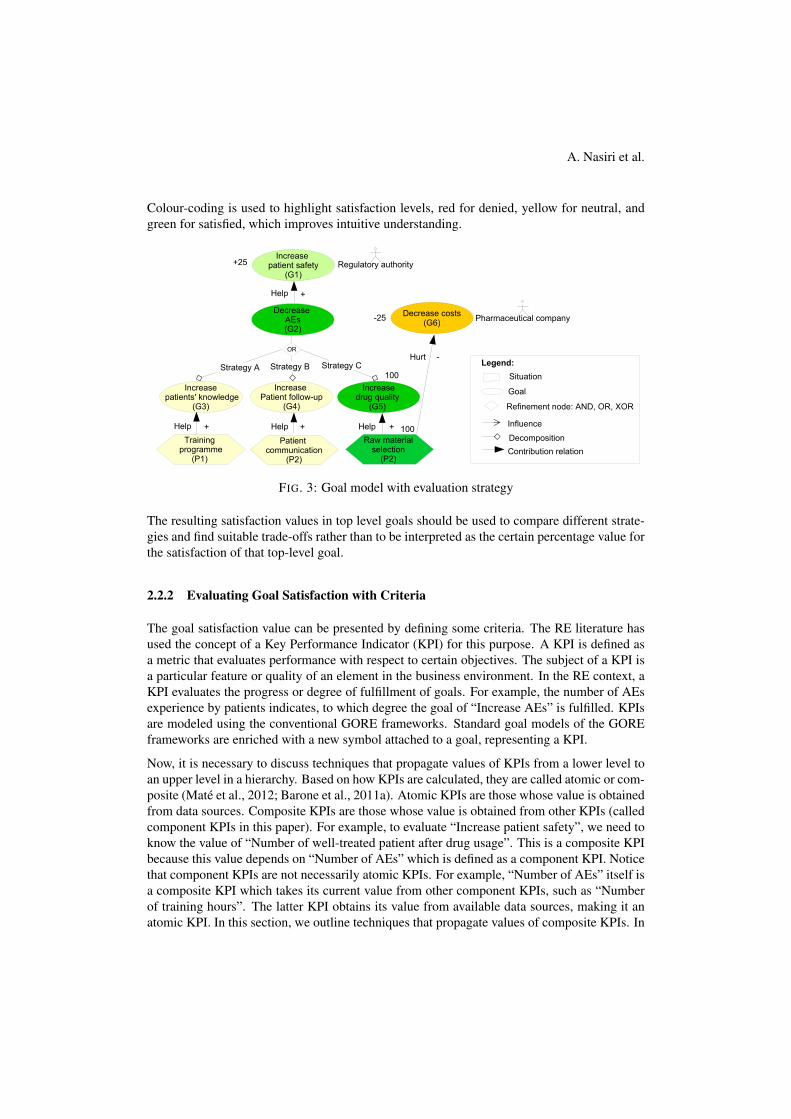
Fig. 3 illustrates the result of an analysis for our example where the “Raw material selection”is picked to fulfill the strategic goal. The satisfaction value of the task is initialised to 100(initialised elements are displayed with dashed contours). This eventually leads to a satisfiedvalue of +25 for the goal of “Increase safety” and to an unsatisfied level of −25 for “Decreasecost” (−25 and +25 are the values propagated from the initiated 100 for the “Raw materialselection” transferred through links with quantitative contribution levels, defined by experts).
A. Nasiri et al.
Colour-coding is used to highlight satisfaction levels, red for denied, yellow for neutral, andgreen for satisfied, which improves intuitive understanding.
OR
Increase patients' knowledge
(G3)
Strategy A Strategy C
Training programme
(P1)
Regulatory authority
Pharmaceutical company-
Hurt
+Help
+Help +Help
Strategy B
+Help
Legend:
Influence
Decomposition
Situation
Goal
Contribution relation
Refinement node: AND, OR, XOR
Increase patient safety
(G1)
Decrease AEs(G2)
Increase Patient follow-up
(G4)
Increase drug quality
(G5)
Decrease costs(G6)
Raw material selection
(P2)
Patient communication
(P2)
-
100
100
-25
+25
FIG. 3: Goal model with evaluation strategy
The resulting satisfaction values in top level goals should be used to compare different strate-gies and find suitable trade-offs rather than to be interpreted as the certain percentage value forthe satisfaction of that top-level goal.
2.2.2 Evaluating Goal Satisfaction with Criteria
The goal satisfaction value can be presented by defining some criteria. The RE literature hasused the concept of a Key Performance Indicator (KPI) for this purpose. A KPI is defined asa metric that evaluates performance with respect to certain objectives. The subject of a KPI isa particular feature or quality of an element in the business environment. In the RE context, aKPI evaluates the progress or degree of fulfillment of goals. For example, the number of AEsexperience by patients indicates, to which degree the goal of “Increase AEs” is fulfilled. KPIsare modeled using the conventional GORE frameworks. Standard goal models of the GOREframeworks are enriched with a new symbol attached to a goal, representing a KPI.
Now, it is necessary to discuss techniques that propagate values of KPIs from a lower level toan upper level in a hierarchy. Based on how KPIs are calculated, they are called atomic or com-posite (Maté et al., 2012; Barone et al., 2011a). Atomic KPIs are those whose value is obtainedfrom data sources. Composite KPIs are those whose value is obtained from other KPIs (calledcomponent KPIs in this paper). For example, to evaluate “Increase patient safety”, we need toknow the value of “Number of well-treated patient after drug usage”. This is a composite KPIbecause this value depends on “Number of AEs” which is defined as a component KPI. Noticethat component KPIs are not necessarily atomic KPIs. For example, “Number of AEs” itself isa composite KPI which takes its current value from other component KPIs, such as “Numberof training hours”. The latter KPI obtains its value from available data sources, making it anatomic KPI. In this section, we outline techniques that propagate values of composite KPIs. In

Requirements Engineering for Data Warehouse Systems
(Barone et al., 2011b) some techniques have been presented to derive the value of compositeKPIs such as: conversion factors, normalisation, and qualitative techniques.
Conversion Factor Technique This technique is used when a composite KPI does not sharethe same unit of measure with its components and a suitable conversion factor is available.
Running example: considering composite KPI “Number of AEs” and component KPI “Numberof training hours”, we need to convert the current value of “Number of training hours” into thenumber of avoidable AEs experienced by patients.
One possible conversion factor is to use the average of AEs experienced by patients due to theirlack of knowledge. Assume this average has been 400 patients per year. Training doctors andpharmacists to increase the knowledge of patients has a considerable effect on this average.The average training time per year is 350 hours. These averages come from the previous dataor the experience of experts. So, for each training hour we have 400÷ 350 = 1.1 AEs (roundedto 1). We can consider this number as the conversion factor meaning for each training hour wewould have one avoidable AE (a conversion factor typically is estimated based on a previousexperience).
OR
Increase patients' knowledge
(G3)
Strategy A Strategy CStrategy B
Decrease AEs(G2)
Increase Patient follow-up
(G4)
Increase drug quality
(G5)
Number of traininghours(Xg4)
cv= 20 hours
Number of communication channels
(Xg5)
Cv= 4 channels
Number of AEs dueto ineffective drug
(Xg3)
cv= 20 hours
Number of traininghours(Xg4)
cv= 20 hours
Composite KPI Ws1Cs1
Increment in cost(Xs1)
cv=10%
Legend:
Situation
Goal
Refinement node: AND, OR, XOR
KPI
Influence
Refinement
cv= current value
W=weight
C=conversion factor
FIG. 4: Conversion factor technique for composite KPIs
When conversion factors are available, a formula containing the following components can cal-culate the value of the composite KPI: composite KPI: Xc
gi, component KPI: Xgi, situation-related component KPI: Xsi, influence strength: Wgi, Situation-related influence strength:Wsi, conversion factor: Cgi, situation-related conversion factor: Csi, expected value of a com-posite KPI: Xe
gi. The formula for the example in Fig. 4 is as follows:
Xg2 = Xeg2 +Ws1 · Cs1 ·Xs1 +
∑i=5i=3 Wgi · Cgi ·Xgi
The formula comprises two major components influencing the value of the composite KPI: thefirst components refers to KPIs of situation (related to the SWOT analysis, see Section 2.2),and the second component is related to KPIs of sub-goals. Xe
g2 is the expected value of AEsexperience by patients obtained from historical data or experts.
A. Nasiri et al.
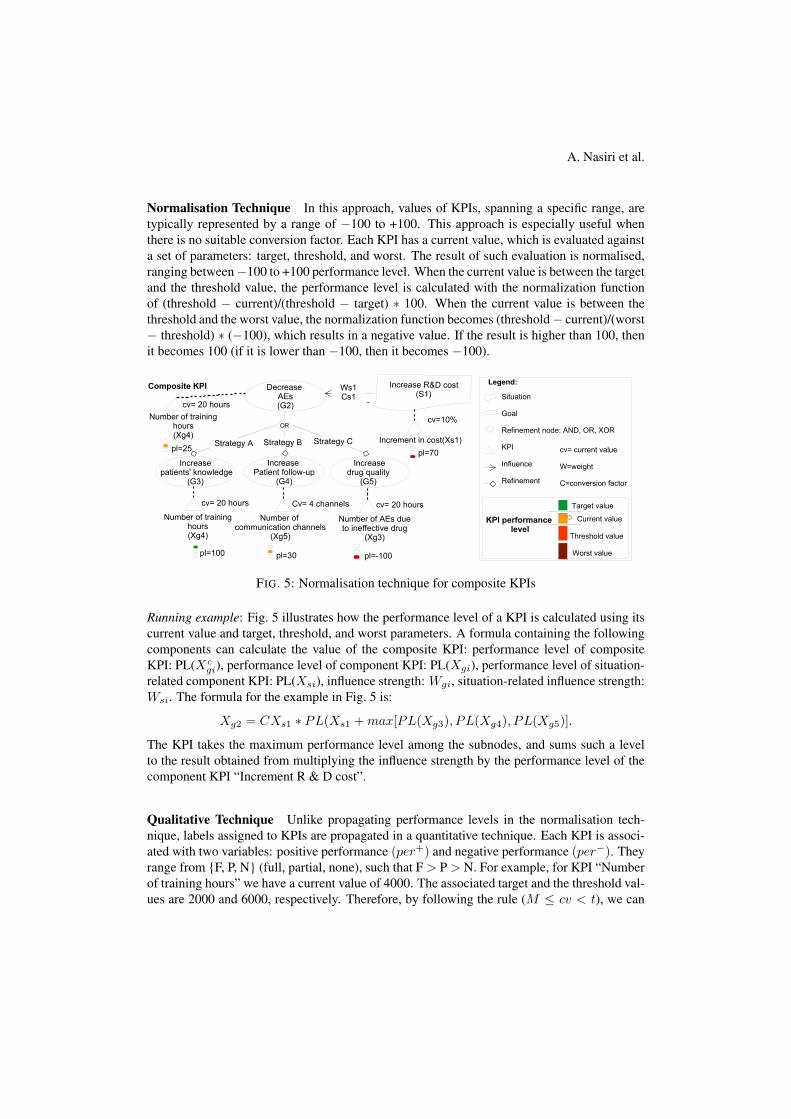
Normalisation Technique In this approach, values of KPIs, spanning a specific range, aretypically represented by a range of −100 to +100. This approach is especially useful whenthere is no suitable conversion factor. Each KPI has a current value, which is evaluated againsta set of parameters: target, threshold, and worst. The result of such evaluation is normalised,ranging between−100 to +100 performance level. When the current value is between the targetand the threshold value, the performance level is calculated with the normalization functionof (threshold − current)/(threshold − target) ∗ 100. When the current value is between thethreshold and the worst value, the normalization function becomes (threshold− current)/(worst− threshold) ∗ (−100), which results in a negative value. If the result is higher than 100, thenit becomes 100 (if it is lower than −100, then it becomes −100).
OR
Increase patients' knowledge
(G3)
Strategy A Strategy C
-
Strategy B
Decrease AEs(G2)
Increase Patient follow-up
(G4)
Increase drug quality
(G5)
Number of traininghours(Xg4)
cv= 20 hours
Number of communication channels
(Xg5)
Cv= 4 channels
Number of AEs dueto ineffective drug
(Xg3)
cv= 20 hours
Number of traininghours(Xg4)
cv= 20 hours
Composite KPI Ws1Cs1
Increment in cost(Xs1)
cv=10%
Legend:
Situation
Goal
Refinement node: AND, OR, XOR
KPI
Influence
Refinement
Target value
Threshold value
Worst value
cv= current value
W=weight
C=conversion factor
Current valueKPI performance level
pl=70
pl=-100pl=30pl=100
pl=25
FIG. 5: Normalisation technique for composite KPIs
Running example: Fig. 5 illustrates how the performance level of a KPI is calculated using itscurrent value and target, threshold, and worst parameters. A formula containing the followingcomponents can calculate the value of the composite KPI: performance level of compositeKPI: PL(Xc
gi), performance level of component KPI: PL(Xgi), performance level of situation-related component KPI: PL(Xsi), influence strength: Wgi, situation-related influence strength:Wsi. The formula for the example in Fig. 5 is:
Xg2 = CXs1 ∗ PL(Xs1 +max[PL(Xg3), PL(Xg4), PL(Xg5)].
The KPI takes the maximum performance level among the subnodes, and sums such a levelto the result obtained from multiplying the influence strength by the performance level of thecomponent KPI “Increment R & D cost”.
Qualitative Technique Unlike propagating performance levels in the normalisation tech-nique, labels assigned to KPIs are propagated in a quantitative technique. Each KPI is associ-ated with two variables: positive performance (per+) and negative performance (per−). Theyrange from {F, P, N} (full, partial, none), such that F > P > N. For example, for KPI “Numberof training hours” we have a current value of 4000. The associated target and the threshold val-ues are 2000 and 6000, respectively. Therefore, by following the rule (M ≤ cv < t), we can

Requirements Engineering for Data Warehouse Systems
conclude that for the “Number of training hours” performance evidences are per+=“partial”and per−=“none”.
A major difference between this technique with the normalisation and conversion factor tech-niques is that conflicts are allowed. It means that a KPI can have, at the same time, evidenceof both positive and negative performance. To assign a current evidence to a KPI, the mappingrules, described in Table 1, are used.
cv ≥ t M ≤ cv < t th ≤ cv < M w ≤ cv < thper+=“Full” per+=“Partial” per+=“None” per+=“None”per−=“None” per−=“None” per−=“Partial” per−=“Full”
TAB. 1: Mapping rules in qualitative techniques for composite KPIs (Barone et al., 2011b)
Required components to derive the qualitative value of a composite KPI from related com-ponent KPIs are as follows: composite KPI: Xc, component KPI: Xa, positive performance:per+, negative performance: per−, F=“full”, P=“partial”, N=“none”, F > P > N, influencestrength-satisfied: (or), (+D), (-D), (++D), (- -D), influence strength-denied: (+S), (-S), (++S),(- -S).
(Xai , X
aj )
and7−−→ Xc Xai
+S7−−→ Xc Xai
−S7−−→ Xc Xai
++S7−−−→ Xc Xai
−−S7−−−→ Xc
min
{per+(Xa
i )per+(Xa
j )max
{per+(Xa
i )P
N per−(Xai ) N
min
{per−(Xa
i )per−(Xa
j )N min
{per−(Xa
i )per−(Xa
j )N per−(Xa
i )
TAB. 2: Mapping rules in qualitative techniques for composite KPIs (Barone et al., 2011b)
Table 2, adopted from qualitative reasoning with goal models (Giorgini et al., 2003), helpsto propagate qualitative values for composite KPIs. The qualitative evidences are assignedto each component KPI using the mapping rule in Table 1. The next step is to rely on thepropagation rules described in Table 2 to evaluate qualitatively the composite KPI (the secondrow in the table represents the (per+) value and the third raw the (per−) value of a compositeKPI).
Running example: for “Number of AEs”, we start to propagate three KPIs associated to thecorresponding sub-goals by relying on the rules in the first column of Table 2. Therefore, forthe per+ and per− variables, we need to choose the maximum and minimum respectively,among values of the component KPIs. The result is:{
per+(from-subnodes) = max[per+(Xg3), per+(Xg4), per
+(Xg5)] = Fullper−(from-subnodes) = min[per−(Xg3), per
−(Xg4), per−(Xg5)] = None
We also need to propagate the component KPI which refers to situation “Increase R & D cost”,negatively, related to goal “Decrease AEs”. To calculate its impact on the composite KPI, werely on the third column rule in Table 2.
per+(from-influencer) = min
{per+(Xs1) = None
P= None

A. Nasiri et al.
per+(from-influencer) = min
{per+(Xs1) = Full
P= Full
OR
Increase patients' knowledge
(G3)
Strategy A Strategy C
-
Strategy B
Decrease AEs(G2)
Increase Patient follow-up
(G4)
Increase drug quality
(G5)
Number of traininghours(Xg4)
cv= 20 hours
Number of communication channels
(Xg5)
Cv= 4 channels
Number of AEs dueto ineffective drug
(Xg3)
cv= 20 hours
Number of traininghours(Xg4)
cv= 20 hours
Composite KPI
Increment in cost(Xs1)
cv=10%
Legend:
Situation
Goal
Refinement node: AND, OR, XOR
KPI
Influence
Refinement
Target value
Threshold value
Worst value
cv= current value
th=threshold
t=target
w=worst
M=middle value (among the t & th)
Current value
Conflict
+ - + - + -
+ -
+ -
+ -
+ -
+ -
+ -
cv ≥ t
M ≤ cv < t
th ≤ cv < M
+ -
+ -
+ -
+ -w ≤ cv < th
FIG. 6: Qualitative technique for composite KPIs
At the end, results obtained from component KPIs of sub-goals need to be combined with re-sults obtained from influencers. The final result is illustrated in Fig. 6. A conflict is discoveredfor the composite KPI “Number of AEs” when values are propagated.
2.3 Phase 3: Selecting a Proper Course of Action
Objective and discussion: after discussing the evaluation mechanism of goal satisfactions, it isnecessary to discuss which data is required for KPIs, presenting degrees of a goal satisfaction.RE discusses what data in which form is of particular interest for decision makers to store inDWs. There are various drivers to obtain the information including: business processes pro-posed by (Chowdhary et al., 2006; Frendi and Salinesi, 2003; Kimball, 1998), decision processproposed by (Winter and Strauch, 2004) as well as goals and objectives of an organisation pro-posed by (Bonifati et al., 2001; Gallardo et al., 2009; Ghezzi et al., 2008; Malinowski andZimányi, 2006; Mazón et al., 2007a, 2005, 2007b; Prakash and Bhardwaj, 2012; Prakash andGosain, 2008; Silva et al., 2012).
RE modeling and analysis: organisational goals are the most popular drivers to obtain theinformation requirements of a DW. Information is derived mainly using GORE frameworks.Goal models are adapted to eventually represent the information in the Multidimensional (MD)schema with elements of facts (center of analysis) and dimensions (context of analysis). Weaim to derive this information from KPIs discussed in the previous section inspired by guide-lines provided by Mazón et al. (2005).
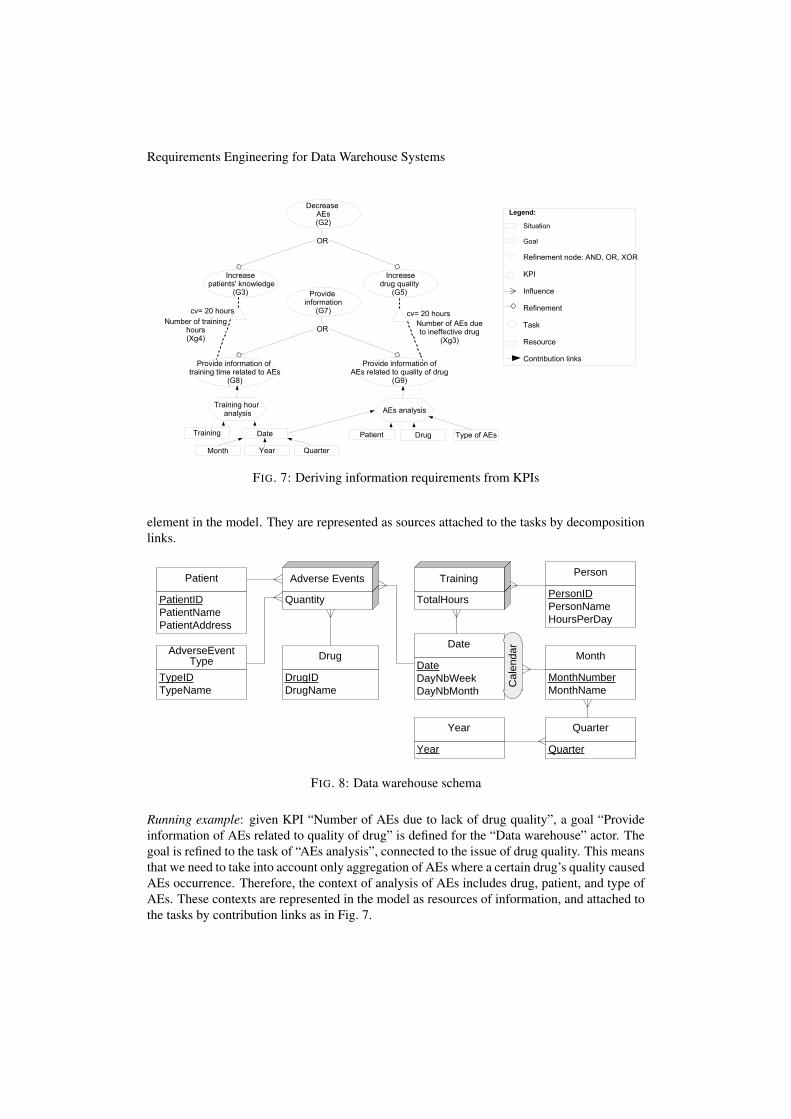
The first step is to incorporate DW in the goal model as an actor. The goal of the “Datawarehouse” actor is to provide information requirements. For each atomic KPI in the model,a goal is represented stating the information target of a KPI (typically aggregated measures).Measures need to be refined into tasks that calculate measures in some contexts. Tasks areassociated to goals with contribution links. It is necessary to include the context as a new
Requirements Engineering for Data Warehouse Systems
OR
Increase patients' knowledge
(G3)
Decrease AEs(G2)
Increase drug quality
(G5)
cv= 20 hours
Number of AEs dueto ineffective drug
(Xg3)
cv= 20 hours
OR
Provide information of training time related to AEs
(G8)
Provide information
(G7)
Provide information of AEs related to quality of drug
(G9)
Number of traininghours(Xg4)
Training hour analysis AEs analysis
Date
QuarterMonth Year
Patient Drug Type of AEsTraining
Legend:
Situation
Goal
Refinement node: AND, OR, XOR
KPI
Influence
Refinement
Task
Resource
Contribution links
FIG. 7: Deriving information requirements from KPIs
element in the model. They are represented as sources attached to the tasks by decompositionlinks.
TotalHours
Training
Date
Date
DayNbWeek
DayNbMonth
Ca
len
da
r
Month
MonthNumber
MonthName
Quarter
Quarter
Year
Drug
DrugID
DrugName
Patient
PatientID
PatientName
PatientAddress
AdverseEvent Type
TypeID
TypeName
Quantity
Adverse EventsPerson
PersonID
PersonName
HoursPerDay
Year
FIG. 8: Data warehouse schema
Running example: given KPI “Number of AEs due to lack of drug quality”, a goal “Provideinformation of AEs related to quality of drug” is defined for the “Data warehouse” actor. Thegoal is refined to the task of “AEs analysis”, connected to the issue of drug quality. This meansthat we need to take into account only aggregation of AEs where a certain drug’s quality causedAEs occurrence. Therefore, the context of analysis of AEs includes drug, patient, and type ofAEs. These contexts are represented in the model as resources of information, and attached tothe tasks by contribution links as in Fig. 7.

A. Nasiri et al.
For KPI “Number of training hours”, we need to see how training of pharmacists, doctors, andhospital personnel for increasing patients’ knowledge, is related to AEs occurrence. A goal of“Provide information of training hours related to AEs” is defined and then refined to two tasksof “AEs analysis” and “Training hours analysis”. The first task is the same task introduced forthe KPI explained in the previous paragraph but, this time, we look for AEs caused by patients’lack of knowledge.
The second task looks for total training hours in a certain period so that the training and the dateof training are considered as a context. These contexts can also be linked to “Number of AEs”task as they should be counted in a certain period. To conclude, resources are: “Drug”, “Date”,“Training”, “Type of AEs”, and “Patient”. Within a context of analysis, there are several levelsof aggregation, which are represented as resources too. For example, “Date” can be aggregatedby month, quarter, and year (see Fig. 7). Now we can derive the multidimensional schema fromthe goal model in Fig. 7. For each task of the DW, a fact is created. Resources defining thecontext of analysis are dimensions in MD model. Finally, the levels of aggregation attached toresources are represented as hierarchies of dimension in the DW schema (see Fig. 8).
3 Conclusions
This paper studies the RE phase for DW development. A DW system contributes to thedecision-making process in organisations by offering analytical capabilities of data. To supportRE for DWs, several methods were proposed in the literature. Authors of these methods haveargued for the usefulness of the GORE approach. In this paper, we provide an overview of theexisting GORE-based methods in the BI domain and proposed our method using method engi-neering concept. The components of the proposed method are adopted from existing GORE-based methods for BI systems. The appropriate components are selected based on the bestcoverage of abstracting the decision-making process. For each phase of the decision-makingprocess, we proposed guidelines including necessary activities supported by proper goal mod-eling and analysis techniques in an integrated manner. Our method involves all phases ofthe decision-making process in the early stage of DW projects where the requirements arecaptured, as the final objective of DW projects is to help the decision-making process in theorganisation. Besides, the proposed method takes advantages of the contribution of majorexisting works in this domain.
We already covered RE for the static part of the DWs, where MD model is obtained. We planto extend our method with the dynamic part of the DW, where the requirements of operationson the DW are captured. In this part the interaction of users with the DW are discussed. Wealso plan to evaluate the proposed method by applying it to a real case study.
Acknowledgements We would like to thank Dr. Miroslaw Ochodek from Poznan Univer-sity of Technology for valuable discussions on literature overview in the area of requirementsengineering.

Requirements Engineering for Data Warehouse Systems
ReferencesBabar, A., D. Zowghi, and E. Chew (2010). Using goals to model strategy map for business
IT alignment. In Proc. of Int. Workshop on Business/IT Alignment and Interoperability, pp.16–30.
Barone, D., L. Jiang, D. Amyot, and J. Mylopoulos (2011a). Composite indicators for businessintelligence. In Proc. of Int. Conf. on Conceptual Modeling, pp. 448–458. LNCS 6998.
Barone, D., L. Jiang, D. Amyot, and J. Mylopoulos (2011b). Reasoning with key performanceindicators. In Proc. of Conf. on the Practice of Enterprise Modeling, pp. 82–96. LNCS 68.
Bonifati, A., F. Cattaneo, S. Ceri, A. Fuggetta, and S. Paraboschi (2001). Designing data martsfor data warehouses. ACM Transactions on Software Engineering and Methodology 10(4),452–483.
Chowdhary, P., G. Mihaila, and H. Lei (2006). Model-driven data warehousing for businessperformance management. In Proc. of IEEE Int. Conf. on e-Business Engineering, pp. 483–487.
Frendi, M. and C. Salinesi (2003). Requirements engineering for data warehousing. In Proc.of Workshop on Requirements Engineering, pp. 75–82.
Gallardo, J., G. Giacaman, C. Meneses, and Ó. Marbán (2009). Framework for decisionalbusiness modeling and requirements modeling in data mining projects. In Proc. of Int. Conf.on Intelligent Data Engineering and Automated Learning, pp. 268–275. LNCS 5788.
Ghezzi, C., M. Jazayeri, and D. Mandrioli (2008). GRAnD: a goal-oriented approach to re-quirement analysis in data warehouses. Decision Support Systems 45(1), 4–21.
Giorgini, P., J. Mylopoulos, E. Nicchiarelli, and R. Sebastiani (2003). Reasoning with goalmodels. In Proc. of Int. Conf. on Conceptual Modeling, pp. 167–181. LNCS 2503.
Herbert, A. (1960). The new science of management decision. Harper & Brothers.Jiang, L., D. Barone, D. Amyot, and J. Mylopoulos (2011). Strategic models for business
intelligence. In Proc. of Int. Conf. on Conceptual Modeling, pp. 429–439. LNCS 6998.Kimball, R. (1998). The data warehouse lifecycle toolkit: expert methods for designing, de-
veloping, and deploying data warehouses. John Wiley & Sons.Malinowski, E. and E. Zimányi (2006). Requirements specification and conceptual modeling
for spatial data warehouses. In Proc. of OTM Int. Workshop on the Move to MeaningfulInternet Systems, pp. 1616–1625. LNCS 4278.
Maté, A., J. Trujillo, and J. Mylopoulos (2012). Conceptualizing and specifying key perfor-mance indicators in business strategy models. In Proc. of Conf. on the Center for AdvancedStudies on Collaborative Research, pp. 102–115. IBM Corp.
Mazón, J., J. Pardillo, and J. Trujillo (2007a). A model-driven goal-oriented requirementengineering approach for data warehouses. In Proc. of Workshop on Advances in ConceptualModeling–Foundations and Applications, pp. 255–264. LNCS 4802.
Mazón, J., J. Trujillo, and J. Lechtenbörger (2007b). Reconciling requirement-driven datawarehouses with data sources via multidimensional normal forms. Data & Knowledge En-gineering 63(3), 725–751.
Mazón, J., J. Trujillo, M. Serrano, and M. Piattini (2005). Designing data warehouses: from

A. Nasiri et al.
business requirement analysis to multidimensional modeling. In Proc. of Int. Conf. on Re-quirements Engineering for Business Need and IT Alignment, pp. 44–53.
Pourshahid, A., D. Amyot, L. Peyton, S. Ghanavati, P. Chen, M. Weiss, and A. Forster (2009).Business process management with the user requirements notation. Electronic CommerceResearch 9(4), 269–316.
Pourshahid, A., G. Richards, and D. Amyot (2011). Toward a goal-oriented, business intelli-gence decision-making framework. In Proc. of Int. Conf. on E-Technologies: Transforma-tion in a Connected World, pp. 100–115. LNBIP 78.
Prakash, N. and H. Bhardwaj (2012). Early information requirements engineering for targetdriven data warehouse development. In Proc. of Conf. on the Practice of Enterprise Model-ing, pp. 188–202. LNBIP 134.
Prakash, N. and A. Gosain (2008). An approach to engineering the requirements of datawarehouses. Requirements Engineering 13(1), 49–72.
Silva, V., J. Mazón, I. Garrigós, J. Trujillo, and J. Mylopoulos (2012). Monitoring strategicgoals in data warehouses with awareness requirements. In Proc. of ACM Symposium onApplied Computing, pp. 1075–1082. ACM.
Winter, R. and B. Strauch (2004). Information requirements engineering for data warehousesystems. In Proc. of ACM Symposium on Applied Computing, pp. 1359–1365.
Résumé
Les entrepôts de données (EDs) visent à soutenir le processus de prise de décision d’une or-ganisation. Dans le domaine de l’Ingénierie des Exigences (IE), plusieurs méthodes ont étéproposées pour le développement des EDs, la plupart d’entre elles basées sur l’approche ap-pelé Goal-Oriented Requirements Engineering (GORE). Cependant, il n’existe pas encore uneperspective globale et unifiée des différentes méthodes proposées. Dans cet article, une visioncohérente de l’approche GORE pour le développement d’EDs est présentée, en classant lesméthodes existantes selon le processus de prise de décision, les intégrant ensemble, et reliantles techniques de modélisation et d’analyse tout au long du processus de prise de décision.Le résultat de notre étude est une méthode intégrée pour le développement d’EDs basée surl’approche GORE. Nous illustrons la méthode avec un exemple concret du secteur des soinsde santé.


![Seminario Evangelizacao Cept[1]](https://img.dokumen.tips/doc/110x75/55c77af7bb61eb4b6b8b462b/seminario-evangelizacao-cept1.jpg)