Embed Size (px)
Citation preview
The World Bank Group
THE REPUBLIC OF ZAMBIA
DIAGNOSTIC TRADE INTEGRATION STUDY (DTIS)
Main Report
Draft prepared for the Enhanced Integrated Framework
Last Revision 10 June 2014
ii
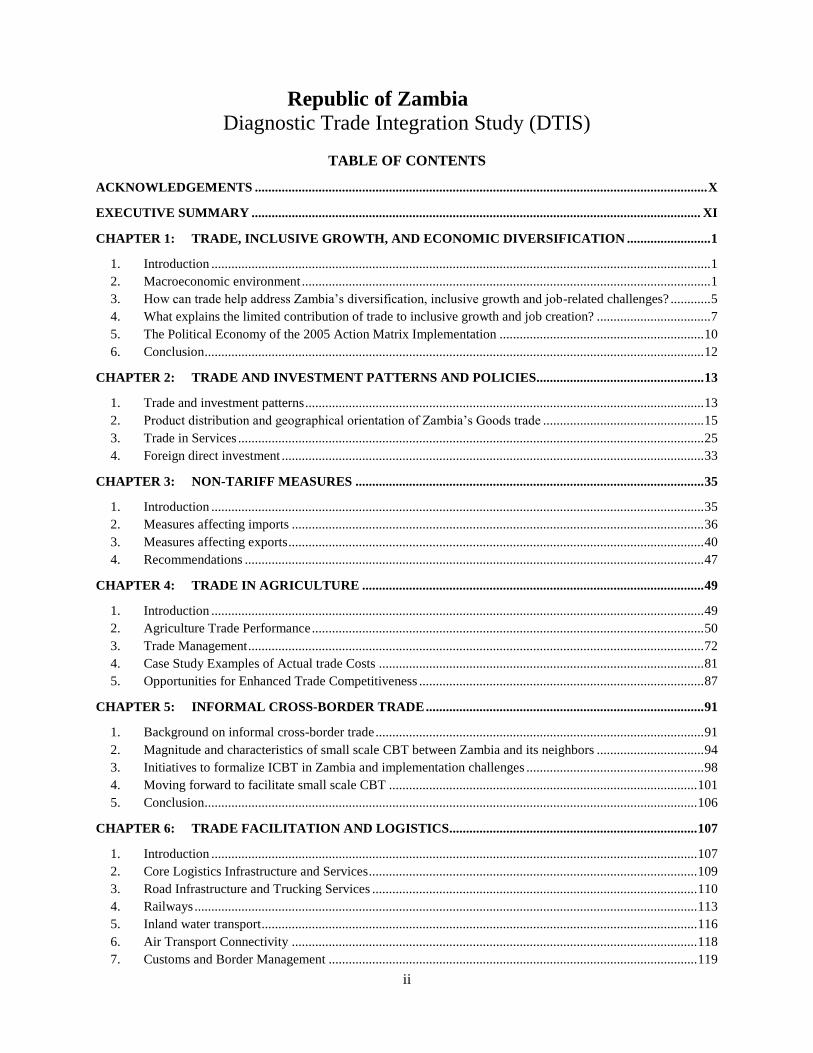
Republic of Zambia
Diagnostic Trade Integration Study (DTIS)
TABLE OF CONTENTS
ACKNOWLEDGEMENTS ....................................................................................................................................... X
EXECUTIVE SUMMARY ...................................................................................................................................... XI
CHAPTER 1: TRADE, INCLUSIVE GROWTH, AND ECONOMIC DIVERSIFICATION ......................... 1
1. Introduction ..................................................................................................................................................... 1
2. Macroeconomic environment .......................................................................................................................... 1
3. How can trade help address Zambia’s diversification, inclusive growth and job-related challenges? ............ 5
4. What explains the limited contribution of trade to inclusive growth and job creation? .................................. 7
5. The Political Economy of the 2005 Action Matrix Implementation ............................................................. 10
6. Conclusion ..................................................................................................................................................... 12
CHAPTER 2: TRADE AND INVESTMENT PATTERNS AND POLICIES.................................................. 13
1. Trade and investment patterns ....................................................................................................................... 13
2. Product distribution and geographical orientation of Zambia’s Goods trade ................................................ 15
3. Trade in Services ........................................................................................................................................... 25
4. Foreign direct investment .............................................................................................................................. 33
CHAPTER 3: NON-TARIFF MEASURES ........................................................................................................ 35
1. Introduction ................................................................................................................................................... 35
2. Measures affecting imports ........................................................................................................................... 36
3. Measures affecting exports ............................................................................................................................ 40
4. Recommendations ......................................................................................................................................... 47
CHAPTER 4: TRADE IN AGRICULTURE ...................................................................................................... 49
1. Introduction ................................................................................................................................................... 49
2. Agriculture Trade Performance ..................................................................................................................... 50
3. Trade Management ........................................................................................................................................ 72
4. Case Study Examples of Actual trade Costs ................................................................................................. 81
5. Opportunities for Enhanced Trade Competitiveness ..................................................................................... 87
CHAPTER 5: INFORMAL CROSS-BORDER TRADE ................................................................................... 91
1. Background on informal cross-border trade .................................................................................................. 91
2. Magnitude and characteristics of small scale CBT between Zambia and its neighbors ................................ 94
3. Initiatives to formalize ICBT in Zambia and implementation challenges ..................................................... 98
4. Moving forward to facilitate small scale CBT ............................................................................................ 101
5. Conclusion ................................................................................................................................................... 106
CHAPTER 6: TRADE FACILITATION AND LOGISTICS.......................................................................... 107
1. Introduction ................................................................................................................................................. 107
2. Core Logistics Infrastructure and Services .................................................................................................. 109
3. Road Infrastructure and Trucking Services ................................................................................................. 110
4. Railways ...................................................................................................................................................... 113
5. Inland water transport .................................................................................................................................. 116
6. Air Transport Connectivity ......................................................................................................................... 118
7. Customs and Border Management .............................................................................................................. 119
iii
8. Clearing and Forwarding Industry ............................................................................................................... 123
9. Regional Connectivity ................................................................................................................................. 124
10. Zambia as a Regional Logistics Hub ........................................................................................................... 132
11. Regional Mechanisms for Trade Facilitation and Logistics ........................................................................ 133
12. Recommendations ....................................................................................................................................... 136
CHAPTER 7: SERVICES RELATED TO MINING ....................................................................................... 139
1. Introduction ................................................................................................................................................. 139
2. Upstream linkages: Definitions ................................................................................................................... 140
3. Background on Zambia’s local mining supply chain .................................................................................. 142
4. Trajectory of local service providers ........................................................................................................... 146
5. Policy and regulatory framework ................................................................................................................ 155
6. Conclusion and policy recommendations .................................................................................................... 158
CHAPTER 8: EDUCATION AND PROFESSIONAL SERVICES ................................................................ 164
1. Unleashing the Potential of Services for Zambia’s Growth and Export Diversification – a Case Study on
Professional Services............................................................................................................................................. 164
2. Explaining the underdevelopment of professional services in Zambia ....................................................... 170
3. Recommendations for policy action ............................................................................................................ 179
4. Conclusion ................................................................................................................................................... 182
CHAPTER 9: TOURISM ................................................................................................................................... 183
1. Introduction ................................................................................................................................................. 183
2. Current contribution of the tourism industry ............................................................................................... 183
3. Zambia’s tourism assets and unrealized potential ....................................................................................... 186
4. Lifting the constraints to achieve the sector’s potential: ............................................................................. 188
5. Supply-side factors ...................................................................................................................................... 189
6. Demand-side factors .................................................................................................................................... 190
7. Enabling environment ................................................................................................................................. 192
8. Priorities for policy action: .......................................................................................................................... 194
CHAPTER 10: FINANCIAL SERVICES ........................................................................................................... 195
1. Introduction ................................................................................................................................................. 195
2. Brief Sketch of the Zambian Financial Sector ............................................................................................. 195
3. Reforms in Financial Services ..................................................................................................................... 200
4. The Path Ahead ........................................................................................................................................... 203
REFERENCES 204
List of Figures
Figure 1.1: Real GDP Growth and GNI per capita, 1998-2014 ............................................................................ 1
Figure 1.2: Trends in Sector Distribution of GDP, 2004-2012 ............................................................................. 2
Figure 1.3: Selected Macro Indicators, 1998-2014 ............................................................................................... 3
Figure 1.4: Copper Export and Mining Taxes, 2000-2012 ................................................................................... 5
Figure 1.5: Openness to trade, 2003-2011 ............................................................................................................ 6
Figure 2.1: Adjusted Trade Openness – Goods, 2003-2011 ............................................................................... 13
Figure 2.2 Adjusted Trade Openness-Services, 2003-2011 ................................................................................ 14
Figure 2.3: Growth in value of FDI inflows and trade in goods and services, 2000-2011 ................................. 14
Figure 2.4: Export growth in value and in volume, 2003-2011 .......................................................................... 15
Figure 2.5 : Herfindahl index of export concentration, 2004-2011 .................................................................... 16
iv
Figure 2.6: Evolution of selected non-traditional exports, 2002-2011 ............................................................... 17
Figure 2.7: Technological content of manufactured exports Zambia and comparators, 2000-2011 ................... 19
Figure 2.8: Technological content of Zambia’s manufactured exports, 2000-2011 ........................................... 19
Figure 2.9: Number of products, destinations and exporters .............................................................................. 20
Figure 2.10: Transaction size by geographic region ........................................................................................... 21
Figure 2.11: Transaction size by product category ............................................................................................. 21
Figure 2.12 :Export transactions and value by destination region, average and evolution over time ................. 22
Figure 2.13: Destination of Zambia’s Exports, 2003/5 and 2009/11 .................................................................. 23
Figure 2.14: Destination of Zambia's non copper exports, 2002-2011 ............................................................... 24
Figure 2.15: Services Value Added and Development in 2000-02 versus 2009-11 ........................................... 25
Figure 2.16 : Share of Services Trade in GDP and Structure of Services Trade, 2003-2011 ............................. 26
Figure 2.17: Export of Services in comparison to Goods Exports, 2009-2011................................................... 26
Figure 2.18: Export Growth in Goods and Services, 2000-2011 ........................................................................ 27
Figure 2.19 : Compound average growth rates (CAGR) of services trade, Zambia and comparators, ............... 27
Figure 2.20 : Modern and Traditional Services Growth, 2000-11 ...................................................................... 28
Figure 2.21 : Restrictions on Services and Per Capita Income ........................................................................... 32
Figure 2.22 : Breakdown of Zambia’s Services Trade Restrictiveness Index by type of service ....................... 32
Figure 2.23 : FDI stock as a share of GDP, 2011 ............................................................................................... 34
Figure 3.1: Retail sugar prices in East Africa ..................................................................................................... 37
Figure 3.2: Regulatory review workflow under Zambia’s proposed architecture .............................................. 46
Figure 4.1 : Recorded Agriculture Imports and Exports, 2000-2010 (USD ‘000) .............................................. 50
Figure 4.2: Zambia’s Export of Staple Grains, 2000-2010 (USD ‘000) ............................................................. 53
Figure 4.3 : Zambia’s Maize Exports in Volume Terms, 2000-2010 (metric tons) ............................................ 53
Figure 4.4 : Zambia’s Traditional Export Crops, 2000-2010 (USD ‘000) .......................................................... 57
Figure 4.5: Zambia’s Exports of Soy-Related Products, 2005-2011 (USD ‘000) .............................................. 61
Figure 4.6 :Zambia’s Exports of High-Value Horticulture and Coffee, 2005-2010 (USD ‘000) ....................... 62
Figure 4.7 : Zambia’s Exports of Selected “Minor” Agricultural Products, 2000-2010 (USD ‘000) ................. 63
Figure 4.8:Border Costs at Kasumbalesa (USD/ton ........................................................................................... 84
Figure 5.1: Beans, Maize, and Rice exports ....................................................................................................... 95
Figure 5.2: Exports of beans, maize and rice to DRC and Zimbabwe ................................................................ 96
Figure 5.3: Informal maize exports from Zambia to the DRC ............................................................................ 96
Figure 5.4: Beans, Maize, and Rice imports ....................................................................................................... 97
Figure 6.1 Zambia Comparison of Overall Trade Costs to Different Countries ............................................... 108
Figure 6.2 Zambia Comparison of Agricultural Trade Costs to Different Countries ....................................... 108
Figure 6.3 : Road Freight Permit Applications, South Africa ........................................................................... 112
Figure 6.4 : Convergence in fuel prices between Zambia and South Africa..................................................... 112
Figure 6.5 : Example of Lubumbashi to Durban Rail Time/Cost-Distance ...................................................... 116
Figure 6.6 : Evolution of Zambia’s exports to Burundi (tons) .......................................................................... 117
Figure 6.7 : Zambia trade volumes through Dar es Salaam Port ...................................................................... 126
Figure 6.8 : Zambia Cargo Removals from Port of Dar es Salaam .................................................................. 126
Figure 6.9 : Common Truck Types in Zambia and Tanzania ........................................................................... 127
Figure 6.10 : Trend in Zambia Traffic Volume Through Port of Walvis Bay .................................................. 129
Figure 6.11 : DRC Cargo Removals from Port of Dar es Salaam .................................................................... 132
Figure 7.1 : Copper mining global value chain ................................................................................................. 140
Figure 7.2 : Firms populating local upstream linkages to Zambia’s copper mining sector .............................. 144
Figure 7.3 : Dynamic suppliers’ trajectory: type of upgrading processes (frequency) ..................................... 148
Figure 7.4 : Declining suppliers’ trajectory: type of upgrading processes (frequency) .................................... 149
Figure 8.1 : Usage of professional services in Zambia and COMESA, % ....................................................... 165
Figure 8.2 : Usage of professional services in Zambia by size, % .................................................................... 165
v
Figure 8.3: Number of accountants per 100,000 inhabitants ............................................................................ 167
Figure 8.4 : Number of lawyers per 100,000 inhabitants .................................................................................. 167
Figure 8.5 : Wages of Professionals, Zambia and COMESA ........................................................................... 168
Figure 8.6 : Export of professional services, Zambia and comparators ........................................................... 169
Figure 8.7 : Modes of supply, professional services exports in APEI countries ............................................... 169
Figure 8.8 : Export Market by Region: Average for COMESA ....................................................................... 170
Figure 8.9 : Export Market by Region: Zambia ................................................................................................ 170
Figure 8.10 : Overall Regulation Index Accounting ......................................................................................... 172
Figure 8.11 : Overall Regulation Index Legal .................................................................................................. 172
Figure 8.12 : Top regulatory constraints in faced by professional services providers in Zambia, % ............... 175
Figure 8.13: Top regulatory constraints faced by Zambian professional services providers abroad ................ 176
Figure 8.14 : Services Trade Restrictiveness Index Accounting ...................................................................... 177
Figure 8.15 : Services Trade Restrictiveness Index Legal ................................................................................ 177
Figure 9.1: T&T’s impact on Zambia’s GDP ................................................................................................... 184
Figure 9.2: T&T’s impact on Zambia’s employment ....................................................................................... 184
Figure 9.3: Arrivals of tourists to Zambia......................................................................................................... 185
Figure 9.4: Tourist arrivals (2000=100) ............................................................................................................ 185
Figure 9.5: Tourism intensity (arrivals/inhabitant) ........................................................................................... 185
Figure 9.6: Tourism density (arrivals/km2) ....................................................................................................... 185
Figure 9.7: Tourism receipts per arrival (USD, 2011) ...................................................................................... 187
Figure 9.8: Tourism receipts per inhabitant (USD, 2011) ................................................................................ 187
Figure 9.9: Tourism receipts per night (USD, 2011) ........................................................................................ 187
Figure 9.10:Competitiveness of Zambia’s travel & tourism sector in regional perspective ............................. 189
Figure 10.1: Comparing Financial Access Strands for 2005 and 2009 ............................................................. 197
Figure 10.2: Bank Lending Rates (2002-2013) ................................................................................................ 199
Figure 10.3 : Aggregate Insurance Premiums (2011) ....................................................................................... 199
List of Tables Table 1.1: Benchmarking Zambia’s business environment .................................................................................. 9
Table 2.1: Evolution of copper and non-copper exports, 2003-2011.................................................................. 15
Table 2.2 : Distribution of goods exports and imports, 2010/2011 .................................................................... 18
Table 2.3: Regional share in Zambia’s non-copper trade, 2003-2011 ................................................................ 24
Table 2.4 : Performance indicators for selected services sectors ........................................................................ 31
Table 2.5 : FDI inflows, 2003-2011 .................................................................................................................... 34
Table 3.1:Active and resolved complaints in the NTB RMEM .......................................................................... 42
Table 3.2: Active and resolved complaints against Zambia in the NTB RMEM ............................................... 43
Table 4.1 : Zambia’s Top-10 Agriculture Imports, 2005-2010 (USD ‘000) ....................................................... 51
Table 4.2: Zambia’s Top-10 Agriculture Exports, 2005-2010 (USD ‘000) ........................................................ 52
Table 4.3 : Zambia’s Maize Exports by Market Destination, 2005-2011 (USD ‘000) ...................................... 55
Table 4.4 : Zambia’s Tobacco Exports in Volume and Value Terms, 2000-2010 .............................................. 59
Table 4.5: Zambia’s Exports of Cotton Lint in Volume and Value Terms, 2000-2010. .................................... 60
Table 4.6 : Zambia’s Animal Feed Exports by Market Destination (USD ‘000) ............................................... 62
Table 4.7: Zambia’s Imports and Exports of Livestock Products, 2005-2010 (USD ‘000) ................................ 64
Table 4.8 : Zambia’s Imports and Exports of Dairy Products, 2005-2010 (USD ‘000) ..................................... 65
Table 4.9 : Total Fertilizer Supplied by Zambia’s Subsidy Program .................................................................. 68
Table 4.10 : Zambia’s Leading Agriculture Exports to APEI Countries, 2005-2010 (USD ‘000) ..................... 71
Table 4.11 : Zambia’s Leading Agriculture Imports from APEI Countries, 2005-2010 (USD ‘000) ................ 71
Table 4.12 : Total Agriculture Trade with APEI Countries, 2005-2010 (USD ’00) ........................................... 72
Table 4.13 : Zambia’s Tariff Rates on Seed ....................................................................................................... 73
vi
Table 4.14 : Cost of Mandatory Standards Inspection by ZABS for Imported Fertilizer ................................... 77
Table 4.15 : Comparison of EAC Quality Specifications for Maize with ZAMACE Standards and CODEX .. 78
Table 4.16 : Levies on Cattle Movement (ZMW/head) ...................................................................................... 80
Table 4.17 : Costs of Formal Sector Border Crossing at Kasumbalesa .............................................................. 82
Table 4.18 : Cost of Informal Border Crossing at Kasumbalesa for Selected Commodities .............................. 84
Table 4.19: Cost of Formal Sector Border Crossing at Mwami/Mchinji ............................................................ 85
Table 4.20 : Cost of Formal Sector Border Crossing at Mwami/Mchinji using COMESA STR ....................... 86
Table 6.1: Extent of Core Road Network, 2010 ............................................................................................... 110
Table 6.2 : Trafic Volumes on TAZARA (tons) ............................................................................................... 114
Table 6.3 Comparative Assessment of Major Corridors Linking Ndola to Seaports (per TEU) ...................... 131
Table 7.1 : Categories of supplies required by the copper mining sector ......................................................... 141
Table 7.2 : Entry channels to the copper GVC and establishment year by supplier firms (percentage) ........... 143
Table 7.3: Market diversification strategies for selected service providers ...................................................... 146
Table 7.4 : Characteristics of selected service providers to Zambia’s mining sector (2009) ............................ 148
Table 7.5 : Summary of procedures and documents for trading across borders in Zambia (2013) .................. 149
Table 7.6 : Dynamic trajectory: ownership and linkages (frequency) .............................................................. 153
Table 7.7: Declining trajectory: ownership and linkages (frequency) .............................................................. 154
Table 7.8: Zambia GATS schedule of specific commitments for selected sub-sectors (1994) ........................ 157
Table 8.1 : Education Attainment Parameters .................................................................................................. 171
Table 9.1: Estimated economic impact of the travel and tourism (T&T) sector ............................................... 184
Table 9.2: Tourism arrivals and expenditures in Zambia ................................................................................. 186
List of boxes
Box 1: Informal trade: opportunities and barriers .............................................................................................. xiii
Box 2 : Trade costs and export diversification .................................................................................................. xiv
Box 3 : Services as a source of export diversification ........................................................................................ xv
Box 4 : Using services import to alleviate skills shortage in health services ...................................................... 29
Box 5 : Zambian standards imposed on foreign tankers ..................................................................................... 39
Box 6 : Hedging Risks: An Example of Route Distribution for a Zambia Copper Mining House ................... 109
Box 7:Data Exchange Approach to Border Management Modernization – the example of the Malaba .......... 123
Box 8: Direct cooperation, low supplier capabilities and upgrading ................................................................ 152
Box 9 : Becoming a sole distributor ................................................................................................................. 153
Box 10 : Domestic Regulation in Professional Services in Zambia ................................................................. 173
Box 11 : Explicit trade barriers affecting professional services in Zambia ...................................................... 178
Box 12 : Can Regional Initiatives Help? .......................................................................................................... 179
Box 13 : Regulatory initiatives that could be used as a model by the COMESA countries ............................. 181
vii
ABBREVIATION AND ACRONYMS
AGOA African Growth and Opportunity Act
APEI Accelerated Program for Economic Integration
ASYCUDA Automated System for Customs Data
CAGR Compound Average Growth Rates
CBT Cross-Border Trade
CCPC Competition and Consumer Protection Commission
CD1 Currency Declaration Form
CEEC Citizen Economic Empowerment Commission
CET Common External Tariff
CFA Clearing and Forwarding Agent
CMZ Chamber of Mines of Zambia
COMESA Common Market for Eastern and Southern Africa
CPC Customs Process Codes
COTR Coordination Office for Technical Regulations
DBZ Development Bank of Zambia
DFID Department for International Development
DTIS Diagnostic Trade Integration Study
DTI Direct Trader Input
EBA Everything But Arms
EDF Export Development Fund
EAC East African Community
EIF Enhanced Integrated Framework
EPA Economic Partnership Agreement
EQCS Export Quality Certification Scheme
ERP Economic Recovery Plan
FCTC Framework Convention on Tobacco Control
FDI Foreign Direct Investment
FISP Farmer Input Support Program
FNDP Fifth National Development Plan
FRA Food Reserve Agency
GATS General Agreement on Tariffs in Services
GATT General Agreement on Tariffs in Trade
GDP Gross Domestic Product
GCI Global Competitiveness Index
GMO Genetically Modified Organism
GNI Gross National Income
GTAZ Grain Traders Association of Zambia
HS Harmonized System
IAF International Accreditation Forum
ICBT Informal Cross-Border Trade
IFC International Finance Corporation
viii
ILAC International Laboratory Accreditation Cooperation
ITC International Trade Center
IMF International Monetary Fund
IQMS Import Quality Monitoring Scheme
LDC Least-Developed Countries
LPI Logistics Performance Index
MAL Ministry of Agriculture and Livestock
MCIT Ministry of Commerce, Industry and Trade
MDG Millennium Development Goals
MFN Most Favored Nation
MOF Ministry of Finance
MOH Ministry of Health
MRA Mutual Recognition Agreements
MTS Metrology Service Department
NRFA National Road Fund Agency
NSB National Standards Bureau
NSC National Steering Committee
NTB Non-Tariff Barrier
NTE Non-Traditional Exports
NTM Non-Tariff Measures
ODI Overseas Development Institute
OECD Organization for Economic Co-operation and Development
OSBP One Stop Border Posts
PPD Public-Private Dialogue
PRA Pharmaceutical Regulatory Authority
PSI Pre-Shipment Inspection
RDA Road Development Agency
REC Regional Economic Community
ROO Rules of Origin
SABS South African Bureau of Standards
SACU Southern African Customs Union
SADC Southern African Development Community
SANAS South African National Accreditation Service
SCCI Seed Control and Certification Institute
SHEMP Smallholder Enterprise Marketing Program
SNDP Sixth National Development Plan
SPS Sanitary and Phyto-Sanitary Measures
SQAM Standardization, Quality Assurance, Accreditation and Metrology
SSA Sub-Saharan Africa
STR Simplified Trade Regime
STRI Services Trade Restrictiveness Index
TAZ Tobacco Association of Zambia
TAZARA Tanzania Zambia Railway Authority
TEs Traditional Exports
TBT Technical Barriers to Trade
TFCA Trans Frontier Conservation Areas
ix
TIR Transports Internationaux Routiers
TPRM Trade Policy Review Mechanism
UNCTAD United Nations Commission on Trade and Development
UNESCO United Nations Educational Scientific and Cultural Organization
USAID United States Agency for International Development
VAT Value Added Tax
WEF World Economic Forum
WFP World Food Program
WTO World Trade Organization
WTTC World Travel and Tourism Council
ZABS Zambia Bureau of Standards
ZAMACE Zambia Agricultural Commodity Exchange
ZANACO Zambia National Commercial Bank
ZARI Zambia Agriculture Research Institute
ZCCZ Zambia-China Economic and Trade Cooperation Zone
ZDA Zambia Development Agency
ZEGA Zambia Export Growers Association
ZEMA Zambia Environmental Management Agency
ZMA Zambian Manufacturers Association
ZMLCI Zambian Mining Local Content Initiative
ZNFU Zambia National Farmers Union
ZRA Zambia Revenue Authority
ZRL Zambia Railways Limited
x
ACKNOWLEDGEMENTS
At the request of the Government of the Republic of Zambia, the World Bank took the leading role in the
preparation of this DTIS Update. The core members of the team were Olivier Cadot (non-tariff measures);
Antoine Coste (trade performance analysis, informal trade and tourism); Judith Fessehaie (services related
to mining), Benjamin Garnaoud (transport and trade facilitation); Arti Grover (services trade performance
and professional services), John Keyser (trade in agriculture); Charles Kunaka (trade facilitation and
logistics), Maybin Nsupila (non-tariff measures and services related to mining); Lydiah Sibanda (financial
services), Trevor Simumba (trade facilitation, professional services and political economy of trade
reform). The task team leader of the report is Nora Dihel.
Background papers and other inputs were also provided by Marius Brulhart and Madina Kukenova
(export diversification); David Chakonta (education and health services); Asumani Guloba (local
networks and macroeconomic framework); Brian Mtonya (private sector development and tourism);
Dominique Njinkeu (trade facilitation); Siakakaye Siameja (financial services); Carmine Soprano and
Mario Gutierrez-Rocha (editing) and Catherine Sear (media and communication),
The analysis in the report benefited greatly from very helpful comments and feedback provided by Paul
Brenton, Praveen Kumar, John Panzer, Jean-Christophe Maur, Marie Sheppard, Sanjay Kathuria,
Mombert Hoppe and Nalini Kumar among others.
The DTIS update was elaborated in close cooperation with counterparts in the Government of Zambia.
Yvonne Chileshe, Director of Foreign Trade at Zambia’s Ministry of Commerce, Trade and Industry, and
the EIF Team consisting of Janet Simwanza-Chilufya, Healey Mweemba and Kelvin Kamayoyo provided
useful comments on the concept note and draft chapters, assisted the team in the selection of local
consultants, and co-organized the pre-validation workshop, including the joint Malawi-Zambia DTIS
workshop in Chipata.
The DTIS update team would also like to thank the numerous stakeholders from the public and private
sectors who provided helpful insights during the team missions undertaken in 2012 and 2013, the
workshops on preliminary results organized in April, September, and November 2013 in Lusaka and
Chipata, and the Validation Workshop organized in February 2014 in Lusaka.
The team gratefully acknowledges the logistical and formatting support provided by Mariama Daifour Bâ,
Kutemba Kambole, Hellen Mungaila, and Martha Tembo.
xi
EXECUTIVE SUMMARY
I. Background: despite improved trade performance deeper trade reforms are needed
This study, which updates the 2005 Diagnostic Trade Integration Study (DTIS), seeks to (a) take stock of
progress in the implementation of Action Matrix adopted in 2005; (b) complement and deepen the analysis in
the areas of export diversification, informal trade, trade facilitation and trade in services; and (c) revise the
Action Matrix as needed. The report discusses areas where trade has performed well over the past decade and
identifies remaining challenges that continue to limit the role of trade in driving diversified growth, job creation
and poverty reduction. The aim of the analysis is to assist the Government of Zambia in defining a strategy that
strengthens Zambia’s integration with regional and global markets, and mainstreams trade into the general
policy orientation defined by Zambia’s Sixth National Development Plan.
The first part of this executive summary brings together the analysis of Zambia’s trade performance and the
main trade constraints and challenges identified in the report. The second section of the summary then discusses
the main recommendations to alleviate these barriers. The recommendations are summarized in the Action
Matrix at the end.
Six key messages about Zambia’s trade performance emerge from this new DTIS.
(i) Zambia’s performance in goods trade has improved over the last decade
Over the last decade, Zambia’s goods trade grew fast and became more diversified. Zambia’s goods
exports grew at an average annual rate of about 25% between 2002 and 2012 – registering one of the highest
growth rates in Sub-Saharan Africa. Imports grew equally fast with an annual average growth rate of more than
20% over the same period. Both copper and non-copper trade has grown during the last decade. Unsurprisingly,
the share of copper and related products (ores, ashes, etc.) in total exports has strongly increased with booming
global prices. In 2012, exports of copper and related products represented 30% of GDP, compared to 14% in
2002. The share of non-copper exports in GDP increased from 12% in 2002 to 16% in 2012.
There are a number of promising non-traditional exports (NTEs). NTEs reached around USD 3.2 billion in
2012, up from USD 500 million in 2003. Products such as cereals, cotton, gold and gemstones, chemicals,
cement, tobacco or machinery and mechanical appliances, which only amounted to a few millions of dollar
worth of exports at the beginning of the period, now represent a sizeable source of exports. Nonetheless, none of
these products command a share of more than 2% in total exports and the share of NTEs as a whole has not
significantly evolved since 2006. This means that the Government needs to pursue additional trade policy
reforms to reach and maintain the target of 30% of NTEs by 2015 set in the Sixth National Development Plan.
In fact, the share of NTEs in total exports may not be the most appropriate metric to measure the performance of
non-traditional export sectors, since a decrease in copper prices could artificially inflate this share without any
actual improvement in the competitiveness of Zambia’s products. What truly matters, therefore, is to ensure that
the incipient growth of several NTEs witnessed in recent years is sustained.
Zambia’s manufactured exports have become more technologically advanced since the 2000s. Between
2000 and 2013, total exports of manufactures with medium/high skill and technology intensity grew at an
average annual rate of 46% in value, compared to 14% for labor-intensive/resource-based goods. Goods with a
medium and high technology content exported by Zambia include electrical equipment, civil engineering
machinery and parts, pumps, chemicals (e.g. sulfur and related products, essential oils, cosmetics, explosives,
fertilizers), plastic containers and other articles of plastic, as well as re-exported items such as
aircraft/helicopters and parts. Such developments are encouraging as they tend to reflect genuine local
capabilities and technical effort that matter for export development.
xii
(ii) Zambia’s informal trade is substantial and is of great importance to poor households
Zambia’s official trade statistics underestimate actual volumes of trade with neighboring countries since
there is evidence of considerable informal cross-border trade (ICBT) flows that go unrecorded. Zambia’s
trade flows are most likely to be underestimated given that official statistics do not capture informal trade flows.
Statistics on small scale cross-border trade remain scarce, but informative attempts at capturing data have been
carried out in Zambia and other COMESA countries. The Famine Early Warning Systems Network
(FEWSNET) created in 1985 by the US Agency for International Development (USAID) is a leading provider
of statistics on informal trade in Africa. The data available for Zambia show that informal exports and imports
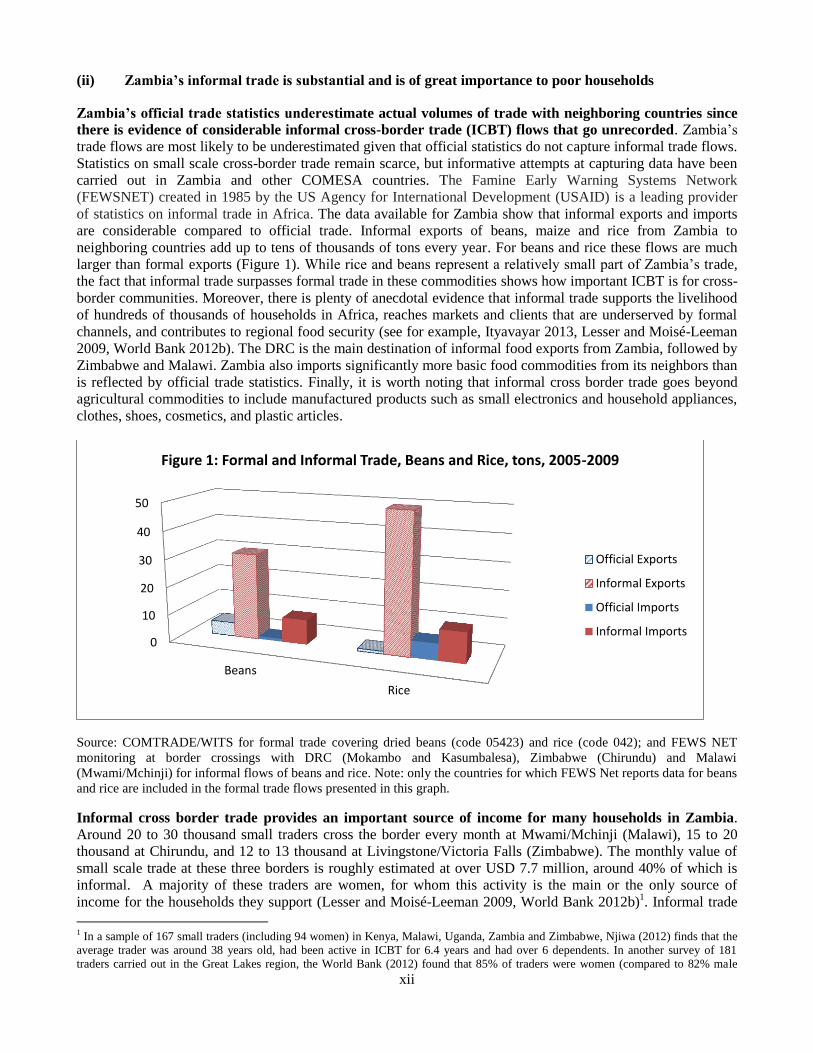
are considerable compared to official trade. Informal exports of beans, maize and rice from Zambia to
neighboring countries add up to tens of thousands of tons every year. For beans and rice these flows are much
larger than formal exports (Figure 1). While rice and beans represent a relatively small part of Zambia’s trade,
the fact that informal trade surpasses formal trade in these commodities shows how important ICBT is for cross-
border communities. Moreover, there is plenty of anecdotal evidence that informal trade supports the livelihood
of hundreds of thousands of households in Africa, reaches markets and clients that are underserved by formal
channels, and contributes to regional food security (see for example, Ityavayar 2013, Lesser and Moisé-Leeman
2009, World Bank 2012b). The DRC is the main destination of informal food exports from Zambia, followed by
Zimbabwe and Malawi. Zambia also imports significantly more basic food commodities from its neighbors than
is reflected by official trade statistics. Finally, it is worth noting that informal cross border trade goes beyond
agricultural commodities to include manufactured products such as small electronics and household appliances,
clothes, shoes, cosmetics, and plastic articles.
Source: COMTRADE/WITS for formal trade covering dried beans (code 05423) and rice (code 042); and FEWS NET
monitoring at border crossings with DRC (Mokambo and Kasumbalesa), Zimbabwe (Chirundu) and Malawi
(Mwami/Mchinji) for informal flows of beans and rice. Note: only the countries for which FEWS Net reports data for beans
and rice are included in the formal trade flows presented in this graph.
Informal cross border trade provides an important source of income for many households in Zambia.
Around 20 to 30 thousand small traders cross the border every month at Mwami/Mchinji (Malawi), 15 to 20
thousand at Chirundu, and 12 to 13 thousand at Livingstone/Victoria Falls (Zimbabwe). The monthly value of
small scale trade at these three borders is roughly estimated at over USD 7.7 million, around 40% of which is
informal. A majority of these traders are women, for whom this activity is the main or the only source of
income for the households they support (Lesser and Moisé-Leeman 2009, World Bank 2012b)1. Informal trade
1 In a sample of 167 small traders (including 94 women) in Kenya, Malawi, Uganda, Zambia and Zimbabwe, Njiwa (2012) finds that the
average trader was around 38 years old, had been active in ICBT for 6.4 years and had over 6 dependents. In another survey of 181
traders carried out in the Great Lakes region, the World Bank (2012) found that 85% of traders were women (compared to 82% male
0
10
20
30
40
50
Beans
Rice
Figure 1: Formal and Informal Trade, Beans and Rice, tons, 2005-2009
Official Exports
Informal Exports
Official Imports
Informal Imports
xiii
is therefore of critical economic and social importance for many households in Sub-Saharan Africa, particularly
so in poor households. However, small scale traders are often subjected to numerous non-transparent and
unpredictable administrative barriers, experience harassment from officials and have to pay bribes. They also
typically pay more than large traders to move commodities across the borders (Box 1). Greater recognition by
policy makers of the importance of smallholder trade, together with enhanced quality and quantity of relevant
information, are needed in Zambia.
Box 1: Informal trade: opportunities and barriers
Informal cross-border trade is a major feature of Africa’s economic and social landscape. In Zambia, thousands of traders
cross the country’s borders every day bringing in revenues from informal trade of beans, maize or rice that often exceeds
that of formal exports and imports.
Allowing these traders to flourish is a key way to promote growth and create jobs across Sub-Saharan Africa. Cross-border
trade is also essential for reducing poverty, since the poor, including many women, are intensively engaged in the informal
production and trading of goods and services.
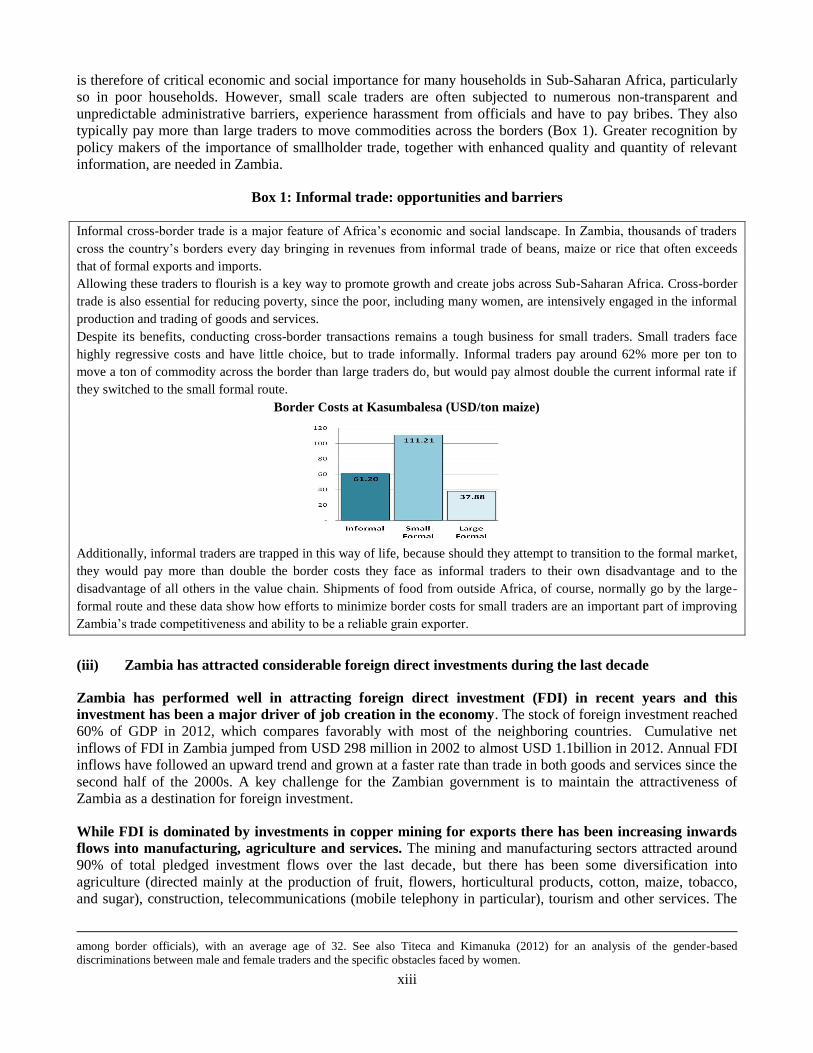
Despite its benefits, conducting cross-border transactions remains a tough business for small traders. Small traders face
highly regressive costs and have little choice, but to trade informally. Informal traders pay around 62% more per ton to
move a ton of commodity across the border than large traders do, but would pay almost double the current informal rate if
they switched to the small formal route.
Border Costs at Kasumbalesa (USD/ton maize)
Additionally, informal traders are trapped in this way of life, because should they attempt to transition to the formal market,
they would pay more than double the border costs they face as informal traders to their own disadvantage and to the
disadvantage of all others in the value chain. Shipments of food from outside Africa, of course, normally go by the large-
formal route and these data show how efforts to minimize border costs for small traders are an important part of improving
Zambia’s trade competitiveness and ability to be a reliable grain exporter.
(iii) Zambia has attracted considerable foreign direct investments during the last decade
Zambia has performed well in attracting foreign direct investment (FDI) in recent years and this
investment has been a major driver of job creation in the economy. The stock of foreign investment reached
60% of GDP in 2012, which compares favorably with most of the neighboring countries. Cumulative net
inflows of FDI in Zambia jumped from USD 298 million in 2002 to almost USD 1.1billion in 2012. Annual FDI
inflows have followed an upward trend and grown at a faster rate than trade in both goods and services since the
second half of the 2000s. A key challenge for the Zambian government is to maintain the attractiveness of
Zambia as a destination for foreign investment.
While FDI is dominated by investments in copper mining for exports there has been increasing inwards
flows into manufacturing, agriculture and services. The mining and manufacturing sectors attracted around
90% of total pledged investment flows over the last decade, but there has been some diversification into
agriculture (directed mainly at the production of fruit, flowers, horticultural products, cotton, maize, tobacco,
and sugar), construction, telecommunications (mobile telephony in particular), tourism and other services. The
among border officials), with an average age of 32. See also Titeca and Kimanuka (2012) for an analysis of the gender-based
discriminations between male and female traders and the specific obstacles faced by women.
xiv
main investors have come from countries outside Africa, such as China, India and Australia, but African
investors from South Africa and Nigeria among others have been increasingly active, in mining as well as in
various services sectors (e.g. retail, telecommunications, and banking). Beside the copper boom, some of the
main factors that contributed to attracting FDI to Zambia include the stable macroeconomic environment, the
dynamic growth of the economy and the relatively open foreign direct investment (FDI) regime. Maintaining a
transparent and predictable approach to inward investment is essential to sustain investors’ confidence. Clarity
on interventions the government is planning to pursue and when it may intervene is important.
(iv) Despite these positive developments, trade costs are high and more export diversification is
needed
Despite the promising evolution of several non-traditional exports, Zambia continues to be one of the
world’s most concentrated exporters. Zambia’s top export products (copper and cobalt) account for 80% of
the value of formal exports – a level of concentration surpassed only by Botswana. Moreover, Zambia’s exports
are characterized by a large degree of churning among export firms. While firm entry rates into exporting are
high compared to other countries, suggesting strong entrepreneurial interest in export markets, these firms have
a uniquely low export survival rate. Zambian firm-level export spells are numerous but short. Interviews with
firms engaged in exporting revealed a number of constraints to exports ranging from financial frictions,
unexpected exchange-rate movements, impediments to importing inputs required for export-oriented production,
inefficient and costly services inputs (finance, electricity, or infrastructure), to the emergence of new
international competitors, and political instability in destination markets.
Zambia’s export diversification has been constrained by high trade costs (Box 2). The costs of exporting
agricultural and manufacturing products from Zambia to key markets (China, Germany, Japan, USA) are
consistently higher than those for neighbors such as Malawi, Mozambique Tanzania, South Africa, Namibia, or
Botswana in 2009 and 2010.2 For example, the cost of meeting regulatory requirements and procedures at the
border can add up to as much as USD1136 for a 30-ton truck of formal maize exports to the DRC, representing
about 15% of the farm gate price for maize in Zambia.
Box 2 : Trade costs and export diversification
High trade costs are generated by the costs of complying with numerous behind the border measures. These include non-
tariff regulatory measures, documentation requirements, and lengthy administrative procedures that impose delays at
border crossings. The costs of compliance with these regulatory measures can be high for the exporter, increasing their
fixed costs as they are usually independent of subsequent export flows. High fixed costs can lead to lower entry rates. Also,
a lack of transparency and predictability about the behind the border measures can exacerbate these fixed costs if there is
rent-seeking by officials who apply the regulations and can further undermine survival rates if firms may find that they have
to pay higher fixed costs than expected.
For Zambia to play a central role in regional markets and value chains and possibly emerge as logistics hub for intra-
regional trade flows due to its central location (it borders eight countries) reducing trade costs is rightly a high priority.
(v) Services provide new opportunities for export diversification and are critical for increased
competitiveness
Zambia’s services trade performance is below potential but modern services are promising. Cross-border
trade in services represents a smaller share of GDP today than during the first half of the 2000s – services trade
contributed to about 8% to GDP in 2010-2012 as compared to about 14% in 2000-2002 - and is significantly
lower in Zambia than the Sub-Saharan African average. The recorded exports of services are relatively low
(USD 375 million in 2011) and are mostly made up of transport (46%) and travel services (39%). While tourism
arrivals and investments have grown steadily over the last decade, the country significantly underperforms its
potential with direct tourism spending accounting for less than 2.5% of GDP, compared to more than 5% of
GDP in Zimbabwe, Tanzania and Kenya. Arrivals have plateaued since 2010, and operators claim that
2(Arvis et al, 2013)
xv
occupancy rates and revenues in 2013 are significantly below 2012 levels. Some key investors have even scaled
back their operations in the country in recent years. However, the country is registering more dynamic growth
rates for modern services exports such as ICT, professional services and other business services. In general,
these sectors have higher value-added and are associated with greater sophistication than traditional services.
These developments signal new opportunities for services to become a source for export diversification (Box 3).
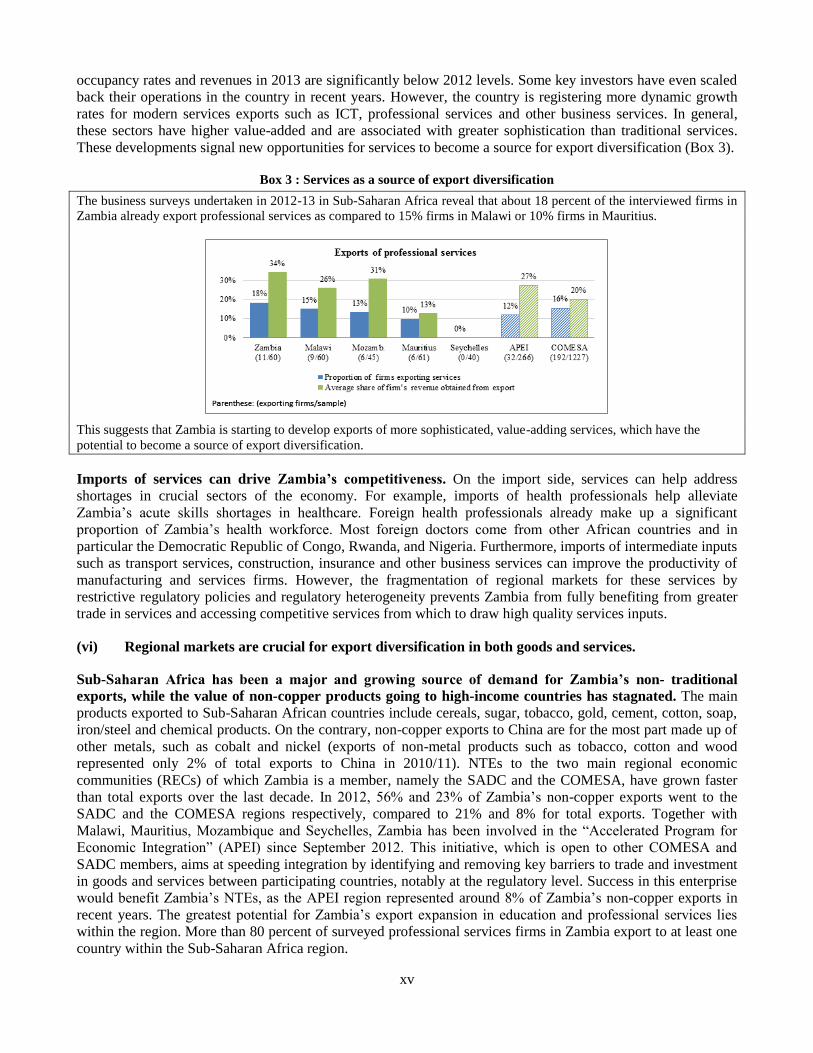
Box 3 : Services as a source of export diversification
The business surveys undertaken in 2012-13 in Sub-Saharan Africa reveal that about 18 percent of the interviewed firms in
Zambia already export professional services as compared to 15% firms in Malawi or 10% firms in Mauritius.
This suggests that Zambia is starting to develop exports of more sophisticated, value-adding services, which have the
potential to become a source of export diversification.
Imports of services can drive Zambia’s competitiveness. On the import side, services can help address
shortages in crucial sectors of the economy. For example, imports of health professionals help alleviate
Zambia’s acute skills shortages in healthcare. Foreign health professionals already make up a significant
proportion of Zambia’s health workforce. Most foreign doctors come from other African countries and in
particular the Democratic Republic of Congo, Rwanda, and Nigeria. Furthermore, imports of intermediate inputs
such as transport services, construction, insurance and other business services can improve the productivity of
manufacturing and services firms. However, the fragmentation of regional markets for these services by
restrictive regulatory policies and regulatory heterogeneity prevents Zambia from fully benefiting from greater
trade in services and accessing competitive services from which to draw high quality services inputs.
(vi) Regional markets are crucial for export diversification in both goods and services.
Sub-Saharan Africa has been a major and growing source of demand for Zambia’s non- traditional
exports, while the value of non-copper products going to high-income countries has stagnated. The main
products exported to Sub-Saharan African countries include cereals, sugar, tobacco, gold, cement, cotton, soap,
iron/steel and chemical products. On the contrary, non-copper exports to China are for the most part made up of
other metals, such as cobalt and nickel (exports of non-metal products such as tobacco, cotton and wood
represented only 2% of total exports to China in 2010/11). NTEs to the two main regional economic
communities (RECs) of which Zambia is a member, namely the SADC and the COMESA, have grown faster
than total exports over the last decade. In 2012, 56% and 23% of Zambia’s non-copper exports went to the
SADC and the COMESA regions respectively, compared to 21% and 8% for total exports. Together with
Malawi, Mauritius, Mozambique and Seychelles, Zambia has been involved in the “Accelerated Program for
Economic Integration” (APEI) since September 2012. This initiative, which is open to other COMESA and
SADC members, aims at speeding integration by identifying and removing key barriers to trade and investment
in goods and services between participating countries, notably at the regulatory level. Success in this enterprise
would benefit Zambia’s NTEs, as the APEI region represented around 8% of Zambia’s non-copper exports in
recent years. The greatest potential for Zambia’s export expansion in education and professional services lies
within the region. More than 80 percent of surveyed professional services firms in Zambia export to at least one
country within the Sub-Saharan Africa region.
xvi
Regional integration can play a crucial role in advancing needed policy reforms in Zambia. Regional
standards and other regional regulatory instruments can guide sectoral regulatory reforms. For example, as
Africa’s leading seed exporter, Zambia stands to benefit the most from improved rules for regional seed trade,
such as the SADC and COMESA harmonized systems for seed variety release, and should therefore assign high
priority to concluding the process and to encouraging other countries to do the same. In the area of services,
deeper regional integration in financial services that includes the collaboration of regulators could help improve
Zambia’s regulatory environment in the sector. Also, the mutual recognition of academic and professional
qualifications at the regional level would be important steps to facilitate Zambia’s exports of education or
professional services to neighboring countries.
The recommendations in the Action Matrix of the new DTIS address the internal and external barriers
that raise Zambia’s trade costs in goods and services. The key elements of the reforms endorsed by
stakeholders in Zambia are:
(1) to implement logistics and trade facilitation reforms covering both formal and informal players; and
(2) to define and implement better rules and regulation (a) to increase competition in key manufacturing sectors
where potential impacts on jobs and poverty are significant (e.g. sugar and cement); (b) to eliminate distortions
in the maize sector and apply appropriate standards for crop inputs; and (c) to enhance the role of services - both
as a source of export diversification (e.g. tourism, services related to mining, professional services) and as key
inputs into new activities (e.g. financial, education services).
II. Key elements of an enhanced strategy to reduce trade costs
(1) Implement logistics and trade facilitation reforms for both formal and informal players
The broad but strategic logistics and trade facilitation issues that need to be addressed to reduce trade costs fall
into two categories:
(i) Domestic policy reforms to deliver a clear and coherent logistics approach3. At this stage, Zambia
has several agencies that contribute to the national logistics system. These include the three main
transport sector agencies (Road Development Agency, Road Transport and Safety Agency, National
Road Fund Agency) as well as those looking after railways, air transport, and customs as well as the
private sector which provides most of the services. Presently, each sub-sector is pursuing narrow
sectoral interests with minimal attempts to optimize overall system performance. Zambia has several
trade routes it can use. At the same time, the country is investing in rebuilding its railways. It would be
ideal to have a comprehensive framework that defines the concrete objectives, the expected balance
between modes of transport and routes, and the investment and policy priorities. At this stage, there
seems to be a laissez faire approach which can lead to an inappropriately sized and developed logistics
system. The existing trade facilitation committee should be given the clear mandate to guide the
development of a coherent corridor strategy with an optimal balance between road and rail transport, to
maximize economic outcomes. The corridor strategy would need to cover both logistics strategy
covering infrastructure and policy reforms. Given the numerous choices available for international trade
routes, it is imperative to have a coherent approach to prioritize national and regional investments.
Otherwise there is a risk of spreading resources too thinly or overinvesting in capacity through
3 Increasingly middle income countries (MICs) are developing logistics strategies to make sure they have logistics systems
and services able to support higher value chains. Some of the countries with logistics strategies are Georgia, Indonesia,
Malaysia and Moldova. The strategies generally define comprehensive yet coherent approaches to transport infrastructure,
services and regulatory developments and reforms. The strategies are used to mobilize resources and to modernize logistics
services. For example Indonesia has been implementing a Logistics Blueprint for the past several years which has helped
address some of the large constraints in its logistics system, especially in inter-island connectivity and port performance.
The strategies are managed at high levels, in some countries by the prime minister’s office, as a way of ensuring
coordinated approaches across different agencies and the private sector.
xvii
numerous interventions. Policy reforms are needed to complement physical infrastructure projects to
ensure there is sufficient competition to pass on the benefits of these investments in lower trade costs.
(ii) A proactive approach to cooperation and coordination with regional partners on trade
facilitation. For a landlocked country such as Zambia, regional cooperation is imperative to improve the
country’s trade facilitation and logistics performance. Some of the key logistics constraints facing
Zambia’s traders come from inefficient interfaces with the systems of neighboring states. Lengthy
customs procedures and procedural hurdles create particularly difficult conditions at the border
crossings with the Democratic Republic of Congo, Angola and Tanzania. Zambia should pursue
regional approaches complemented by bilateral mechanisms to engage with its neighbors to resolve
such constraints. Coordination of infrastructure development is also critical. The close cooperation with
Namibia and Zimbabwe over the three new bridges across the Zambezi is a good example worth
replicating.
Complementary measures to maximize the benefits of One Stop Border Posts (OSBPs). Delays at border
crossings have long been identified as one of the top non-tariff barriers that increase Zambia’s trade costs.
Contributing factors include inefficient paperwork and processes, lack of cross-border information exchange
between customs, and out-of-date or nonexistent transit and trade statistics. Zambia’s preferred solution of
establishing One Stop Border Posts (OSBPs) is useful, but by no means sufficient. Several complementary
measures (such as pre-arrival clearance facilities) are also needed. Done properly, reforms and judicious
automation can significantly reduce the resources required for infrastructure improvements. Procedural and
process reforms should be implemented before the physical development of any new OSBPs. This will ensure
that improved and streamlined procedures will inform the physical layout and flow of goods, instead of having
outdated procedures locked into physical layouts that are more difficult to reconcile and correct later.
Collaboration with neighbors is needed to improve cross-border access to transport infrastructure and
markets. There is limited participation of the Zambian trucking fleet in regional transport markets – in
particular in Tanzania and the DRC. For instance, Tanzania requires trip by trip special permits for the most
commonly used vehicle configuration in Southern Africa, limiting the access of Zambian truckers to the
Tanzanian market. Regional harmonization of technical and other measures governing trucking is essential to
level the playing field for trucking services. Zambia should engage the authorities in those countries on the
operating environment and adopt and implement the non-discriminatory policies stipulated in regional transport
protocols. While solutions can be regional, Zambia can take the lead to tackle operational constraints that impact
disproportionately its service providers.
Zambia should use the new WTO Trade Facilitation agreement to advance the reforms that have been
outlined above. The agreement is binding not only on customs but on all border agencies, and presents a
framework within which discussions among all involved stakeholders can be organized and critical decisions be
taken. Through such discussions, Zambia will have to decide which components of the agreement will be
implemented upon its entry into force, which will be implemented following a transition period and those where
technical assistance for implementation will be needed. Commitments by all countries for implementing the
agreement’s components will be published, increasing accountability and making it easier to monitor progress.
Technical assistance funds to support Zambia implement these commitments will be available.
The WTO Trade Facilitation agreement contains commitments to align procedures and formalities (including
joint controls) among border agencies, establish an improved risk management system, and introduce post-
clearance audits, among other measures. These will contribute to reducing border delays. Increasing public
access to all trade-related information through the internet will increase transparency and contribute to reducing
opportunities for rent seeking. Establishing a trade portal, as agreed with partners under APEI, will be an
effective way of achieving this objective.
For trade facilitation to have a tangible impact on poverty reduction the strategy needs to be inclusive – it
has to cover smallholders and informal traders as well as formal firms. Initiatives to support the
xviii
participation of smallholders and informal traders in commercial cross-border activities should be implemented,
in particular the removal of constraints that discourage their transition into formal trade activities. In addition to
numerous non-transparent and unpredictable administrative barriers, informal and small scale traders often
experience harassment from officials and have to pay bribes. They also typically pay more than large traders to
move commodities across the borders. A “Charter for Cross-Border Traders” could help address the constraints
faced by these traders and facilitate regional trade in agricultural products, including horticulture. The
commitment of Zambia and Malawi to pilot the charter at the Mwami/Mchinji border crossing is an essential
step to improve the treatment of small scale traders.
(2)Defining and implementing better rules and regulation
(2a) to increase competition in key manufacturing sectors where impacts on jobs and poverty are significant
(e.g. sugar and cement)
Technical cost-benefit analyses and wide stakeholder consultations need to precede and inform the
adoption of regulatory measures. In Zambia, as in most Sub-Saharan African countries, traditional forms of
import protection through NTBs (quotas and prohibitions) have largely been phased out, but now technical
regulations are being used to limit imports and protect dominant positions on the domestic market; hurting the
poor. Since monopolies typically restrict output and employment to maintain high prices these restrictions are
particularly damaging to the economy. When, in addition, the firms are subsidiaries of multinational companies,
as in sugar and cement, the profits are shipped abroad enhancing the negative impacts.
In the short term, policy recommendations include
(i) Implement a review of the Vitamin-A fortification program (which acts as a technical barrier to trade
and prevents competition from imports) to assess if the program’s benefits more than offset its
competition-restricting effects;
(ii) Provide sufficient resources for the Coordination Office for Technical Regulations to be able to hire
internationally 2 or 3 technical staff (masters or doctorate level in economics) to perform regulatory
reviews; and
(iii) Carry out a systematic inventory of non-tariff measures, post it on a web site, and design a mechanism
to ensure that line ministries and agencies effectively post all amendments on it.
In the medium term, policy recommendations include
(i) Watch developments in the cement industry to ensure that new entry is not followed by re-cartelization;
(ii) Coordinate regulatory reform and convergence as part of the Accelerated Program for Economic
Integration through horizontal cooperation between regulatory-review agencies, including common
training programs with the aim of creating effective regional markets; and
(iii) Ensure that the Coordination Office for Technical Regulations (COTR) and the Competition and
Consumer Protection Commission (CCCP) work together so that regulatory reform and competition
policy pull in the same direction and benefit from each other.
(2b) to eliminate distortions in the maize sector and apply adequate standards relating to crop inputs
The most fundamental requirements for rapid growth in the agricultural sector are transparent rules and
market driven pricing. This is especially true for the maize sector where input prices, producer prices, and
consumer prices have been the subject of various subsidy and price control interventions. These deter private
investment and do little to address Zambia’s underlying food security challenge nor reduce dependence on rain
fed maize production. One clear conclusion from the analysis is that there needs to be a firm commitment to
keeping Zambia’s borders open. The risk of trade restrictions or even outright trade bans together with input and
output price distortions are important deterrents to private investment and contribute to price volatility and
xix
uneven production. Achieving domestic food security and export growth are not mutually exclusive or even
opposing objectives and could actually be complementary in an improved policy environment.
Zambia needs to simplify and make transparent marketing arrangements for export crops such as maize.
As a first step the government should improve communication regarding trade bans and other restrictions
through official Government, COMESA and SADC websites. Further, quantitative restrictions are being used to
regulate exports. The political justification for the export restrictions is the avoidance of domestic food-price
inflation or seasonal price spikes. However, licenses have to be allocated somehow, and allocation mechanisms
are not transparent. In Zambia, decisions to allow maize export permits are opaque and politically-charged. Such
systems open the door for rent-seeking and cronyism. It is recommended to review the export regime in maize
and replace the opaque export-permit allocation system by a yearly auction in order to provide visibility to
operators, avoid damaging contract breaches due to the unavailability or last-minute cancellation of permits, and
eliminate cronyism in the distribution of licenses;
Greater policy predictability would allow Zambia to emerge as a reliable maize exporter. An example of
how this could be achieved include the strategy put forward by the Grain Traders Association of Zambia
(GTAZ) for government guarantee export permits for at least 75% of GTAZ purchases with the remaining 25%
held in reserve for domestic use until the overall food balance is known. Such a policy would provide a solid
foundation for commercial and emergent farmers to return to maize production while simultaneously guarding
against major food security risks. The transmission of international prices to Zambian farmers through such a
system would further lead to more predictable market conditions to the benefit of smallholder farmers and rural
consumers alike. To complement this strategy the Food Reserve Agency (FRA) must return to its original
mandated role of maintaining the national food reserve and move away from the price-setting role it has played
in the recent past.
Trade requirements need to match buyer requirements and supplier capacities. At the regional level,
standards certification can be a particular problem whereby Zambia and other countries have imposed
mandatory minimum standards and testing procedures for various products that not only add to trade costs but
sometimes do not even correspond with actual buyer requirements or supplier capabilities. The EAC
harmonized standards for maize grains is a good example where minimum specifications for discolored and
shriveled grains are a specific constraint to market participation by Zambian (and other southern Africa)
smallholder farmers. Increased awareness of the distinction between voluntary quality standards used to
determine private value, and mandatory SPS requirements used to protect human, animal, and plant health will
be critical for successful regional integration.
Farmer access to quality inputs and Zambia’s exports of seed and fertilizer can be enhanced through
regional trade. Zambia’s national seed legislation must be amended to be consistent with the SADC and
COMESA systems. Other partner countries in SADC and COMESA also need to adopt appropriate legislation to
allow regional trade under the harmonized system. Zambia’s partners in APEI (Malawi, Mozambique,
Seychelles and Mauritius are all members of SADC and fast track implementation of regional seed agreement
would be good strategy for increased trade. A further area for regional dialogue through APEI and other
channels would be to allow different blends of fertilizer to be traded freely between countries. The objective of
such an approach would be to (i) permit free entry of fertilizer between members; (ii) provide for acceptance of
fertilizer compounds that have been approved by another member; and (iii) allow shipments of fertilizer
inspected by another member. Harmonized regional policies would not only reduce transaction costs, but the
resulting common market could be of considerable commercial interest to Zambian fertilizer manufacturers and
blending companies.
Picking winners as part of the export diversification strategy has not been successful. The cluster based
strategy for agriculture trade expansion devised in the 2005 DTIS generated disappointing results. Products such
as horticulture, coffee, and paprika were identified as having great potential for trade expansion but have
subsequently experienced significant decline for reasons that would have been difficult, if not impossible, to
anticipate. These include falling world market prices, high local costs, and Zambia’s thin production base that
xx
makes it difficult to achieve effective economies of scale. Paprika exports have virtually collapsed with only
handful of producers still involved in this activity. Each of these crops attracted large amounts of public and
private investment capital as presumed focal points of agricultural growth.
(2c) to enhance the role of services - both as a source of export diversification and as key inputs into new
activities.
Ensuring efficient access to a wide range of services is a key determinant in international competitiveness
and efficiency. Zambia has made progress with services liberalization but many challenges remain. At this
stage, Zambia’s access to competitive services from which to draw high quality services inputs is inadequate.
Poor access to such critical services translates into competitive disadvantage in any sector, be it services,
manufacturing or agriculture. The report identifies the constraints to the development of services related to
mining, financial, professional, education and tourism services, showing how inadequate domestic regulations in
conjunction with a lack of regional cooperation are holding back the development of the national markets for
services, create skills shortages and skills mismatches with negative implications for competitiveness, and limit
exports.
In services related to mining, it is essential to create an enabling environment to improve the
competitiveness of local suppliers. Zambia’s government and the private sector need to have an effective
dialogue on the appropriate institutional framework for the effective participation of local services suppliers in
copper mining. The stakeholders’ alliance would be responsible for the design and implementation of such a
strategy, with measurable activities, outputs, milestones, and evaluation mechanisms. The stakeholders’ alliance
should be inclusive of mining suppliers, mining companies, government institutions, and other relevant
institutions. The Zambia Mining Local Content Initiative provides the basis for this process, especially given
that it has received support at the highest political level. Participation, however, should be broadened to a wider
group of stakeholders and its programs need to tackle structural factors affecting supplier development. The
stakeholders’ alliance should review current legislation and regulations hampering local supplier
competitiveness, and formulate proposals to the Government to improve their design or implementation. In
addition, The Ministry of Science, Technology and Vocational Training and TEVETA, in collaboration with
mining companies and services providers in mining, should develop training and vocational institutes and ensure
that their curriculum matches the market demand for specific skills. These national efforts could be
complemented with international collaboration and information sharing with more countries which have
experience in the design and the application of such training programs.
Improved regulations and regional cooperation are required for the development of education and
professional markets and to address skills shortages in these sectors:
In education services, there is an urgent need for improving the technical faculties and other training
programs. These programs need to be expanded to satisfy practical training needs, but this must be planned
and carried out in a manner that will increase not only the quantity but also the quality of offerings. Merely
certifying schools and granting more degrees or certificates to poorly-trained students would not address the
needs, and instead would worsen the overall situation in the long run by infusing poorly equipped graduates
into the system.
For professional services, the focus should be on establishing transparent procurement procedures,
streamlining lengthy and burdensome licensing and accreditation procedures and eliminating restrictions
that limit competition. Furthermore, barriers affecting the movement of professionals (such as lengthy
procedures to obtain visas and work permits) need to be removed.
Zambia should pursue the opening up of regional markets and establishing Mutual Recognition
Agreements (MRAs) to facilitate Zambia’s services exports of education and professional services. The
free movement of APEI/COMESA/SADC nationals without work permit requirements would increase business
opportunities within the region and boost services exports. Regional discussions in Southern Africa on MRAs in
xxi
professional services are in a very preliminary phase with a higher progress potential among APEI countries.
Interested countries would learn from East Africa’s experience with MRAs in accounting and architectural
services.
Establishing a national regulatory assessment mechanism would support effective services reforms. A key
challenge of services reforms relates to putting in place an adequate regulatory framework that effectively
addresses public policy objectives, such as protecting consumers, ensures competitive outcomes and effectively
leverages trade agreements at bilateral, regional and international levels. Decisions on the nature and pace of
reform need to be informed by careful analysis and an understanding of good practices. For example, regulatory
audits in the professional service sectors would identify specific areas where reforms could be fast-tracked in
the context of the COMESA, SADC, Tripartite and APEI services dialogues.
A number of regulatory reforms, including adopting a single visa at the regional level would enhance the
impact of tourism on Zambia’s exports, economy and employment. Investors and operators cite a number of
reasons limiting the expansion of the tourism sector. These include visa and yellow fever requirements, slow
implementation of regulatory reform processes (for example, failure to adopt the new Tourism and Hospitality
Act, drafted with extensive input from private operators), burdensome licensing processes, inadequate
management of the wildlife sector. While many of these factors are indicative of deeper-seated weaknesses,
there are a number of short –term addressable issues – such as the implementation of the UNIVISA project –
that could constitute priority actions for the government.
III. Dissemination and implementation of the New Action Matrix
Uneven implementation of the 2005 Action Matrix and mixed results of agreed policy actions have
undercut the efforts to fully integrate trade into Zambian policymaking. Implementation – assessed by
Zambian consultants and stakeholders based on the Government’s Annual Performance reports - has hovered
broadly around 50 percent. Implementation tends to be more advanced in selected productive sectors,
infrastructure and in some trade-related institutions, such as customs, while it appears less consistent within the
Ministry of Trade itself and other trade related institutions, such as those dealing with standards and sanitary and
phytosanitary (SPS) issues. While efforts to reduce tariffs have largely been met with success, less progress has
been achieved with non-tariff barriers (NTBs). Although the removal of NTBs was considered a high priority
issue in the 2005 DTIS, numerous barriers such as lengthy customs formalities and discriminating
administrative procedures that have a negative impact on trade continue to hinder regional integration, including
Zambia’s imports and exports. The Government continues to impose import and export bans on agricultural
commodities like maize and more recently on exports of copper concentrates. In addition the Government has
imposed an export tax on copper.
Key factors responsible for inadequate results with the implementation of the 2005 Action Matrix can be
summarized as follows:
Lack of broad awareness of the Action Matrix. The 2005 Action Matrix was discussed with relevant
Zambian public and private sector representatives as well as with development partners. Also, the Zambian
authorities and the development partners have been working closely together to use Aid for Trade (AfT)
most efficiently. But, while awareness and buy-in among the private sector and other stakeholders
improved, it still remained insufficient to ensure broad-based buy-in for the measures and sustained pressure
towards implementation and accountability.
Lack of clear trade policy priorities. The 48 trade policy recommendations identified as priority actions in
the 2005 DTIS have been challenging to implement. Furthermore, the number of policy matrices solely in
the aid for trade arena such as the DTIS, the Doing Business policies, the Revised SNDP, the Industrial
Clusters Strategy, the Joint Assessment Framework list among others is equally impressive. Given limited
capacity, the high number of policy recommendations hampered their successful implementation.
xxii
Insufficient internal and donor coordination. Lack of coordination within the government and weak donor
coordination have contributed to the lack of implementation of policy recommendations. For example,
changing signals on the importance of selected development activities had an impact on implementation. A
case in point is the emergence of the World Bank Doing Business Report that has come to eclipse the DTIS
as a key monitoring tool, and has shifted the emphasis from trade expansion to private sector development.
While not inconsistent, its seems that the pressure of Doing Business rankings generated greater donor and
government investment in monitoring and implementing the Doing Business policies rather than the DTIS
recommendations.
Weak accountability of key stakeholders in charge. The centralized decision-making system in Zambia
made it difficult for civil society groups and the private sector to influence the process, and encouraged a
culture of weak accountability. Stakeholders claim that this generated an environment prone to discretionary
policy measures and poor efficiency of public spending.
Inadequate coordination between the central and the provincial levels. Mainstreaming trade in the sub-
national (provincial) level development cycle and ensuring vertical coordination remained challenging. The
Ministry of Trade, Commerce and Industry (MCTI) has six specialised statutory bodies mandated to
perform trade-related tasks, but except for the Zambia Development Agency (ZDA) and the Citizen
Economic Empowerment Commission (CEEC), which have offices in all provincial headquarters, few other
statutory bodies are located in these centres.
Social and political tensions encouraged an interventionist policy approach. Social and political frustration
coupled with insufficient per-capita growth, income inequality, and insufficient and inadequate jobs may
have encouraged policy makers to revert to old-style interventionist and contradictory policy measures,
which have unnerved investors.
Lessons from the last DTIS
Successful implementation of the Action Matrix requires buy-in from a broad range of stakeholders. To
increase awareness about the key messages emerging from the current DTIS the World Bank, in collaboration
with the National Implementation Unit of the Ministry of Commerce, Trade and Industry of Zambia, hosted
three DTIS pre-validation workshops in Lusaka between April and September 2013. The main objectives were
to share preliminary findings of the DTIS for Zambia and to generate debate on the proposed reforms related to
trade in agriculture, informal trade, non-tariff barriers, trade facilitation and trade in services. Furthermore, as
part of the Malawi and Zambia Diagnostics Trade Integration Studies (DTIS), the World Bank in collaboration
with the Ministry of Commerce, Trade and Industry of Zambia, and the Ministry of Industry and Trade of
Malawi organized in November 2013 a workshop in Chipata with small traders from the two countries to
discuss a concrete action plan for promoting small scale trade and creating jobs in both countries.
Successful implementation of the Action Matrix requires clear policy priorities and actionable policy
recommendations. While the DTIS presents detailed policy recommendations in the areas of export
diversification, informal trade, trade facilitation and trade in services, the Action Matrix highlights the 20
priority actions identified on the basis of the DTIS analysis and the stakeholders’ consultations. The main focus
of the Action Matrix is on the cross-cutting issues that increase trade costs and hamper trade performances.
Several recommendations from the DTIS chapters were not included in the Action Matrix in order to keep it
focused on clear priorities; nevertheless, the detailed recommendations provide more in-depth guidance to
policy makers wishing to implement reforms in those areas. Likewise, recommendations related to
mainstreaming trade at policy, institutional and development cooperation levels, capacity building proposals, or
requests to develop trade remedies and invest in equipment and infrastructure, which are being covered in other
xxiii
policy documents4 or do not emerge directly from the DTIS analysis were excluded from the Action Matrix to
avoid duplication and keep the Matrix manageable. Finally, the Action Matrix contains concrete monitoring
indicators and provides guidance on the priority of the recommendations, the difficulty of their implementation
and their likely pay-off. The short-term recommendations with a likely great pay-off could constitute the “first
tranche” actions for implementation.
Successful implementation of the Action Matrix requires regular monitoring. A Results Framework that is
owned by the local stakeholders and a DTIS Coordinating Body, like an inter-Ministerial Council, could support
adequate implementation of the new Action Matrix. Such a results framework would need to (i) align the results
with the objectives of the DTIS and clearly distinguish between inputs, outputs and outcomes; (ii) build further
buy-in for results and the actions from key local players; and (iii) experiment with new ways to communicate
with and learn from stakeholders (e.g. text messaging to inform small traders of essential requirements for cross-
border trade, or toll-free numbers for traders to complain about abuse at borders and gather their input on key
metrics such as wait times, bribes paid, etc.). To enhance the accountability of results, follow up work could
focus on sharing the results of the DTIS analysis in user-friendly, digestible ways targeted at trade-related
stakeholders as well as other key players in the private sector to build coalitions for measures in the Action
Matrix. Furthermore, regular (for example, six-monthly) evaluations that measure progress against concrete
targets could be undertaken as part of this results framework process. Consultations with the NIU and other
relevant bodies (such as the Ministry of Finance, the Ministry of Agriculture and Livestock, the Ministry of
Communication and Transport and the other responsible agencies for the implementation of the Action Matrix)
would be useful to define the composition of the DTIS Coordinating Body and the Results Framework.
4 See for the example the Trade Mainstreaming Roadmap developed in 2012 by UNDP or the 2005 DTIS.
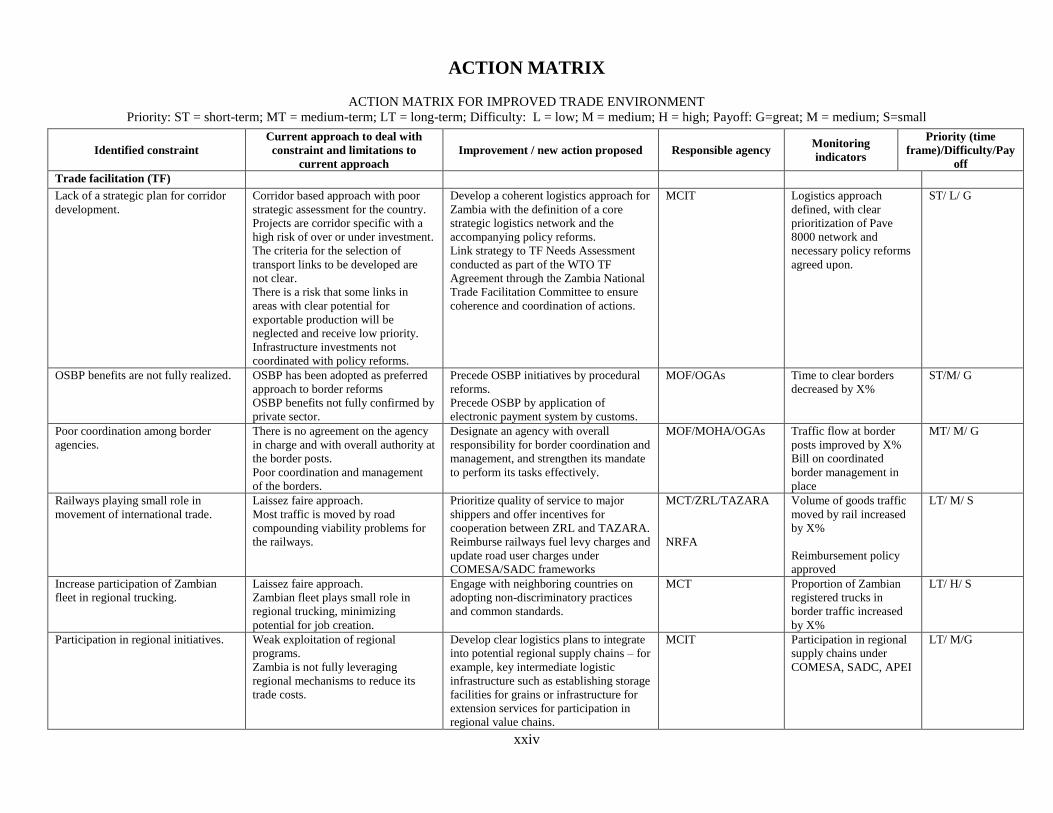
xxiv
ACTION MATRIX
ACTION MATRIX FOR IMPROVED TRADE ENVIRONMENT
Priority: ST = short-term; MT = medium-term; LT = long-term; Difficulty: L = low; M = medium; H = high; Payoff: G=great; M = medium; S=small
Identified constraint
Current approach to deal with
constraint and limitations to
current approach
Improvement / new action proposed Responsible agency Monitoring
indicators
Priority (time
frame)/Difficulty/Pay
off
Trade facilitation (TF)
Lack of a strategic plan for corridor
development.
Corridor based approach with poor
strategic assessment for the country.
Projects are corridor specific with a
high risk of over or under investment.
The criteria for the selection of
transport links to be developed are
not clear.
There is a risk that some links in
areas with clear potential for
exportable production will be
neglected and receive low priority.
Infrastructure investments not
coordinated with policy reforms.
Develop a coherent logistics approach for
Zambia with the definition of a core
strategic logistics network and the
accompanying policy reforms.
Link strategy to TF Needs Assessment
conducted as part of the WTO TF
Agreement through the Zambia National
Trade Facilitation Committee to ensure
coherence and coordination of actions.
MCIT Logistics approach
defined, with clear
prioritization of Pave
8000 network and
necessary policy reforms
agreed upon.
ST/ L/ G
OSBP benefits are not fully realized. OSBP has been adopted as preferred
approach to border reforms
OSBP benefits not fully confirmed by
private sector.
Precede OSBP initiatives by procedural
reforms.
Precede OSBP by application of
electronic payment system by customs.
MOF/OGAs Time to clear borders
decreased by X%
ST/M/ G
Poor coordination among border
agencies.
There is no agreement on the agency
in charge and with overall authority at
the border posts.
Poor coordination and management
of the borders.
Designate an agency with overall
responsibility for border coordination and
management, and strengthen its mandate
to perform its tasks effectively.
MOF/MOHA/OGAs Traffic flow at border
posts improved by X%
Bill on coordinated
border management in
place
MT/ M/ G
Railways playing small role in
movement of international trade.
Laissez faire approach.
Most traffic is moved by road
compounding viability problems for
the railways.
Prioritize quality of service to major
shippers and offer incentives for
cooperation between ZRL and TAZARA.
Reimburse railways fuel levy charges and
update road user charges under
COMESA/SADC frameworks
MCT/ZRL/TAZARA
NRFA
Volume of goods traffic
moved by rail increased
by X%
Reimbursement policy
approved
LT/ M/ S
Increase participation of Zambian
fleet in regional trucking.
Laissez faire approach.
Zambian fleet plays small role in
regional trucking, minimizing
potential for job creation.
Engage with neighboring countries on
adopting non-discriminatory practices
and common standards.
MCT Proportion of Zambian
registered trucks in
border traffic increased
by X%
LT/ H/ S
Participation in regional initiatives. Weak exploitation of regional
programs.
Zambia is not fully leveraging
regional mechanisms to reduce its
trade costs.
Develop clear logistics plans to integrate
into potential regional supply chains – for
example, key intermediate logistic
infrastructure such as establishing storage
facilities for grains or infrastructure for
extension services for participation in
regional value chains.
MCIT Participation in regional
supply chains under
COMESA, SADC, APEI
LT/ M/G
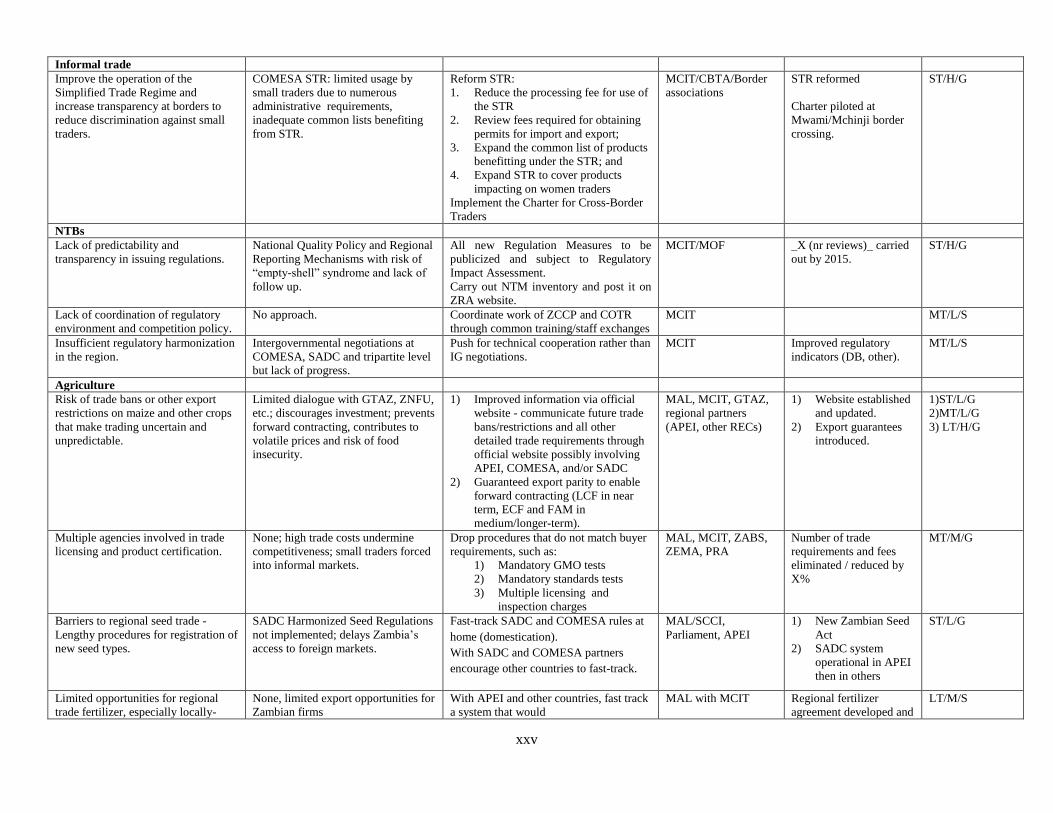
xxv
Informal trade
Improve the operation of the
Simplified Trade Regime and
increase transparency at borders to
reduce discrimination against small
traders.
COMESA STR: limited usage by
small traders due to numerous
administrative requirements,
inadequate common lists benefiting
from STR.
Reform STR:
1. Reduce the processing fee for use of
the STR
2. Review fees required for obtaining
permits for import and export;
3. Expand the common list of products
benefitting under the STR; and
4. Expand STR to cover products
impacting on women traders
Implement the Charter for Cross-Border
Traders
MCIT/CBTA/Border
associations
STR reformed
Charter piloted at
Mwami/Mchinji border
crossing.
ST/H/G
NTBs
Lack of predictability and
transparency in issuing regulations.
National Quality Policy and Regional
Reporting Mechanisms with risk of
“empty-shell” syndrome and lack of
follow up.
All new Regulation Measures to be
publicized and subject to Regulatory
Impact Assessment.
Carry out NTM inventory and post it on
ZRA website.
MCIT/MOF
_X (nr reviews)_ carried
out by 2015.
ST/H/G
Lack of coordination of regulatory
environment and competition policy.
No approach. Coordinate work of ZCCP and COTR
through common training/staff exchanges
MCIT MT/L/S
Insufficient regulatory harmonization
in the region.
Intergovernmental negotiations at
COMESA, SADC and tripartite level
but lack of progress.
Push for technical cooperation rather than
IG negotiations.
MCIT Improved regulatory
indicators (DB, other).
MT/L/S
Agriculture
Risk of trade bans or other export
restrictions on maize and other crops
that make trading uncertain and
unpredictable.
Limited dialogue with GTAZ, ZNFU,
etc.; discourages investment; prevents
forward contracting, contributes to
volatile prices and risk of food
insecurity.
1) Improved information via official
website - communicate future trade
bans/restrictions and all other
detailed trade requirements through
official website possibly involving
APEI, COMESA, and/or SADC
2) Guaranteed export parity to enable
forward contracting (LCF in near
term, ECF and FAM in
medium/longer-term).
MAL, MCIT, GTAZ,
regional partners
(APEI, other RECs)
1) Website established
and updated.
2) Export guarantees
introduced.
1)ST/L/G
2)MT/L/G
3) LT/H/G
Multiple agencies involved in trade
licensing and product certification.
None; high trade costs undermine
competitiveness; small traders forced
into informal markets.
Drop procedures that do not match buyer
requirements, such as:
1) Mandatory GMO tests
2) Mandatory standards tests
3) Multiple licensing and
inspection charges
MAL, MCIT, ZABS,
ZEMA, PRA
Number of trade
requirements and fees
eliminated / reduced by
X%
MT/M/G
Barriers to regional seed trade -
Lengthy procedures for registration of
new seed types.
SADC Harmonized Seed Regulations
not implemented; delays Zambia’s
access to foreign markets.
Fast-track SADC and COMESA rules at
home (domestication).
With SADC and COMESA partners
encourage other countries to fast-track.
MAL/SCCI,
Parliament, APEI
1) New Zambian Seed
Act
2) SADC system
operational in APEI
then in others
ST/L/G
Limited opportunities for regional
trade fertilizer, especially locally-
None, limited export opportunities for
Zambian firms
With APEI and other countries, fast track
a system that would
MAL with MCIT Regional fertilizer
agreement developed and
LT/M/S
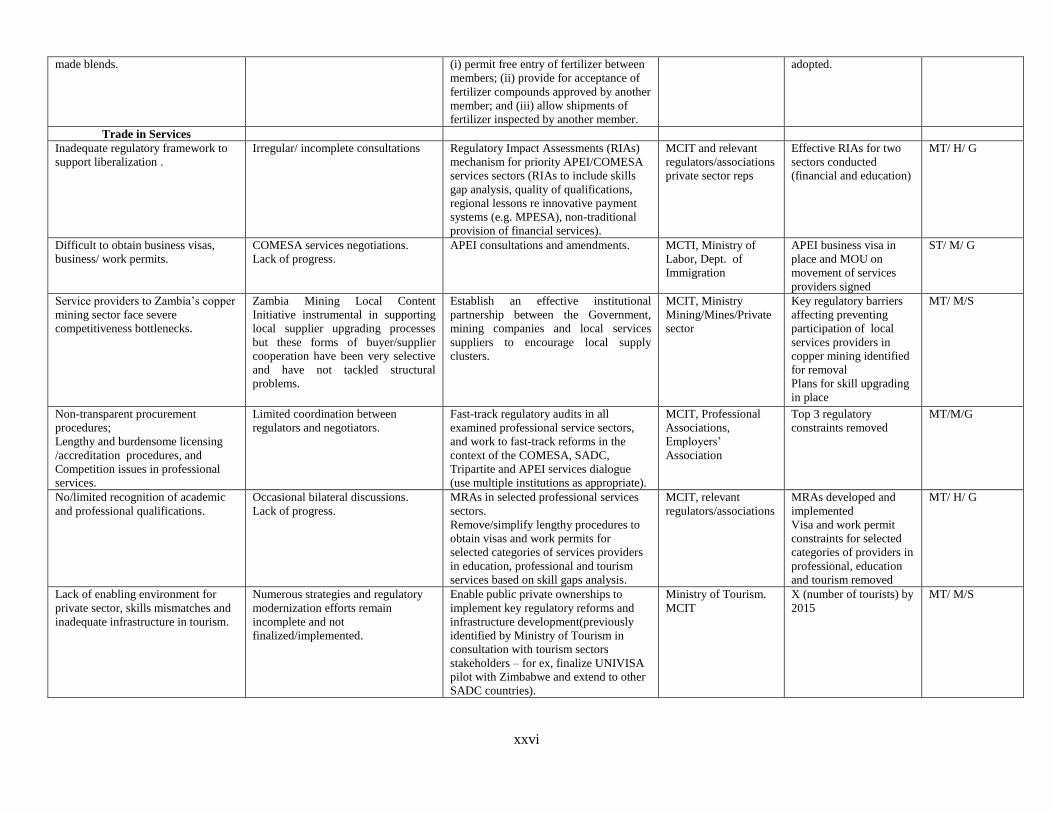
xxvi
made blends. (i) permit free entry of fertilizer between
members; (ii) provide for acceptance of
fertilizer compounds approved by another
member; and (iii) allow shipments of
fertilizer inspected by another member.
adopted.
Trade in Services
Inadequate regulatory framework to
support liberalization .
Irregular/ incomplete consultations Regulatory Impact Assessments (RIAs)
mechanism for priority APEI/COMESA
services sectors (RIAs to include skills
gap analysis, quality of qualifications,
regional lessons re innovative payment
systems (e.g. MPESA), non-traditional
provision of financial services).
MCIT and relevant
regulators/associations
private sector reps
Effective RIAs for two
sectors conducted
(financial and education)
MT/ H/ G
Difficult to obtain business visas,
business/ work permits.
COMESA services negotiations.
Lack of progress.
APEI consultations and amendments. MCTI, Ministry of
Labor, Dept. of
Immigration
APEI business visa in
place and MOU on
movement of services
providers signed
ST/ M/ G
Service providers to Zambia’s copper
mining sector face severe
competitiveness bottlenecks.
Zambia Mining Local Content
Initiative instrumental in supporting
local supplier upgrading processes
but these forms of buyer/supplier
cooperation have been very selective
and have not tackled structural
problems.
Establish an effective institutional
partnership between the Government,
mining companies and local services
suppliers to encourage local supply
clusters.
MCIT, Ministry
Mining/Mines/Private
sector
Key regulatory barriers
affecting preventing
participation of local
services providers in
copper mining identified
for removal
Plans for skill upgrading
in place
MT/ M/S
Non-transparent procurement
procedures;
Lengthy and burdensome licensing
/accreditation procedures, and
Competition issues in professional
services.
Limited coordination between
regulators and negotiators.
Fast-track regulatory audits in all
examined professional service sectors,
and work to fast-track reforms in the
context of the COMESA, SADC,
Tripartite and APEI services dialogue
(use multiple institutions as appropriate).
MCIT, Professional
Associations,
Employers’
Association
Top 3 regulatory
constraints removed
MT/M/G
No/limited recognition of academic
and professional qualifications.
Occasional bilateral discussions.
Lack of progress.
MRAs in selected professional services
sectors.
Remove/simplify lengthy procedures to
obtain visas and work permits for
selected categories of services providers
in education, professional and tourism
services based on skill gaps analysis.
MCIT, relevant
regulators/associations
MRAs developed and
implemented
Visa and work permit
constraints for selected
categories of providers in
professional, education
and tourism removed
MT/ H/ G
Lack of enabling environment for
private sector, skills mismatches and
inadequate infrastructure in tourism.
Numerous strategies and regulatory
modernization efforts remain
incomplete and not
finalized/implemented.
Enable public private ownerships to
implement key regulatory reforms and
infrastructure development(previously
identified by Ministry of Tourism in
consultation with tourism sectors
stakeholders – for ex, finalize UNIVISA
pilot with Zimbabwe and extend to other
SADC countries).
Ministry of Tourism.
MCIT
X (number of tourists) by
2015
MT/ M/S
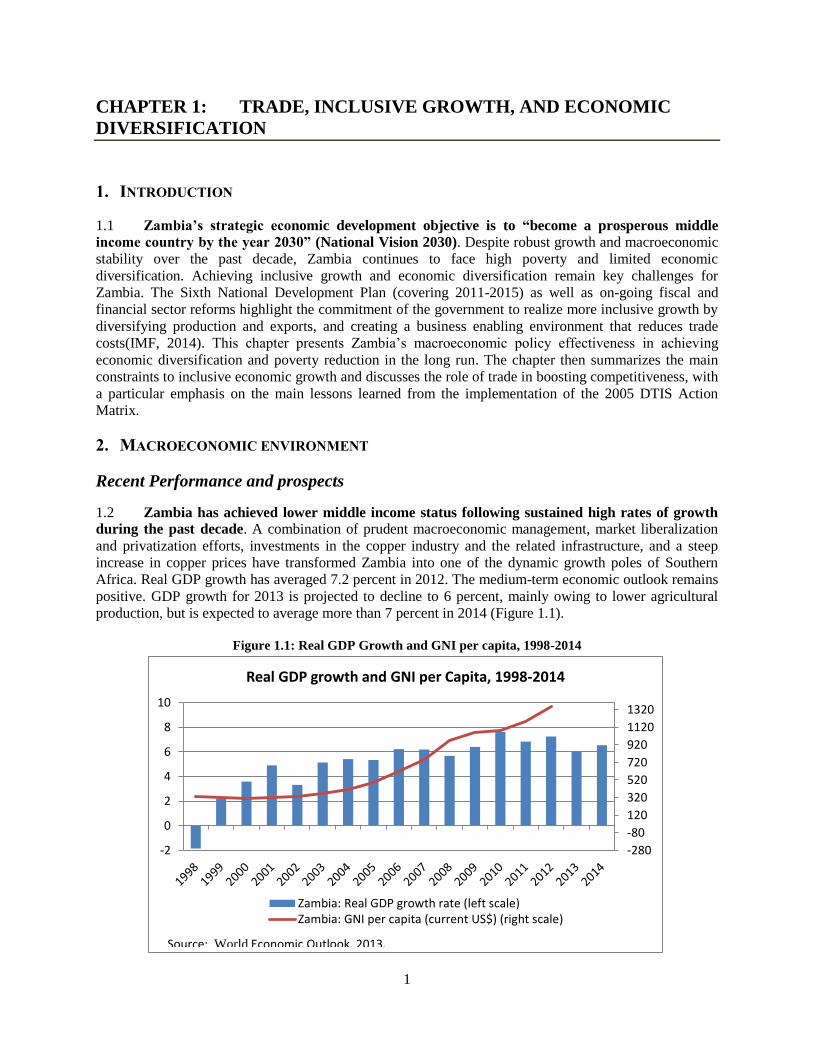
1
CHAPTER 1: TRADE, INCLUSIVE GROWTH, AND ECONOMIC
DIVERSIFICATION
1. INTRODUCTION
1.1 Zambia’s strategic economic development objective is to “become a prosperous middle
income country by the year 2030” (National Vision 2030). Despite robust growth and macroeconomic
stability over the past decade, Zambia continues to face high poverty and limited economic
diversification. Achieving inclusive growth and economic diversification remain key challenges for
Zambia. The Sixth National Development Plan (covering 2011-2015) as well as on-going fiscal and
financial sector reforms highlight the commitment of the government to realize more inclusive growth by
diversifying production and exports, and creating a business enabling environment that reduces trade
costs(IMF, 2014). This chapter presents Zambia’s macroeconomic policy effectiveness in achieving
economic diversification and poverty reduction in the long run. The chapter then summarizes the main
constraints to inclusive economic growth and discusses the role of trade in boosting competitiveness, with
a particular emphasis on the main lessons learned from the implementation of the 2005 DTIS Action
Matrix.
2. MACROECONOMIC ENVIRONMENT
Recent Performance and prospects
1.2 Zambia has achieved lower middle income status following sustained high rates of growth
during the past decade. A combination of prudent macroeconomic management, market liberalization
and privatization efforts, investments in the copper industry and the related infrastructure, and a steep
increase in copper prices have transformed Zambia into one of the dynamic growth poles of Southern
Africa. Real GDP growth has averaged 7.2 percent in 2012. The medium-term economic outlook remains
positive. GDP growth for 2013 is projected to decline to 6 percent, mainly owing to lower agricultural
production, but is expected to average more than 7 percent in 2014 (Figure 1.1).
Figure 1.1: Real GDP Growth and GNI per capita, 1998-2014
-280
-80
120
320
520
720
920
1120
1320
-2
0
2
4
6
8
10
Real GDP growth and GNI per Capita, 1998-2014
Zambia: Real GDP growth rate (left scale)Zambia: GNI per capita (current US$) (right scale)
Source: World Economic Outlook, 2013.
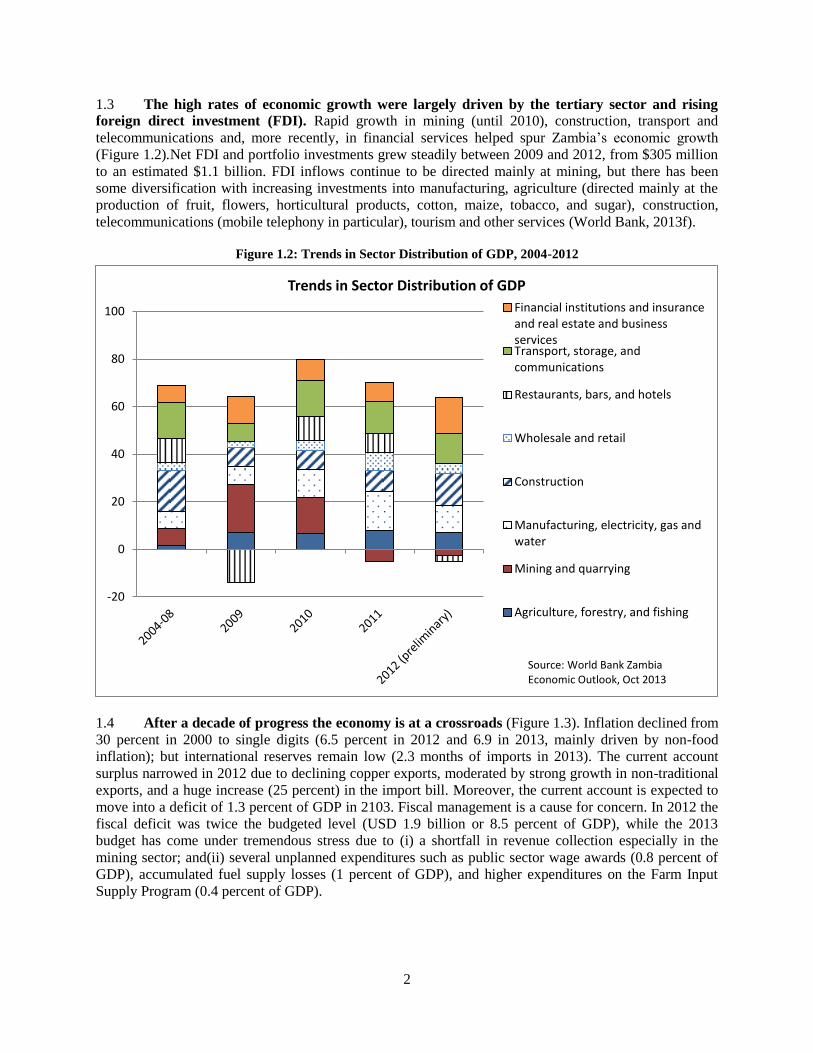
2
1.3 The high rates of economic growth were largely driven by the tertiary sector and rising
foreign direct investment (FDI). Rapid growth in mining (until 2010), construction, transport and
telecommunications and, more recently, in financial services helped spur Zambia’s economic growth
(Figure 1.2).Net FDI and portfolio investments grew steadily between 2009 and 2012, from $305 million
to an estimated $1.1 billion. FDI inflows continue to be directed mainly at mining, but there has been
some diversification with increasing investments into manufacturing, agriculture (directed mainly at the
production of fruit, flowers, horticultural products, cotton, maize, tobacco, and sugar), construction,
telecommunications (mobile telephony in particular), tourism and other services (World Bank, 2013f).
Figure 1.2: Trends in Sector Distribution of GDP, 2004-2012
1.4 After a decade of progress the economy is at a crossroads (Figure 1.3). Inflation declined from
30 percent in 2000 to single digits (6.5 percent in 2012 and 6.9 in 2013, mainly driven by non-food
inflation); but international reserves remain low (2.3 months of imports in 2013). The current account
surplus narrowed in 2012 due to declining copper exports, moderated by strong growth in non-traditional
exports, and a huge increase (25 percent) in the import bill. Moreover, the current account is expected to
move into a deficit of 1.3 percent of GDP in 2103. Fiscal management is a cause for concern. In 2012 the
fiscal deficit was twice the budgeted level (USD 1.9 billion or 8.5 percent of GDP), while the 2013
budget has come under tremendous stress due to (i) a shortfall in revenue collection especially in the
mining sector; and(ii) several unplanned expenditures such as public sector wage awards (0.8 percent of
GDP), accumulated fuel supply losses (1 percent of GDP), and higher expenditures on the Farm Input
Supply Program (0.4 percent of GDP).
-20
0
20
40
60
80
100
Trends in Sector Distribution of GDP
Financial institutions and insuranceand real estate and businessservicesTransport, storage, andcommunications
Restaurants, bars, and hotels
Wholesale and retail
Construction
Manufacturing, electricity, gas andwater
Mining and quarrying
Agriculture, forestry, and fishing
Source: World Bank Zambia Economic Outlook, Oct 2013
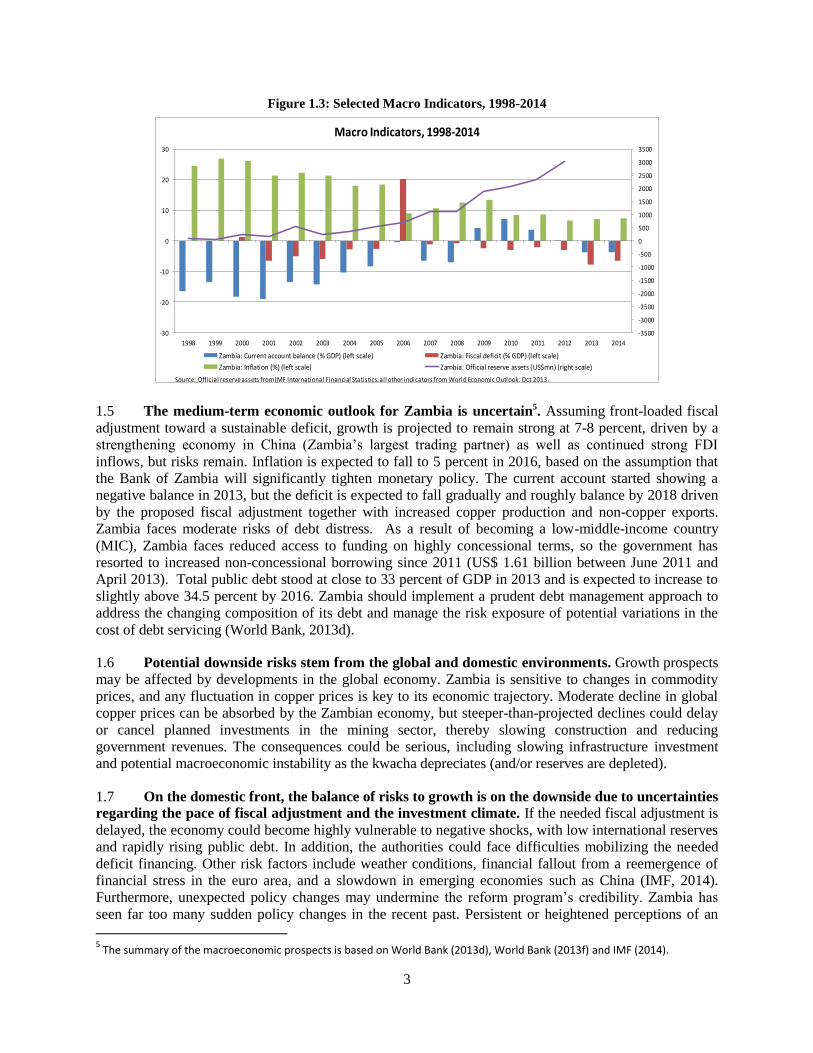
3
Figure 1.3: Selected Macro Indicators, 1998-2014
1.5 The medium-term economic outlook for Zambia is uncertain5. Assuming front-loaded fiscal
adjustment toward a sustainable deficit, growth is projected to remain strong at 7-8 percent, driven by a
strengthening economy in China (Zambia’s largest trading partner) as well as continued strong FDI
inflows, but risks remain. Inflation is expected to fall to 5 percent in 2016, based on the assumption that
the Bank of Zambia will significantly tighten monetary policy. The current account started showing a
negative balance in 2013, but the deficit is expected to fall gradually and roughly balance by 2018 driven
by the proposed fiscal adjustment together with increased copper production and non-copper exports.
Zambia faces moderate risks of debt distress. As a result of becoming a low-middle-income country
(MIC), Zambia faces reduced access to funding on highly concessional terms, so the government has
resorted to increased non-concessional borrowing since 2011 (US$ 1.61 billion between June 2011 and
April 2013). Total public debt stood at close to 33 percent of GDP in 2013 and is expected to increase to
slightly above 34.5 percent by 2016. Zambia should implement a prudent debt management approach to
address the changing composition of its debt and manage the risk exposure of potential variations in the
cost of debt servicing (World Bank, 2013d).
1.6 Potential downside risks stem from the global and domestic environments. Growth prospects
may be affected by developments in the global economy. Zambia is sensitive to changes in commodity
prices, and any fluctuation in copper prices is key to its economic trajectory. Moderate decline in global
copper prices can be absorbed by the Zambian economy, but steeper-than-projected declines could delay
or cancel planned investments in the mining sector, thereby slowing construction and reducing
government revenues. The consequences could be serious, including slowing infrastructure investment
and potential macroeconomic instability as the kwacha depreciates (and/or reserves are depleted).
1.7 On the domestic front, the balance of risks to growth is on the downside due to uncertainties
regarding the pace of fiscal adjustment and the investment climate. If the needed fiscal adjustment is
delayed, the economy could become highly vulnerable to negative shocks, with low international reserves
and rapidly rising public debt. In addition, the authorities could face difficulties mobilizing the needed
deficit financing. Other risk factors include weather conditions, financial fallout from a reemergence of
financial stress in the euro area, and a slowdown in emerging economies such as China (IMF, 2014).
Furthermore, unexpected policy changes may undermine the reform program’s credibility. Zambia has
seen far too many sudden policy changes in the recent past. Persistent or heightened perceptions of an
5 The summary of the macroeconomic prospects is based on World Bank (2013d), World Bank (2013f) and IMF (2014).
-3500
-3000
-2500
-2000
-1500
-1000
-500
0
500
1000
1500
2000
2500
3000
3500
-30
-20
-10
0
10
20
30
1998 1999 2000 2001 2002 2003 2004 2005 2006 2007 2008 2009 2010 2011 2012 2013 2014
Macro Indicators, 1998-2014
Zambia: Current account balance (% GDP) (left scale) Zambia: Fiscal deficit (% GDP) (left scale)
Zambia: Inflation (%) (left scale) Zambia: Official reserve assets (US$mn) (right scale)
Source: Official reserve assets from IMF International Financial Statistics, all other indicators from World Economic Outlook, Oct 2013.
4
uncertain policy environment could cause investments to be weaker than expected and reduce GDP
growth. The risks of fiscal slippages could also undermine macroeconomic stability in the Zambian
economy and undo some of the hard-earned gains of recent years. Yet the authorities remain committed to
maintaining macroeconomic stability. Preserving Zambia’s macroeconomic stability calls for a reduction
of the fiscal deficit and increased international reserves. This requires mobilizing additional domestic
revenue, realigning spending priorities and creating fiscal space for infrastructure investment, while
maintaining a business environment that encourages job creation (IMF, 2014).
Achievements and challenges
1.8 Zambia’s robust economic growth has not led to diversification or declines in poverty. Policy goals for a typical resource-rich country such as Zambia are sustainable growth, economic
diversification and poverty reduction. Despite numerous achievements, the economy remains excessively
dependent on the copper sector that has not generated the jobs and income levels needed to reach the
country’s poverty reduction goals. While Zambia’s growth performance remains strong, copper exports
continue to dominate Zambia’s merchandise exports and about 60 percent of the population still lives
below the poverty line.
1.9 Job creation has not been commensurate with economic growth. Formal wage jobs are being
created very slowly due to the current structure of the economy and the sources of growth. According to
the most recent Labor Force Survey (conducted in 2008), services and mining, the most dynamic sectors
of the Zambian economy employ only 26 percent of the total labor force. By contrast, agriculture, a sector
characterized by stagnant growth rates employs over 77 percent of the population. The main explanatory
factors for these discrepancies are low labor productivity, low absorption capacity of the labor market for
new entrants, particularly the youth, and the concentration of growth in highly capital-intensive and
urban-based sectors. Moreover, around 90 percent of the total workforce is in the informal sector or
through informal labor arrangements (casual workers) in the formal sector. Finally, a large number of
working Zambians – concentrated mostly in farming and nonfarm self-employment- are poor. A key
priority of Zambia’s efforts to tackle the jobs challenge should be the increase of the earnings of the
working poor( World Bank 2013f).
1.10 Fiscal policy has not benefitted the diversification or the job creation agenda. Within
agriculture, supporting interventions towards enhancing agriculture productivity is a priority, yet fiscal
policy has largely supported the ineffective food and input subsidies that did not improve productivity and
rural incomes (World Bank, 2012). Social sector expenditure in education and health has neither been
pro-poor nor progressive, due to unequal access to services (World Bank, 2013f). This shows that fiscal
policy has not encouraged investment in human capital that could be important for diversification. In
addition, infrastructure spending has not been guided by an economic agenda towards increasing
productivity or economic diversification. The choice of infrastructure projects is not informed by
feasibility findings and economic net worth.
1.11 Mining revenues have been relatively low and copper windfall has not contributed much to
building human capital. Zambia is richly endowed with copper – it is Africa’s top copper producer and
the world’s seventh-largest, making up about 6% of global output. Copper is the country’s major source
of foreign exchange, accounting for about 80% of total exports. Despite increasing copper exports,
mining revenues have remained relatively low until 2011 and are projected be lower in 2013 than initially
estimated (Figure 1.4). Also, while mining revenues have grown they have gone mostly to consumption
instead of human capital investment. Given that mining tax revenues are highly correlated with copper
prices, the effect of volatile copper prices on the government budget need to be properly managed to
achieve long term economic goals and fiscal policy stability.
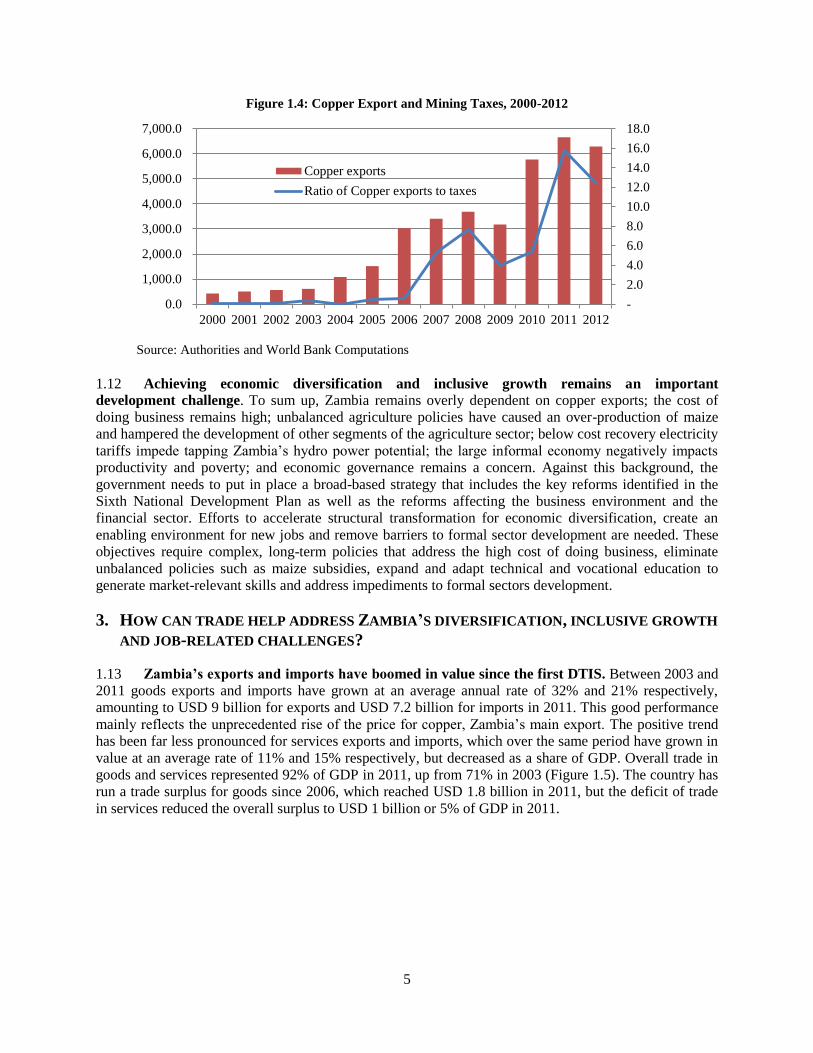
5
Figure 1.4: Copper Export and Mining Taxes, 2000-2012
1.12 Achieving economic diversification and inclusive growth remains an important
development challenge. To sum up, Zambia remains overly dependent on copper exports; the cost of
doing business remains high; unbalanced agriculture policies have caused an over-production of maize
and hampered the development of other segments of the agriculture sector; below cost recovery electricity
tariffs impede tapping Zambia’s hydro power potential; the large informal economy negatively impacts
productivity and poverty; and economic governance remains a concern. Against this background, the
government needs to put in place a broad-based strategy that includes the key reforms identified in the
Sixth National Development Plan as well as the reforms affecting the business environment and the
financial sector. Efforts to accelerate structural transformation for economic diversification, create an
enabling environment for new jobs and remove barriers to formal sector development are needed. These
objectives require complex, long-term policies that address the high cost of doing business, eliminate
unbalanced policies such as maize subsidies, expand and adapt technical and vocational education to
generate market-relevant skills and address impediments to formal sectors development.
3. HOW CAN TRADE HELP ADDRESS ZAMBIA’S DIVERSIFICATION, INCLUSIVE GROWTH
AND JOB-RELATED CHALLENGES?
1.13 Zambia’s exports and imports have boomed in value since the first DTIS. Between 2003 and
2011 goods exports and imports have grown at an average annual rate of 32% and 21% respectively,
amounting to USD 9 billion for exports and USD 7.2 billion for imports in 2011. This good performance
mainly reflects the unprecedented rise of the price for copper, Zambia’s main export. The positive trend
has been far less pronounced for services exports and imports, which over the same period have grown in
value at an average rate of 11% and 15% respectively, but decreased as a share of GDP. Overall trade in
goods and services represented 92% of GDP in 2011, up from 71% in 2003 (Figure 1.5). The country has
run a trade surplus for goods since 2006, which reached USD 1.8 billion in 2011, but the deficit of trade
in services reduced the overall surplus to USD 1 billion or 5% of GDP in 2011.
-
2.0
4.0
6.0
8.0
10.0
12.0
14.0
16.0
18.0
0.0
1,000.0
2,000.0
3,000.0
4,000.0
5,000.0
6,000.0
7,000.0
2000 2001 2002 2003 2004 2005 2006 2007 2008 2009 2010 2011 2012
Source: Authorities and World Bank Computations
Copper exports
Ratio of Copper exports to taxes
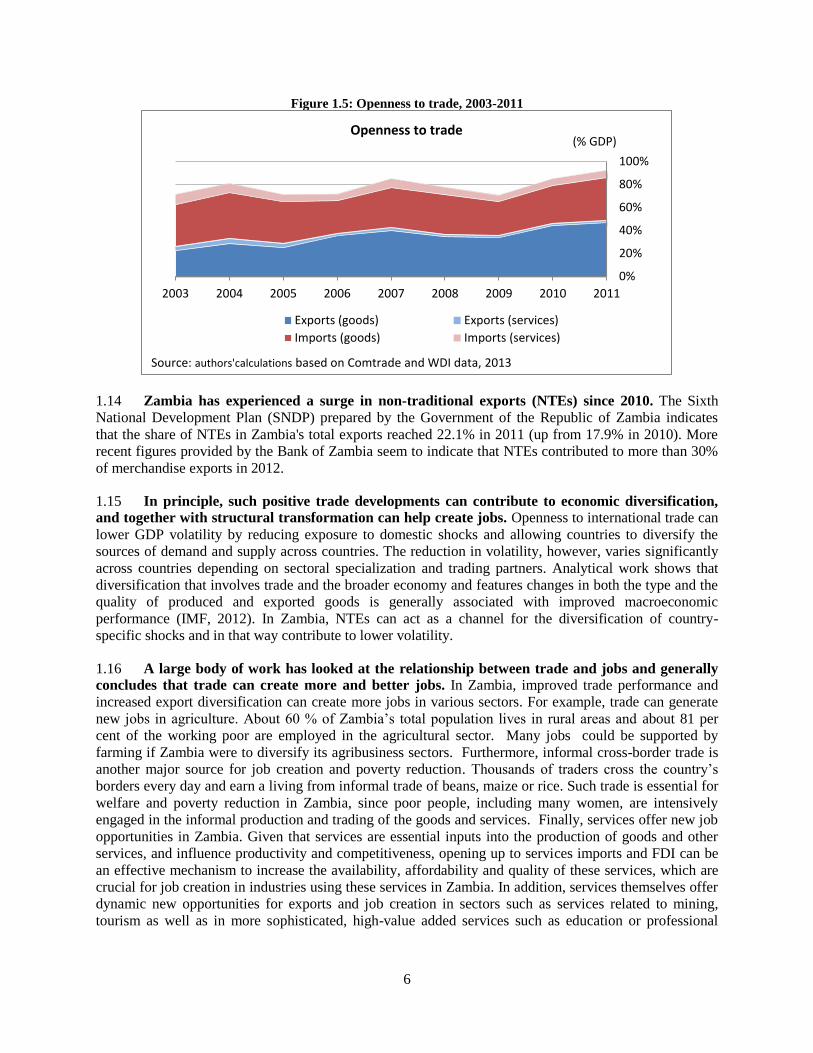
6
Figure 1.5: Openness to trade, 2003-2011
1.14 Zambia has experienced a surge in non-traditional exports (NTEs) since 2010. The Sixth
National Development Plan (SNDP) prepared by the Government of the Republic of Zambia indicates
that the share of NTEs in Zambia's total exports reached 22.1% in 2011 (up from 17.9% in 2010). More
recent figures provided by the Bank of Zambia seem to indicate that NTEs contributed to more than 30%
of merchandise exports in 2012.
1.15 In principle, such positive trade developments can contribute to economic diversification,
and together with structural transformation can help create jobs. Openness to international trade can
lower GDP volatility by reducing exposure to domestic shocks and allowing countries to diversify the
sources of demand and supply across countries. The reduction in volatility, however, varies significantly
across countries depending on sectoral specialization and trading partners. Analytical work shows that
diversification that involves trade and the broader economy and features changes in both the type and the
quality of produced and exported goods is generally associated with improved macroeconomic
performance (IMF, 2012). In Zambia, NTEs can act as a channel for the diversification of country-
specific shocks and in that way contribute to lower volatility.
1.16 A large body of work has looked at the relationship between trade and jobs and generally
concludes that trade can create more and better jobs. In Zambia, improved trade performance and
increased export diversification can create more jobs in various sectors. For example, trade can generate
new jobs in agriculture. About 60 % of Zambia’s total population lives in rural areas and about 81 per
cent of the working poor are employed in the agricultural sector. Many jobs could be supported by
farming if Zambia were to diversify its agribusiness sectors. Furthermore, informal cross-border trade is
another major source for job creation and poverty reduction. Thousands of traders cross the country’s
borders every day and earn a living from informal trade of beans, maize or rice. Such trade is essential for
welfare and poverty reduction in Zambia, since poor people, including many women, are intensively
engaged in the informal production and trading of the goods and services. Finally, services offer new job
opportunities in Zambia. Given that services are essential inputs into the production of goods and other
services, and influence productivity and competitiveness, opening up to services imports and FDI can be
an effective mechanism to increase the availability, affordability and quality of these services, which are
crucial for job creation in industries using these services in Zambia. In addition, services themselves offer
dynamic new opportunities for exports and job creation in sectors such as services related to mining,
tourism as well as in more sophisticated, high-value added services such as education or professional
0%
20%
40%
60%
80%
100%
2003 2004 2005 2006 2007 2008 2009 2010 2011
Openness to trade
Exports (goods) Exports (services)
Imports (goods) Imports (services)
Source: authors'calculations based on Comtrade and WDI data, 2013
(% GDP)
7
services. However, the trade-related opportunities in terms of economic diversification, job creation and
poverty reduction are not generated automatically.
4. WHAT EXPLAINS THE LIMITED CONTRIBUTION OF TRADE TO INCLUSIVE GROWTH
AND JOB CREATION?
1.17 The current economic and trade environment in Zambia is dominated by frequent and
unexpected policy changes that make it challenging for companies to integrate into regional supply
chains as reliable partners. Recently, the unpredictable policy environment has deterred foreign direct
investment outside large mining projects and there were actually outflows for the manufacturing sector6.
In agriculture, erratic policies have stopped investment in maize production this year. The measures taken
by government have often prevented opportunities for job creation from materializing.
1.18 While the government had started to take steps to more rules driven and predictable policy
making, including in the area of trade, there have been recent backlashes. The overall sense remains
that large businesses are not sharing their profits “in an equitable manner”, and restrictive trade and
investment policies are on the rise, further deteriorating the investment climate and reducing incentives
for domestic investment.
1.19 The overall business environment in Zambia has started to improve as a result of sustained
efforts by the authorities but numerous constrains remain. The Government adopted in 2004 the
Private Sector Development Reform Program (PSDRP), which aimed at strengthening the investment
climate for private sector-led growth and featured trade expansion as one of its six pillars. In 2010,
Zambia was recognized by Doing Business as one of the 10 economies worldwide improving the most the
ease of doing business. Trade-related reforms already implemented or planned include the setting up of
computerized systems to facilitate clearing of imports and exports and allow for pre-clearance before
cargo actually arrive, the introduction of scanners to inspect cargo, or the establishment of one-stop
border posts (OECD 2012). Zambia has also partnered with Malawi and Zimbabwe to implement the
COMESA’s Simplified Trade Regime (STR), which aims at easing small-scale cross-border trade. Given
the share of regional countries in Zambia’s non-traditional exports, such trade facilitation measures are
critical to export diversification. The authorities have also launched several reforms aimed at improving
other aspects of the investment climate and Zambia’s overall competitiveness, but the cost of doing
business remains high and a vast majority of the workforce is still in the informal sector.
1.20 Zambian firms are hugely penalized by an underdeveloped infrastructure, a burdensome
regulatory and tax regime, limited access to finance, low level of skills, and the general high cost of
doing business. Zambia’s current expenditure on infrastructure is about 10% of GDP, lower than the
estimated 20% the country needs to address the infrastructural deficit. Even with proceeds from the
Eurobond, the infrastructure financing gap remains huge. The current shortage of skills puts a premium
on production costs and undermines productivity. Large infrastructure and construction works by foreign
firms rely on imported labor, mainly from South Africa or China. Narrowing the education-skills
mismatch would require reforming the technical and vocational curriculum, investing resources in
research and development, and providing targeted incentives to firms that exhibit strong commitment to
improving human capital development.
1.21 Benchmarked against neighboring countries, Zambia appears to be in an intermediate
position, faring better than several neighboring countries but lower than the best regional performers:
6 See Zambia Economic Update – data from the Bank of Zambia 2012
8
Doing Business (DB)7: Zambia lost 4 places in the latest “Ease of Doing Business” ranking and came
up behind South Africa, Botswana and Namibia, but well ahead of other regional economies (Table
1.1.). Zambia’s ranking on the “Trading Across Borders” indicator remains low and unchanged
(156th), and is the indicator for which the country fares the worst compared with others (along with
“Dealing with Construction Permits” (151th) and “Getting Electricity” (151th)).
Logistics Performance Index (LPI)8: Zambia’s global ranking dropped from 100
th out of 150
countries in 2007 to 138 out of 155 countries in 2010, due to a degradation of two of the six
benchmarked dimensions: (i) competence and quality of logistics services (e.g. transport operators,
customs brokers), and (ii) ability to track and trace consignments. However, Zambia’s score on two
other dimensions improved: (i) efficiency of the clearance process by border control agencies,
including customs, and (ii) timeliness of shipments in reaching destination. Zambia’s LPI ranking in
2010 was well below that of some neighbors such as South Africa, the DRC and Tanzania (Table
1.1.), and its overall score (2.28) was slightly under the average for sub-Saharan Africa (2.42).
Global Competitiveness Index (GCI)9: Zambia’s GCI has steadily improved between 2006/07 and
2012/13, moving from 3.17 to 3.80 (on a scale going from 1 to 7). It ranked 102nd
out of 144
economies in the latest CGI, faring better than regional economies except South Africa, Botswana
and Namibia (Table 1.1). The pillar of growth for which Zambia ranks relatively high include
institutional development, macroeconomic environment, goods market efficiency, financial market
development, innovation, and business sophistication. On the contrary, dimensions such as
infrastructure, health & primary education, higher education & training, labor market efficiency,
technological readiness, and market size drag Zambia’s overall ranking down.
7
The Doing Business project provides objective measures of business regulations for local firms in 185 economies
(www.doingbusiness.org). See World Bank (2013a) for a detailed analysis of the evolution in recent years of the different
dimensions of the business environment measured by Doing Business in Zambia. 8 The LPI benchmarks countries’ performances concerning trade logistics (www.worldbank.org/lpi) 9 The GCI provides a structured, systematic and comprehensive approach to identifying and measuring the drivers of economic
performance of more than 140 economies (www.weforum.org/issues/global-competitiveness)
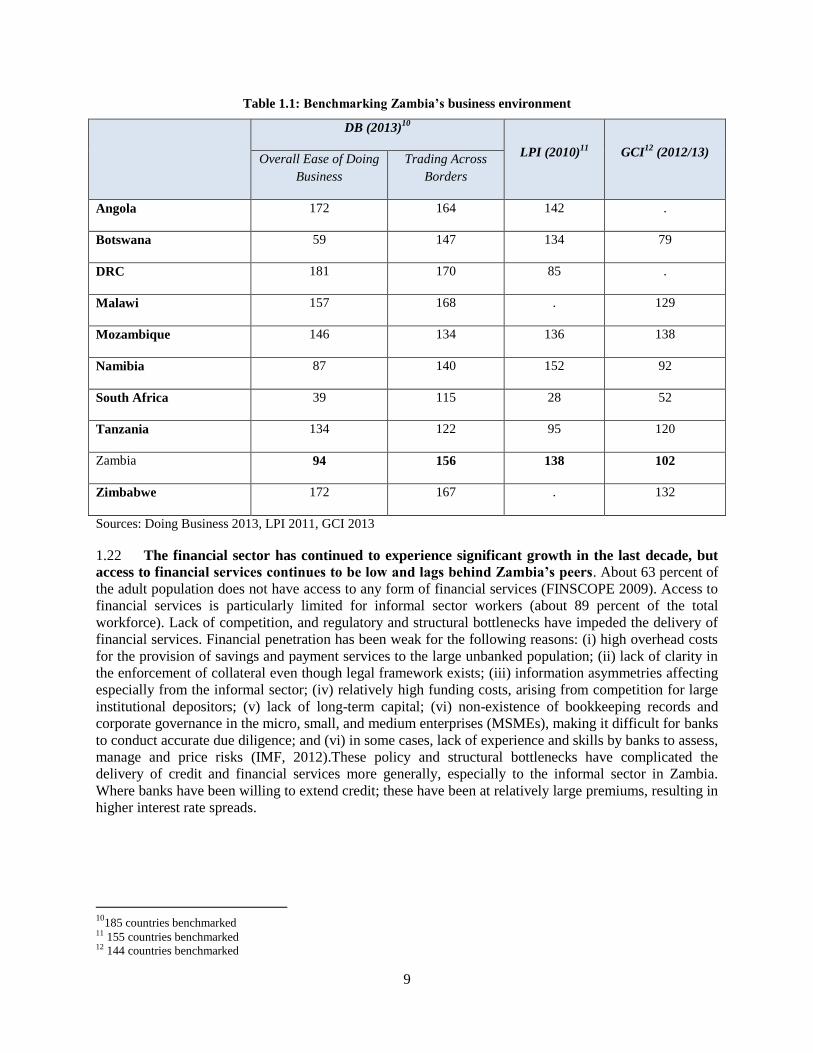
9
Table 1.1: Benchmarking Zambia’s business environment
DB (2013)10
LPI (2010)11
GCI12
(2012/13) Overall Ease of Doing
Business
Trading Across
Borders
Angola 172 164 142 .
Botswana 59 147 134 79
DRC 181 170 85 .
Malawi 157 168 . 129
Mozambique 146 134 136 138
Namibia 87 140 152 92
South Africa 39 115 28 52
Tanzania 134 122 95 120
Zambia 94 156 138 102
Zimbabwe 172 167 . 132
Sources: Doing Business 2013, LPI 2011, GCI 2013
1.22 The financial sector has continued to experience significant growth in the last decade, but
access to financial services continues to be low and lags behind Zambia’s peers. About 63 percent of
the adult population does not have access to any form of financial services (FINSCOPE 2009). Access to
financial services is particularly limited for informal sector workers (about 89 percent of the total
workforce). Lack of competition, and regulatory and structural bottlenecks have impeded the delivery of
financial services. Financial penetration has been weak for the following reasons: (i) high overhead costs
for the provision of savings and payment services to the large unbanked population; (ii) lack of clarity in
the enforcement of collateral even though legal framework exists; (iii) information asymmetries affecting
especially from the informal sector; (iv) relatively high funding costs, arising from competition for large
institutional depositors; (v) lack of long-term capital; (vi) non-existence of bookkeeping records and
corporate governance in the micro, small, and medium enterprises (MSMEs), making it difficult for banks
to conduct accurate due diligence; and (vi) in some cases, lack of experience and skills by banks to assess,
manage and price risks (IMF, 2012).These policy and structural bottlenecks have complicated the
delivery of credit and financial services more generally, especially to the informal sector in Zambia.
Where banks have been willing to extend credit; these have been at relatively large premiums, resulting in
higher interest rate spreads.
10
185 countries benchmarked 11 155 countries benchmarked 12 144 countries benchmarked
10
5. THE POLITICAL ECONOMY OF THE 2005 ACTION MATRIX IMPLEMENTATION
1.23 The 2005 DTIS Action Matrix has proposed a number of reforms to address the key trade
policy and business environment issues but the implementation of the Action Matrix has been
varied: while important progress has been made in the area of customs modernization with numerous
reforms either completed or in the process of completion, progress has been slower in areas such as export
diversification, setting adequate safety and quality standards, market access issues, or trade capacity
building and policy coordination, and muted in some areas such as import policies or services (see Annex
1 for details related to the implementation of the 2005 Action Matrix).
1.24 Zambia has made good progress with mainstreaming trade into national policies and there
are noteworthy results regarding the implementation of the 2005 Action Matrix. The Integrated
Framework (IF) initiative was launched in Zambia in 2004. The Diagnostic Trade Integration Study
(DTIS) and Action Matrix were approved in July 2005. In 2004, alongside the IF process, the Zambian
Government in collaboration with the private sector, civil society and cooperating partners, developed the
Private Sector Development Reform Program (PSDRP) aimed at enhancing the role of the private sector
in Zambia’s economic development process. Furthermore, Zambia mainstreamed the IF/EIF into the
PSDRP by adopting the DTIS and its Action Matrix as the trade component of the PSDRP. The DTIS and
its Action Matrix became the basis of the trade priorities to be addressed under the trade expansion reform
area of the PSDRP. The PSDRP Trade Expansion area has seven components which include i) Trade
Policy, Coordination and Regulation; ii) Trade Capacity Enhancement; iii) Trade Facilitation; iv)
Standards, Quality Assurance, Accreditation and Metrology (SQAM); v) Trade Policy Analysis,
Negotiating, Discourse, Formulation and Implementation; vi) Market Access and Penetration; and vii)
Support to EIF programming, implementation and coordination.
1.25 The priorities set out in the 2005 Action Matrix were incorporated in the Trade Chapter of
Zambia’s Fifth National Development Plan (FNDP) (2006 – 2010), and were subsequently
integrated into the Sixth National Development Plan (SNDP) (2011 – 2015). This was the first time
that Zambia mainstreamed trade into its national development plans. Although there has not been a formal
review of the DTIS, the trade priorities reflected in the SNDP took into account some of the developments
that have taken place since 2005. The Government has launched and is implementing the SNDP 2011-
2015, whose focus in the trade sector will be to facilitate value addition of locally produced goods for
increased domestic and foreign market earnings. The embedding of Trade into the national development
programs, the integration of the IF/EIF into the PSDRP program, which is itself part of the FNDP and
SNDP, the integration and the rationalization of IF/EIF and PSDRP implementation structures have in
principle created necessary synergies, reduced working group operating costs, and leveraged resources
from bilateral donors to support implementation of the priority activities set out in the DTIS Action
Matrix.
1.26 Uneven implementation and mixed results of agreed policy actions, however, have undercut
the efforts to fully integrate trade into Zambian policymaking. Implementation – assessed by
Zambian consultants and stakeholders based on the Government’s Annual Performance reports - has
hovered broadly around 50 percent. Implementation tends to be more advanced in selected productive
sectors, infrastructure and in some trade-related institutions, such as customs, while it appears less
consistent within the Ministry of Trade itself and other trade related institutions, such as those dealing
with Standards and SPS issues. While efforts to reduce tariffs have largely been met with success, less
progress has been achieved with nontariff measures (NTMs) and non-tariff barriers (NTBs). Although the
elimination of burdensome NTMs and the removal of NTBs were considered high priority issues in the
2005 DTIS, numerous barriers such as lengthy customs formalities and discriminating administrative
procedures that have a negative impact on trade continue to hinder regional integration, including
Zambia’s imports and exports. The Government continues to impose import and export bans on
11
agricultural commodities like maize and more recently on exports of copper concentrates. In addition the
Government has imposed an export tax on copper.
1.27 The cluster based strategy for agriculture trade expansion devised in the 2005 DTIS
generated disappointing results. Products such as horticulture, coffee, and paprika were identified as
having great potential for trade expansion in the last DTIS, but have since experienced significant decline
for reasons that would have been difficult, if not impossible, to anticipate. The reasons for the decline
primarily relate to falling world market prices, high local costs, and Zambia’s thin production base that
makes it difficult to achieve effective economies of scale. Paprika exports have virtually collapsed with
only handful of producers still involved in this activity. Each of these crops consumed large amounts of
public and private investment capital as presumed focal points of agriculture growth. These experiences
point to an inherent problem with picking winners as part of some kind of cluster-based strategy for trade
expansion.
1.28 Key factors responsible for inadequate results with the implementation of the 2005 Action
Matrix can be summarized as follows:
Lack of broad awareness of the Action Matrix. The 2005 Action Matrix was discussed with relevant
Zambian public and private sector representatives as well as with development partners. Also, the
Zambian authorities and the development partners have been working closely together to use Aid for
Trade (AfT) most efficiently. But, while awareness and buy-in among the private sector and other
stakeholders has improved, it still remains insufficient to ensure broad-based buy-in for the measures
and sustained pressure towards implementation and accountability. Further work is required to engage
a wider range of participation in the DTIS process, particularly from the private sector, and enhance
dissemination of information.
Lack of clear trade policy priorities. The 48 trade policy recommendations identified as priority
actions in the 2005 DTIS have been challenging to implement. Furthermore, the number of policy
matrices solely in the aid for trade arena such as the DTIS, the Doing Business policies, the Revised
SNDP, the Industrial Clusters Strategy, the Joint Assessment Framework list among others is equally
impressive. Given limited capacity, the high number of policy recommendations hampers their
successful implementation.
Insufficient internal and donor coordination. Lack of coordination within the government and weak
donor coordination have contributed to the lack of implementation of policy recommendations. For
example, changing signals on the importance of selected development activities has an impact on
implementation. A case in point is the emergence of the World Bank Doing Business Report that has
come to eclipse the DTIS as a key monitoring tool, and has shifted the emphasis from trade expansion
to private sector development. While not inconsistent, its seems that the pressure of Doing Business
rankings generated greater donor and government investment in monitoring and implementing the
Doing Business policies rather than the DTIS recommendations.
Weak accountability of key stakeholders in charge. The centralized decision-making system in
Zambia makes it difficult for civil society groups and the private sector to influence the process, and
encourages a culture of weak accountability. Stakeholders claim that this results in an environment
that is prone to discretionary policy measures and poor efficiency of public spending.
Inadequate coordination between the central and the provincial levels. Mainstreaming trade in the
sub-national (provincial) level development cycle and ensuring vertical coordination remain
challenging. The Ministry of Trade, Commerce and Industry (MCTI) has six specialised statutory
bodies mandated to perform trade-related tasks, but except for the Zambia Development Agency
12
(ZDA) and the Citizen Economic Empowerment Commission (CEEC), which have offices in all
provincial headquarters, few other statutory bodies are located in these centres.
Social and political tensions encouraged an interventionist policy approach. Social and political
frustration coupled with insufficient per-capita growth, income inequality, and insufficient and
inadequate jobs may have encouraged policy makers to revert to old-style interventionist and
contradictory policy measures, which have unnerved investors.
6. CONCLUSION
1.29 Zambia’s robust economic growth and positive goods trade and FDI performance during
the last decade have not led to diversification, declines in poverty, or new and better jobs. Current
policies in Zambia prevent farmers and the private sector from benefiting from existing opportunities and
creating additional jobs. Unpredictable and restrictive trade policies and regulations as well as labor and
product market rigidities impede the process of economic diversification and inclusive growth.
1.30 The 2005 DTIS Action Matrix has proposed a number of reforms to address the key trade
policy and business environment issues, but uneven implementation has undercut the efforts to
fully integrate trade into Zambian policymaking. The implementation of the Action Matrix has been
varied: while important progress has been made in the area of customs modernization with numerous
reforms either completed or in the process of completion, progress has been slower in areas such as export
diversification, setting adequate safety and quality standards, market access issues, or trade capacity
building and policy coordination, and muted in some areas such as import policies or services. The cluster
based strategy for agriculture trade expansion devised in the 2005 DTIS generated disappointing results.
Key factors responsible for inadequate results with the implementation of the 2005 Action Matrix were:
(a) Moderate awareness of the 2005 DTIS recommendations; (b) Lack of clear trade policy priorities; (c)
Insufficient internal and donor coordination; (d)Weak accountability of key stakeholders in charge; (e )
Inadequate coordination between the central and the provincial levels; and (f) Social and political tensions
encouraged an interventionist policy approach.
1.31 To address some of these concerns, preliminary results were disseminated to stakeholders
based in Lusaka and the provinces for feedback and discussion. To strengthen the rights of local
traders and investors, and facilitate their cross-border transactions, the World Bank, in collaboration with
the National Implementation Unit of the Ministry of Commerce, Trade and Industry of Zambia, hosted in
April and September three DTIS pre-validation workshops in Lusaka. The main objectives were to share
preliminary findings of the DTIS for Zambia and to generate debate on the proposed reforms related to
trade in agriculture, informal trade, non-tariff barriers, trade facilitation and trade in services.
Furthermore, as part of the Malawi and Zambia Diagnostics Trade Integration Studies (DTIS), the World
Bank in collaboration with the Ministry of Commerce, Trade and Industry of Zambia, and the Ministry of
Industry and Trade of Malawi organized a workshop in Chipata with small traders from the two countries
to discuss a concrete action plan for promoting small scale trade and creating jobs in both countries. But
more remains to be done after the validation workshop to ensure adequate implementation of the New
Action Matrix.
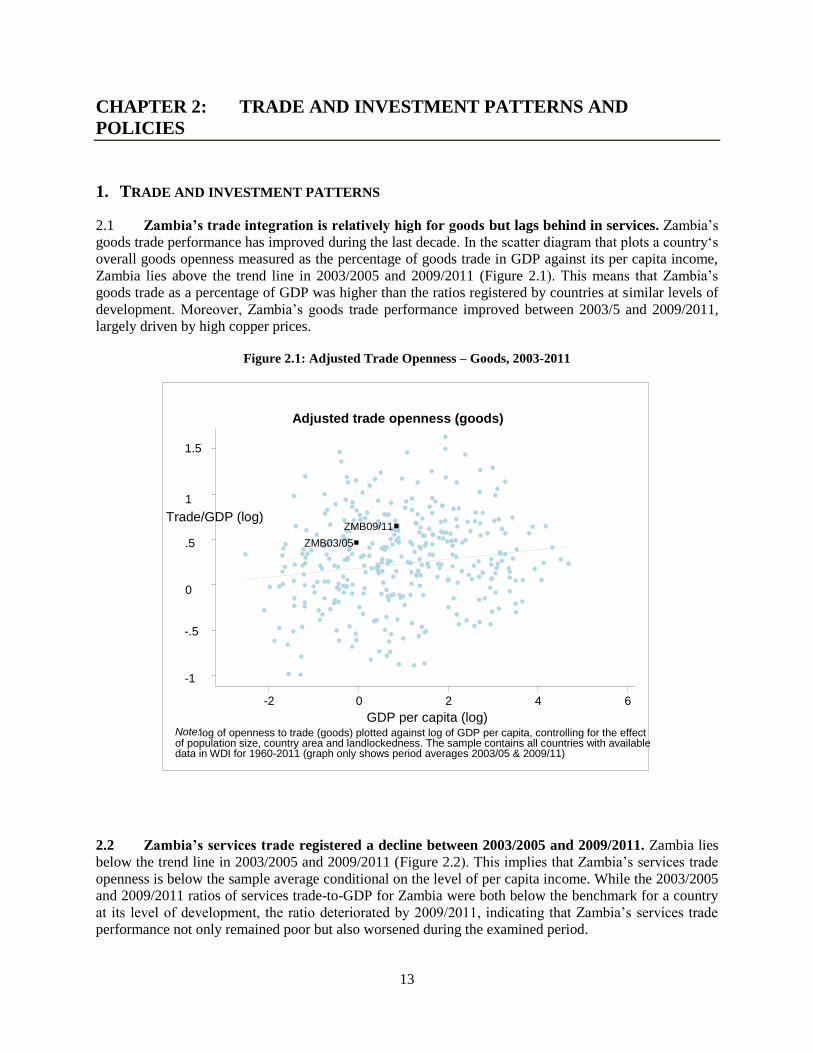
13
CHAPTER 2: TRADE AND INVESTMENT PATTERNS AND
POLICIES
1. TRADE AND INVESTMENT PATTERNS
2.1 Zambia’s trade integration is relatively high for goods but lags behind in services. Zambia’s
goods trade performance has improved during the last decade. In the scatter diagram that plots a country‘s
overall goods openness measured as the percentage of goods trade in GDP against its per capita income,
Zambia lies above the trend line in 2003/2005 and 2009/2011 (Figure 2.1). This means that Zambia’s
goods trade as a percentage of GDP was higher than the ratios registered by countries at similar levels of
development. Moreover, Zambia’s goods trade performance improved between 2003/5 and 2009/2011,
largely driven by high copper prices.
Figure 2.1: Adjusted Trade Openness – Goods, 2003-2011
2.2 Zambia’s services trade registered a decline between 2003/2005 and 2009/2011. Zambia lies
below the trend line in 2003/2005 and 2009/2011 (Figure 2.2). This implies that Zambia’s services trade
openness is below the sample average conditional on the level of per capita income. While the 2003/2005
and 2009/2011 ratios of services trade-to-GDP for Zambia were both below the benchmark for a country
at its level of development, the ratio deteriorated by 2009/2011, indicating that Zambia’s services trade
performance not only remained poor but also worsened during the examined period.
ZMB03/05 ZMB09/11
-1
-.5
0
.5
1
1.5
Trade/GDP (log)
-2 0 2 4 6 GDP per capita (log)
Note: log of openness to trade (goods) plotted against log of GDP per capita, controlling for the effect of population size, country area and landlockedness. The sample contains all countries with available data in WDI for 1960-2011 (graph only shows period averages 2003/05 & 2009/11)
Adjusted trade openness (goods)
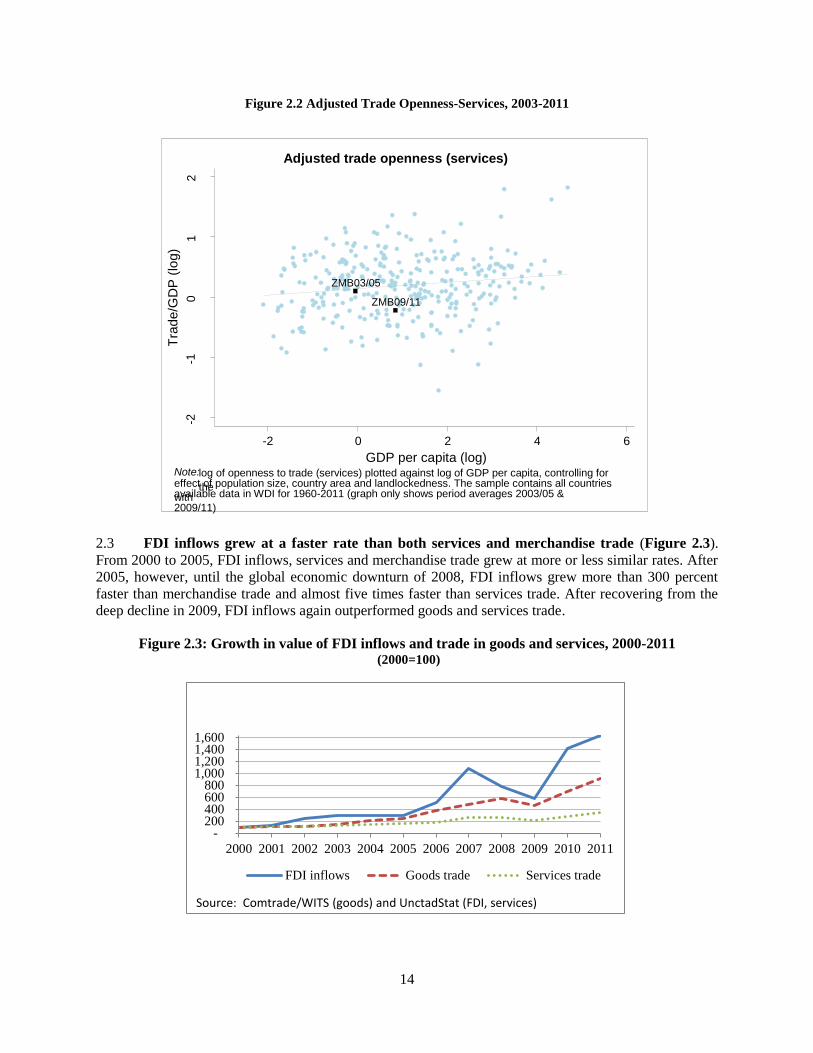
14
Figure 2.2 Adjusted Trade Openness-Services, 2003-2011
2.3 FDI inflows grew at a faster rate than both services and merchandise trade (Figure 2.3).
From 2000 to 2005, FDI inflows, services and merchandise trade grew at more or less similar rates. After
2005, however, until the global economic downturn of 2008, FDI inflows grew more than 300 percent
faster than merchandise trade and almost five times faster than services trade. After recovering from the
deep decline in 2009, FDI inflows again outperformed goods and services trade.
Figure 2.3: Growth in value of FDI inflows and trade in goods and services, 2000-2011 (2000=100)
- 200 400 600 800
1,000 1,200 1,400 1,600
2000 2001 2002 2003 2004 2005 2006 2007 2008 2009 2010 2011
FDI inflows Goods trade Services trade
Source: Comtrade/WITS (goods) and UnctadStat (FDI, services)
ZMB03/05
ZMB09/11
-2
-1
0
1
2
Tra
de/G
DP
(lo
g)
-2 0 2 4 6 GDP per capita (log)
Note: log of openness to trade (services) plotted against log of GDP per capita, controlling for
the effect of population size, country area and landlockedness. The sample contains all countries
with available data in WDI for 1960-2011 (graph only shows period averages 2003/05 &
2009/11)
Adjusted trade openness (services)
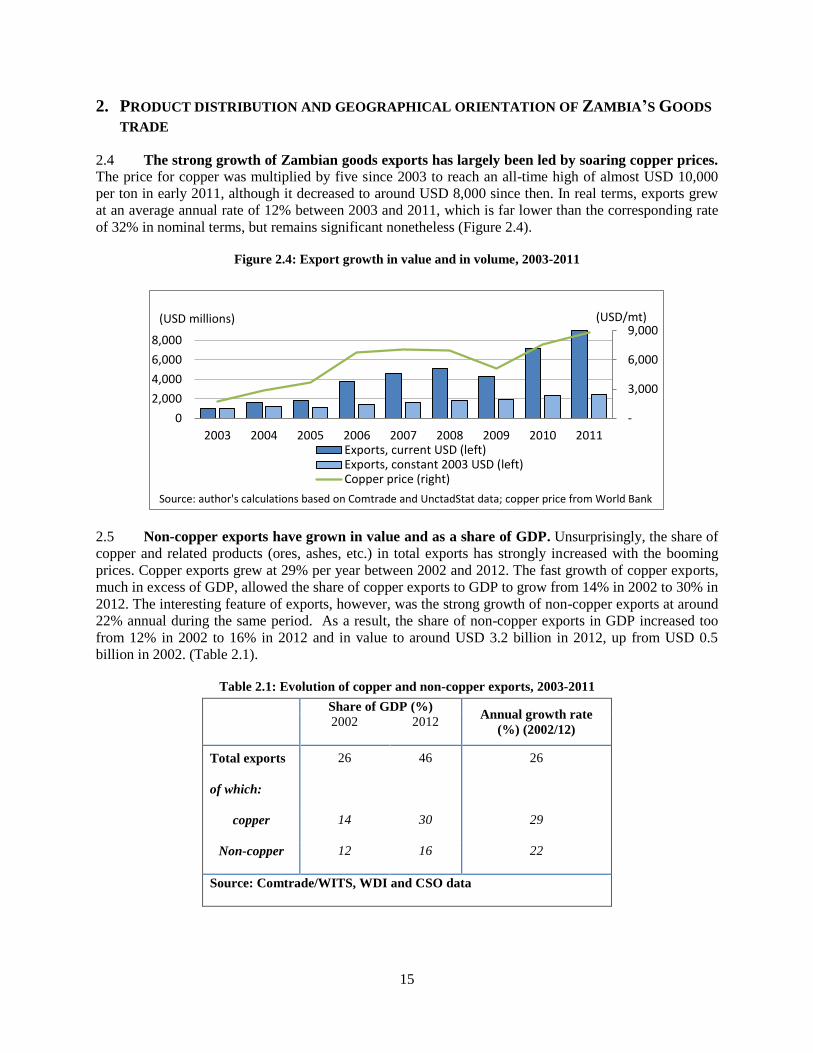
15
2. PRODUCT DISTRIBUTION AND GEOGRAPHICAL ORIENTATION OF ZAMBIA’S GOODS
TRADE
2.4 The strong growth of Zambian goods exports has largely been led by soaring copper prices. The price for copper was multiplied by five since 2003 to reach an all-time high of almost USD 10,000
per ton in early 2011, although it decreased to around USD 8,000 since then. In real terms, exports grew
at an average annual rate of 12% between 2003 and 2011, which is far lower than the corresponding rate
of 32% in nominal terms, but remains significant nonetheless (Figure 2.4).
Figure 2.4: Export growth in value and in volume, 2003-2011
2.5 Non-copper exports have grown in value and as a share of GDP. Unsurprisingly, the share of
copper and related products (ores, ashes, etc.) in total exports has strongly increased with the booming
prices. Copper exports grew at 29% per year between 2002 and 2012. The fast growth of copper exports,
much in excess of GDP, allowed the share of copper exports to GDP to grow from 14% in 2002 to 30% in
2012. The interesting feature of exports, however, was the strong growth of non-copper exports at around
22% annual during the same period. As a result, the share of non-copper exports in GDP increased too
from 12% in 2002 to 16% in 2012 and in value to around USD 3.2 billion in 2012, up from USD 0.5
billion in 2002. (Table 2.1).
Table 2.1: Evolution of copper and non-copper exports, 2003-2011
Share of GDP (%) Annual growth rate
(%) (2002/12) 2002 2012
Total exports 26 46 26
of which:
copper 14 30 29
Non-copper 12 16 22
Source: Comtrade/WITS, WDI and CSO data
-
3,000
6,000
9,000
0
2,000
4,000
6,000
8,000
2003 2004 2005 2006 2007 2008 2009 2010 2011Exports, current USD (left)Exports, constant 2003 USD (left)Copper price (right)
(USD millions) (USD/mt)
Source: author's calculations based on Comtrade and UnctadStat data; copper price from World Bank
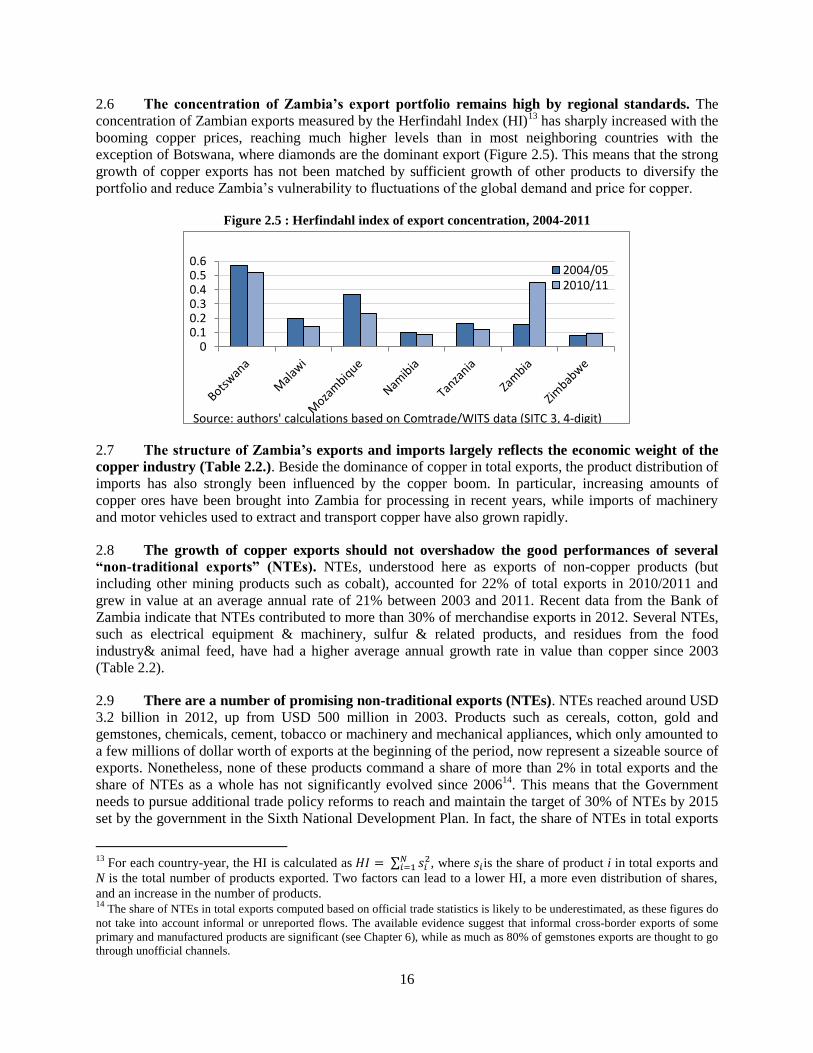
16
2.6 The concentration of Zambia’s export portfolio remains high by regional standards. The
concentration of Zambian exports measured by the Herfindahl Index (HI)13
has sharply increased with the
booming copper prices, reaching much higher levels than in most neighboring countries with the
exception of Botswana, where diamonds are the dominant export (Figure 2.5). This means that the strong
growth of copper exports has not been matched by sufficient growth of other products to diversify the
portfolio and reduce Zambia’s vulnerability to fluctuations of the global demand and price for copper.
Figure 2.5 : Herfindahl index of export concentration, 2004-2011
2.7 The structure of Zambia’s exports and imports largely reflects the economic weight of the
copper industry (Table 2.2.). Beside the dominance of copper in total exports, the product distribution of
imports has also strongly been influenced by the copper boom. In particular, increasing amounts of
copper ores have been brought into Zambia for processing in recent years, while imports of machinery
and motor vehicles used to extract and transport copper have also grown rapidly.
2.8 The growth of copper exports should not overshadow the good performances of several
“non-traditional exports” (NTEs). NTEs, understood here as exports of non-copper products (but
including other mining products such as cobalt), accounted for 22% of total exports in 2010/2011 and
grew in value at an average annual rate of 21% between 2003 and 2011. Recent data from the Bank of
Zambia indicate that NTEs contributed to more than 30% of merchandise exports in 2012. Several NTEs,
such as electrical equipment & machinery, sulfur & related products, and residues from the food
industry& animal feed, have had a higher average annual growth rate in value than copper since 2003
(Table 2.2).
2.9 There are a number of promising non-traditional exports (NTEs). NTEs reached around USD
3.2 billion in 2012, up from USD 500 million in 2003. Products such as cereals, cotton, gold and
gemstones, chemicals, cement, tobacco or machinery and mechanical appliances, which only amounted to
a few millions of dollar worth of exports at the beginning of the period, now represent a sizeable source of
exports. Nonetheless, none of these products command a share of more than 2% in total exports and the
share of NTEs as a whole has not significantly evolved since 200614
. This means that the Government
needs to pursue additional trade policy reforms to reach and maintain the target of 30% of NTEs by 2015
set by the government in the Sixth National Development Plan. In fact, the share of NTEs in total exports
13
For each country-year, the HI is calculated as ∑
, where is the share of product i in total exports and
N is the total number of products exported. Two factors can lead to a lower HI, a more even distribution of shares,
and an increase in the number of products. 14
The share of NTEs in total exports computed based on official trade statistics is likely to be underestimated, as these figures do
not take into account informal or unreported flows. The available evidence suggest that informal cross-border exports of some
primary and manufactured products are significant (see Chapter 6), while as much as 80% of gemstones exports are thought to go
through unofficial channels.
00.10.20.30.40.50.6
2004/052010/11
Source: authors' calculations based on Comtrade/WITS data (SITC 3, 4-digit)
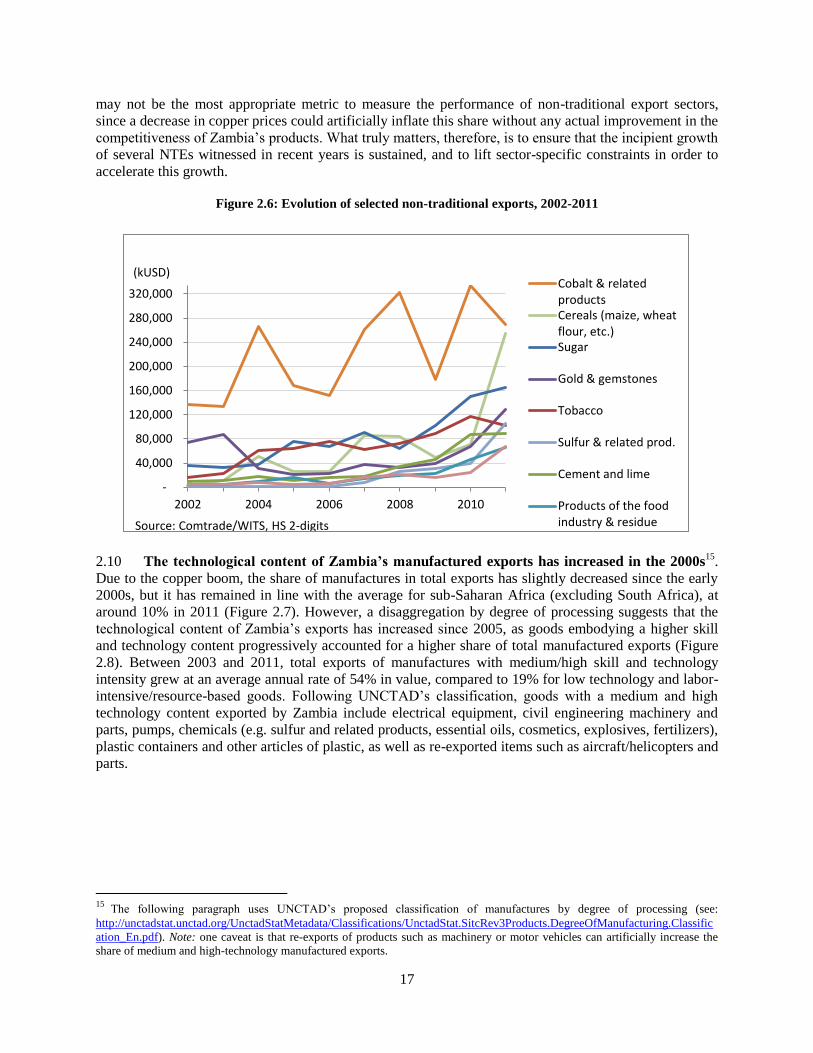
17
may not be the most appropriate metric to measure the performance of non-traditional export sectors,
since a decrease in copper prices could artificially inflate this share without any actual improvement in the
competitiveness of Zambia’s products. What truly matters, therefore, is to ensure that the incipient growth
of several NTEs witnessed in recent years is sustained, and to lift sector-specific constraints in order to
accelerate this growth.
Figure 2.6: Evolution of selected non-traditional exports, 2002-2011
2.10 The technological content of Zambia’s manufactured exports has increased in the 2000s15
.
Due to the copper boom, the share of manufactures in total exports has slightly decreased since the early
2000s, but it has remained in line with the average for sub-Saharan Africa (excluding South Africa), at
around 10% in 2011 (Figure 2.7). However, a disaggregation by degree of processing suggests that the
technological content of Zambia’s exports has increased since 2005, as goods embodying a higher skill
and technology content progressively accounted for a higher share of total manufactured exports (Figure
2.8). Between 2003 and 2011, total exports of manufactures with medium/high skill and technology
intensity grew at an average annual rate of 54% in value, compared to 19% for low technology and labor-
intensive/resource-based goods. Following UNCTAD’s classification, goods with a medium and high
technology content exported by Zambia include electrical equipment, civil engineering machinery and
parts, pumps, chemicals (e.g. sulfur and related products, essential oils, cosmetics, explosives, fertilizers),
plastic containers and other articles of plastic, as well as re-exported items such as aircraft/helicopters and
parts.
15
The following paragraph uses UNCTAD’s proposed classification of manufactures by degree of processing (see:
http://unctadstat.unctad.org/UnctadStatMetadata/Classifications/UnctadStat.SitcRev3Products.DegreeOfManufacturing.Classific
ation_En.pdf). Note: one caveat is that re-exports of products such as machinery or motor vehicles can artificially increase the
share of medium and high-technology manufactured exports.
-
40,000
80,000
120,000
160,000
200,000
240,000
280,000
320,000
2002 2004 2006 2008 2010
Cobalt & relatedproductsCereals (maize, wheatflour, etc.)Sugar
Gold & gemstones
Tobacco
Sulfur & related prod.
Cement and lime
Products of the foodindustry & residueSource: Comtrade/WITS, HS 2-digits
(kUSD)
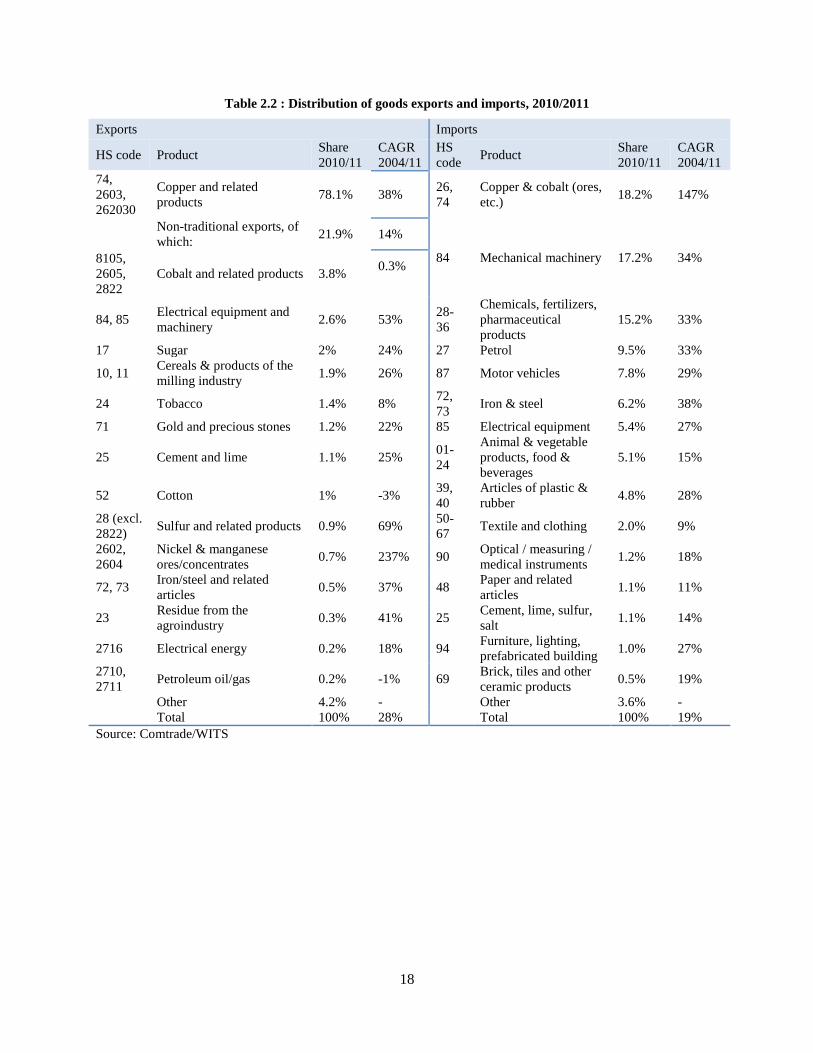
18
Table 2.2 : Distribution of goods exports and imports, 2010/2011
Exports Imports
HS code Product Share
2010/11
CAGR
2004/11
HS
code Product
Share
2010/11
CAGR
2004/11
74,
2603,
262030
Copper and related
products 78.1% 38%
26,
74
Copper & cobalt (ores,
etc.) 18.2% 147%
Non-traditional exports, of
which: 21.9% 14%
84 Mechanical machinery 17.2% 34% 8105,
2605,
2822
Cobalt and related products 3.8% 0.3%
84, 85 Electrical equipment and
machinery 2.6% 53%
28-
36
Chemicals, fertilizers,
pharmaceutical
products
15.2% 33%
17 Sugar 2% 24% 27 Petrol 9.5% 33%
10, 11 Cereals & products of the
milling industry 1.9% 26% 87 Motor vehicles 7.8% 29%
24 Tobacco 1.4% 8% 72,
73 Iron & steel 6.2% 38%
71 Gold and precious stones 1.2% 22% 85 Electrical equipment 5.4% 27%
25 Cement and lime 1.1% 25% 01-
24
Animal & vegetable
products, food &
beverages
5.1% 15%
52 Cotton 1% -3% 39,
40
Articles of plastic &
rubber 4.8% 28%
28 (excl.
2822) Sulfur and related products 0.9% 69%
50-
67 Textile and clothing 2.0% 9%
2602,
2604
Nickel & manganese
ores/concentrates 0.7% 237% 90
Optical / measuring /
medical instruments 1.2% 18%
72, 73 Iron/steel and related
articles 0.5% 37% 48
Paper and related
articles 1.1% 11%
23 Residue from the
agroindustry 0.3% 41% 25
Cement, lime, sulfur,
salt 1.1% 14%
2716 Electrical energy 0.2% 18% 94 Furniture, lighting,
prefabricated building 1.0% 27%
2710,
2711 Petroleum oil/gas 0.2% -1% 69
Brick, tiles and other
ceramic products 0.5% 19%
Other 4.2% - Other 3.6% -
Total 100% 28% Total 100% 19%
Source: Comtrade/WITS
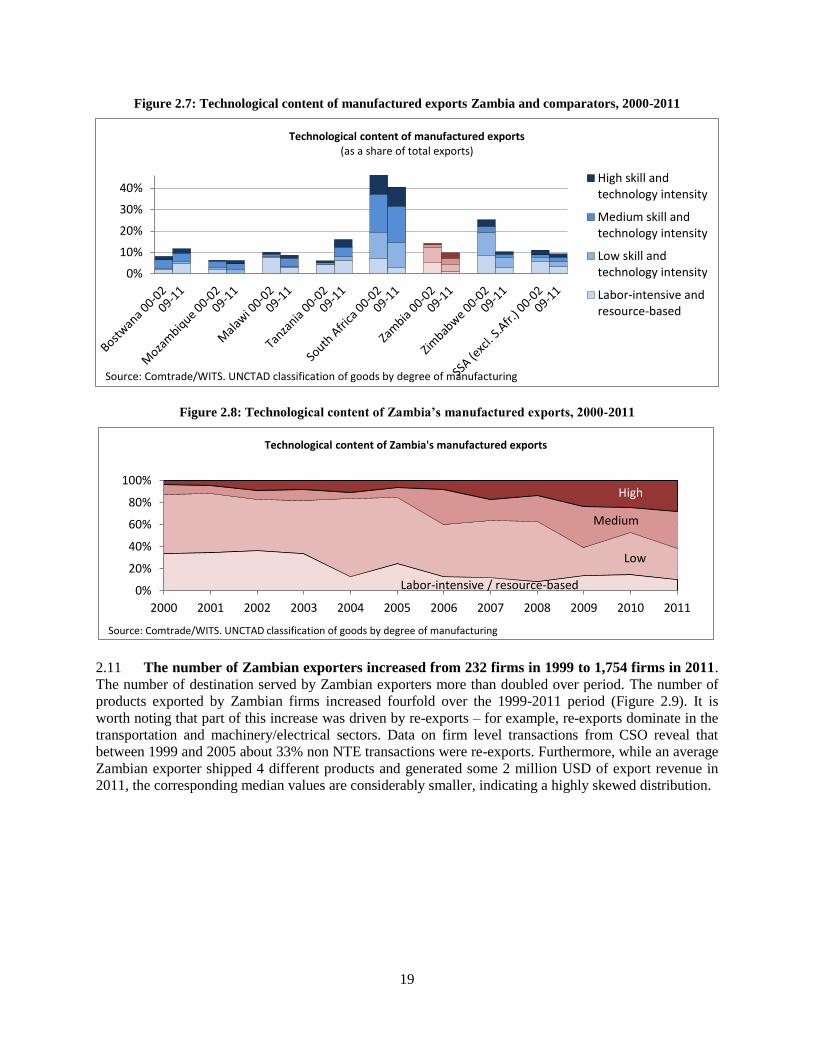
19
Figure 2.7: Technological content of manufactured exports Zambia and comparators, 2000-2011
Figure 2.8: Technological content of Zambia’s manufactured exports, 2000-2011
2.11 The number of Zambian exporters increased from 232 firms in 1999 to 1,754 firms in 2011.
The number of destination served by Zambian exporters more than doubled over period. The number of
products exported by Zambian firms increased fourfold over the 1999-2011 period (Figure 2.9). It is
worth noting that part of this increase was driven by re-exports – for example, re-exports dominate in the
transportation and machinery/electrical sectors. Data on firm level transactions from CSO reveal that
between 1999 and 2005 about 33% non NTE transactions were re-exports. Furthermore, while an average
Zambian exporter shipped 4 different products and generated some 2 million USD of export revenue in
2011, the corresponding median values are considerably smaller, indicating a highly skewed distribution.
0%
10%
20%
30%
40%
Technological content of manufactured exports (as a share of total exports)
High skill andtechnology intensity
Medium skill andtechnology intensity
Low skill andtechnology intensity
Labor-intensive andresource-based
Source: Comtrade/WITS. UNCTAD classification of goods by degree of manufacturing
0%
20%
40%
60%
80%
100%
2000 2001 2002 2003 2004 2005 2006 2007 2008 2009 2010 2011
Technological content of Zambia's manufactured exports
Source: Comtrade/WITS. UNCTAD classification of goods by degree of manufacturing
Low
Medium
High
Labor-intensive / resource-based
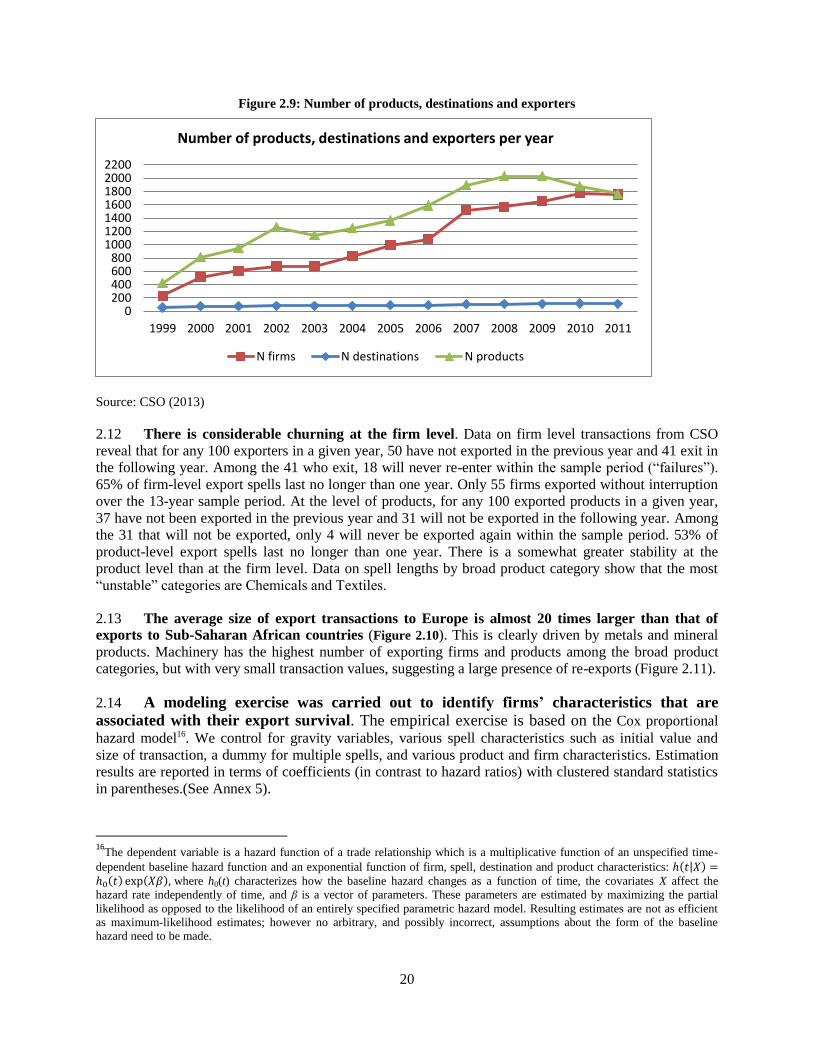
20
Figure 2.9: Number of products, destinations and exporters
Source: CSO (2013)
2.12 There is considerable churning at the firm level. Data on firm level transactions from CSO
reveal that for any 100 exporters in a given year, 50 have not exported in the previous year and 41 exit in
the following year. Among the 41 who exit, 18 will never re-enter within the sample period (“failures”).
65% of firm-level export spells last no longer than one year. Only 55 firms exported without interruption
over the 13-year sample period. At the level of products, for any 100 exported products in a given year,
37 have not been exported in the previous year and 31 will not be exported in the following year. Among
the 31 that will not be exported, only 4 will never be exported again within the sample period. 53% of
product-level export spells last no longer than one year. There is a somewhat greater stability at the
product level than at the firm level. Data on spell lengths by broad product category show that the most
“unstable” categories are Chemicals and Textiles.
2.13 The average size of export transactions to Europe is almost 20 times larger than that of
exports to Sub-Saharan African countries (Figure 2.10). This is clearly driven by metals and mineral
products. Machinery has the highest number of exporting firms and products among the broad product
categories, but with very small transaction values, suggesting a large presence of re-exports (Figure 2.11).
2.14 A modeling exercise was carried out to identify firms’ characteristics that are
associated with their export survival. The empirical exercise is based on the Cox proportional
hazard model16. We control for gravity variables, various spell characteristics such as initial value and
size of transaction, a dummy for multiple spells, and various product and firm characteristics. Estimation
results are reported in terms of coefficients (in contrast to hazard ratios) with clustered standard statistics
in parentheses.(See Annex 5).
16
The dependent variable is a hazard function of a trade relationship which is a multiplicative function of an unspecified time-
dependent baseline hazard function and an exponential function of firm, spell, destination and product characteristics: ( | ) ( ) ( ) where h0(t) characterizes how the baseline hazard changes as a function of time, the covariates X affect the
hazard rate independently of time, and β is a vector of parameters. These parameters are estimated by maximizing the partial
likelihood as opposed to the likelihood of an entirely specified parametric hazard model. Resulting estimates are not as efficient
as maximum-likelihood estimates; however no arbitrary, and possibly incorrect, assumptions about the form of the baseline
hazard need to be made.
0200400600800
1000120014001600180020002200
1999 2000 2001 2002 2003 2004 2005 2006 2007 2008 2009 2010 2011
Number of products, destinations and exporters per year
N firms N destinations N products
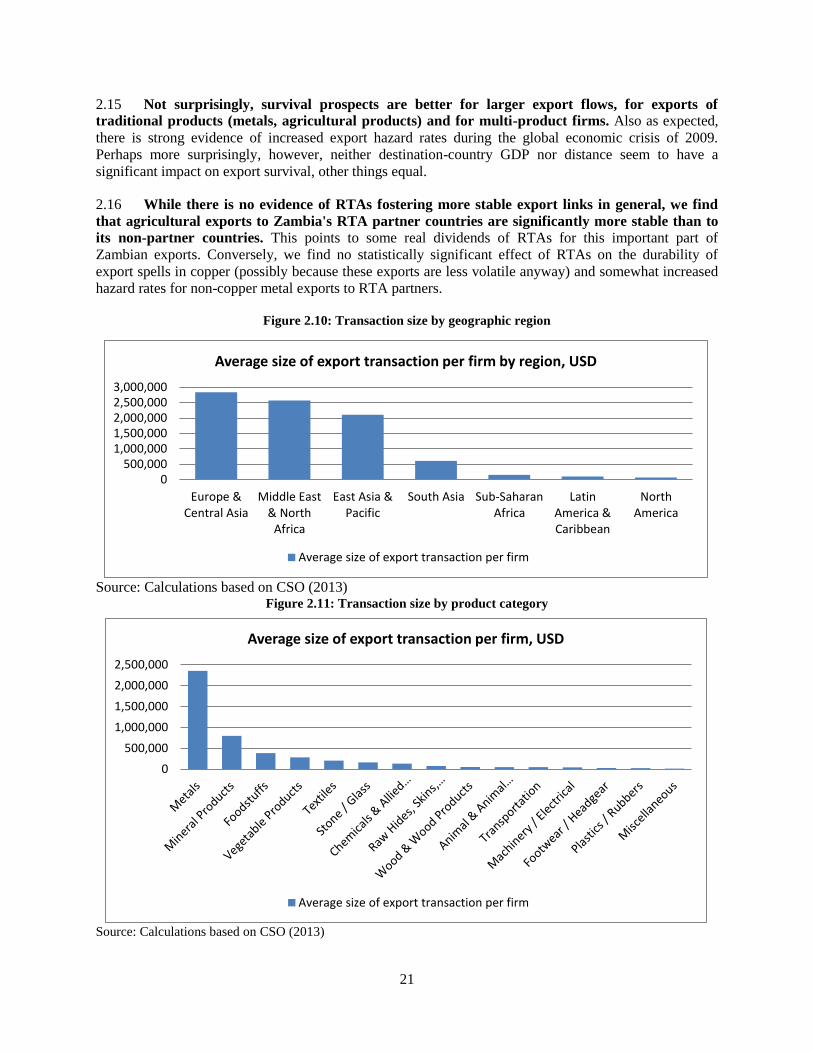
21
2.15 Not surprisingly, survival prospects are better for larger export flows, for exports of
traditional products (metals, agricultural products) and for multi-product firms. Also as expected,
there is strong evidence of increased export hazard rates during the global economic crisis of 2009.
Perhaps more surprisingly, however, neither destination-country GDP nor distance seem to have a
significant impact on export survival, other things equal.
2.16 While there is no evidence of RTAs fostering more stable export links in general, we find
that agricultural exports to Zambia's RTA partner countries are significantly more stable than to
its non-partner countries. This points to some real dividends of RTAs for this important part of
Zambian exports. Conversely, we find no statistically significant effect of RTAs on the durability of
export spells in copper (possibly because these exports are less volatile anyway) and somewhat increased
hazard rates for non-copper metal exports to RTA partners.
Figure 2.10: Transaction size by geographic region
Source: Calculations based on CSO (2013)
Figure 2.11: Transaction size by product category
Source: Calculations based on CSO (2013)
0500,000
1,000,0001,500,0002,000,0002,500,0003,000,000
Europe &Central Asia
Middle East& North
Africa
East Asia &Pacific
South Asia Sub-SaharanAfrica
LatinAmerica &Caribbean
NorthAmerica
Average size of export transaction per firm by region, USD
Average size of export transaction per firm
0
500,000
1,000,000
1,500,000
2,000,000
2,500,000
Average size of export transaction per firm, USD
Average size of export transaction per firm
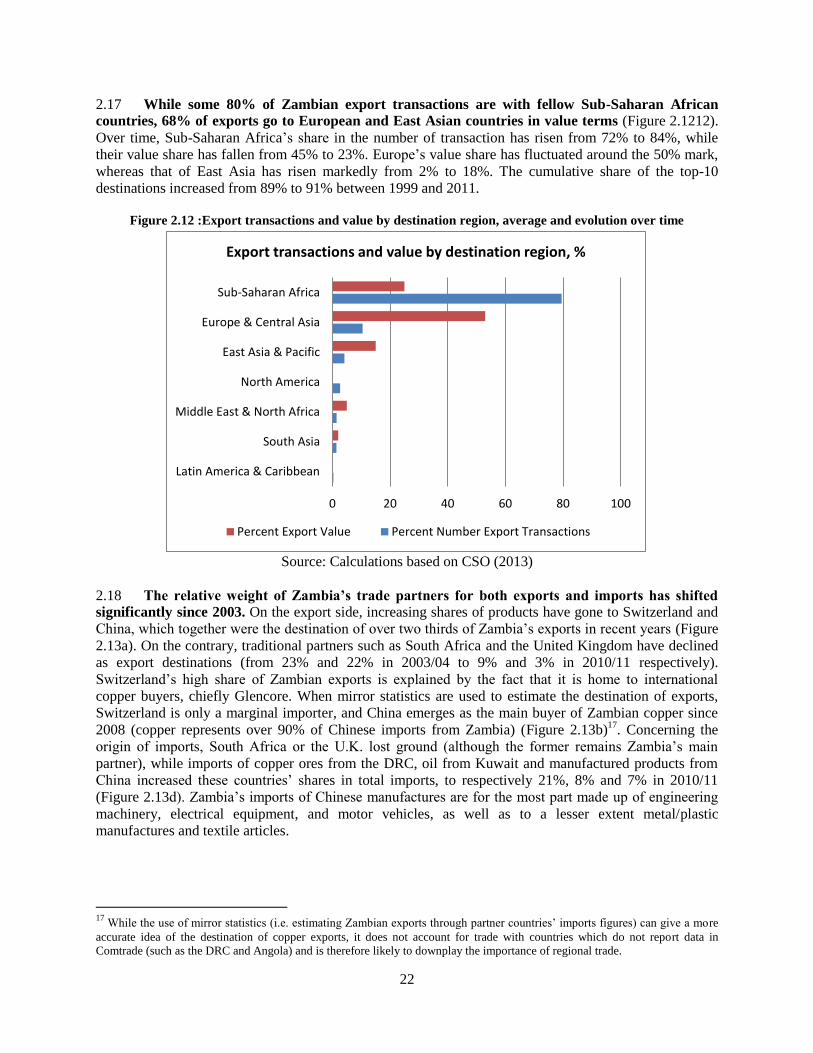
22
2.17 While some 80% of Zambian export transactions are with fellow Sub-Saharan African
countries, 68% of exports go to European and East Asian countries in value terms (Figure 2.1212).
Over time, Sub-Saharan Africa’s share in the number of transaction has risen from 72% to 84%, while
their value share has fallen from 45% to 23%. Europe’s value share has fluctuated around the 50% mark,
whereas that of East Asia has risen markedly from 2% to 18%. The cumulative share of the top-10
destinations increased from 89% to 91% between 1999 and 2011.
Figure 2.12 :Export transactions and value by destination region, average and evolution over time
Source: Calculations based on CSO (2013)
2.18 The relative weight of Zambia’s trade partners for both exports and imports has shifted
significantly since 2003. On the export side, increasing shares of products have gone to Switzerland and
China, which together were the destination of over two thirds of Zambia’s exports in recent years (Figure
2.13a). On the contrary, traditional partners such as South Africa and the United Kingdom have declined
as export destinations (from 23% and 22% in 2003/04 to 9% and 3% in 2010/11 respectively).
Switzerland’s high share of Zambian exports is explained by the fact that it is home to international
copper buyers, chiefly Glencore. When mirror statistics are used to estimate the destination of exports,
Switzerland is only a marginal importer, and China emerges as the main buyer of Zambian copper since
2008 (copper represents over 90% of Chinese imports from Zambia) (Figure 2.13b)17
. Concerning the
origin of imports, South Africa or the U.K. lost ground (although the former remains Zambia’s main
partner), while imports of copper ores from the DRC, oil from Kuwait and manufactured products from
China increased these countries’ shares in total imports, to respectively 21%, 8% and 7% in 2010/11
(Figure 2.13d). Zambia’s imports of Chinese manufactures are for the most part made up of engineering
machinery, electrical equipment, and motor vehicles, as well as to a lesser extent metal/plastic
manufactures and textile articles.
17
While the use of mirror statistics (i.e. estimating Zambian exports through partner countries’ imports figures) can give a more
accurate idea of the destination of copper exports, it does not account for trade with countries which do not report data in
Comtrade (such as the DRC and Angola) and is therefore likely to downplay the importance of regional trade.
0 20 40 60 80 100
Latin America & Caribbean
South Asia
Middle East & North Africa
North America
East Asia & Pacific
Europe & Central Asia
Sub-Saharan Africa
Export transactions and value by destination region, %
Percent Export Value Percent Number Export Transactions
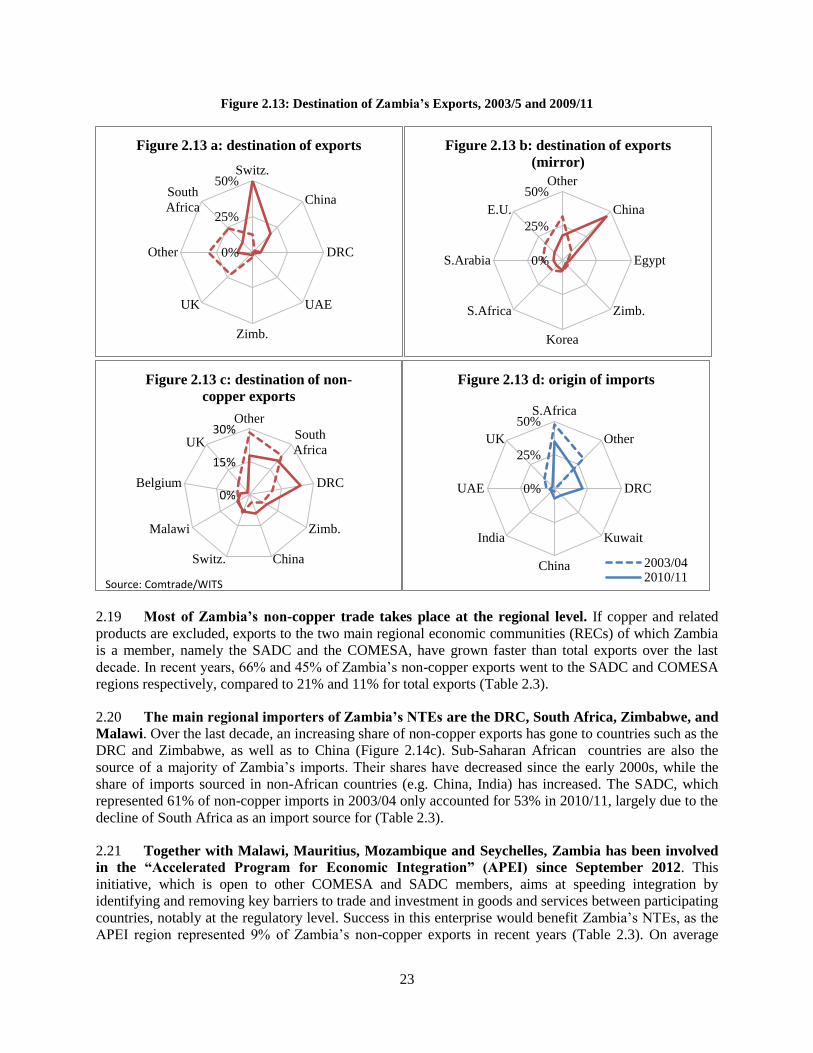
23
Figure 2.13: Destination of Zambia’s Exports, 2003/5 and 2009/11
2.19 Most of Zambia’s non-copper trade takes place at the regional level. If copper and related
products are excluded, exports to the two main regional economic communities (RECs) of which Zambia
is a member, namely the SADC and the COMESA, have grown faster than total exports over the last
decade. In recent years, 66% and 45% of Zambia’s non-copper exports went to the SADC and COMESA
regions respectively, compared to 21% and 11% for total exports (Table 2.3).
2.20 The main regional importers of Zambia’s NTEs are the DRC, South Africa, Zimbabwe, and
Malawi. Over the last decade, an increasing share of non-copper exports has gone to countries such as the
DRC and Zimbabwe, as well as to China (Figure 2.14c). Sub-Saharan African countries are also the
source of a majority of Zambia’s imports. Their shares have decreased since the early 2000s, while the
share of imports sourced in non-African countries (e.g. China, India) has increased. The SADC, which
represented 61% of non-copper imports in 2003/04 only accounted for 53% in 2010/11, largely due to the
decline of South Africa as an import source for (Table 2.3).
2.21 Together with Malawi, Mauritius, Mozambique and Seychelles, Zambia has been involved
in the “Accelerated Program for Economic Integration” (APEI) since September 2012. This
initiative, which is open to other COMESA and SADC members, aims at speeding integration by
identifying and removing key barriers to trade and investment in goods and services between participating
countries, notably at the regulatory level. Success in this enterprise would benefit Zambia’s NTEs, as the
APEI region represented 9% of Zambia’s non-copper exports in recent years (Table 2.3). On average
0%
25%
50%Switz.
China
DRC
UAE
Zimb.
UK
Other
South
Africa
Figure 2.13 a: destination of exports
0%
25%
50%Other
China
Egypt
Zimb.
Korea
S.Africa
S.Arabia
E.U.
Figure 2.13 b: destination of exports
(mirror)
0%
15%
30%Other
South
Africa
DRC
Zimb.
ChinaSwitz.
Malawi
Belgium
UK
Figure 2.13 c: destination of non-
copper exports
Source: Comtrade/WITS
0%
25%
50%S.Africa
Other
DRC
Kuwait
China
India
UAE
UK
Figure 2.13 d: origin of imports
2003/042010/11
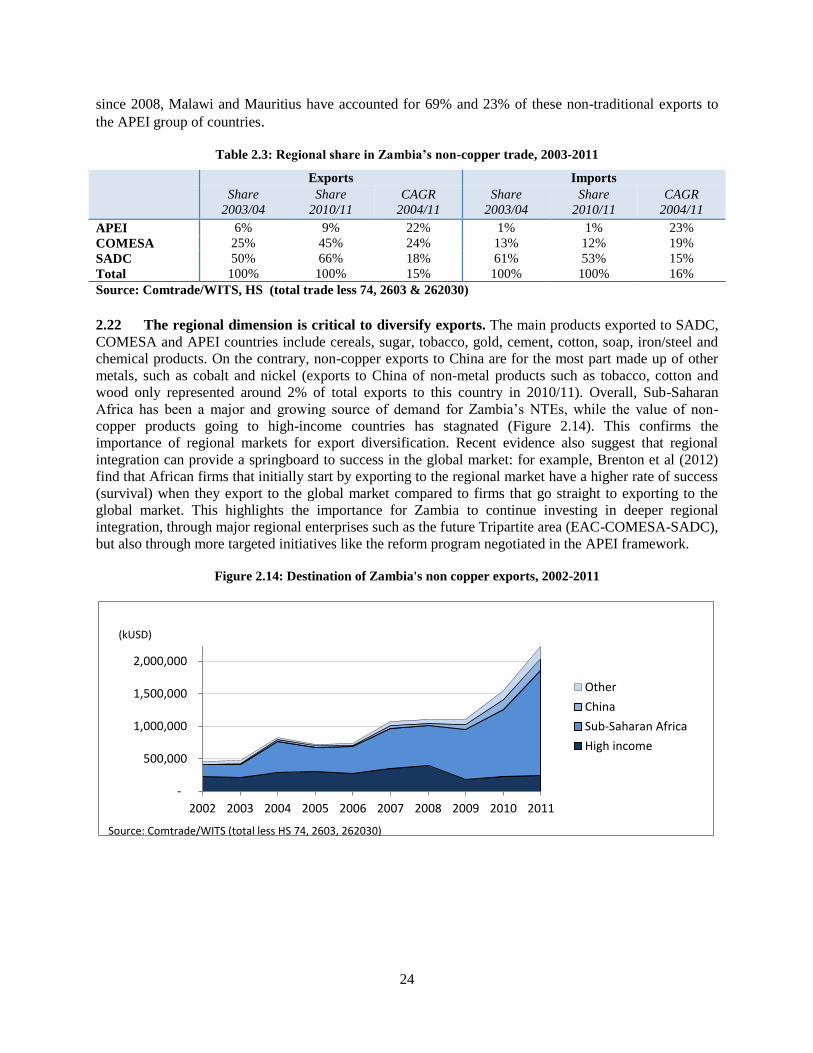
24
since 2008, Malawi and Mauritius have accounted for 69% and 23% of these non-traditional exports to
the APEI group of countries.
Table 2.3: Regional share in Zambia’s non-copper trade, 2003-2011
Exports Imports
Share
2003/04
Share
2010/11
CAGR
2004/11
Share
2003/04
Share
2010/11
CAGR
2004/11
APEI 6% 9% 22% 1% 1% 23%
COMESA 25% 45% 24% 13% 12% 19%
SADC 50% 66% 18% 61% 53% 15%
Total 100% 100% 15% 100% 100% 16%
Source: Comtrade/WITS, HS (total trade less 74, 2603 & 262030)
2.22 The regional dimension is critical to diversify exports. The main products exported to SADC,
COMESA and APEI countries include cereals, sugar, tobacco, gold, cement, cotton, soap, iron/steel and
chemical products. On the contrary, non-copper exports to China are for the most part made up of other
metals, such as cobalt and nickel (exports to China of non-metal products such as tobacco, cotton and
wood only represented around 2% of total exports to this country in 2010/11). Overall, Sub-Saharan
Africa has been a major and growing source of demand for Zambia’s NTEs, while the value of non-
copper products going to high-income countries has stagnated (Figure 2.14). This confirms the
importance of regional markets for export diversification. Recent evidence also suggest that regional
integration can provide a springboard to success in the global market: for example, Brenton et al (2012)
find that African firms that initially start by exporting to the regional market have a higher rate of success
(survival) when they export to the global market compared to firms that go straight to exporting to the
global market. This highlights the importance for Zambia to continue investing in deeper regional
integration, through major regional enterprises such as the future Tripartite area (EAC-COMESA-SADC),
but also through more targeted initiatives like the reform program negotiated in the APEI framework.
Figure 2.14: Destination of Zambia's non copper exports, 2002-2011
-
500,000
1,000,000
1,500,000
2,000,000
2002 2003 2004 2005 2006 2007 2008 2009 2010 2011
Other
China
Sub-Saharan Africa
High income
Source: Comtrade/WITS (total less HS 74, 2603, 262030)
(kUSD)
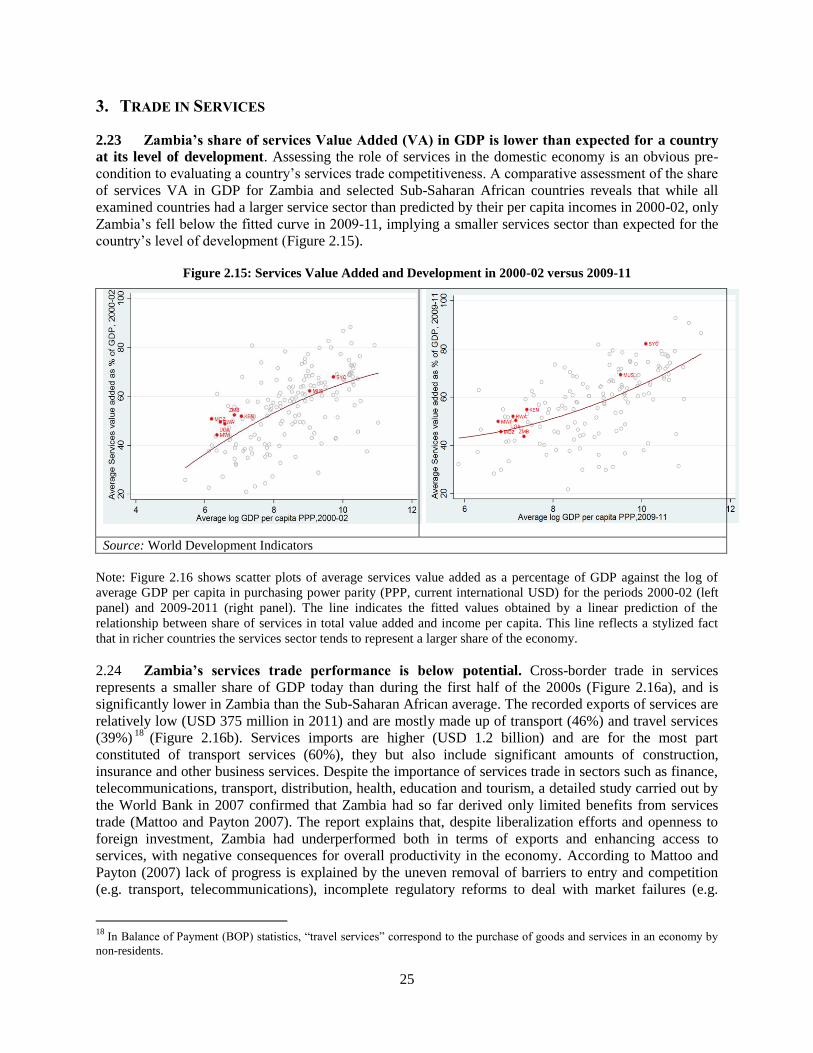
25
3. TRADE IN SERVICES
2.23 Zambia’s share of services Value Added (VA) in GDP is lower than expected for a country
at its level of development. Assessing the role of services in the domestic economy is an obvious pre-
condition to evaluating a country’s services trade competitiveness. A comparative assessment of the share
of services VA in GDP for Zambia and selected Sub-Saharan African countries reveals that while all
examined countries had a larger service sector than predicted by their per capita incomes in 2000-02, only
Zambia’s fell below the fitted curve in 2009-11, implying a smaller services sector than expected for the
country’s level of development (Figure 2.15).
Figure 2.15: Services Value Added and Development in 2000-02 versus 2009-11
Source: World Development Indicators
Note: Figure 2.16 shows scatter plots of average services value added as a percentage of GDP against the log of
average GDP per capita in purchasing power parity (PPP, current international USD) for the periods 2000-02 (left
panel) and 2009-2011 (right panel). The line indicates the fitted values obtained by a linear prediction of the
relationship between share of services in total value added and income per capita. This line reflects a stylized fact
that in richer countries the services sector tends to represent a larger share of the economy.
2.24 Zambia’s services trade performance is below potential. Cross-border trade in services
represents a smaller share of GDP today than during the first half of the 2000s (Figure 2.16a), and is
significantly lower in Zambia than the Sub-Saharan African average. The recorded exports of services are
relatively low (USD 375 million in 2011) and are mostly made up of transport (46%) and travel services
(39%)18
(Figure 2.16b). Services imports are higher (USD 1.2 billion) and are for the most part
constituted of transport services (60%), they but also include significant amounts of construction,
insurance and other business services. Despite the importance of services trade in sectors such as finance,
telecommunications, transport, distribution, health, education and tourism, a detailed study carried out by
the World Bank in 2007 confirmed that Zambia had so far derived only limited benefits from services
trade (Mattoo and Payton 2007). The report explains that, despite liberalization efforts and openness to
foreign investment, Zambia had underperformed both in terms of exports and enhancing access to
services, with negative consequences for overall productivity in the economy. According to Mattoo and
Payton (2007) lack of progress is explained by the uneven removal of barriers to entry and competition
(e.g. transport, telecommunications), incomplete regulatory reforms to deal with market failures (e.g.
18
In Balance of Payment (BOP) statistics, “travel services” correspond to the purchase of goods and services in an economy by
non-residents.
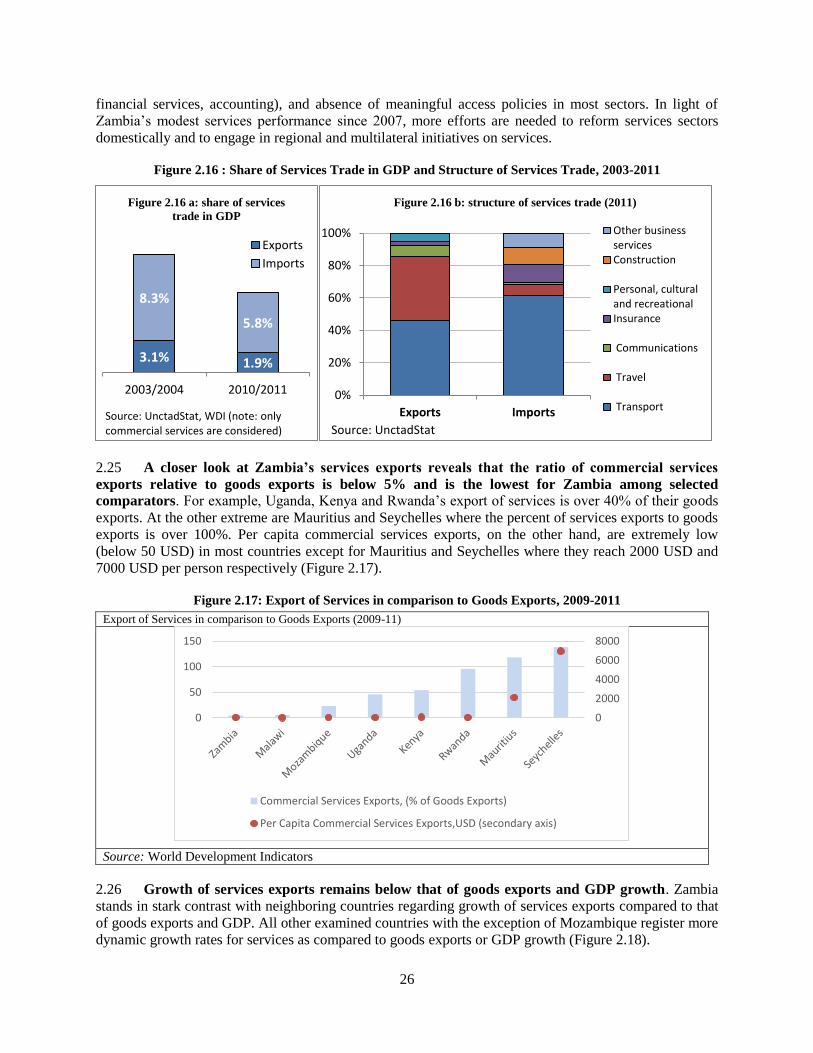
26
financial services, accounting), and absence of meaningful access policies in most sectors. In light of
Zambia’s modest services performance since 2007, more efforts are needed to reform services sectors
domestically and to engage in regional and multilateral initiatives on services.
Figure 2.16 : Share of Services Trade in GDP and Structure of Services Trade, 2003-2011
2.25 A closer look at Zambia’s services exports reveals that the ratio of commercial services
exports relative to goods exports is below 5% and is the lowest for Zambia among selected
comparators. For example, Uganda, Kenya and Rwanda’s export of services is over 40% of their goods
exports. At the other extreme are Mauritius and Seychelles where the percent of services exports to goods
exports is over 100%. Per capita commercial services exports, on the other hand, are extremely low
(below 50 USD) in most countries except for Mauritius and Seychelles where they reach 2000 USD and
7000 USD per person respectively (Figure 2.17).
Figure 2.17: Export of Services in comparison to Goods Exports, 2009-2011
Export of Services in comparison to Goods Exports (2009-11)
Source: World Development Indicators
2.26 Growth of services exports remains below that of goods exports and GDP growth. Zambia
stands in stark contrast with neighboring countries regarding growth of services exports compared to that
of goods exports and GDP. All other examined countries with the exception of Mozambique register more
dynamic growth rates for services as compared to goods exports or GDP growth (Figure 2.18).
3.1% 1.9%
8.3%
5.8%
2003/2004 2010/2011
Figure 2.16 a: share of services
trade in GDP
Exports
Imports
Source: UnctadStat, WDI (note: only commercial services are considered)
0%
20%
40%
60%
80%
100%
Exports Imports
Figure 2.16 b: structure of services trade (2011)
Other businessservicesConstruction
Personal, culturaland recreationalInsurance
Communications
Travel
Transport
Source: UnctadStat
0
2000
4000
6000
8000
0
50
100
150
Commercial Services Exports, (% of Goods Exports)
Per Capita Commercial Services Exports,USD (secondary axis)
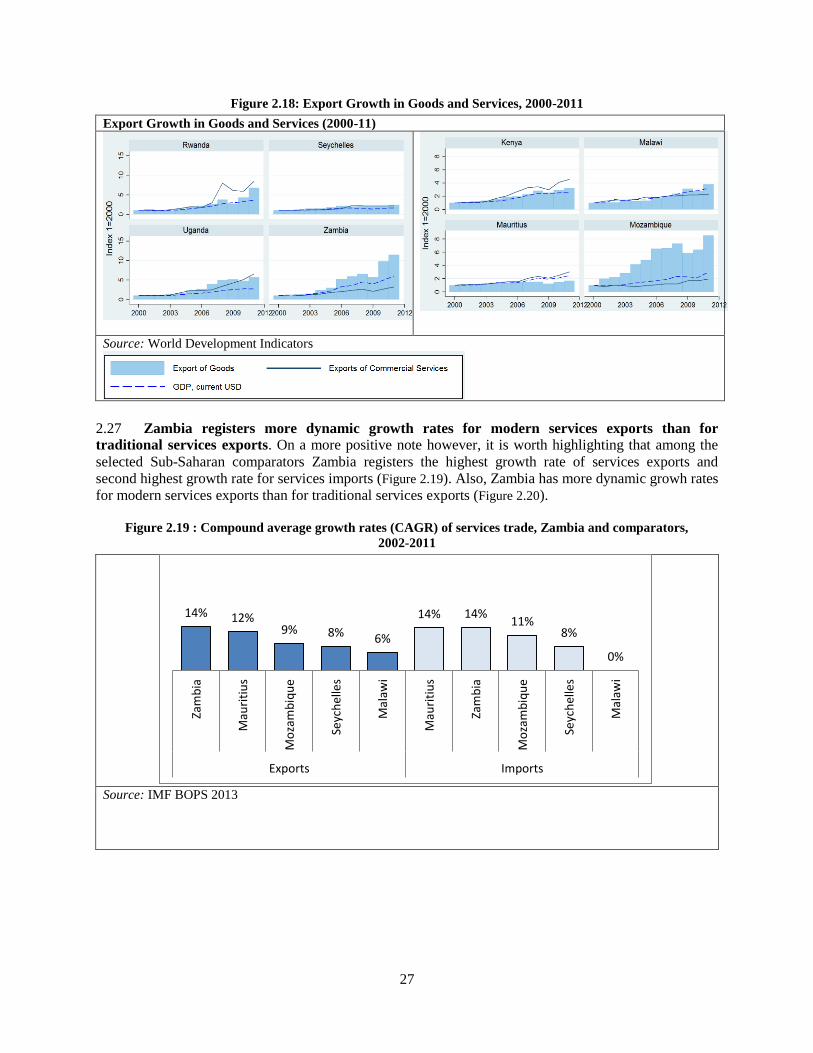
27
Figure 2.18: Export Growth in Goods and Services, 2000-2011
Export Growth in Goods and Services (2000-11)
Source: World Development Indicators
2.27 Zambia registers more dynamic growth rates for modern services exports than for
traditional services exports. On a more positive note however, it is worth highlighting that among the
selected Sub-Saharan comparators Zambia registers the highest growth rate of services exports and
second highest growth rate for services imports (Figure 2.19). Also, Zambia has more dynamic growh rates
for modern services exports than for traditional services exports (Figure 2.20).
Figure 2.19 : Compound average growth rates (CAGR) of services trade, Zambia and comparators,
2002-2011
Source: IMF BOPS 2013
14% 12% 9% 8% 6%
14% 14% 11%
8%
0%
Zam
bia
Mau
riti
us
Mo
zam
biq
ue
Seyc
hel
les
Mal
awi
Mau
riti
us
Zam
bia
Mo
zam
biq
ue
Seyc
hel
les
Mal
awi
Exports Imports
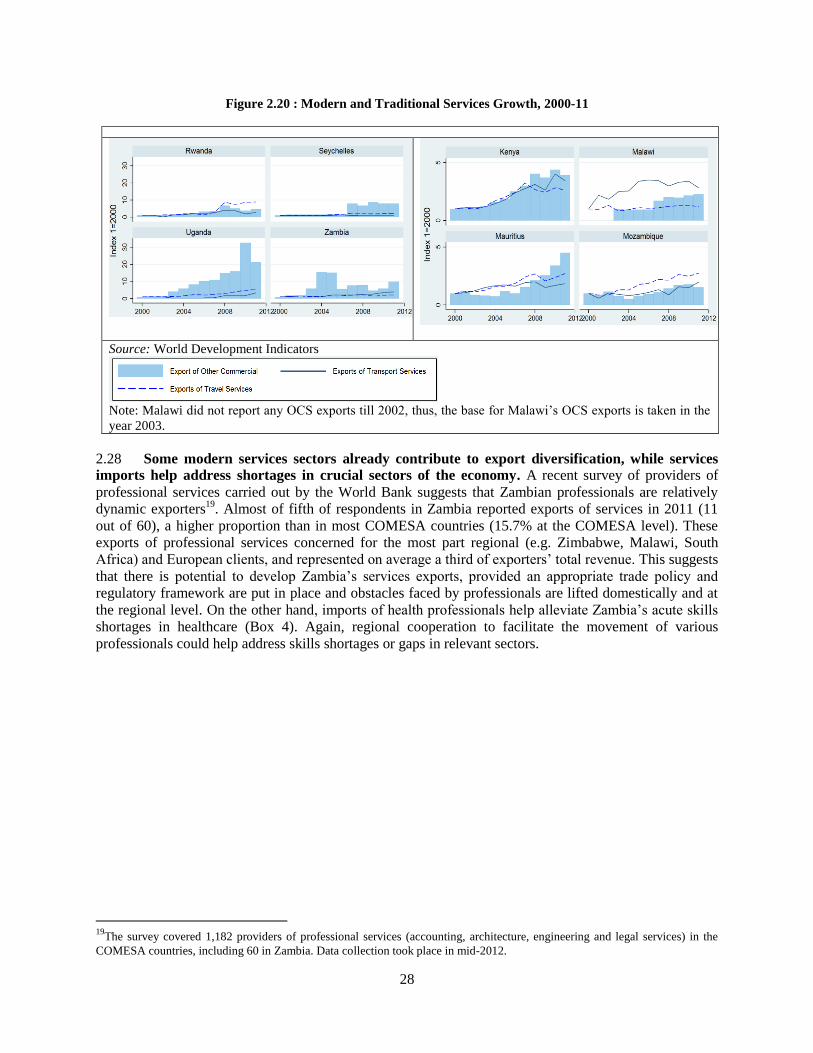
28
Figure 2.20 : Modern and Traditional Services Growth, 2000-11
Source: World Development Indicators
Note: Malawi did not report any OCS exports till 2002, thus, the base for Malawi’s OCS exports is taken in the
year 2003.
2.28 Some modern services sectors already contribute to export diversification, while services
imports help address shortages in crucial sectors of the economy. A recent survey of providers of
professional services carried out by the World Bank suggests that Zambian professionals are relatively
dynamic exporters19
. Almost of fifth of respondents in Zambia reported exports of services in 2011 (11
out of 60), a higher proportion than in most COMESA countries (15.7% at the COMESA level). These
exports of professional services concerned for the most part regional (e.g. Zimbabwe, Malawi, South
Africa) and European clients, and represented on average a third of exporters’ total revenue. This suggests
that there is potential to develop Zambia’s services exports, provided an appropriate trade policy and
regulatory framework are put in place and obstacles faced by professionals are lifted domestically and at
the regional level. On the other hand, imports of health professionals help alleviate Zambia’s acute skills
shortages in healthcare (Box 4). Again, regional cooperation to facilitate the movement of various
professionals could help address skills shortages or gaps in relevant sectors.
19
The survey covered 1,182 providers of professional services (accounting, architecture, engineering and legal services) in the
COMESA countries, including 60 in Zambia. Data collection took place in mid-2012.
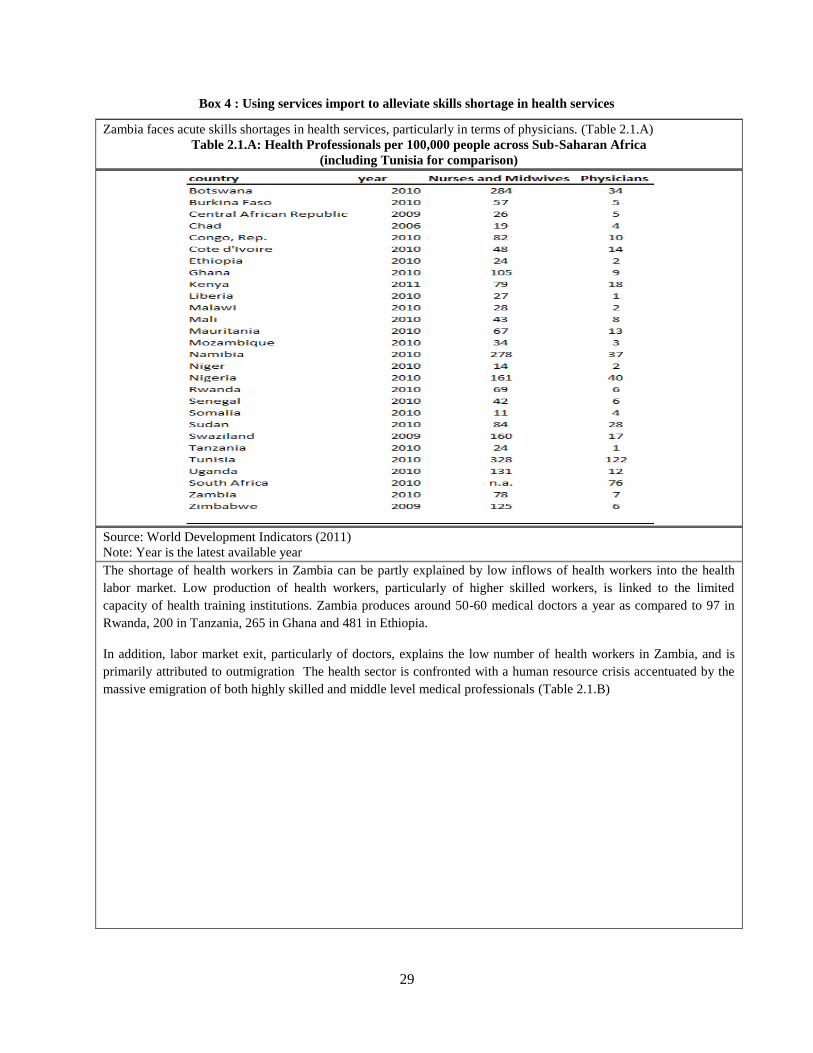
29
Box 4 : Using services import to alleviate skills shortage in health services
Zambia faces acute skills shortages in health services, particularly in terms of physicians. (Table 2.1.A)
Table 2.1.A: Health Professionals per 100,000 people across Sub-Saharan Africa
(including Tunisia for comparison)
Source: World Development Indicators (2011)
Note: Year is the latest available year The shortage of health workers in Zambia can be partly explained by low inflows of health workers into the health
labor market. Low production of health workers, particularly of higher skilled workers, is linked to the limited
capacity of health training institutions. Zambia produces around 50-60 medical doctors a year as compared to 97 in
Rwanda, 200 in Tanzania, 265 in Ghana and 481 in Ethiopia.
In addition, labor market exit, particularly of doctors, explains the low number of health workers in Zambia, and is
primarily attributed to outmigration The health sector is confronted with a human resource crisis accentuated by the
massive emigration of both highly skilled and middle level medical professionals (Table 2.1.B)
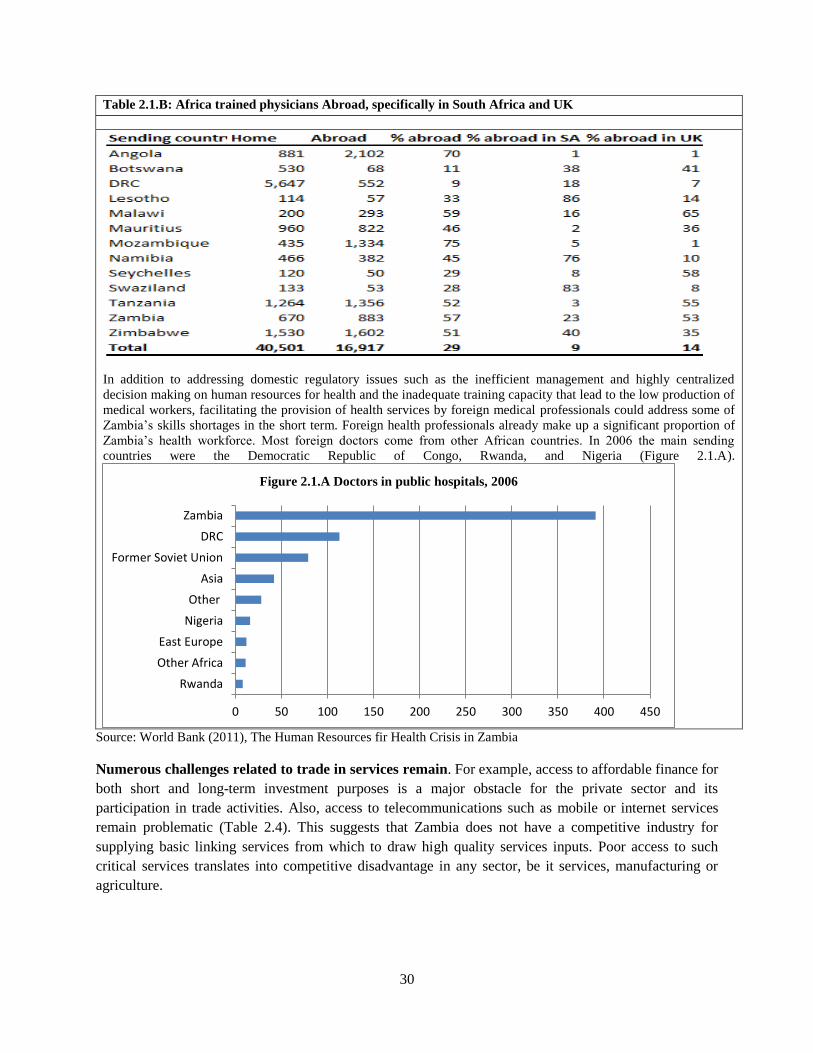
30
Table 2.1.B: Africa trained physicians Abroad, specifically in South Africa and UK
In addition to addressing domestic regulatory issues such as the inefficient management and highly centralized
decision making on human resources for health and the inadequate training capacity that lead to the low production of
medical workers, facilitating the provision of health services by foreign medical professionals could address some of
Zambia’s skills shortages in the short term. Foreign health professionals already make up a significant proportion of
Zambia’s health workforce. Most foreign doctors come from other African countries. In 2006 the main sending
countries were the Democratic Republic of Congo, Rwanda, and Nigeria (Figure 2.1.A).
Source: World Bank (2011), The Human Resources fir Health Crisis in Zambia
Numerous challenges related to trade in services remain. For example, access to affordable finance for
both short and long-term investment purposes is a major obstacle for the private sector and its
participation in trade activities. Also, access to telecommunications such as mobile or internet services
remain problematic (Table 2.4). This suggests that Zambia does not have a competitive industry for
supplying basic linking services from which to draw high quality services inputs. Poor access to such
critical services translates into competitive disadvantage in any sector, be it services, manufacturing or
agriculture.
0 50 100 150 200 250 300 350 400 450
Rwanda
Other Africa
East Europe
Nigeria
Other
Asia
Former Soviet Union
DRC
Zambia
Figure 2.1.A Doctors in public hospitals, 2006
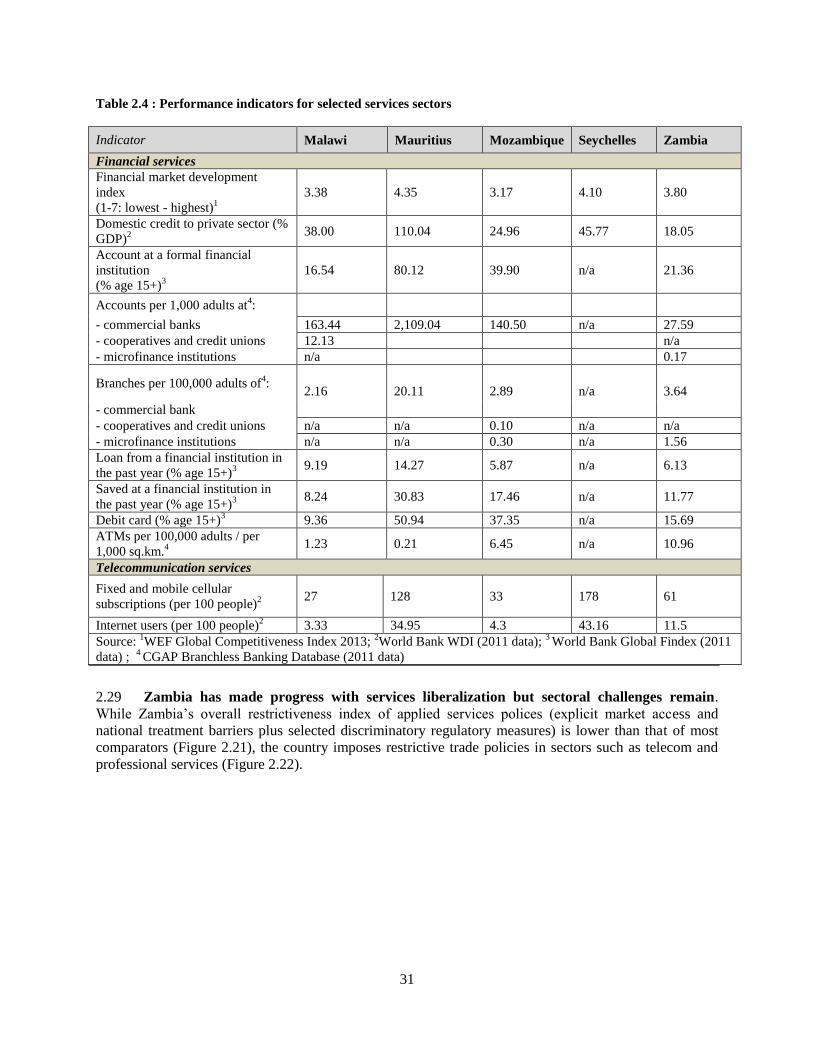
31
Table 2.4 : Performance indicators for selected services sectors
Indicator Malawi Mauritius Mozambique Seychelles Zambia
Financial services
Financial market development
index
(1-7: lowest - highest)1
3.38 4.35 3.17 4.10 3.80
Domestic credit to private sector (%
GDP)2
38.00 110.04 24.96 45.77 18.05
Account at a formal financial
institution
(% age 15+)3
16.54 80.12 39.90 n/a 21.36
Accounts per 1,000 adults at4:
- commercial banks 163.44 2,109.04 140.50 n/a 27.59
- cooperatives and credit unions 12.13 n/a
- microfinance institutions n/a 0.17
Branches per 100,000 adults of4:
2.16 20.11 2.89
n/a
3.64
- commercial bank
- cooperatives and credit unions n/a n/a 0.10 n/a n/a
- microfinance institutions n/a n/a 0.30 n/a 1.56
Loan from a financial institution in
the past year (% age 15+)3
9.19 14.27 5.87 n/a 6.13
Saved at a financial institution in
the past year (% age 15+)3
8.24 30.83 17.46 n/a 11.77
Debit card (% age 15+)3 9.36 50.94 37.35 n/a 15.69
ATMs per 100,000 adults / per
1,000 sq.km.4
1.23 0.21 6.45 n/a 10.96
Telecommunication services
Fixed and mobile cellular
subscriptions (per 100 people)2
27 128 33 178 61
Internet users (per 100 people)2 3.33 34.95 4.3 43.16 11.5
Source: 1WEF Global Competitiveness Index 2013;
2World Bank WDI (2011 data);
3 World Bank Global Findex (2011
data) ; 4 CGAP Branchless Banking Database (2011 data)
2.29 Zambia has made progress with services liberalization but sectoral challenges remain.
While Zambia’s overall restrictiveness index of applied services polices (explicit market access and
national treatment barriers plus selected discriminatory regulatory measures) is lower than that of most
comparators (Figure 2.21), the country imposes restrictive trade policies in sectors such as telecom and
professional services (Figure 2.22).
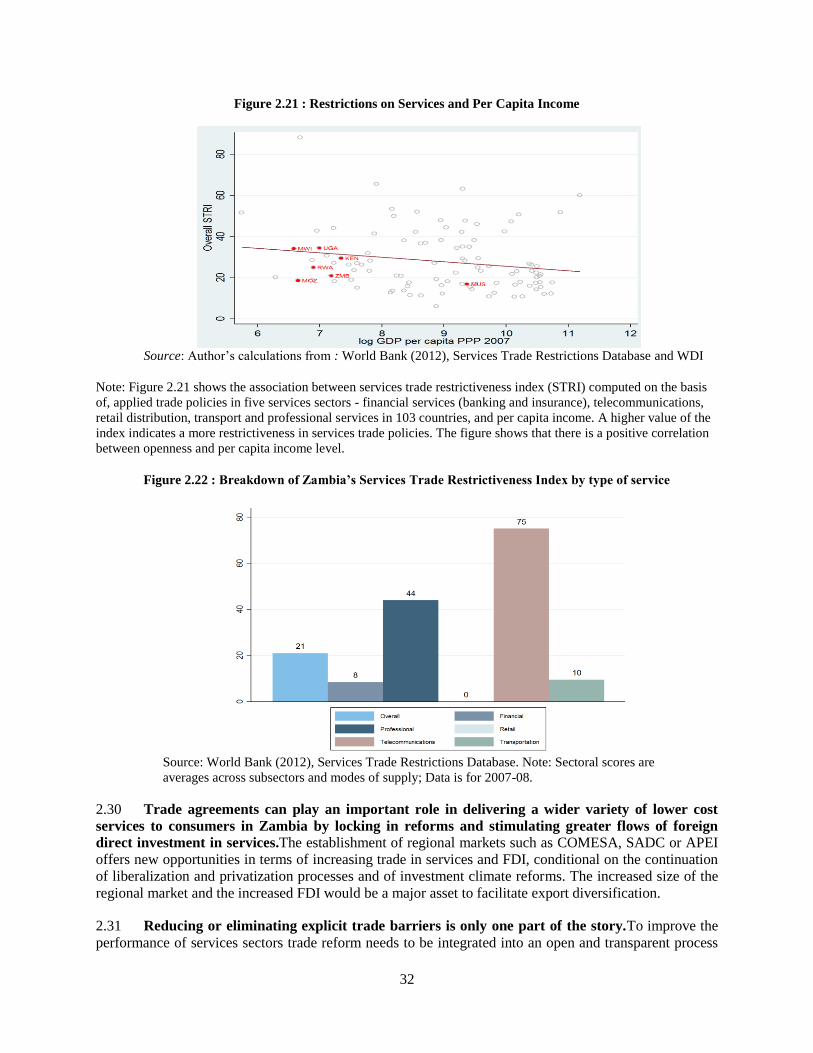
32
Figure 2.21 : Restrictions on Services and Per Capita Income
Source: Author’s calculations from : World Bank (2012), Services Trade Restrictions Database and WDI
Note: Figure 2.21 shows the association between services trade restrictiveness index (STRI) computed on the basis
of, applied trade policies in five services sectors - financial services (banking and insurance), telecommunications,
retail distribution, transport and professional services in 103 countries, and per capita income. A higher value of the
index indicates a more restrictiveness in services trade policies. The figure shows that there is a positive correlation
between openness and per capita income level.
Figure 2.22 : Breakdown of Zambia’s Services Trade Restrictiveness Index by type of service
Source: World Bank (2012), Services Trade Restrictions Database. Note: Sectoral scores are
averages across subsectors and modes of supply; Data is for 2007-08.
2.30 Trade agreements can play an important role in delivering a wider variety of lower cost
services to consumers in Zambia by locking in reforms and stimulating greater flows of foreign
direct investment in services.The establishment of regional markets such as COMESA, SADC or APEI
offers new opportunities in terms of increasing trade in services and FDI, conditional on the continuation
of liberalization and privatization processes and of investment climate reforms. The increased size of the
regional market and the increased FDI would be a major asset to facilitate export diversification.
2.31 Reducing or eliminating explicit trade barriers is only one part of the story.To improve the
performance of services sectors trade reform needs to be integrated into an open and transparent process
33
of regulatory reform, in which decisions on the nature and pace of reform are informed by careful analysis
and an understanding of good practices. For example, it is important to ensure that the regulatory
frameworks in place do not restrict directly or indirectly competition in service markets and slow down
their expansion in spite of the extensive liberalization measures. An equally important problem is the
absence of regulation, which can create a legal vacuum that actually constrains business growth and
allows many opportunities for unfair competition and corruption.
2.32 A key challenge of services reforms relate to the coordination of regulatory reform with
liberalization. Indeed, coordinating regulatory reform with liberalization of trade in services is the main
recurring challenge raised by Zambian officials in several services talks. Liberalizing services trade is
typically more complex than liberalizing goods trade and can require considerable technical capacity. The
ability to implement such a reform process is constrained by limited capacity within government and the
private sector.
4. FOREIGN DIRECT INVESTMENT
2.33 Zambia has attracted increasing amounts of foreign investments in recent years, comparing
favorably with neighboring economies. Zambia’s foreign direct investment (FDI) regime is one of the
most open in Africa (see for example OECD, 2012 Investment Policy Review Zambia 2012); as a result
the country has received a significant inflow of FDI in recent years. According to UNCTAD data,
cumulated net inflows of FDI in Zambia jumped from USD 2 billion between 2002 and 2006 to USD 6.7
billion in 2007-2011. Annual FDI inflows have fluctuated but have followed an upward trend, and have
grown at a faster rate than both goods and services trade since the second half of the 2000s. FDI inflows
were severely affected by the global economic downturn in 2008/09 but have picked up since then, and
the share of annual FDI inflows in GDP reached over 10% of GDP on average in 2010/2011(Table 2.5).
OECD (2012) indicates that between 2000 and 2010 foreign investments generated about 115,000 new
jobs in the formal sector, suggesting that FDI accounts for about 20% of Zambia’s formal job creation
during the last decade.
2.34 While FDI inflows remain dominated by mining, there has been some diversification with
increasing investments into manufacturing, agriculture (directed mainly at the production of fruit,
flowers, horticultural products, cotton, maize, tobacco, and sugar), construction,
telecommunications (mobile telephony in particular), tourism and other services. While the mining
and manufacturing sectors attracted around 90% of total pledged investment flows over the last decade,
investors have also shown interest for other sectors such as agriculture and agro-processing, tourism and
telecommunication (mobile telephony in particular) (OECD 2012). The main investors have come from
countries outside Africa, such as China, India and Australia, but African investors from South Africa or
Nigeria among others have been increasingly active, in mining as well as in various services sectors (e.g.
retail, telecommunications, banking). Beside the copper boom, some of the main factors which
contributed to attracting FDI in Zambia include the stable macroeconomic environment and dynamic
growth of the economy. However, recent government interventions in investment deals it contested20
,
whether justified or not, have been argued to negatively impact investors’ confidence.
20
This was for instance the case with the cancellation of the sale of Finance Bank Zambia to a South African bank in 2011, and
with the reversal of the privatization of telecommunication operator Zamtel to a Libyan company in early 2012.
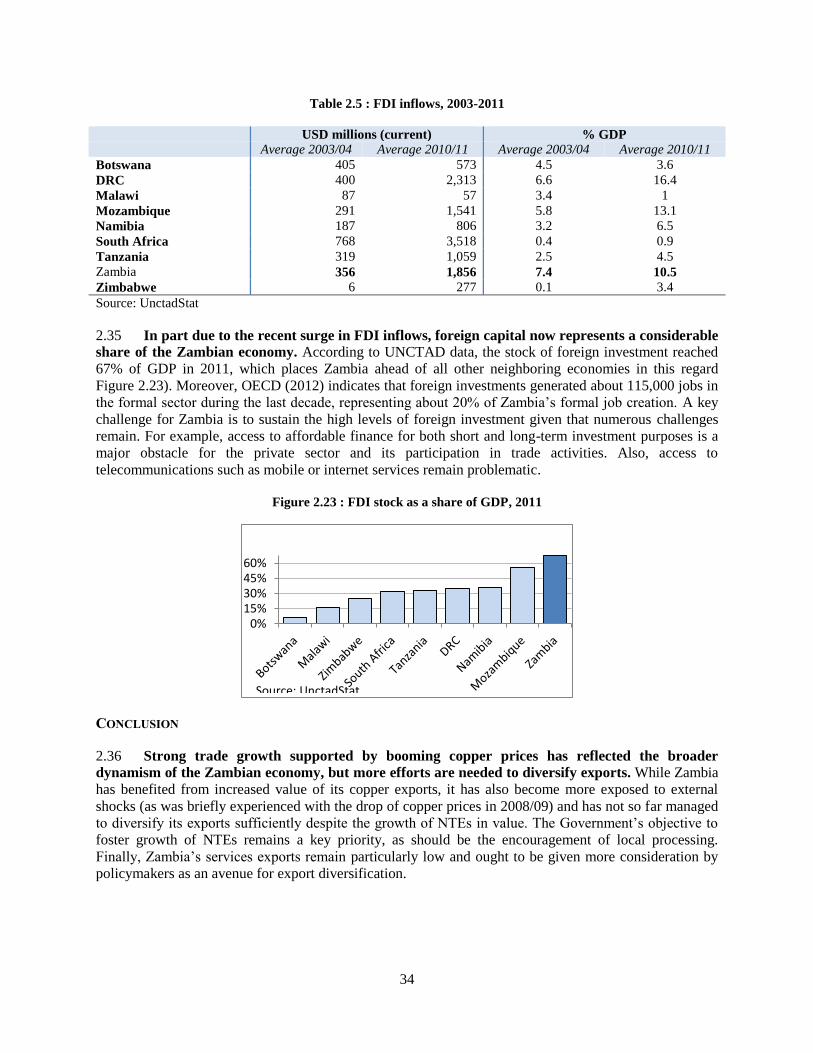
34
Table 2.5 : FDI inflows, 2003-2011
USD millions (current) % GDP
Average 2003/04 Average 2010/11 Average 2003/04 Average 2010/11
Botswana 405 573 4.5 3.6
DRC 400 2,313 6.6 16.4
Malawi 87 57 3.4 1
Mozambique 291 1,541 5.8 13.1
Namibia 187 806 3.2 6.5
South Africa 768 3,518 0.4 0.9
Tanzania 319 1,059 2.5 4.5
Zambia 356 1,856 7.4 10.5
Zimbabwe 6 277 0.1 3.4
Source: UnctadStat
2.35 In part due to the recent surge in FDI inflows, foreign capital now represents a considerable
share of the Zambian economy. According to UNCTAD data, the stock of foreign investment reached
67% of GDP in 2011, which places Zambia ahead of all other neighboring economies in this regard
Figure 2.23). Moreover, OECD (2012) indicates that foreign investments generated about 115,000 jobs in
the formal sector during the last decade, representing about 20% of Zambia’s formal job creation. A key
challenge for Zambia is to sustain the high levels of foreign investment given that numerous challenges
remain. For example, access to affordable finance for both short and long-term investment purposes is a
major obstacle for the private sector and its participation in trade activities. Also, access to
telecommunications such as mobile or internet services remain problematic.
Figure 2.23 : FDI stock as a share of GDP, 2011
CONCLUSION
2.36 Strong trade growth supported by booming copper prices has reflected the broader
dynamism of the Zambian economy, but more efforts are needed to diversify exports. While Zambia
has benefited from increased value of its copper exports, it has also become more exposed to external
shocks (as was briefly experienced with the drop of copper prices in 2008/09) and has not so far managed
to diversify its exports sufficiently despite the growth of NTEs in value. The Government’s objective to
foster growth of NTEs remains a key priority, as should be the encouragement of local processing.
Finally, Zambia’s services exports remain particularly low and ought to be given more consideration by
policymakers as an avenue for export diversification.
0%15%30%45%60%
Source: UnctadStat
35
CHAPTER 3: NON-TARIFF MEASURES
1. INTRODUCTION
3.1 Non-tariff measures (NTMs) are regulations other than tariffs affecting the import or
export of products. They may affect only traded products (e.g. quantitative restrictions) or they may
affect all products, whether imported or produced locally (e.g. technical regulations). NTMs may be
imposed in response to growing societal demands for traceability, protection against various hazards to
human health, or the preservation of local public goods like the environment. They can also be imposed to
protect the domestic market as substitutes to tariffs or contingent protection, in which case they take the
name of non-tariff barriers (NTBs).
3.2 In Zambia like in the rest of the continent, traditional forms of import protection through
NTBs (quotas and prohibitions) have largely been phased out. However, the case of Zambia illustrates
how idiosyncratic technical regulations can be used to prevent arbitraging of price differences through
import, protecting dominant positions on the domestic market and hurting the poor. Such situations are
particularly damaging from a welfare perspective because the high prices are not compensated by job
creation, as monopolies typically restrict output and employment to maintain high prices. When, in
addition, they are subsidiaries of multinational companies, as is the case in sugar and cement, even the
profits are shipped abroad as part of well-documented tax-avoidance strategies.
3.3 Zambia also maintains complicated marketing arrangements for export crops such as
maize, involving in particular quantitative restrictions (QR) on exports. The political justification for
such QRs is to avoid domestic food-price inflation or seasonal price spikes. However, new-generation
export QRs create problems that have been widely discussed in the case of old-style import QRs: Licenses
have to be allocated somehow, and allocation mechanism are never transparent. In Zambia, decisions to
allow maize export permits are opaque and politically-charged. Such systems open the door for rent-
seeking and cronyism, especially when they last too long.
3.4 Be it on the export or import side, Zambia’s case illustrates the need for robust governance
processes covering all non-tariff measures to ensure that those measures are adopted only after due
process, including technical cost-benefit analysis, regional coordination, adherence to international best
practices, and wide stakeholder consultation.
NTMs in Zambia
3.5 The NTM environment in Zambia has improved, and is further undergoing important
changes toward rationalization. However, a number of lingering issues remain, most of which involve a
complex interplay of NTBs and competition-policy issues, with dominant positions established in two key
sectors, sugar and cement, and protected by NTBs. In the case of sugar, high prices hurt the poor and
work at cross-purposes with the government’s poverty-reduction strategy. They even undermine the
effectiveness of a program that contributes to high prices by stifling competition—the sugar fortification
program. In the case of cement, competition is improving and reducing prices, but international
experience suggests that the government should remain aware of the risk of capture of NTMs, especially
in view of the large employment consequences of distortions in cement prices. In other cases, government
bodies targeted by lobbying propaganda from various sides in intra-industry disputes may react by
multiplying offsetting interventions (tariffs, NTBs, taxes, and so on) to try to please everyone, resulting
in incoherent regulatory environments across the value chain.
36
2. MEASURES AFFECTING IMPORTS
3.6 The case of Zambian sugar illustrates how a NTM can end up indirectly helping to protect a
dominant position on the domestic market, becoming de facto an NTB. In 1998, Zambia adopted
legislation aimed at curbing vitamin A deficiency (VAD) by mandating that all packaged sugar sold
domestically be fortified with vitamin A at the rate of 10mg/kg. The policy was inspired by a similar
experiment in Guatemala and supported by USAID. Zambia Sugar, today a subsidiary of the Associated
British Food (ABF) group and by then the country’s only sugar producer, accepted to fortify sugar at its
own cost “as an act of goodwill”.21 Actually, only 30% of sugar sold has been fortified.22 The objective
of reducing VAD was quite legitimate, but the program’s impact has not been evaluated formally and
epidemiological data still indicates a prevalence of 65% among children aged 5 or less.23
3.7 Zambia’s vitamin-A fortification legislation, which has few equivalents abroad besides
Guatemala, makes the importation of sugar from neighboring countries difficult. In addition, sugar
imports must be cleared through a “bureaucratic and non-transparent process” of import-permit issuance
involving the Agriculture, Health and Commerce ministries (ODI, 2010). The fortification program is
actually considered by many stakeholders as “a mechanism for protecting the Zambian sugar market from
foreign competition. [Those stakeholders] expressed the view that there were certain shared interests
between Zambian sugar industry players and the Government, favoring continued protection from import
competition, and allowing prices and profits to remain high.” (ODI 2010, p. 5)
3.8 Indeed, even though Zambia is a highly efficient sugar producer with a unit cost of $169/T
(against a worldwide average of $263/T) and exports over half of its output,24
Figure 3.1shows that
its domestic retail price for sugar is the highest in the region, a very paradoxical situation. In 2006,
acting upon the complaint of large downstream sugar users (including a brewery), the Zambia
Competition Commission opened an investigation on the domestic sugar market. Its recommendation was
to create a “sugar desk” to administer a sugar quota regime, which did not happen and would actually
have done little to remove market power (see Annex 6).
3.9 In sum, Zambia’s sugar market suffers from a severe lack of competition that is apparently
comforted by non-tariff barriers. In the absence of entry on the domestic market, removing all import
barriers appears as the only way to reduce the cost of sugar.25 As a first, step, a rigorous impact
evaluation should be carried out on the sugar fortification program with a view to assessing its costs and
benefits.
21 http://on.aol.com/video/fortifying-vitamins-in-sugar-in-zambia-458397150?icid=video_related_thumb_1. The program’s cost
was estimated by a company executive at about a million dollars per year. 22 See http://www.tulane.edu/~internut/Countries/Zambia/zambiavitamina.html. 23Idem. 24ODI, 2010. 25 The elimination of the EU’s sugar quota in 2009 created an expansion opportunity for Zambia’s sugar industry, which was
widely expected to trigger entry. Indeed, in mid-2008 a Zambian meat producer acquired a large estate with the intention of
developing it into a sugar cane plantation for export and domestic sale. However, “after buying the farm land, the company
decided to divest. There is speculation that the firm may have divested because it envisaged tough competition from the
incumbent” (ODI 2010, p. 6).
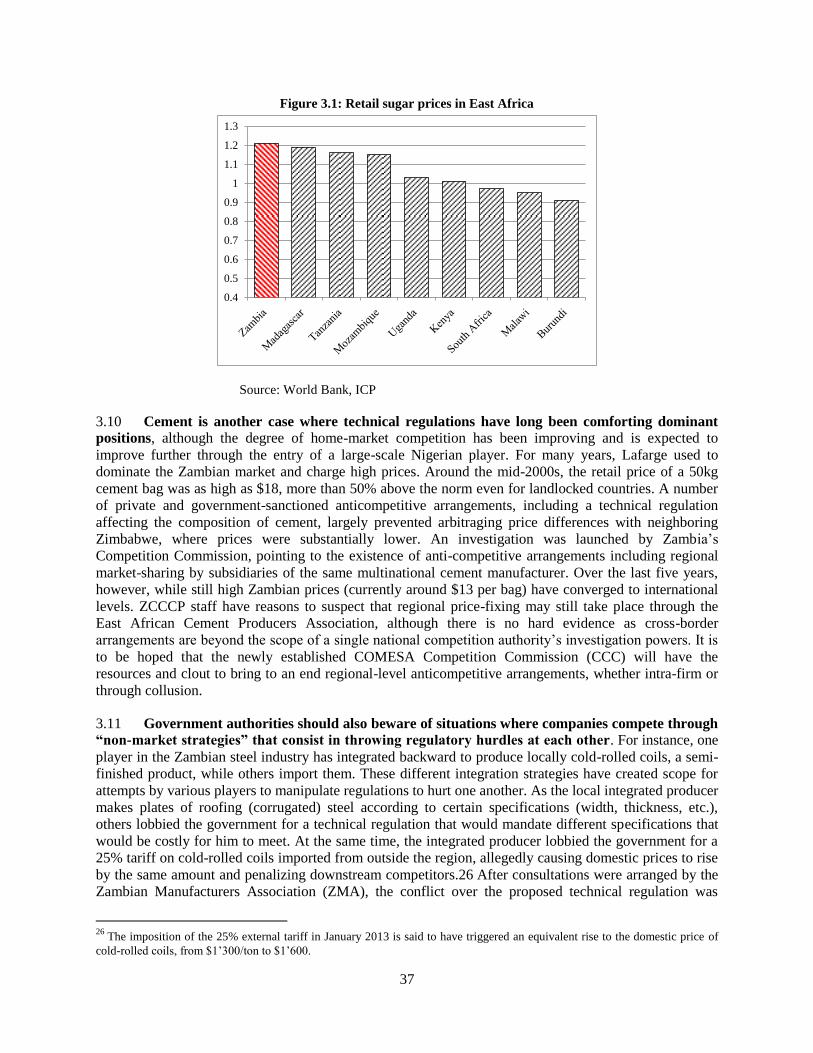
37
Figure 3.1: Retail sugar prices in East Africa
Source: World Bank, ICP
3.10 Cement is another case where technical regulations have long been comforting dominant
positions, although the degree of home-market competition has been improving and is expected to
improve further through the entry of a large-scale Nigerian player. For many years, Lafarge used to
dominate the Zambian market and charge high prices. Around the mid-2000s, the retail price of a 50kg
cement bag was as high as $18, more than 50% above the norm even for landlocked countries. A number
of private and government-sanctioned anticompetitive arrangements, including a technical regulation
affecting the composition of cement, largely prevented arbitraging price differences with neighboring
Zimbabwe, where prices were substantially lower. An investigation was launched by Zambia’s
Competition Commission, pointing to the existence of anti-competitive arrangements including regional
market-sharing by subsidiaries of the same multinational cement manufacturer. Over the last five years,
however, while still high Zambian prices (currently around $13 per bag) have converged to international
levels. ZCCCP staff have reasons to suspect that regional price-fixing may still take place through the
East African Cement Producers Association, although there is no hard evidence as cross-border
arrangements are beyond the scope of a single national competition authority’s investigation powers. It is
to be hoped that the newly established COMESA Competition Commission (CCC) will have the
resources and clout to bring to an end regional-level anticompetitive arrangements, whether intra-firm or
through collusion.
3.11 Government authorities should also beware of situations where companies compete through
“non-market strategies” that consist in throwing regulatory hurdles at each other. For instance, one
player in the Zambian steel industry has integrated backward to produce locally cold-rolled coils, a semi-
finished product, while others import them. These different integration strategies have created scope for
attempts by various players to manipulate regulations to hurt one another. As the local integrated producer
makes plates of roofing (corrugated) steel according to certain specifications (width, thickness, etc.),
others lobbied the government for a technical regulation that would mandate different specifications that
would be costly for him to meet. At the same time, the integrated producer lobbied the government for a
25% tariff on cold-rolled coils imported from outside the region, allegedly causing domestic prices to rise
by the same amount and penalizing downstream competitors.26 After consultations were arranged by the
Zambian Manufacturers Association (ZMA), the conflict over the proposed technical regulation was
26
The imposition of the 25% external tariff in January 2013 is said to have triggered an equivalent rise to the domestic price of
cold-rolled coils, from $1’300/ton to $1’600.
0.4
0.5
0.6
0.7
0.8
0.9
1
1.1
1.2
1.3
38
apparently resolved. It is worth highlighting in passing that the Zambia Bureau of Standards (ZABS) took
in this case a remarkably cautious, consultation-based approach.
3.12 Cases involving inadequate regulations or nonmarket strategies are extremely complex.
Regulatory agencies should, as much as possible, avoid getting embroiled, as it can be difficult for them
to see through the propaganda coming from various sides on highly technical issues. If there is no way of
staying out, the approach of bringing everybody around a table is no doubt a very good one. However, it
may not always replace independent analysis for several reasons. First, one can never be sure that really
everyone is around the table. A consensus brokered by the manufacturers’ association might well be on
the back of consumers, rarely represented credibly. Second, no one in such meetings may question
whether government intervention is justified in the first place based on sound microeconomic principles.
In the steel regulation’s case, most of the regulated attributes are quality ones, for which there is no
market failure to justify that the government step in. Turning to international best practice can be a good
check on that (if good-governance countries like Chile or Singapore do not regulate roofing steel, should
Zambia do?) and also provide templates for good regulations.
3.13 Regulatory agencies should avoid introducing technical regulations abruptly or with
insufficient efforts to make the private sector aware of upcoming changes, without regard to the
cost that non-harmonized regulations impose on businesses that rely on cross-border trade, or, in
some cases, in contradiction with Zambia’s regional commitments. For instance, on September 10th,
2012, the Zambia Bureau of Standards, the Energy Regulation Board, the Road Transport and Safety
Agency, and the Zambia Weights and Measures Agency together mandated the enforcement of technical
regulations ZS371 and ZS429-4 on tanker trucks that limit the size of tanks to 7’000 liters, a smaller size
than is usual in the region (10’000 liters). The reasons invoked were “protecting life, property and road
infrastructure while guarding against environmental pollution in Zambia.”
3.14 At face value, the technical regulations can be considered as WTO-compliant, although they
might fail the “necessity test”, and they do not constitute NTBs as they apply equally to local and
foreign trucks. However, they are in violation of Article 6.3(5) of the SADC protocol, which states that
“[a] Member State shall recognize the roadworthy certification and/or vehicle fitness certification issued
by another Member State in respect of a vehicle registered in such State for the purpose of the free
movement of such vehicle within its territory”. If Zambia wants SADC tanker truck regulations to
change, it must make a proposal to that extent as part of ongoing harmonization negotiations as per
Article 6.5. Moreover, the private sector argues that there has been insufficient phase-in, little advanced
information that the regulation would be applied, and that anyway the regulation would imply a
prohibitively costly redesign of tanker trucks. A complaint lodged at the NTB monitoring mechanism in
September 2012 is worth quoting at length, as it expresses a frustration that is often palpable in
interviews:
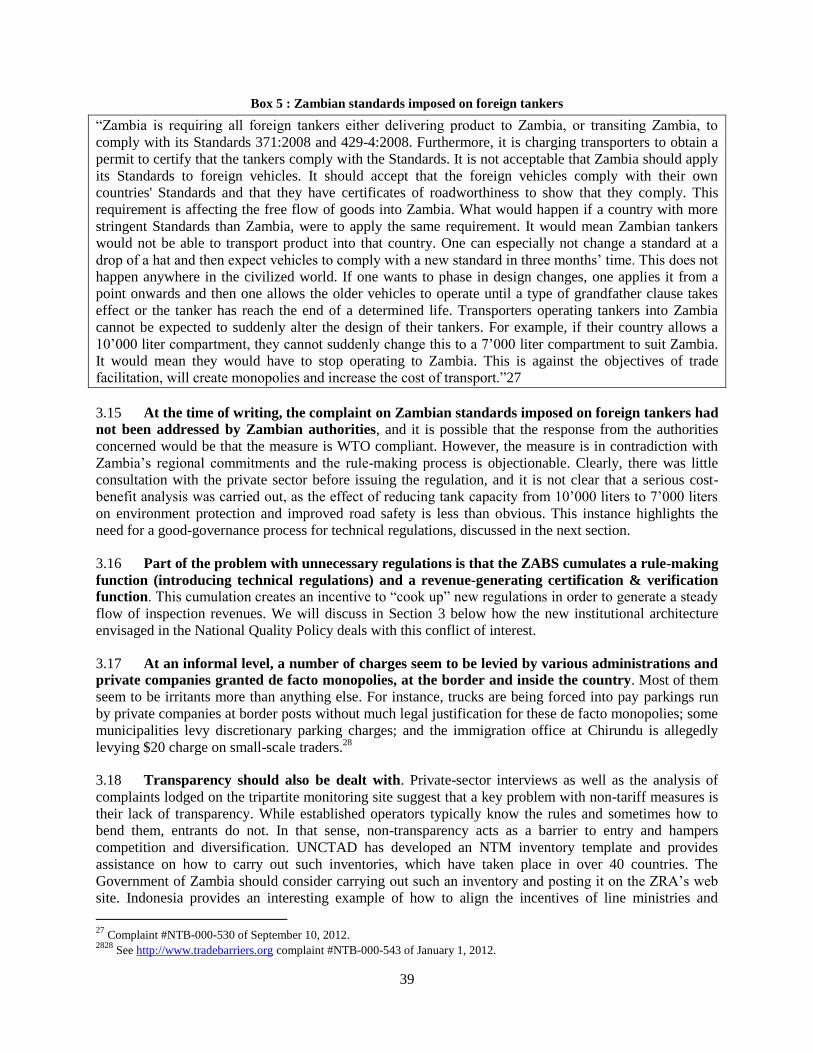
39
Box 5 : Zambian standards imposed on foreign tankers
“Zambia is requiring all foreign tankers either delivering product to Zambia, or transiting Zambia, to
comply with its Standards 371:2008 and 429-4:2008. Furthermore, it is charging transporters to obtain a
permit to certify that the tankers comply with the Standards. It is not acceptable that Zambia should apply
its Standards to foreign vehicles. It should accept that the foreign vehicles comply with their own
countries' Standards and that they have certificates of roadworthiness to show that they comply. This
requirement is affecting the free flow of goods into Zambia. What would happen if a country with more
stringent Standards than Zambia, were to apply the same requirement. It would mean Zambian tankers
would not be able to transport product into that country. One can especially not change a standard at a
drop of a hat and then expect vehicles to comply with a new standard in three months’ time. This does not
happen anywhere in the civilized world. If one wants to phase in design changes, one applies it from a
point onwards and then one allows the older vehicles to operate until a type of grandfather clause takes
effect or the tanker has reach the end of a determined life. Transporters operating tankers into Zambia
cannot be expected to suddenly alter the design of their tankers. For example, if their country allows a
10’000 liter compartment, they cannot suddenly change this to a 7’000 liter compartment to suit Zambia.
It would mean they would have to stop operating to Zambia. This is against the objectives of trade
facilitation, will create monopolies and increase the cost of transport.”27
3.15 At the time of writing, the complaint on Zambian standards imposed on foreign tankers had
not been addressed by Zambian authorities, and it is possible that the response from the authorities
concerned would be that the measure is WTO compliant. However, the measure is in contradiction with
Zambia’s regional commitments and the rule-making process is objectionable. Clearly, there was little
consultation with the private sector before issuing the regulation, and it is not clear that a serious cost-
benefit analysis was carried out, as the effect of reducing tank capacity from 10’000 liters to 7’000 liters
on environment protection and improved road safety is less than obvious. This instance highlights the
need for a good-governance process for technical regulations, discussed in the next section.
3.16 Part of the problem with unnecessary regulations is that the ZABS cumulates a rule-making
function (introducing technical regulations) and a revenue-generating certification & verification
function. This cumulation creates an incentive to “cook up” new regulations in order to generate a steady
flow of inspection revenues. We will discuss in Section 3 below how the new institutional architecture
envisaged in the National Quality Policy deals with this conflict of interest.
3.17 At an informal level, a number of charges seem to be levied by various administrations and
private companies granted de facto monopolies, at the border and inside the country. Most of them
seem to be irritants more than anything else. For instance, trucks are being forced into pay parkings run
by private companies at border posts without much legal justification for these de facto monopolies; some
municipalities levy discretionary parking charges; and the immigration office at Chirundu is allegedly
levying $20 charge on small-scale traders.28
3.18 Transparency should also be dealt with. Private-sector interviews as well as the analysis of
complaints lodged on the tripartite monitoring site suggest that a key problem with non-tariff measures is
their lack of transparency. While established operators typically know the rules and sometimes how to
bend them, entrants do not. In that sense, non-transparency acts as a barrier to entry and hampers
competition and diversification. UNCTAD has developed an NTM inventory template and provides
assistance on how to carry out such inventories, which have taken place in over 40 countries. The
Government of Zambia should consider carrying out such an inventory and posting it on the ZRA’s web
site. Indonesia provides an interesting example of how to align the incentives of line ministries and
27
Complaint #NTB-000-530 of September 10, 2012. 2828
See http://www.tradebarriers.org complaint #NTB-000-543 of January 1, 2012.
40
agencies to collaborate in the transparency effort—namely, a practice whereby only those measures that
are posted on the official inventory are enforced at the border.
3.19 The issue of transparency goes beyond NTMs. In parallel to the NTM inventory, the
Government of Zambia, in particular the ZRA, should provide up-to-date information on export and
import procedures for all types of goods, including a listing of the steps that need to be followed, the
name and location of administrations involved in each procedure, the required documentation, and so on.
This information should be available on a web site with all relevant forms posted in pdf format.
3. MEASURES AFFECTING EXPORTS
3.20 The Government of Zambia maintains very complex marketing/NTB arrangements in a
number of agricultural products. In maize, it currently maintains an export QR, while a seasonal export
ban in maize bran was recently lifted. Export bans are disruptive trade instruments and should, in general,
be avoided; if feasibility considerations constrain the government’s ability to eliminate this particular
instrument, at least its most disruptive aspects should be reformed. In particular, the government needs to
make the system more transparent and predictable in two dimensions: (i) When restrictions are imposed,
and (ii) to whom export licenses are granted and under what conditions.
3.21 Export bans, which are current in the region, have been argued to distort markets and
create inefficiencies (see Gillson, 2011). Rather than cushioning supply shocks, they amplify them,
working against both food security for consumers and income stabilization for producers. For instance, it
has been estimated that the effect of a drought leading to a 30% drop in output would raise prices by
150% with closed borders, against only 36% with open ones (Dorosh, Dradri and Haggblade 2007, cited
in Gillson 2011). Similarly, a bumper harvest leading to a 30% rise in output would depress prices by
50% under closed borders, against only 26% with open ones.
3.22 Zambia’s export restriction on maize29 is a complicated regime that lacks visibility and
may seriously impair the country’s ability to benefit from the region’s emerging commodities
futures market. In terms of redistribution effects, the QR does not seem to be perceived by farmers as a
tax. The reason is that they are partially sheltered by a complex domestic marketing arrangement whereby
the Food Reserve Agency (FRA), a government body, buys maize on the market at more than market
price (currently ZKW65 per 50-kg bag, or $255/T, which is about 10% above market price) and re-sells it
to millers at market or below-market prices.30 The main problem with Zambia’s export QR is its
unpredictability and lack of transparency. Few people can give a clear explanation of the procedure for
the allocation of export permits. Moreover, restrictions are on and off, and exporters often learn that their
export permits are no longer valid when their trucks reach the border to fulfill existing orders with foreign
clients, wreaking havoc in supplier-client relations. The inability to commit to future deliveries is likely to
hamper Zambia’s ability to participate actively in futures markets, denying its domestic producers the
benefits of modern financial instruments.
3.23 The government should also refrain from re-activating the seasonal ban on maize bran. The
ban was intended to prevent excessive rises in the price of animal feeds during the dry season which
penalized the cattle-ranching sector. The ban was resented by millers (for whom maize bran is a by-
product) because it led to clogged inventories and crowded out storage space for more valuable products.
29
It is not a ban stricto sensu as limited quantities are cleared for export from time to time; for instance, 50’000 tons worth of
maize export permits were allowed in early 2013. 30
The FRA’s mandate is, in principle, to buy maize from farmers located in areas too remote to be attractive for the private
sector and to use the quantities purchased to build up an emergency food reserve. However, implementation has been haphazard.
Stock management is inefficient and significant quantities are bought from middlemen rather than from the farmers themselves,
with the middlemen pocketing the implicit subsidy.
41
The problem of seasonal price spikes in animal feeds is real, but it should be addressed through seasonal
export bans only upon careful cost-benefit analysis, and if less disruptive instruments are not available.
3.24 Even when problems are not as serious as in the maize sector, the government needs to
communicate policy changes more clearly and timely to the private sector. For instance, the Ministry
of Agriculture has been running a system of export permits for foodstuffs which used to be granted for a
period of one month and allowing the bearer to export quantities that were determined by his capacity on
a case-by case basis. The system was perceived by the Zambia Revenue Authority (ZRA) and by the
Agriculture Ministry as problematic for two reasons. First, in the case of multiple shipments, some trucks
would be carrying copies of the permits, and the copying was an invitation to abuse. Second, the system
was perceived as not conducive to close monitoring of quantities for sensitive products subject to export
QRs. Accordingly, it was replaced by a system of fixed-quantity permits allowing the bearer to export
only up to 30 tons. The private sector has been protesting that this would mean that standard 33T trucks
would have to forego 10% of their capacity. But the Agriculture Ministry indicated to the mission that
issuing a second permit for the additional 3T would not be a problem and would entail an additional fee
of only ZKW35 (about $7.00). If indeed the granting of a second license can be done simultaneously as
that of the first one and without hassle, clearly this should be conveyed clearly to the private sector. But
the Agriculture Ministry’s web site is “under construction”, so communication, if any, only takes the form
of postings inside the Ministry’s building.
NTM governance
3.25 The progressive reduction of tariffs in Eastern and Southern Africa has shifted the focus of
trade policy to non-tariff barriers, which remain substantial. However the approaches followed so far
have yielded limited results. Progress has been hampered by the very reason that justifies attention to the
issue—namely, the domination exerted by large players in small and fragmented markets and their ability
to thwart both private arbitrage attempts and government efforts to reduce entry barriers. Progress has
also been hampered by a mercantilist approach to the reduction of NTBs. That is, governments view
NTBs as bargaining chips that should be used only during inter-governmental rounds of negotiations.
However, the reality is that the elimination of NTBs is not a concession to trading partners: it is part of
domestic competitiveness agendas, as NTBs raise domestic prices, wages, and costs.
3.26 One of the main difficulties associated with the elimination of NTBs is the identification of
the reform’s winners and losers. Lessons from successful reformers—for instance, Chile—suggest that
one of the key success factors of a reform program is the government’s ability to identify groups that
would be penalized by the reform and compensate them or at least neutralize their potential resistance.
Typically, the losers from a reform are the beneficiaries from the distortion that it would eliminate. In the
case of sugar, the main beneficiary of the current market structure is a large, foreign-owned company,
whereas the main losers are low-income households priced out of adequate sugar consumption. The
asymmetry between a large, diffuse group of stakeholders and a single, powerful one makes reform
difficult. In order to gather support for a transition toward a more competitive market structure (e.g. via a
reform of the sugar-fortification program), the Zambian government would need to (i) engage with
potential distributors of imported sugar who would stand to benefit from the transition, and (ii) offer
compensations to the current incumbent. Good compensations would not consist in offering protected
access to other rents, but rather in policy initiatives to reduce the incumbent’s business costs, e.g. through
investments in public infrastructure. If those investments had positive spillover effects on other
companies as well, the resulting deal would be a win-win.
3.27 A new approach needs to be adopted whereby NTB elimination is made part of a broader
regulatory reform aiming at improving the quality of all non-tariff measures on a unilateral basis,
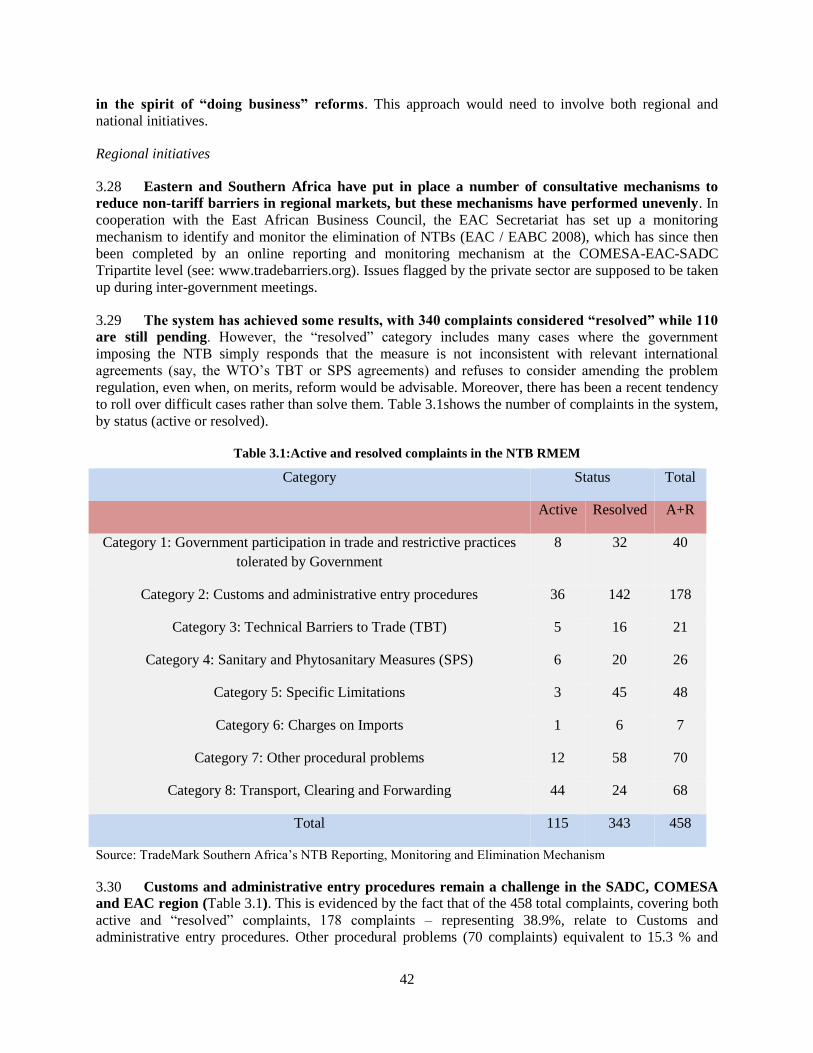
42
in the spirit of “doing business” reforms. This approach would need to involve both regional and
national initiatives.
Regional initiatives
3.28 Eastern and Southern Africa have put in place a number of consultative mechanisms to
reduce non-tariff barriers in regional markets, but these mechanisms have performed unevenly. In
cooperation with the East African Business Council, the EAC Secretariat has set up a monitoring
mechanism to identify and monitor the elimination of NTBs (EAC / EABC 2008), which has since then
been completed by an online reporting and monitoring mechanism at the COMESA-EAC-SADC
Tripartite level (see: www.tradebarriers.org). Issues flagged by the private sector are supposed to be taken
up during inter-government meetings.
3.29 The system has achieved some results, with 340 complaints considered “resolved” while 110
are still pending. However, the “resolved” category includes many cases where the government
imposing the NTB simply responds that the measure is not inconsistent with relevant international
agreements (say, the WTO’s TBT or SPS agreements) and refuses to consider amending the problem
regulation, even when, on merits, reform would be advisable. Moreover, there has been a recent tendency
to roll over difficult cases rather than solve them. Table 3.1shows the number of complaints in the system,
by status (active or resolved).
Table 3.1:Active and resolved complaints in the NTB RMEM
Category Status Total
Active Resolved A+R
Category 1: Government participation in trade and restrictive practices
tolerated by Government
8 32 40
Category 2: Customs and administrative entry procedures 36 142 178
Category 3: Technical Barriers to Trade (TBT) 5 16 21
Category 4: Sanitary and Phytosanitary Measures (SPS) 6 20 26
Category 5: Specific Limitations 3 45 48
Category 6: Charges on Imports 1 6 7
Category 7: Other procedural problems 12 58 70
Category 8: Transport, Clearing and Forwarding 44 24 68
Total 115 343 458
Source: TradeMark Southern Africa’s NTB Reporting, Monitoring and Elimination Mechanism
3.30 Customs and administrative entry procedures remain a challenge in the SADC, COMESA
and EAC region (Table 3.1). This is evidenced by the fact that of the 458 total complaints, covering both
active and “resolved” complaints, 178 complaints – representing 38.9%, relate to Customs and
administrative entry procedures. Other procedural problems (70 complaints) equivalent to 15.3 % and
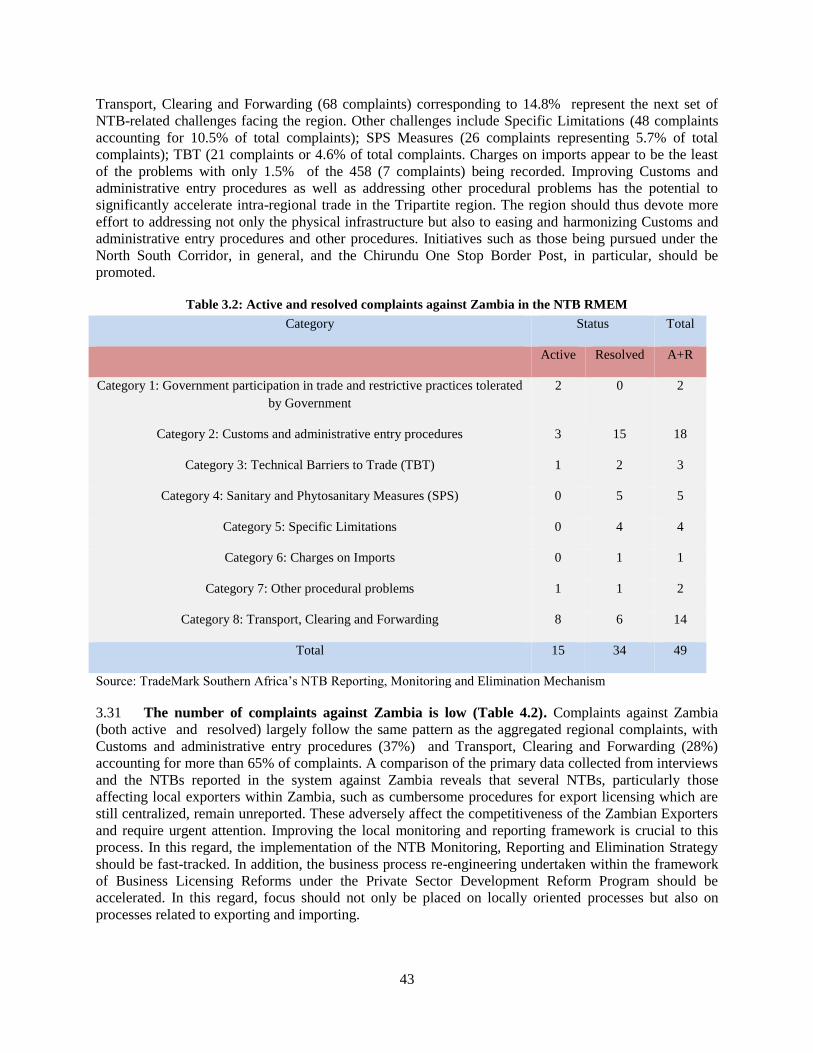
43
Transport, Clearing and Forwarding (68 complaints) corresponding to 14.8% represent the next set of
NTB-related challenges facing the region. Other challenges include Specific Limitations (48 complaints
accounting for 10.5% of total complaints); SPS Measures (26 complaints representing 5.7% of total
complaints); TBT (21 complaints or 4.6% of total complaints. Charges on imports appear to be the least
of the problems with only 1.5% of the 458 (7 complaints) being recorded. Improving Customs and
administrative entry procedures as well as addressing other procedural problems has the potential to
significantly accelerate intra-regional trade in the Tripartite region. The region should thus devote more
effort to addressing not only the physical infrastructure but also to easing and harmonizing Customs and
administrative entry procedures and other procedures. Initiatives such as those being pursued under the
North South Corridor, in general, and the Chirundu One Stop Border Post, in particular, should be
promoted.
Table 3.2: Active and resolved complaints against Zambia in the NTB RMEM
Category Status Total
Active Resolved A+R
Category 1: Government participation in trade and restrictive practices tolerated
by Government
2 0 2
Category 2: Customs and administrative entry procedures 3 15 18
Category 3: Technical Barriers to Trade (TBT) 1 2 3
Category 4: Sanitary and Phytosanitary Measures (SPS) 0 5 5
Category 5: Specific Limitations 0 4 4
Category 6: Charges on Imports 0 1 1
Category 7: Other procedural problems 1 1 2
Category 8: Transport, Clearing and Forwarding 8 6 14
Total 15 34 49
Source: TradeMark Southern Africa’s NTB Reporting, Monitoring and Elimination Mechanism
3.31 The number of complaints against Zambia is low (Table 4.2). Complaints against Zambia
(both active and resolved) largely follow the same pattern as the aggregated regional complaints, with
Customs and administrative entry procedures (37%) and Transport, Clearing and Forwarding (28%)
accounting for more than 65% of complaints. A comparison of the primary data collected from interviews
and the NTBs reported in the system against Zambia reveals that several NTBs, particularly those
affecting local exporters within Zambia, such as cumbersome procedures for export licensing which are
still centralized, remain unreported. These adversely affect the competitiveness of the Zambian Exporters
and require urgent attention. Improving the local monitoring and reporting framework is crucial to this
process. In this regard, the implementation of the NTB Monitoring, Reporting and Elimination Strategy
should be fast-tracked. In addition, the business process re-engineering undertaken within the framework
of Business Licensing Reforms under the Private Sector Development Reform Program should be
accelerated. In this regard, focus should not only be placed on locally oriented processes but also on
processes related to exporting and importing.
44
3.32 A number of other regional initiatives such as the APEI are taking shape. In September 2012
in the Seychelles, a group of like-minded reformist countries including Malawi, Mauritius, Mozambique,
Seychelles and Zambia launched the accelerated program for economic integration (APEI) to press ahead
with the reduction of NTB affecting trade between them through (i) improving the business regulatory
environment; (ii) eliminating barriers to trade in goods; (iii) promoting trade in services; and (iv) capacity
building through peer-to-peer learning. A first meeting was held in February 2013, and the group stressed
that the initiative was not meant to complicate the integration process in SADC, EAC and COMESA but
to move ahead in areas where progress was viewed as too slow, including the reduction of non-tariff
barriers.
3.33 Specifically, the APEI’s proposed action matrix, adopted in March 2013, calls for a number
of initiatives in the area of NTMs and NTBs. These include
Drawing up inventories of NTMs and codifying remaining NTMs/NTBs in all APEI countries;
Removing NTBs identified in DTISs in APEI countries;
Identifying priority barriers and eliminating them;
Establishing NTB monitoring committees to facilitate coordination and identify/eliminate 10 NTBs.
3.34 All APEI objectives are in line with DTIS recommendations. The creation of national NTM
inventories is in line with recent efforts by the World Bank and other international organizations to
coordinate the collection of NTM inventories worldwide. 31 A number of countries in the region,
including Mauritius, have carried out systematic inventories of NTMs with assistance from UNCTAD
and the World Bank. Zambia should carry out a similar inventory and promote similar initiatives as part
of the accelerated program of economic integration. NTM inventories follow a consistent template where
all trade-relevant regulations produced by domestic agencies (including trade, health, and agriculture
ministries, standards bureaus, etc.) are coded according to the UNCTAD-WTO classification and
attributed to each affected product under the harmonized HS6 classification. Thus, the inventory in its
short format takes the form of a matrix with products in rows and measures in columns. In addition, it
contains references to the legal texts and issuing & enforcement agencies. When posted on customs’ web
sites, these inventories reduce the scope for conflicts at the border when either officials or traders are
incompletely informed. They provide very valuable information on relevant regulations for importers and
exporters, in particular new entrants, thus contributing to facilitate diversification. In particular, they
reduce uncertainty costs for small-scale traders, in particular those, like women, who tend to be excluded
from well-informed insider networks. National monitoring committees could be reinforced along the lines
recommended in the World Bank’s NTM streamlining toolkit (World Bank 2011) and Zambia’s National
Quality Policy is making progress in that direction (see below).
3.35 COMESA also implemented in January 2013 a decision to create a competition commission
common to the bloc, the CCC, with investigation and enforcement powers patterned after the EU’s
DG IV. The objective was to deal with cross-border anti-competitive arrangements beyond the reach of
national competition authorities. At the time of writing, the CCC’s senior management had been selected.
Given the many interlinkages between competition-policy issues (in particular cross-border ones) and
barriers to trade, the establishment of a common competition authority is a positive development provided
that it is endowed with sufficient resources and expertise to carry out credible analyses. Over time,
technical expertise will help it gather the clout needed to make a difference. COMESA also put in place in
31
Sixty-five countries have been covered so far, and coverage is progressively enlarged.
45
2006 a “green pass” intended to act as a mutual-recognition scheme for SPS measures on foodstuffs.32
However, seven years on, mutual recognition of SPS certificates in the area is still very haphazard.
COMESA also put in place a simplified trade regime (STR) to facilitate small-scale cross-border trade,
but use of the STR regime has been declining for lack of effective simplification (Gillson 2011).
National Initiatives
Zambia’s National Quality Policy: Making it work
3.36 In parallel with regional initiatives, Zambia has been pursuing a national competitiveness
agenda involving, inter alia, a National Quality Policy (NQP) to support its Private Sector
Development Program. In the area of technical regulations, the NQP introduces a new institutional
architecture which has the potential to be a game changer if it is implemented seriously.
3.37 First, the design of technical regulations is to be separated from certification and
verification functions. The ZABS will retain rule-making functions and act as TBT enquiry point,
performing support and awareness functions.33 An independent Accreditation Agency will be created
with monopoly over accreditation activities, while conformity assessment by private laboratories will be
“encouraged”. The unbundling of rule-making from verification is intended to eliminate the conflict of
interest discussed in Section 3 (and observed in many countries) whereby the revenue-generating
certification functions of Standards Bureaus lead to regulatory proliferation.
3.38 Second, the NQP envisages a new institutional structure for technical regulations that is
intended to facilitate the adoption of good regulatory practices. Already, following DTIS
recommendations, the PSDP, and regional blueprints for the elimination of NTBs, a number of structures
have been set up, including an NTB Monitoring Committee and a National Trade Facilitation Working
Group. So far, these structures have been affected by internal turf battles between the internal and external
trade directories within the Ministry of Commerce, Trade and Industry and have achieved little beyond
meeting and discussing issues.
3.39 The new architecture involves the creation of an Inter-Ministerial Regulatory Working Group
(IMRWG) chaired by the Ministry of Commerce to “[d]evelop a common technical regulation framework
for Zambia, taking into consideration all the international and regional obligations of Zambia, as well as
the realities regarding standardization, metrology, accreditation, inspection testing and certification
service delivery in Zambia.” (Zambia 2011, p. 18).In addition, a Coordination Office for Technical
Regulations (COTR) will also be created, with a mandate to “Offer Secretarial Services to the Inter-
Ministerial Regulatory Working Group. Main tasks include:
Initiate a process to develop a technical regulatory checklist, guidelines for technical regulatory
impact and risk assessment, and codes of practice for Consultation, the technical regulatory process,
Enforcement; and the publication and notification of technical regulations
Ensure that technical regulations are only established for legitimate objectives such as the protection
of human health and safety, animal or plant life or health, or the environment, or the prevention of
deceptive practices.
32
See http://famis.comesa.int/content/page/78/78/sps/lang.en/Green-Pass-%28CGP%29.html. 33
See Zambia (2011), p. 17.
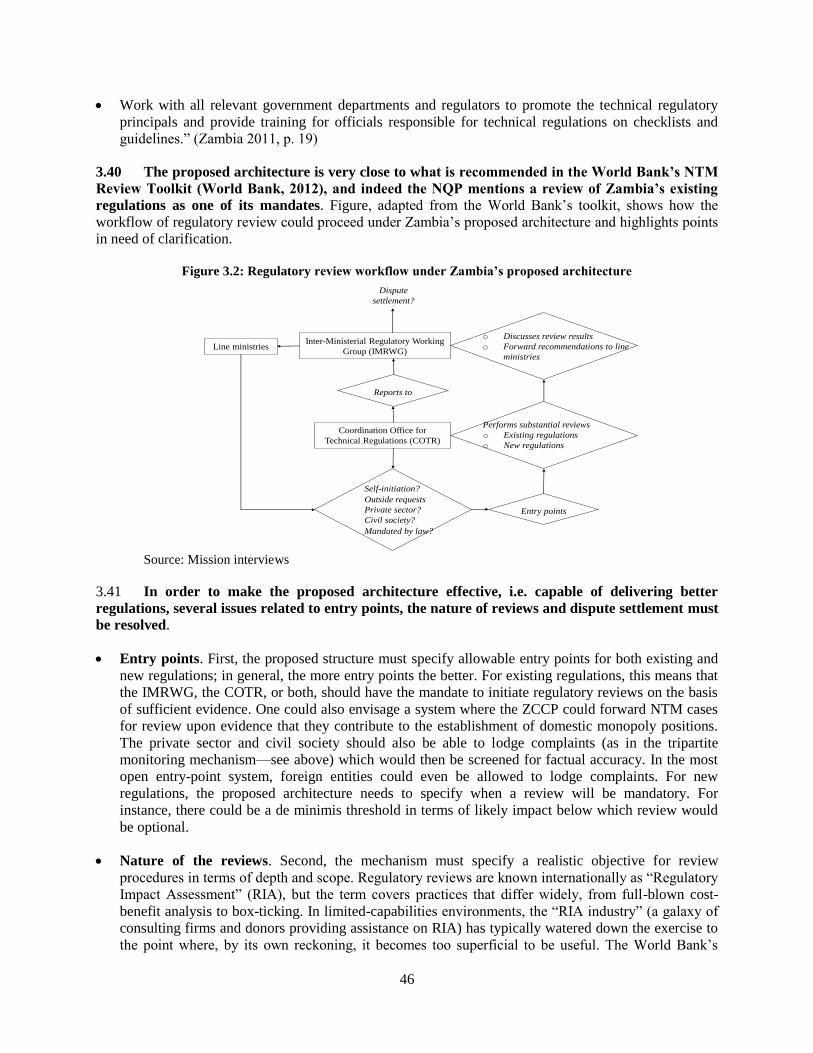
46
Work with all relevant government departments and regulators to promote the technical regulatory
principals and provide training for officials responsible for technical regulations on checklists and
guidelines.” (Zambia 2011, p. 19)
3.40 The proposed architecture is very close to what is recommended in the World Bank’s NTM
Review Toolkit (World Bank, 2012), and indeed the NQP mentions a review of Zambia’s existing
regulations as one of its mandates. Figure, adapted from the World Bank’s toolkit, shows how the
workflow of regulatory review could proceed under Zambia’s proposed architecture and highlights points
in need of clarification.
Figure 3.2: Regulatory review workflow under Zambia’s proposed architecture
Source: Mission interviews
3.41 In order to make the proposed architecture effective, i.e. capable of delivering better
regulations, several issues related to entry points, the nature of reviews and dispute settlement must
be resolved.
Entry points. First, the proposed structure must specify allowable entry points for both existing and
new regulations; in general, the more entry points the better. For existing regulations, this means that
the IMRWG, the COTR, or both, should have the mandate to initiate regulatory reviews on the basis
of sufficient evidence. One could also envisage a system where the ZCCP could forward NTM cases
for review upon evidence that they contribute to the establishment of domestic monopoly positions.
The private sector and civil society should also be able to lodge complaints (as in the tripartite
monitoring mechanism—see above) which would then be screened for factual accuracy. In the most
open entry-point system, foreign entities could even be allowed to lodge complaints. For new
regulations, the proposed architecture needs to specify when a review will be mandatory. For
instance, there could be a de minimis threshold in terms of likely impact below which review would
be optional.
Nature of the reviews. Second, the mechanism must specify a realistic objective for review
procedures in terms of depth and scope. Regulatory reviews are known internationally as “Regulatory
Impact Assessment” (RIA), but the term covers practices that differ widely, from full-blown cost-
benefit analysis to box-ticking. In limited-capabilities environments, the “RIA industry” (a galaxy of
consulting firms and donors providing assistance on RIA) has typically watered down the exercise to
the point where, by its own reckoning, it becomes too superficial to be useful. The World Bank’s
Inter-Ministerial Regulatory Working
Group (IMRWG)
Coordination Office for
Technical Regulations (COTR)
Performs substantial reviews
o Existing regulations
o New regulations
o Discusses review results
o Forward recommendations to line
ministries
Entry points
Outside requests
Private sector?
Civil society?
Self-initiation?
Mandated by law?
Line ministries
Dispute
settlement?
Reports to
47
toolkit provides a middle ground where regulatory review is based on a sound, structured economic
analysis (answering basic questions as to the justification of regulatory intervention, the appropriate
targeting, and the costs and benefits) that can be carried out by graduate-level economists, possibly
with technical assistance. In order to be able to do that effectively, the COTR must be endowed with
specific resources allowing it to recruit technical staff trained in modern economic analysis
(preferably young university graduates rather than detached ministry staff who typically have lost
touch with analytical work).
Dispute settlement. Finally, it must specify a decision-making procedure for the IMRWG and ensure
that it is not thwarted by line ministries. Once reviews have produced recommendations and
ministries sit around a table, a decision must be reached. In some cases (e.g. when the review
produces strong, unobjectionable conclusions), it will be consensual; in others (when conclusions are
ambiguous or when strong vested interests are at stake), it will not. The IMRWG must then have the
power to break deadlock. For that, it cannot sit with a line ministry like the MTIC, but should instead
be under the direct authority of the Prime Minister.
4. RECOMMENDATIONS
3.42 Zambia is progressively improving its regulatory environment and stands to reap large
benefits provided that it tackles effectively remaining issues and puts in place an institutional
architecture ensuring that the gains keep on accruing and cannot be reversed.
3.43 In the short term, the Government of Zambia should:
Review the export QR regime in maize and replace the opaque export-permit allocation
system by a yearly auction in order to provide visibility to operators, avoid damaging contract
breaches due to the unavailability or last-minute cancellation of permits, and eliminate cronyism
in the distribution of licenses;
Push for effective competition in its sugar market, by initiating a review of its Vitamin-A
fortification program (which acts as a technical barrier to trade and prevents price arbitrage),
and upon examination of the review’s conclusion, decide if the program’s benefits more than
offset its competition-restricting effects;
Provide sufficient resources in the upcoming budget for the Coordination Office for
Technical Regulations to be able to hire internationally 2 or 3 technical staff (masters or
doctorate level in economics) to perform regulatory reviews and dispose of an adequate annual
budget;
Carry out a systematic inventory of non-tariff measures following the template laid out by
UNCTAD, post it on a web site, and design a mechanism to ensure that line ministries and
agencies effectively post all amendments on it.
3.44 In the medium term, the Government of Zambia should
Watch developments in the cement industry to ensure that new entry is not followed by re-
cartelization; this could be achieved by mandating periodic reviews by the CCCP;
48
Coordinate regulatory reform and convergence with reform-minded countries in the region
as part of the Accelerated Program for Economic Integration through horizontal
cooperation between regulatory-review agencies, including common training programs;
Coordinate the work of the COTR with that of the CCCP, including common training and
staff exchanges, in order to ensure that regulatory reform and competition policy pull in the same
direction and benefit from each other.
49
CHAPTER 4: TRADE IN AGRICULTURE
1. INTRODUCTION
4.1 Agriculture and agribusiness play an important role in the Zambian economy contributing
around 20% of GDP in recent years and about 12% of national export earnings.34
According to the
2010 National Census, 60.5% of Zambia’s total population (equal to 7.9 million people and
approximately 1.5 million households) lived in rural areas. The majority of these people naturally derive
their livelihood primarily from agriculture so have a direct stake in Zambia’s trade policies for crop
inputs (seed, fertilizer, chemicals, farm machinery, etc.) and outputs (maize, cotton, tobacco, honey,
beans, etc.) in regional and other international markets.
4.2 Relative to other countries in the region, Zambia has an abundance of fertile land, water,
and a generally favorable climate for agricultural production. The country is therefore in a unique
position not only to leverage agriculture as an engine for poverty reduction and improved nutrition, but
also to become a major food exporter and “grain basket” of southern Africa.35
Compared with many
African countries, Zambia already has a relatively well-developed agribusiness industry with over
400,000 smallholder households linked to agribusiness firms through vertically integrated outgrower
programs primarily for cotton and, to a lesser extent, sugar, tobacco, and soybeans. Large commercial
farms and estates also play an important role in Zambia and account for the bulk of exports in sugar,
tobacco, wheat, horticulture, coffee, and soy. As Zambia looks to diversify its exports away from mining
and create jobs in other sectors, policies that promote large and small-scale agriculture investments and
agriculture trade are of obvious strategic importance.
4.3 This chapter of the DTIS specifically aims to help policymakers, agribusiness firms,
farmers, donors, and other sector stakeholders map the way forward for agriculture trade. In
particular, it will (i) Review factors affecting Zambia’s recent agriculture trade performance; (ii) Increase
understanding of strategic bottlenecks to agriculture trade; (iii) Consider how trade policies affect the
competitiveness of Zambian agriculture; and(iv)Identify opportunities for enhanced trade performance.
The overview of Zambia’s agriculture trade performance for leading crop and livestock products and
agriculture inputs (section 2) and main trade management challenges in agriculture such as the need for
reform of maize policies, the high cost of complying with export requirements for food staples, and
problems of livestock movement (section 3) is followed by two case study examples of how trade costs
undermine the competitiveness of Zambian agriculture exports and opportunities for small traders to
participate in the regional economy (section 4). The first case study looks at the costs of cross-border
movement at the Kasumbalesa border between Zambia and the Democratic Republic of Congo (DRC),
and shows how formal sector requirements are highly regressive and prevent small traders from
participating in the formal economy. The second example considers efforts by COMESA to establish a
Simplified Trade Regime (STR) for small traders at the Mwami/Mchinji border with Malawi and shows
how this initiative was largely unsuccessful because it only addresses the relatively minor issue of duty
exemptions. The discussion concludes in section 5 with a review of the main areas where clear-cut policy
improvements or other institutional change could help Zambia realize its full potential to benefit from
crop and livestock trade.
34FSRP (2011). 35FSRP (2011).
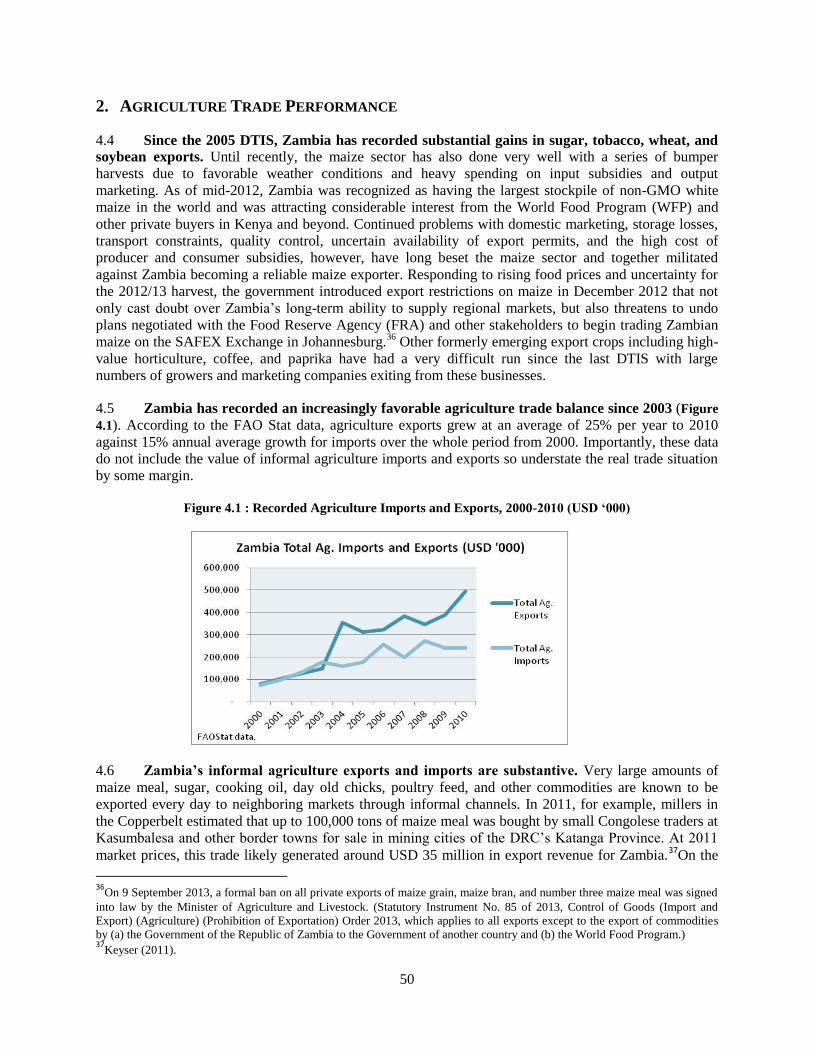
50
2. AGRICULTURE TRADE PERFORMANCE
4.4 Since the 2005 DTIS, Zambia has recorded substantial gains in sugar, tobacco, wheat, and
soybean exports. Until recently, the maize sector has also done very well with a series of bumper
harvests due to favorable weather conditions and heavy spending on input subsidies and output
marketing. As of mid-2012, Zambia was recognized as having the largest stockpile of non-GMO white
maize in the world and was attracting considerable interest from the World Food Program (WFP) and
other private buyers in Kenya and beyond. Continued problems with domestic marketing, storage losses,
transport constraints, quality control, uncertain availability of export permits, and the high cost of
producer and consumer subsidies, however, have long beset the maize sector and together militated
against Zambia becoming a reliable maize exporter. Responding to rising food prices and uncertainty for
the 2012/13 harvest, the government introduced export restrictions on maize in December 2012 that not
only cast doubt over Zambia’s long-term ability to supply regional markets, but also threatens to undo
plans negotiated with the Food Reserve Agency (FRA) and other stakeholders to begin trading Zambian
maize on the SAFEX Exchange in Johannesburg.36
Other formerly emerging export crops including high-
value horticulture, coffee, and paprika have had a very difficult run since the last DTIS with large
numbers of growers and marketing companies exiting from these businesses.
4.5 Zambia has recorded an increasingly favorable agriculture trade balance since 2003 (Figure
4.1). According to the FAO Stat data, agriculture exports grew at an average of 25% per year to 2010
against 15% annual average growth for imports over the whole period from 2000. Importantly, these data
do not include the value of informal agriculture imports and exports so understate the real trade situation
by some margin.
Figure 4.1 : Recorded Agriculture Imports and Exports, 2000-2010 (USD ‘000)
4.6 Zambia’s informal agriculture exports and imports are substantive. Very large amounts of
maize meal, sugar, cooking oil, day old chicks, poultry feed, and other commodities are known to be
exported every day to neighboring markets through informal channels. In 2011, for example, millers in
the Copperbelt estimated that up to 100,000 tons of maize meal was bought by small Congolese traders at
Kasumbalesa and other border towns for sale in mining cities of the DRC’s Katanga Province. At 2011
market prices, this trade likely generated around USD 35 million in export revenue for Zambia.37
On the
36
On 9 September 2013, a formal ban on all private exports of maize grain, maize bran, and number three maize meal was signed
into law by the Minister of Agriculture and Livestock. (Statutory Instrument No. 85 of 2013, Control of Goods (Import and
Export) (Agriculture) (Prohibition of Exportation) Order 2013, which applies to all exports except to the export of commodities
by (a) the Government of the Republic of Zambia to the Government of another country and (b) the World Food Program.) 37
Keyser (2011).
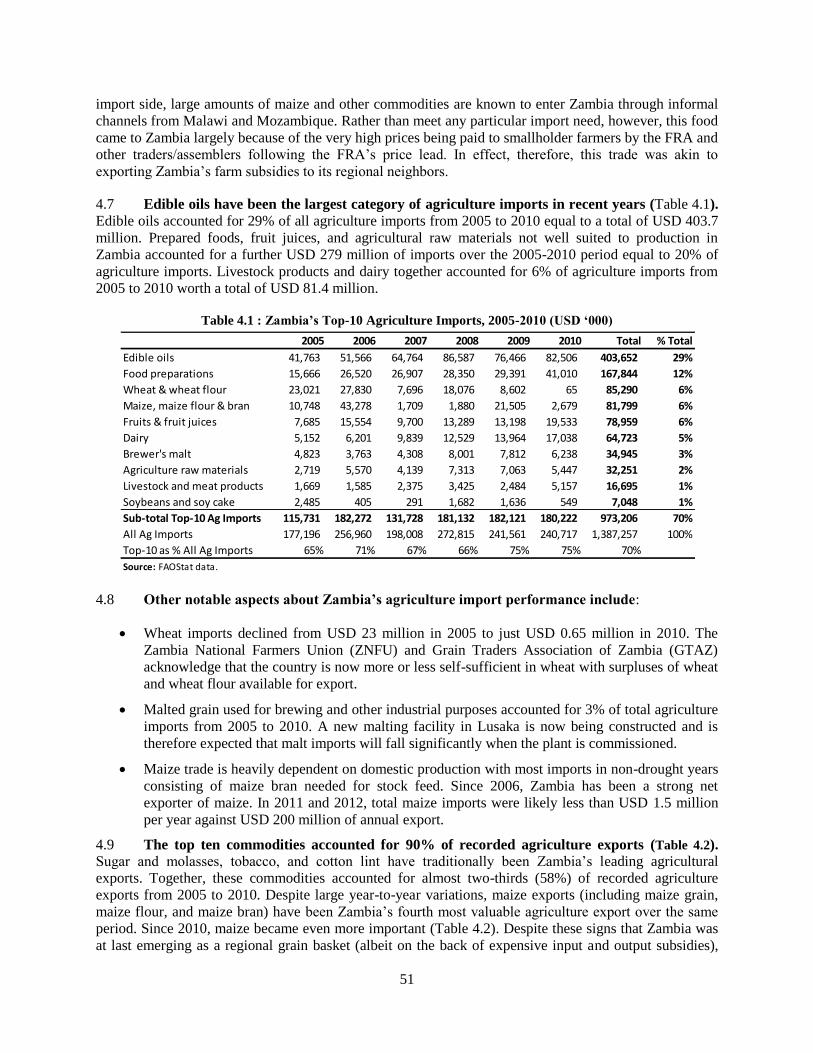
51
import side, large amounts of maize and other commodities are known to enter Zambia through informal
channels from Malawi and Mozambique. Rather than meet any particular import need, however, this food
came to Zambia largely because of the very high prices being paid to smallholder farmers by the FRA and
other traders/assemblers following the FRA’s price lead. In effect, therefore, this trade was akin to
exporting Zambia’s farm subsidies to its regional neighbors.
4.7 Edible oils have been the largest category of agriculture imports in recent years (Table 4.1).
Edible oils accounted for 29% of all agriculture imports from 2005 to 2010 equal to a total of USD 403.7
million. Prepared foods, fruit juices, and agricultural raw materials not well suited to production in
Zambia accounted for a further USD 279 million of imports over the 2005-2010 period equal to 20% of
agriculture imports. Livestock products and dairy together accounted for 6% of agriculture imports from
2005 to 2010 worth a total of USD 81.4 million.
Table 4.1 : Zambia’s Top-10 Agriculture Imports, 2005-2010 (USD ‘000)
4.8 Other notable aspects about Zambia’s agriculture import performance include:
Wheat imports declined from USD 23 million in 2005 to just USD 0.65 million in 2010. The
Zambia National Farmers Union (ZNFU) and Grain Traders Association of Zambia (GTAZ)
acknowledge that the country is now more or less self-sufficient in wheat with surpluses of wheat
and wheat flour available for export.
Malted grain used for brewing and other industrial purposes accounted for 3% of total agriculture
imports from 2005 to 2010. A new malting facility in Lusaka is now being constructed and is
therefore expected that malt imports will fall significantly when the plant is commissioned.
Maize trade is heavily dependent on domestic production with most imports in non-drought years
consisting of maize bran needed for stock feed. Since 2006, Zambia has been a strong net
exporter of maize. In 2011 and 2012, total maize imports were likely less than USD 1.5 million
per year against USD 200 million of annual export.
4.9 The top ten commodities accounted for 90% of recorded agriculture exports (Table 4.2).
Sugar and molasses, tobacco, and cotton lint have traditionally been Zambia’s leading agricultural
exports. Together, these commodities accounted for almost two-thirds (58%) of recorded agriculture
exports from 2005 to 2010. Despite large year-to-year variations, maize exports (including maize grain,
maize flour, and maize bran) have been Zambia’s fourth most valuable agriculture export over the same
period. Since 2010, maize became even more important (Table 4.2). Despite these signs that Zambia was
at last emerging as a regional grain basket (albeit on the back of expensive input and output subsidies),
2005 2006 2007 2008 2009 2010 Total % Total
Edible oils 41,763 51,566 64,764 86,587 76,466 82,506 403,652 29%
Food preparations 15,666 26,520 26,907 28,350 29,391 41,010 167,844 12%
Wheat & wheat flour 23,021 27,830 7,696 18,076 8,602 65 85,290 6%
Maize, maize flour & bran 10,748 43,278 1,709 1,880 21,505 2,679 81,799 6%
Fruits & fruit juices 7,685 15,554 9,700 13,289 13,198 19,533 78,959 6%
Dairy 5,152 6,201 9,839 12,529 13,964 17,038 64,723 5%
Brewer's malt 4,823 3,763 4,308 8,001 7,812 6,238 34,945 3%
Agriculture raw materials 2,719 5,570 4,139 7,313 7,063 5,447 32,251 2%
Livestock and meat products 1,669 1,585 2,375 3,425 2,484 5,157 16,695 1%
Soybeans and soy cake 2,485 405 291 1,682 1,636 549 7,048 1%
Sub-total Top-10 Ag Imports 115,731 182,272 131,728 181,132 182,121 180,222 973,206 70%
All Ag Imports 177,196 256,960 198,008 272,815 241,561 240,717 1,387,257 100%
Top-10 as % All Ag Imports 65% 71% 67% 66% 75% 75% 70%
Source: FAOStat data.
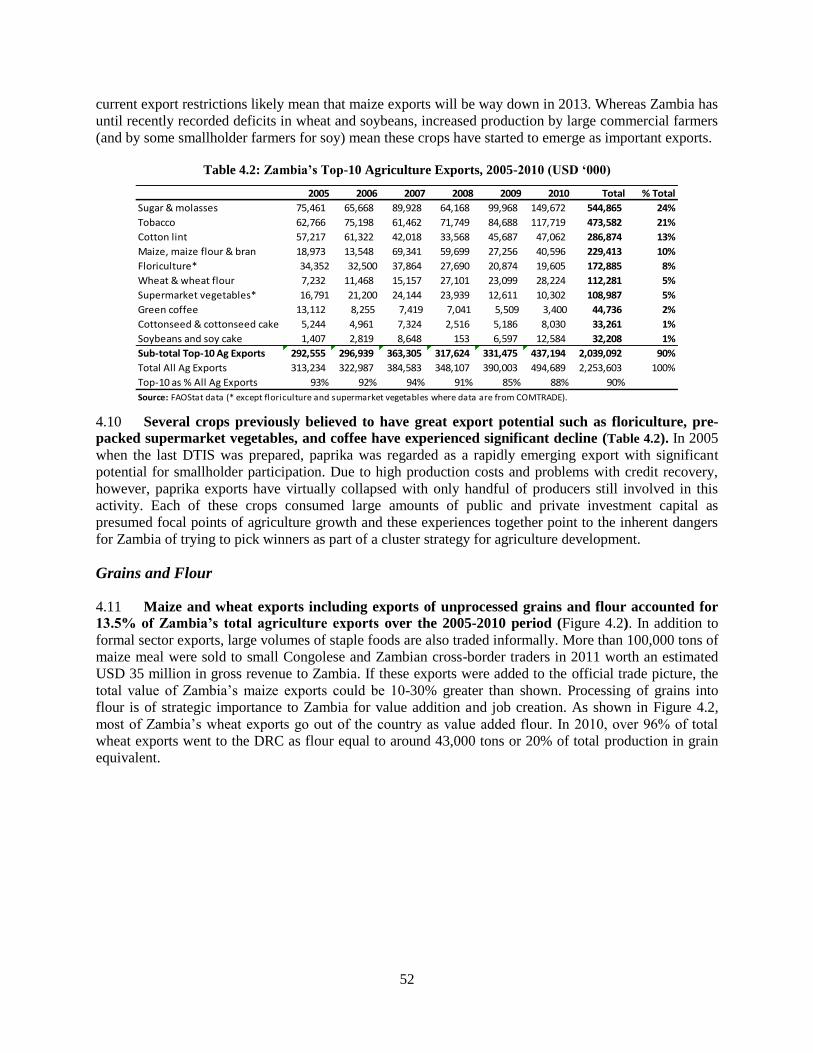
52
current export restrictions likely mean that maize exports will be way down in 2013. Whereas Zambia has
until recently recorded deficits in wheat and soybeans, increased production by large commercial farmers
(and by some smallholder farmers for soy) mean these crops have started to emerge as important exports.
Table 4.2: Zambia’s Top-10 Agriculture Exports, 2005-2010 (USD ‘000)
4.10 Several crops previously believed to have great export potential such as floriculture, pre-
packed supermarket vegetables, and coffee have experienced significant decline (Table 4.2). In 2005
when the last DTIS was prepared, paprika was regarded as a rapidly emerging export with significant
potential for smallholder participation. Due to high production costs and problems with credit recovery,
however, paprika exports have virtually collapsed with only handful of producers still involved in this
activity. Each of these crops consumed large amounts of public and private investment capital as
presumed focal points of agriculture growth and these experiences together point to the inherent dangers
for Zambia of trying to pick winners as part of a cluster strategy for agriculture development.
Grains and Flour
4.11 Maize and wheat exports including exports of unprocessed grains and flour accounted for
13.5% of Zambia’s total agriculture exports over the 2005-2010 period (Figure 4.2). In addition to
formal sector exports, large volumes of staple foods are also traded informally. More than 100,000 tons of
maize meal were sold to small Congolese and Zambian cross-border traders in 2011 worth an estimated
USD 35 million in gross revenue to Zambia. If these exports were added to the official trade picture, the
total value of Zambia’s maize exports could be 10-30% greater than shown. Processing of grains into
flour is of strategic importance to Zambia for value addition and job creation. As shown in Figure 4.2,
most of Zambia’s wheat exports go out of the country as value added flour. In 2010, over 96% of total
wheat exports went to the DRC as flour equal to around 43,000 tons or 20% of total production in grain
equivalent.
2005 2006 2007 2008 2009 2010 Total % Total
Sugar & molasses 75,461 65,668 89,928 64,168 99,968 149,672 544,865 24%
Tobacco 62,766 75,198 61,462 71,749 84,688 117,719 473,582 21%
Cotton lint 57,217 61,322 42,018 33,568 45,687 47,062 286,874 13%
Maize, maize flour & bran 18,973 13,548 69,341 59,699 27,256 40,596 229,413 10%
Floriculture* 34,352 32,500 37,864 27,690 20,874 19,605 172,885 8%
Wheat & wheat flour 7,232 11,468 15,157 27,101 23,099 28,224 112,281 5%
Supermarket vegetables* 16,791 21,200 24,144 23,939 12,611 10,302 108,987 5%
Green coffee 13,112 8,255 7,419 7,041 5,509 3,400 44,736 2%
Cottonseed & cottonseed cake 5,244 4,961 7,324 2,516 5,186 8,030 33,261 1%
Soybeans and soy cake 1,407 2,819 8,648 153 6,597 12,584 32,208 1%
Sub-total Top-10 Ag Exports 292,555 296,939 363,305 317,624 331,475 437,194 2,039,092 90%
Total All Ag Exports 313,234 322,987 384,583 348,107 390,003 494,689 2,253,603 100%
Top-10 as % All Ag Exports 93% 92% 94% 91% 85% 88% 90%
Source: FAOStat data (* except floriculture and supermarket vegetables where data are from COMTRADE).
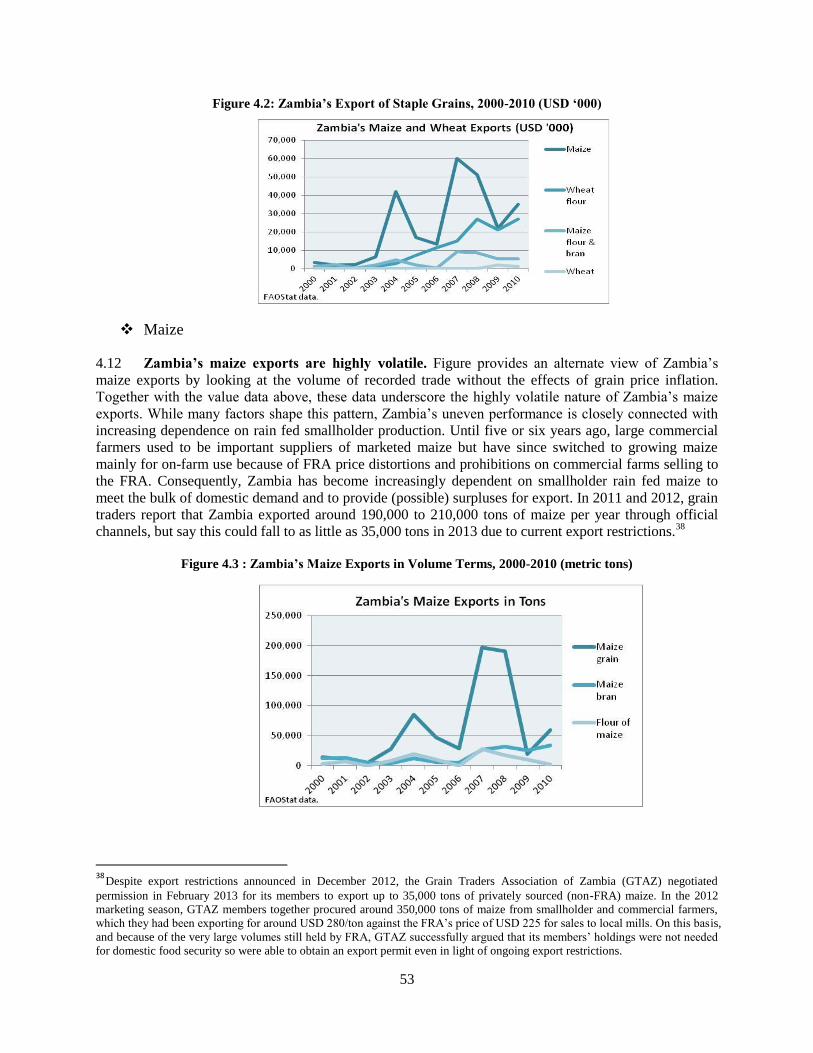
53
Figure 4.2: Zambia’s Export of Staple Grains, 2000-2010 (USD ‘000)
Maize
4.12 Zambia’s maize exports are highly volatile. Figure provides an alternate view of Zambia’s
maize exports by looking at the volume of recorded trade without the effects of grain price inflation.
Together with the value data above, these data underscore the highly volatile nature of Zambia’s maize
exports. While many factors shape this pattern, Zambia’s uneven performance is closely connected with
increasing dependence on rain fed smallholder production. Until five or six years ago, large commercial
farmers used to be important suppliers of marketed maize but have since switched to growing maize
mainly for on-farm use because of FRA price distortions and prohibitions on commercial farms selling to
the FRA. Consequently, Zambia has become increasingly dependent on smallholder rain fed maize to
meet the bulk of domestic demand and to provide (possible) surpluses for export. In 2011 and 2012, grain
traders report that Zambia exported around 190,000 to 210,000 tons of maize per year through official
channels, but say this could fall to as little as 35,000 tons in 2013 due to current export restrictions.38
Figure 4.3 : Zambia’s Maize Exports in Volume Terms, 2000-2010 (metric tons)
38
Despite export restrictions announced in December 2012, the Grain Traders Association of Zambia (GTAZ) negotiated
permission in February 2013 for its members to export up to 35,000 tons of privately sourced (non-FRA) maize. In the 2012
marketing season, GTAZ members together procured around 350,000 tons of maize from smallholder and commercial farmers,
which they had been exporting for around USD 280/ton against the FRA’s price of USD 225 for sales to local mills. On this basis,
and because of the very large volumes still held by FRA, GTAZ successfully argued that its members’ holdings were not needed
for domestic food security so were able to obtain an export permit even in light of ongoing export restrictions.
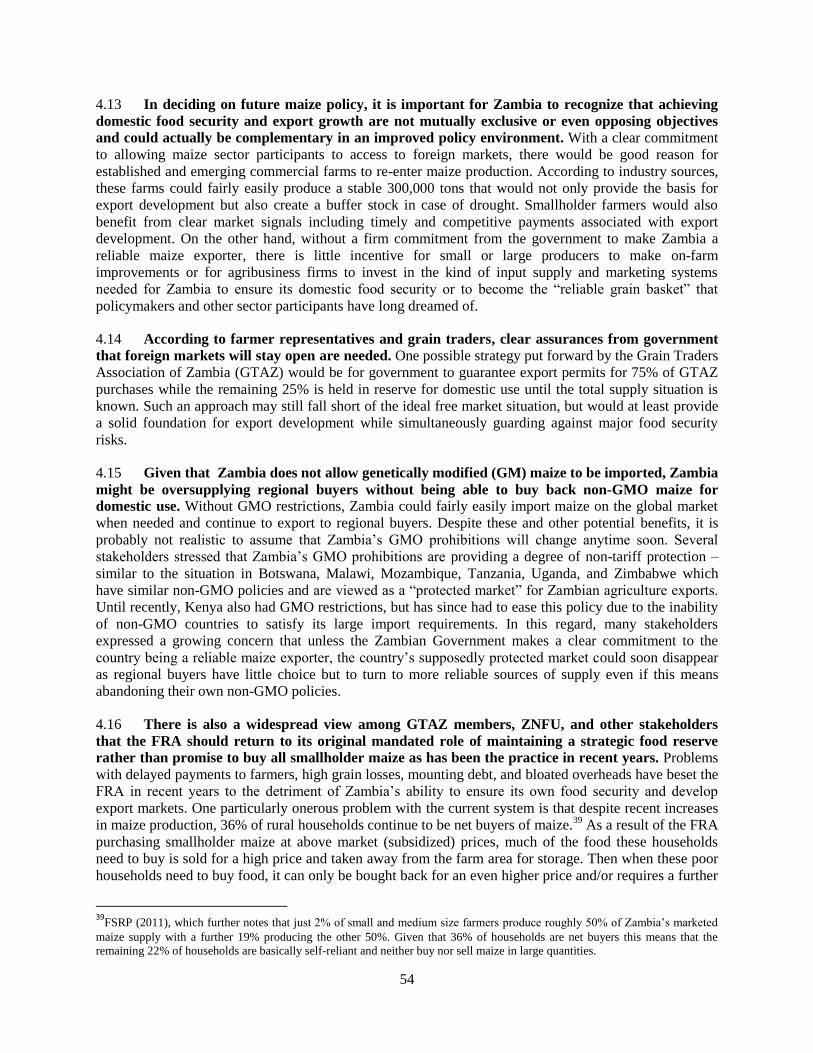
54
4.13 In deciding on future maize policy, it is important for Zambia to recognize that achieving
domestic food security and export growth are not mutually exclusive or even opposing objectives
and could actually be complementary in an improved policy environment. With a clear commitment
to allowing maize sector participants to access to foreign markets, there would be good reason for
established and emerging commercial farms to re-enter maize production. According to industry sources,
these farms could fairly easily produce a stable 300,000 tons that would not only provide the basis for
export development but also create a buffer stock in case of drought. Smallholder farmers would also
benefit from clear market signals including timely and competitive payments associated with export
development. On the other hand, without a firm commitment from the government to make Zambia a
reliable maize exporter, there is little incentive for small or large producers to make on-farm
improvements or for agribusiness firms to invest in the kind of input supply and marketing systems
needed for Zambia to ensure its domestic food security or to become the “reliable grain basket” that
policymakers and other sector participants have long dreamed of.
4.14 According to farmer representatives and grain traders, clear assurances from government
that foreign markets will stay open are needed. One possible strategy put forward by the Grain Traders
Association of Zambia (GTAZ) would be for government to guarantee export permits for 75% of GTAZ
purchases while the remaining 25% is held in reserve for domestic use until the total supply situation is
known. Such an approach may still fall short of the ideal free market situation, but would at least provide
a solid foundation for export development while simultaneously guarding against major food security
risks.
4.15 Given that Zambia does not allow genetically modified (GM) maize to be imported, Zambia
might be oversupplying regional buyers without being able to buy back non-GMO maize for
domestic use. Without GMO restrictions, Zambia could fairly easily import maize on the global market
when needed and continue to export to regional buyers. Despite these and other potential benefits, it is
probably not realistic to assume that Zambia’s GMO prohibitions will change anytime soon. Several
stakeholders stressed that Zambia’s GMO prohibitions are providing a degree of non-tariff protection –
similar to the situation in Botswana, Malawi, Mozambique, Tanzania, Uganda, and Zimbabwe which
have similar non-GMO policies and are viewed as a “protected market” for Zambian agriculture exports.
Until recently, Kenya also had GMO restrictions, but has since had to ease this policy due to the inability
of non-GMO countries to satisfy its large import requirements. In this regard, many stakeholders
expressed a growing concern that unless the Zambian Government makes a clear commitment to the
country being a reliable maize exporter, the country’s supposedly protected market could soon disappear
as regional buyers have little choice but to turn to more reliable sources of supply even if this means
abandoning their own non-GMO policies.
4.16 There is also a widespread view among GTAZ members, ZNFU, and other stakeholders
that the FRA should return to its original mandated role of maintaining a strategic food reserve
rather than promise to buy all smallholder maize as has been the practice in recent years. Problems
with delayed payments to farmers, high grain losses, mounting debt, and bloated overheads have beset the
FRA in recent years to the detriment of Zambia’s ability to ensure its own food security and develop
export markets. One particularly onerous problem with the current system is that despite recent increases
in maize production, 36% of rural households continue to be net buyers of maize.39
As a result of the FRA
purchasing smallholder maize at above market (subsidized) prices, much of the food these households
need to buy is sold for a high price and taken away from the farm area for storage. Then when these poor
households need to buy food, it can only be bought back for an even higher price and/or requires a further
39
FSRP (2011), which further notes that just 2% of small and medium size farmers produce roughly 50% of Zambia’s marketed
maize supply with a further 19% producing the other 50%. Given that 36% of households are net buyers this means that the
remaining 22% of households are basically self-reliant and neither buy nor sell maize in large quantities.
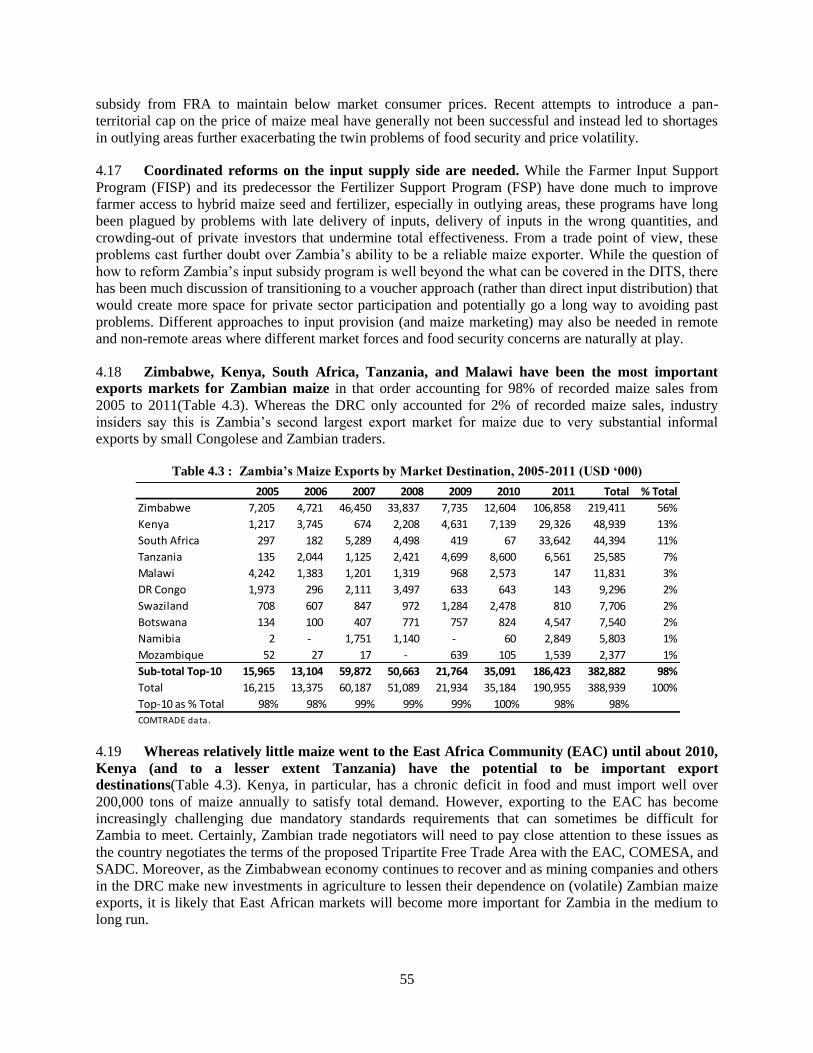
55
subsidy from FRA to maintain below market consumer prices. Recent attempts to introduce a pan-
territorial cap on the price of maize meal have generally not been successful and instead led to shortages
in outlying areas further exacerbating the twin problems of food security and price volatility.
4.17 Coordinated reforms on the input supply side are needed. While the Farmer Input Support
Program (FISP) and its predecessor the Fertilizer Support Program (FSP) have done much to improve
farmer access to hybrid maize seed and fertilizer, especially in outlying areas, these programs have long
been plagued by problems with late delivery of inputs, delivery of inputs in the wrong quantities, and
crowding-out of private investors that undermine total effectiveness. From a trade point of view, these
problems cast further doubt over Zambia’s ability to be a reliable maize exporter. While the question of
how to reform Zambia’s input subsidy program is well beyond the what can be covered in the DITS, there
has been much discussion of transitioning to a voucher approach (rather than direct input distribution) that
would create more space for private sector participation and potentially go a long way to avoiding past
problems. Different approaches to input provision (and maize marketing) may also be needed in remote
and non-remote areas where different market forces and food security concerns are naturally at play.
4.18 Zimbabwe, Kenya, South Africa, Tanzania, and Malawi have been the most important
exports markets for Zambian maize in that order accounting for 98% of recorded maize sales from
2005 to 2011(Table 4.3). Whereas the DRC only accounted for 2% of recorded maize sales, industry
insiders say this is Zambia’s second largest export market for maize due to very substantial informal
exports by small Congolese and Zambian traders.
Table 4.3 : Zambia’s Maize Exports by Market Destination, 2005-2011 (USD ‘000)
4.19 Whereas relatively little maize went to the East Africa Community (EAC) until about 2010,
Kenya (and to a lesser extent Tanzania) have the potential to be important export
destinations(Table 4.3). Kenya, in particular, has a chronic deficit in food and must import well over
200,000 tons of maize annually to satisfy total demand. However, exporting to the EAC has become
increasingly challenging due mandatory standards requirements that can sometimes be difficult for
Zambia to meet. Certainly, Zambian trade negotiators will need to pay close attention to these issues as
the country negotiates the terms of the proposed Tripartite Free Trade Area with the EAC, COMESA, and
SADC. Moreover, as the Zimbabwean economy continues to recover and as mining companies and others
in the DRC make new investments in agriculture to lessen their dependence on (volatile) Zambian maize
exports, it is likely that East African markets will become more important for Zambia in the medium to
long run.
2005 2006 2007 2008 2009 2010 2011 Total % Total
Zimbabwe 7,205 4,721 46,450 33,837 7,735 12,604 106,858 219,411 56%
Kenya 1,217 3,745 674 2,208 4,631 7,139 29,326 48,939 13%
South Africa 297 182 5,289 4,498 419 67 33,642 44,394 11%
Tanzania 135 2,044 1,125 2,421 4,699 8,600 6,561 25,585 7%
Malawi 4,242 1,383 1,201 1,319 968 2,573 147 11,831 3%
DR Congo 1,973 296 2,111 3,497 633 643 143 9,296 2%
Swaziland 708 607 847 972 1,284 2,478 810 7,706 2%
Botswana 134 100 407 771 757 824 4,547 7,540 2%
Namibia 2 - 1,751 1,140 - 60 2,849 5,803 1%
Mozambique 52 27 17 - 639 105 1,539 2,377 1%
Sub-total Top-10 15,965 13,104 59,872 50,663 21,764 35,091 186,423 382,882 98%
Total 16,215 13,375 60,187 51,089 21,934 35,184 190,955 388,939 100%
Top-10 as % Total 98% 98% 99% 99% 99% 100% 98% 98%
COMTRADE data.
56
4.20 Given that Zambia’s trade competitiveness in maize depends heavily on total transport and
handling costs between the farm and terminal market, the country enjoys a strong comparative
advantage in growing maize for export in non-remote areas.40
Simple crop budget analysis based on
commercial (unsubsidized) seed and fertilizer prices shows that it currently costs around USD 120-140 to
produce a ton of maize on smallholder farms (with yields from 1.5 to 2.0 tons/ha) and around USD 80-90
per ton on large mechanized farms (with yields from 7 to 10 tons/ha). Primary assembly (including
transport from the farm to a regional depot, a few months of storage, and preparation of export
documentation) costs around USD 30-40 per ton for smallholder maize giving a total accumulated
shipment value for export ready grain excluding profits paid to farmers and traders of USD 150-180/ton.
For large commercial farmers, assembly costs are lower at USD 15-20/ton giving in an accumulated
shipment value of just USD 95-110/ton excluding producer and trader profits. These total cost estimates
do not include storage losses and other inefficiencies in the FRA marketing system, but compare
favorably with regional market prices of around USD 350/ton cif Harare or USD 290/ton fob Lusaka after
subtracting the cost of international transport and border procedures.
Wheat
4.21 Wheat is grown almost exclusively by large commercial farmers as an irrigated winter crop.
Zambia’s deficit in wheat has been reversed in2009 with increasingly large surpluses now available for
export. Over 96% of this surplus has been sold to the DRC as value added wheat flour. Total production
currently stands at around 240,000 to 250,000 tons against 220,000 to 230,000 tons total demand. In
2009, when the country first achieved self-sufficiency, total production was around 195,000 tons.41
4.22 The steady growth in Zambian wheat production has been artificially assisted by high
tariffs and trade restrictions. In 2009 when the country became self-sufficient, government instituted a
ban on wheat imports that remains in place today. The ZNFU has been a strong advocate of this policy,
stressing that it is needed to protect Zambian farmers so that the industry can grow. On the other hand,
wheat is now the third most widely consumed staple food in Zambia (after maize and cassava) and this
policy has started to attract negative attention in the face of rising bread prices. Looking to the future,
there may soon come a time when the trade ban can no longer be justified – at least not on infant industry
grounds – and dialogue with ZNFU and other wheat sector stakeholders on the conditions needed for a
transition to a more liberal trade environment could become necessary for continued steady growth of
consumer demand and the wheat sector more generally. Without exposure to international competition,
there is a risk of Zambian farmers relying “too much” on market protection and not making the kinds of
investment needed to develop exports or to deliver affordable food to the growing urban population.
Other grains and staple foods
4.23 Cassava is the second most widely consumed staple in Zambia and is especially important in
northern and northwestern parts of the country. Most production is used at the household level with
almost no industrial processing or formal sector trade. As a bulky commodity with generally low value to
weight ratio, value addition of cassava into cassava chips, pellets, or starch is generally required for
international trade. Some small quantities of cassava are traded domestically across districts and
provinces and, at times, to neighboring DRC. Potential exists for cassava to become an ingredient in stock
feed, but until now there has not been any serious investment to develop this supply chain. One problem
that would have to be overcome in developing this business is that the main cassava growing areas are
very far from where most commercial livestock are raised.
40 See, for example, Morris, et. al, 2009; Keyser, 2008. 41
Chapoto, et. al., 2010.
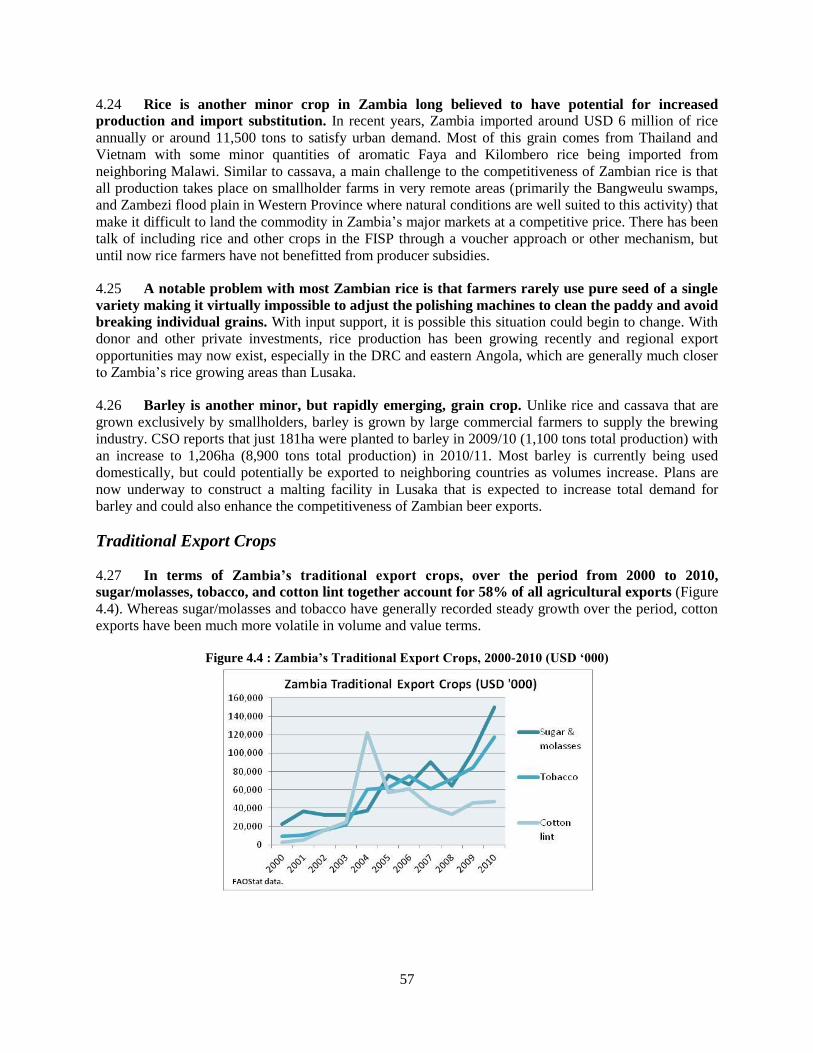
57
4.24 Rice is another minor crop in Zambia long believed to have potential for increased
production and import substitution. In recent years, Zambia imported around USD 6 million of rice
annually or around 11,500 tons to satisfy urban demand. Most of this grain comes from Thailand and
Vietnam with some minor quantities of aromatic Faya and Kilombero rice being imported from
neighboring Malawi. Similar to cassava, a main challenge to the competitiveness of Zambian rice is that
all production takes place on smallholder farms in very remote areas (primarily the Bangweulu swamps,
and Zambezi flood plain in Western Province where natural conditions are well suited to this activity) that
make it difficult to land the commodity in Zambia’s major markets at a competitive price. There has been
talk of including rice and other crops in the FISP through a voucher approach or other mechanism, but
until now rice farmers have not benefitted from producer subsidies.
4.25 A notable problem with most Zambian rice is that farmers rarely use pure seed of a single
variety making it virtually impossible to adjust the polishing machines to clean the paddy and avoid
breaking individual grains. With input support, it is possible this situation could begin to change. With
donor and other private investments, rice production has been growing recently and regional export
opportunities may now exist, especially in the DRC and eastern Angola, which are generally much closer
to Zambia’s rice growing areas than Lusaka.
4.26 Barley is another minor, but rapidly emerging, grain crop. Unlike rice and cassava that are
grown exclusively by smallholders, barley is grown by large commercial farmers to supply the brewing
industry. CSO reports that just 181ha were planted to barley in 2009/10 (1,100 tons total production) with
an increase to 1,206ha (8,900 tons total production) in 2010/11. Most barley is currently being used
domestically, but could potentially be exported to neighboring countries as volumes increase. Plans are
now underway to construct a malting facility in Lusaka that is expected to increase total demand for
barley and could also enhance the competitiveness of Zambian beer exports.
Traditional Export Crops
4.27 In terms of Zambia’s traditional export crops, over the period from 2000 to 2010,
sugar/molasses, tobacco, and cotton lint together account for 58% of all agricultural exports (Figure
4.4). Whereas sugar/molasses and tobacco have generally recorded steady growth over the period, cotton
exports have been much more volatile in volume and value terms.
Figure 4.4 : Zambia’s Traditional Export Crops, 2000-2010 (USD ‘000)
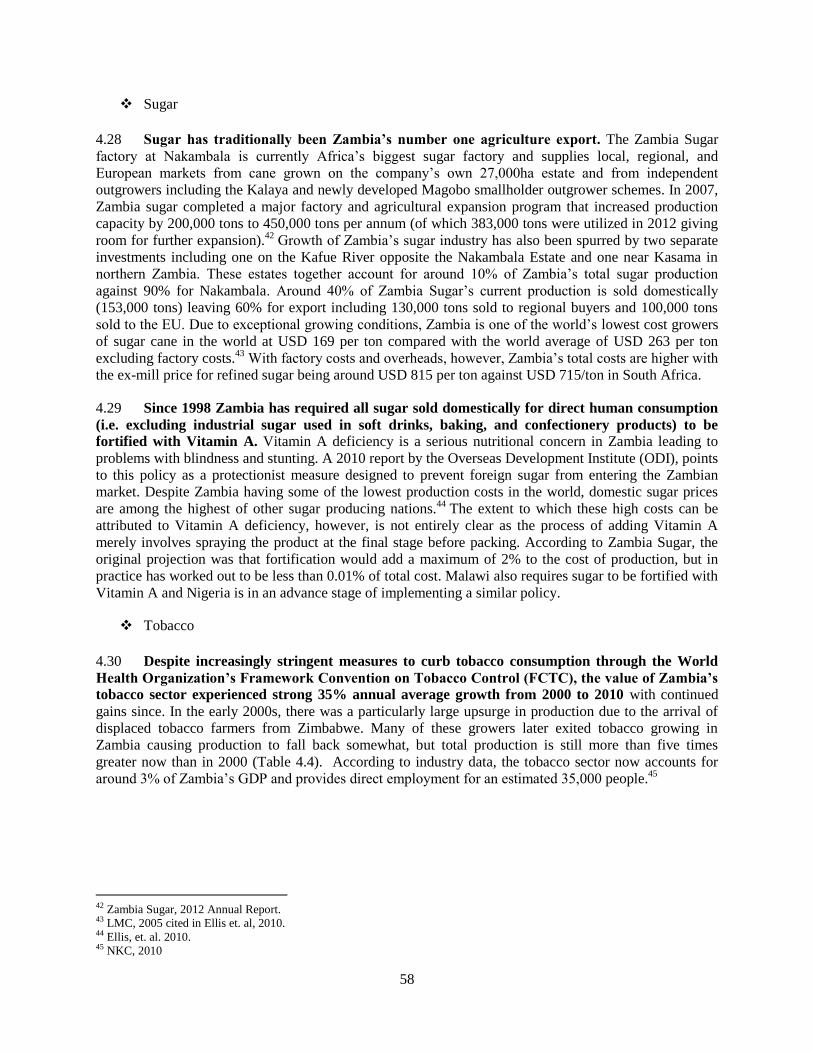
58
Sugar
4.28 Sugar has traditionally been Zambia’s number one agriculture export. The Zambia Sugar
factory at Nakambala is currently Africa’s biggest sugar factory and supplies local, regional, and
European markets from cane grown on the company’s own 27,000ha estate and from independent
outgrowers including the Kalaya and newly developed Magobo smallholder outgrower schemes. In 2007,
Zambia sugar completed a major factory and agricultural expansion program that increased production
capacity by 200,000 tons to 450,000 tons per annum (of which 383,000 tons were utilized in 2012 giving
room for further expansion).42
Growth of Zambia’s sugar industry has also been spurred by two separate
investments including one on the Kafue River opposite the Nakambala Estate and one near Kasama in
northern Zambia. These estates together account for around 10% of Zambia’s total sugar production
against 90% for Nakambala. Around 40% of Zambia Sugar’s current production is sold domestically
(153,000 tons) leaving 60% for export including 130,000 tons sold to regional buyers and 100,000 tons
sold to the EU. Due to exceptional growing conditions, Zambia is one of the world’s lowest cost growers
of sugar cane in the world at USD 169 per ton compared with the world average of USD 263 per ton
excluding factory costs.43
With factory costs and overheads, however, Zambia’s total costs are higher with
the ex-mill price for refined sugar being around USD 815 per ton against USD 715/ton in South Africa.
4.29 Since 1998 Zambia has required all sugar sold domestically for direct human consumption
(i.e. excluding industrial sugar used in soft drinks, baking, and confectionery products) to be
fortified with Vitamin A. Vitamin A deficiency is a serious nutritional concern in Zambia leading to
problems with blindness and stunting. A 2010 report by the Overseas Development Institute (ODI), points
to this policy as a protectionist measure designed to prevent foreign sugar from entering the Zambian
market. Despite Zambia having some of the lowest production costs in the world, domestic sugar prices
are among the highest of other sugar producing nations.44
The extent to which these high costs can be
attributed to Vitamin A deficiency, however, is not entirely clear as the process of adding Vitamin A
merely involves spraying the product at the final stage before packing. According to Zambia Sugar, the
original projection was that fortification would add a maximum of 2% to the cost of production, but in
practice has worked out to be less than 0.01% of total cost. Malawi also requires sugar to be fortified with
Vitamin A and Nigeria is in an advance stage of implementing a similar policy.
Tobacco
4.30 Despite increasingly stringent measures to curb tobacco consumption through the World
Health Organization’s Framework Convention on Tobacco Control (FCTC), the value of Zambia’s
tobacco sector experienced strong 35% annual average growth from 2000 to 2010 with continued
gains since. In the early 2000s, there was a particularly large upsurge in production due to the arrival of
displaced tobacco farmers from Zimbabwe. Many of these growers later exited tobacco growing in
Zambia causing production to fall back somewhat, but total production is still more than five times
greater now than in 2000 (Table 4.4). According to industry data, the tobacco sector now accounts for
around 3% of Zambia’s GDP and provides direct employment for an estimated 35,000 people.45
42 Zambia Sugar, 2012 Annual Report. 43 LMC, 2005 cited in Ellis et. al, 2010. 44 Ellis, et. al. 2010. 45 NKC, 2010
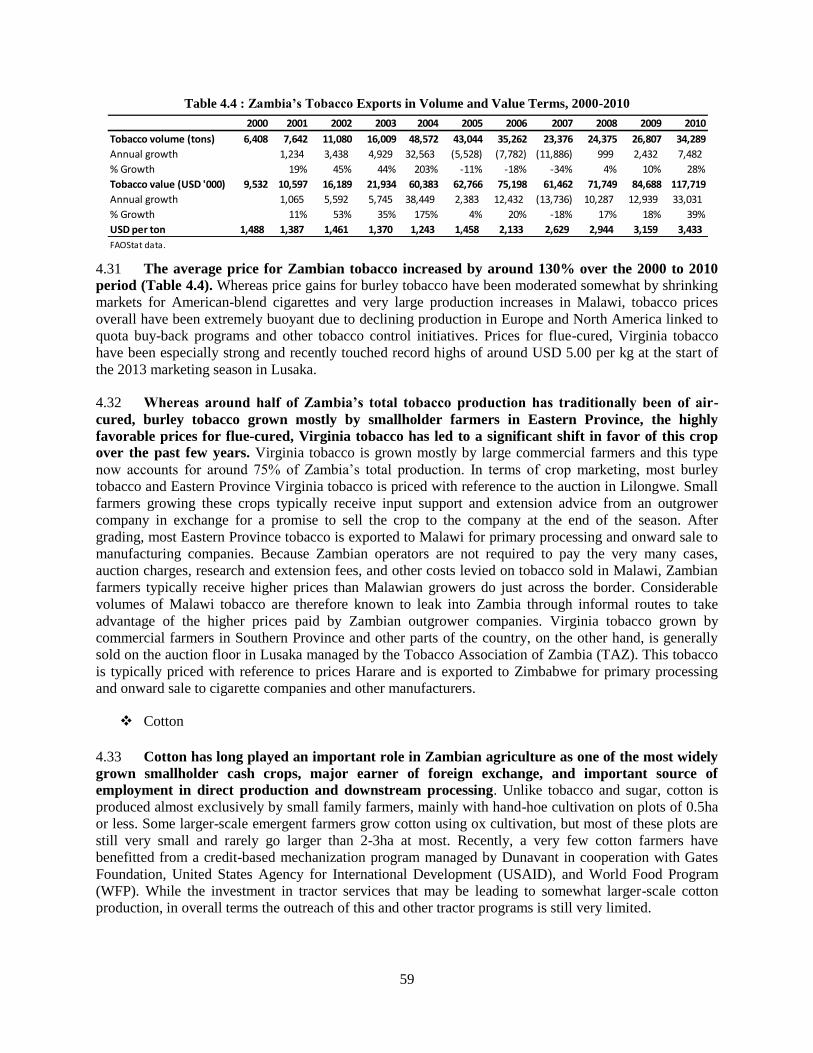
59
Table 4.4 : Zambia’s Tobacco Exports in Volume and Value Terms, 2000-2010
4.31 The average price for Zambian tobacco increased by around 130% over the 2000 to 2010
period (Table 4.4). Whereas price gains for burley tobacco have been moderated somewhat by shrinking
markets for American-blend cigarettes and very large production increases in Malawi, tobacco prices
overall have been extremely buoyant due to declining production in Europe and North America linked to
quota buy-back programs and other tobacco control initiatives. Prices for flue-cured, Virginia tobacco
have been especially strong and recently touched record highs of around USD 5.00 per kg at the start of
the 2013 marketing season in Lusaka.
4.32 Whereas around half of Zambia’s total tobacco production has traditionally been of air-
cured, burley tobacco grown mostly by smallholder farmers in Eastern Province, the highly
favorable prices for flue-cured, Virginia tobacco has led to a significant shift in favor of this crop
over the past few years. Virginia tobacco is grown mostly by large commercial farmers and this type
now accounts for around 75% of Zambia’s total production. In terms of crop marketing, most burley
tobacco and Eastern Province Virginia tobacco is priced with reference to the auction in Lilongwe. Small
farmers growing these crops typically receive input support and extension advice from an outgrower
company in exchange for a promise to sell the crop to the company at the end of the season. After
grading, most Eastern Province tobacco is exported to Malawi for primary processing and onward sale to
manufacturing companies. Because Zambian operators are not required to pay the very many cases,
auction charges, research and extension fees, and other costs levied on tobacco sold in Malawi, Zambian
farmers typically receive higher prices than Malawian growers do just across the border. Considerable
volumes of Malawi tobacco are therefore known to leak into Zambia through informal routes to take
advantage of the higher prices paid by Zambian outgrower companies. Virginia tobacco grown by
commercial farmers in Southern Province and other parts of the country, on the other hand, is generally
sold on the auction floor in Lusaka managed by the Tobacco Association of Zambia (TAZ). This tobacco
is typically priced with reference to prices Harare and is exported to Zimbabwe for primary processing
and onward sale to cigarette companies and other manufacturers.
Cotton
4.33 Cotton has long played an important role in Zambian agriculture as one of the most widely
grown smallholder cash crops, major earner of foreign exchange, and important source of
employment in direct production and downstream processing. Unlike tobacco and sugar, cotton is
produced almost exclusively by small family farmers, mainly with hand-hoe cultivation on plots of 0.5ha
or less. Some larger-scale emergent farmers grow cotton using ox cultivation, but most of these plots are
still very small and rarely go larger than 2-3ha at most. Recently, a very few cotton farmers have
benefitted from a credit-based mechanization program managed by Dunavant in cooperation with Gates
Foundation, United States Agency for International Development (USAID), and World Food Program
(WFP). While the investment in tractor services that may be leading to somewhat larger-scale cotton
production, in overall terms the outreach of this and other tractor programs is still very limited.
2000 2001 2002 2003 2004 2005 2006 2007 2008 2009 2010
Tobacco volume (tons) 6,408 7,642 11,080 16,009 48,572 43,044 35,262 23,376 24,375 26,807 34,289
Annual growth 1,234 3,438 4,929 32,563 (5,528) (7,782) (11,886) 999 2,432 7,482
% Growth 19% 45% 44% 203% -11% -18% -34% 4% 10% 28%
Tobacco value (USD '000) 9,532 10,597 16,189 21,934 60,383 62,766 75,198 61,462 71,749 84,688 117,719
Annual growth 1,065 5,592 5,745 38,449 2,383 12,432 (13,736) 10,287 12,939 33,031
% Growth 11% 53% 35% 175% 4% 20% -18% 17% 18% 39%
USD per ton 1,488 1,387 1,461 1,370 1,243 1,458 2,133 2,629 2,944 3,159 3,433
FAOStat data.
60
4.34 Compared with other traditional agriculture exports, performance in the cotton sector has
been relatively uneven. While total lint production in 2010 was more than 5-times times greater than the
average production from 2000-2002, export volumes have fallen by more than 50% from recent peaks in
the mid-2000s (see Table 4.5).
4.35 Cotton prices have also been volatile with large increases and decreases from year to year
linked to global demand and competition from other cotton producing countries. This was a
particular issue in the most recent 2012 marketing season when the farm gate price for un-ginned seed
cotton fell by almost half to ZMK 1,650 per kg (USD 0.32) from ZMK 3,200 per kg (USD 0.66) in 2011.
These unstable price conditions in turn exacerbate production swings in that large numbers of growers
can be attracted to cotton following a year with high prices only to become discouraged and leave cotton
after a season or two when prices are low. Price swings therefore are not only a major risk to farmers, but
can also have a serious impact on the profitability of cotton ginning and lead to forestalled investments in
new equipment and other process improvements. Until the late 1990s, large-scale commercial farmers
sometimes grew long-staple, irrigated cotton on extensive parcels, but this system has since been
abandoned and the only cotton grown by the large commercial farm sector today is as a seed crop.
Dunavant, the largest ginning company in the country, for example, operates its own estate farm, but this
is not considered a core business for anything other than seed production.
Table 4.5: Zambia’s Exports of Cotton Lint in Volume and Value Terms, 2000-2010.
4.36 As a smallholder crop that requires chemical application for pest control, cotton production
has depended on outgrower support to provide farmers with insecticides and improved seeds. Such
programs, however, are inherently prone to the risk of side selling by farmers seeking to avoid paying
back their input loan. To cope with this risk, Dunavant Cotton developed a system of working with local
distributors who are made responsible for organizing and monitoring other farmers in their area. The
distributor receives a bonus for their service and works as the collection agent for seed cotton so is in a
strong position to track production and ensure payback. Within the past few years, Dunavant has added
support for maize and soybeans as part of its smallholder cotton program. Soybeans are regarded as a
good rotation crop with cotton since they help to improve soil fertility and maize is important for
household food security. In 2012, Dunavant provided support to approximately 170,000 smallholder
farmers through 1,700 village-based distributors.
4.37 Despite good progress with development of outgrower schemes and smallholder supply
networks, cotton yields in Zambia remain low compared to world and even other African
standards. While there has been good improvement since the early-2000s when cotton yields were
around 600kg per hectare on most smallholder farms, current average yields are still only around 800-
900kg per hectare, which is very low compared with Cameroon, Mali, and other West African countries
where smallholders often achieve yields of 1,200kg/ha or more. Reasons for the low yields in Zambia
relate to late planting date by smallholder farmers who prefer to sow maize first, limited attention to weed
control, and poor timing of chemical application. Small farmers in Zambia almost never use fertilizer on
cotton although yields could improve substantially with only 2-3 bags of basal fertilizer per hectare.
2000 2001 2002 2003 2004 2005 2006 2007 2008 2009 2010
Lint volume (tons) 2,510 4,694 12,681 27,765 100,003 54,284 53,294 36,266 22,743 37,780 33,690
Annual growth 2,184 7,987 15,084 72,238 (45,719) (990) (17,028) (13,523) 15,037 (4,090)
% Growth 87% 170% 119% 260% -46% -2% -32% -37% 66% -11%
Lint value (USD '000) 2,612 5,258 16,134 24,717 122,317 57,217 61,322 42,018 33,568 45,687 47,062
Annual growth 2,646 10,876 8,583 97,600 (65,100) 4,105 (19,304) (8,450) 12,119 1,375
% Growth 101% 207% 53% 395% -53% 7% -31% -20% 36% 3%
USD per ton 1,041 1,120 1,272 890 1,223 1,054 1,151 1,159 1,476 1,209 1,397
FAOStat data.
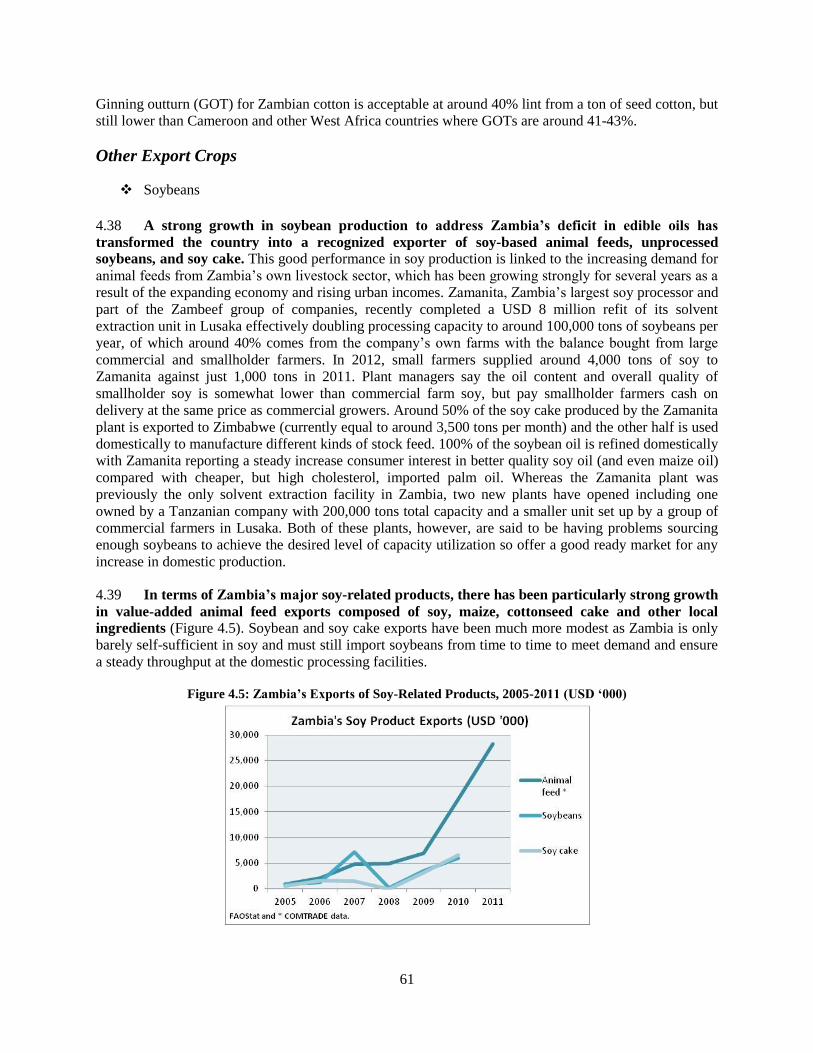
61
Ginning outturn (GOT) for Zambian cotton is acceptable at around 40% lint from a ton of seed cotton, but
still lower than Cameroon and other West Africa countries where GOTs are around 41-43%.
Other Export Crops
Soybeans
4.38 A strong growth in soybean production to address Zambia’s deficit in edible oils has
transformed the country into a recognized exporter of soy-based animal feeds, unprocessed
soybeans, and soy cake. This good performance in soy production is linked to the increasing demand for
animal feeds from Zambia’s own livestock sector, which has been growing strongly for several years as a
result of the expanding economy and rising urban incomes. Zamanita, Zambia’s largest soy processor and
part of the Zambeef group of companies, recently completed a USD 8 million refit of its solvent
extraction unit in Lusaka effectively doubling processing capacity to around 100,000 tons of soybeans per
year, of which around 40% comes from the company’s own farms with the balance bought from large
commercial and smallholder farmers. In 2012, small farmers supplied around 4,000 tons of soy to
Zamanita against just 1,000 tons in 2011. Plant managers say the oil content and overall quality of
smallholder soy is somewhat lower than commercial farm soy, but pay smallholder farmers cash on
delivery at the same price as commercial growers. Around 50% of the soy cake produced by the Zamanita
plant is exported to Zimbabwe (currently equal to around 3,500 tons per month) and the other half is used
domestically to manufacture different kinds of stock feed. 100% of the soybean oil is refined domestically
with Zamanita reporting a steady increase consumer interest in better quality soy oil (and even maize oil)
compared with cheaper, but high cholesterol, imported palm oil. Whereas the Zamanita plant was
previously the only solvent extraction facility in Zambia, two new plants have opened including one
owned by a Tanzanian company with 200,000 tons total capacity and a smaller unit set up by a group of
commercial farmers in Lusaka. Both of these plants, however, are said to be having problems sourcing
enough soybeans to achieve the desired level of capacity utilization so offer a good ready market for any
increase in domestic production.
4.39 In terms of Zambia’s major soy-related products, there has been particularly strong growth
in value-added animal feed exports composed of soy, maize, cottonseed cake and other local
ingredients (Figure 4.5). Soybean and soy cake exports have been much more modest as Zambia is only
barely self-sufficient in soy and must still import soybeans from time to time to meet demand and ensure
a steady throughput at the domestic processing facilities.
Figure 4.5: Zambia’s Exports of Soy-Related Products, 2005-2011 (USD ‘000)
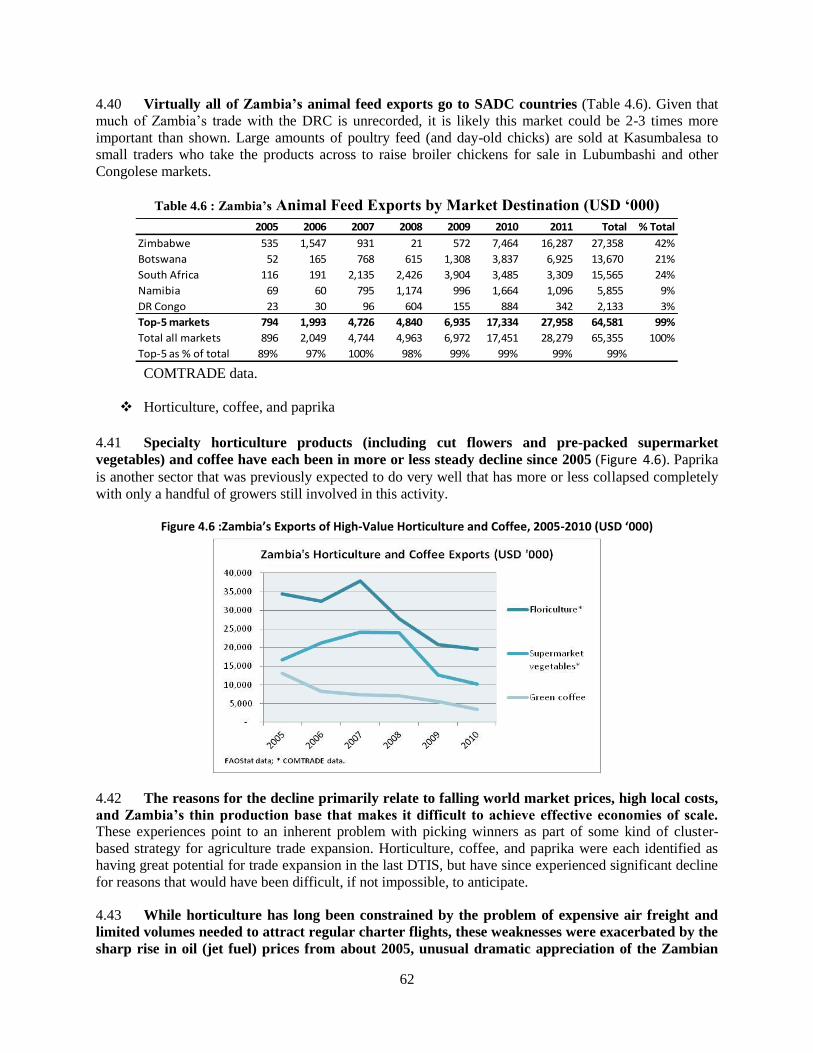
62
4.40 Virtually all of Zambia’s animal feed exports go to SADC countries (Table 4.6). Given that
much of Zambia’s trade with the DRC is unrecorded, it is likely this market could be 2-3 times more
important than shown. Large amounts of poultry feed (and day-old chicks) are sold at Kasumbalesa to
small traders who take the products across to raise broiler chickens for sale in Lubumbashi and other
Congolese markets.
Table 4.6 : Zambia’s Animal Feed Exports by Market Destination (USD ‘000)
COMTRADE data.
Horticulture, coffee, and paprika
4.41 Specialty horticulture products (including cut flowers and pre-packed supermarket
vegetables) and coffee have each been in more or less steady decline since 2005 (Figure 4.6). Paprika
is another sector that was previously expected to do very well that has more or less collapsed completely
with only a handful of growers still involved in this activity.
Figure 4.6 :Zambia’s Exports of High-Value Horticulture and Coffee, 2005-2010 (USD ‘000)
4.42 The reasons for the decline primarily relate to falling world market prices, high local costs,
and Zambia’s thin production base that makes it difficult to achieve effective economies of scale. These experiences point to an inherent problem with picking winners as part of some kind of cluster-
based strategy for agriculture trade expansion. Horticulture, coffee, and paprika were each identified as
having great potential for trade expansion in the last DTIS, but have since experienced significant decline
for reasons that would have been difficult, if not impossible, to anticipate.
4.43 While horticulture has long been constrained by the problem of expensive air freight and
limited volumes needed to attract regular charter flights, these weaknesses were exacerbated by the
sharp rise in oil (jet fuel) prices from about 2005, unusual dramatic appreciation of the Zambian
2005 2006 2007 2008 2009 2010 2011 Total % Total
Zimbabwe 535 1,547 931 21 572 7,464 16,287 27,358 42%
Botswana 52 165 768 615 1,308 3,837 6,925 13,670 21%
South Africa 116 191 2,135 2,426 3,904 3,485 3,309 15,565 24%
Namibia 69 60 795 1,174 996 1,664 1,096 5,855 9%
DR Congo 23 30 96 604 155 884 342 2,133 3%
Top-5 markets 794 1,993 4,726 4,840 6,935 17,334 27,958 64,581 99%
Total all markets 896 2,049 4,744 4,963 6,972 17,451 28,279 65,355 100%
Top-5 as % of total 89% 97% 100% 98% 99% 99% 99% 99%
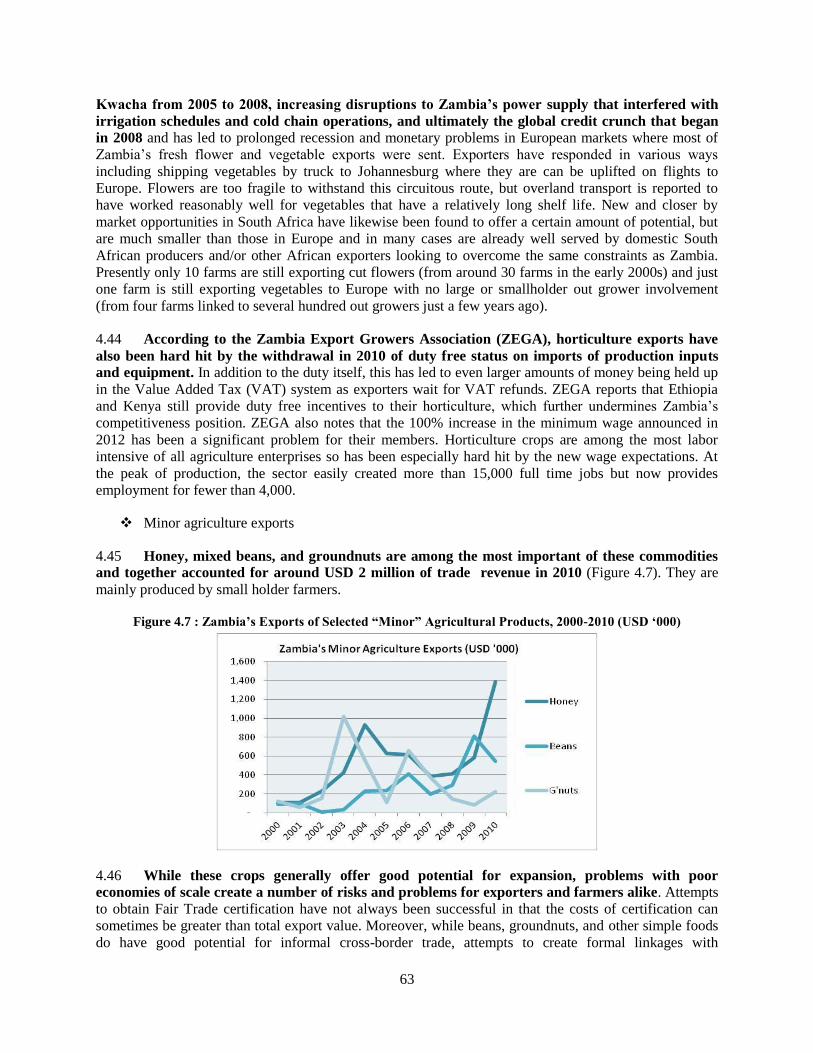
63
Kwacha from 2005 to 2008, increasing disruptions to Zambia’s power supply that interfered with
irrigation schedules and cold chain operations, and ultimately the global credit crunch that began
in 2008 and has led to prolonged recession and monetary problems in European markets where most of
Zambia’s fresh flower and vegetable exports were sent. Exporters have responded in various ways
including shipping vegetables by truck to Johannesburg where they are can be uplifted on flights to
Europe. Flowers are too fragile to withstand this circuitous route, but overland transport is reported to
have worked reasonably well for vegetables that have a relatively long shelf life. New and closer by
market opportunities in South Africa have likewise been found to offer a certain amount of potential, but
are much smaller than those in Europe and in many cases are already well served by domestic South
African producers and/or other African exporters looking to overcome the same constraints as Zambia.
Presently only 10 farms are still exporting cut flowers (from around 30 farms in the early 2000s) and just
one farm is still exporting vegetables to Europe with no large or smallholder out grower involvement
(from four farms linked to several hundred out growers just a few years ago).
4.44 According to the Zambia Export Growers Association (ZEGA), horticulture exports have
also been hard hit by the withdrawal in 2010 of duty free status on imports of production inputs
and equipment. In addition to the duty itself, this has led to even larger amounts of money being held up
in the Value Added Tax (VAT) system as exporters wait for VAT refunds. ZEGA reports that Ethiopia
and Kenya still provide duty free incentives to their horticulture, which further undermines Zambia’s
competitiveness position. ZEGA also notes that the 100% increase in the minimum wage announced in
2012 has been a significant problem for their members. Horticulture crops are among the most labor
intensive of all agriculture enterprises so has been especially hard hit by the new wage expectations. At
the peak of production, the sector easily created more than 15,000 full time jobs but now provides
employment for fewer than 4,000.
Minor agriculture exports
4.45 Honey, mixed beans, and groundnuts are among the most important of these commodities
and together accounted for around USD 2 million of trade revenue in 2010 (Figure 4.7). They are
mainly produced by small holder farmers.
Figure 4.7 : Zambia’s Exports of Selected “Minor” Agricultural Products, 2000-2010 (USD ‘000)
4.46 While these crops generally offer good potential for expansion, problems with poor
economies of scale create a number of risks and problems for exporters and farmers alike. Attempts
to obtain Fair Trade certification have not always been successful in that the costs of certification can
sometimes be greater than total export value. Moreover, while beans, groundnuts, and other simple foods
do have good potential for informal cross-border trade, attempts to create formal linkages with
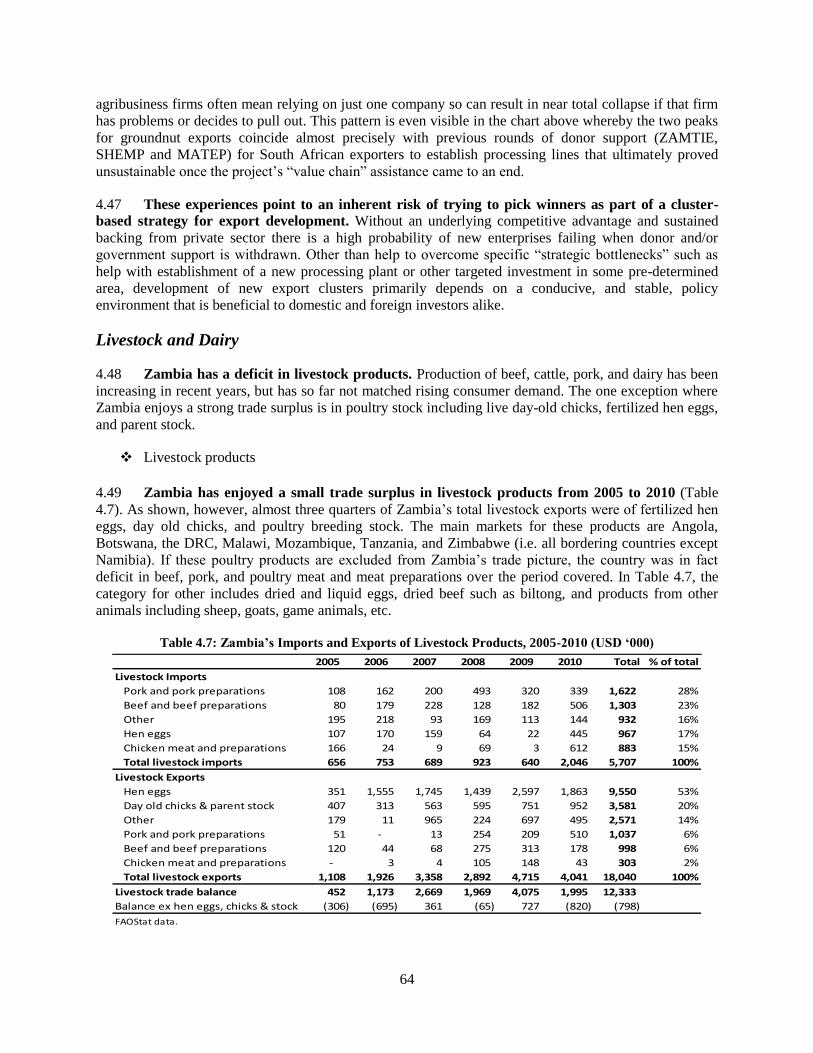
64
agribusiness firms often mean relying on just one company so can result in near total collapse if that firm
has problems or decides to pull out. This pattern is even visible in the chart above whereby the two peaks
for groundnut exports coincide almost precisely with previous rounds of donor support (ZAMTIE,
SHEMP and MATEP) for South African exporters to establish processing lines that ultimately proved
unsustainable once the project’s “value chain” assistance came to an end.
4.47 These experiences point to an inherent risk of trying to pick winners as part of a cluster-
based strategy for export development. Without an underlying competitive advantage and sustained
backing from private sector there is a high probability of new enterprises failing when donor and/or
government support is withdrawn. Other than help to overcome specific “strategic bottlenecks” such as
help with establishment of a new processing plant or other targeted investment in some pre-determined
area, development of new export clusters primarily depends on a conducive, and stable, policy
environment that is beneficial to domestic and foreign investors alike.
Livestock and Dairy
4.48 Zambia has a deficit in livestock products. Production of beef, cattle, pork, and dairy has been
increasing in recent years, but has so far not matched rising consumer demand. The one exception where
Zambia enjoys a strong trade surplus is in poultry stock including live day-old chicks, fertilized hen eggs,
and parent stock.
Livestock products
4.49 Zambia has enjoyed a small trade surplus in livestock products from 2005 to 2010 (Table
4.7). As shown, however, almost three quarters of Zambia’s total livestock exports were of fertilized hen
eggs, day old chicks, and poultry breeding stock. The main markets for these products are Angola,
Botswana, the DRC, Malawi, Mozambique, Tanzania, and Zimbabwe (i.e. all bordering countries except
Namibia). If these poultry products are excluded from Zambia’s trade picture, the country was in fact
deficit in beef, pork, and poultry meat and meat preparations over the period covered. In Table 4.7, the
category for other includes dried and liquid eggs, dried beef such as biltong, and products from other
animals including sheep, goats, game animals, etc.
Table 4.7: Zambia’s Imports and Exports of Livestock Products, 2005-2010 (USD ‘000)
2005 2006 2007 2008 2009 2010 Total % of total
Livestock Imports
Pork and pork preparations 108 162 200 493 320 339 1,622 28%
Beef and beef preparations 80 179 228 128 182 506 1,303 23%
Other 195 218 93 169 113 144 932 16%
Hen eggs 107 170 159 64 22 445 967 17%
Chicken meat and preparations 166 24 9 69 3 612 883 15%
Total livestock imports 656 753 689 923 640 2,046 5,707 100%
Livestock Exports
Hen eggs 351 1,555 1,745 1,439 2,597 1,863 9,550 53%
Day old chicks & parent stock 407 313 563 595 751 952 3,581 20%
Other 179 11 965 224 697 495 2,571 14%
Pork and pork preparations 51 - 13 254 209 510 1,037 6%
Beef and beef preparations 120 44 68 275 313 178 998 6%
Chicken meat and preparations - 3 4 105 148 43 303 2%
Total livestock exports 1,108 1,926 3,358 2,892 4,715 4,041 18,040 100%
Livestock trade balance 452 1,173 2,669 1,969 4,075 1,995 12,333
Balance ex hen eggs, chicks & stock (306) (695) 361 (65) 727 (820) (798)
FAOStat data.
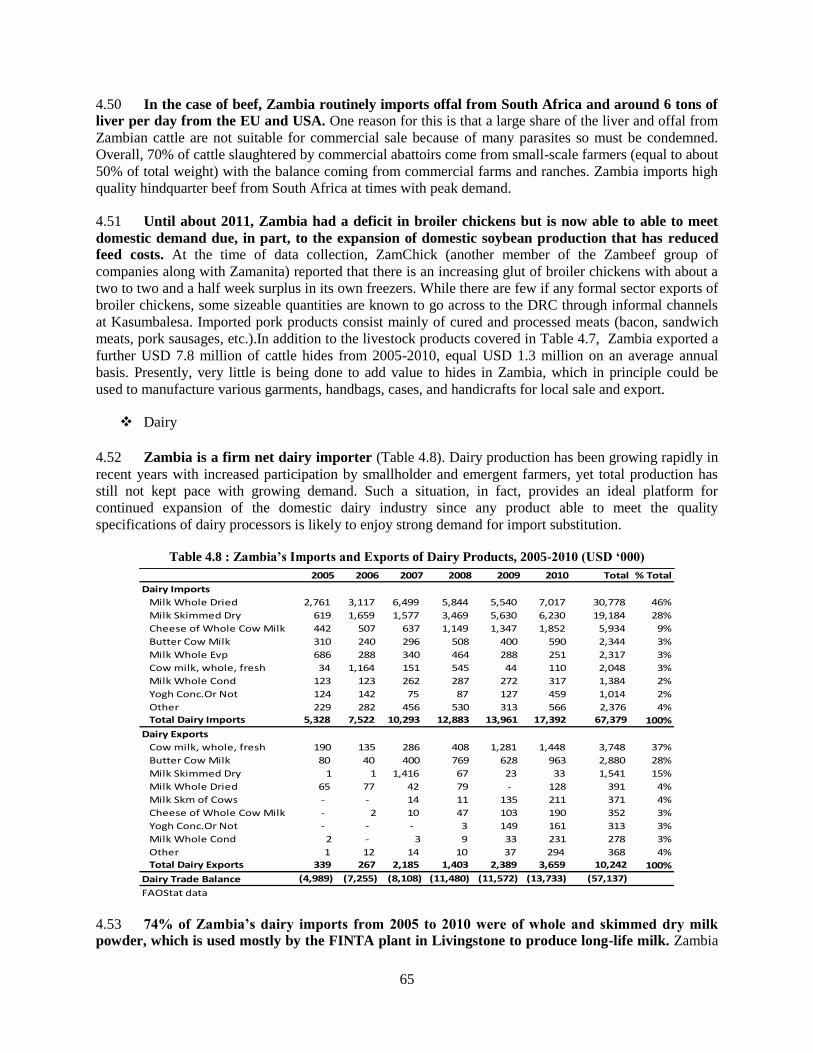
65
4.50 In the case of beef, Zambia routinely imports offal from South Africa and around 6 tons of
liver per day from the EU and USA. One reason for this is that a large share of the liver and offal from
Zambian cattle are not suitable for commercial sale because of many parasites so must be condemned.
Overall, 70% of cattle slaughtered by commercial abattoirs come from small-scale farmers (equal to about
50% of total weight) with the balance coming from commercial farms and ranches. Zambia imports high
quality hindquarter beef from South Africa at times with peak demand.
4.51 Until about 2011, Zambia had a deficit in broiler chickens but is now able to able to meet
domestic demand due, in part, to the expansion of domestic soybean production that has reduced
feed costs. At the time of data collection, ZamChick (another member of the Zambeef group of
companies along with Zamanita) reported that there is an increasing glut of broiler chickens with about a
two to two and a half week surplus in its own freezers. While there are few if any formal sector exports of
broiler chickens, some sizeable quantities are known to go across to the DRC through informal channels
at Kasumbalesa. Imported pork products consist mainly of cured and processed meats (bacon, sandwich
meats, pork sausages, etc.).In addition to the livestock products covered in Table 4.7, Zambia exported a
further USD 7.8 million of cattle hides from 2005-2010, equal USD 1.3 million on an average annual
basis. Presently, very little is being done to add value to hides in Zambia, which in principle could be
used to manufacture various garments, handbags, cases, and handicrafts for local sale and export.
Dairy
4.52 Zambia is a firm net dairy importer (Table 4.8). Dairy production has been growing rapidly in
recent years with increased participation by smallholder and emergent farmers, yet total production has
still not kept pace with growing demand. Such a situation, in fact, provides an ideal platform for
continued expansion of the domestic dairy industry since any product able to meet the quality
specifications of dairy processors is likely to enjoy strong demand for import substitution.
Table 4.8 : Zambia’s Imports and Exports of Dairy Products, 2005-2010 (USD ‘000)
4.53 74% of Zambia’s dairy imports from 2005 to 2010 were of whole and skimmed dry milk
powder, which is used mostly by the FINTA plant in Livingstone to produce long-life milk. Zambia
2005 2006 2007 2008 2009 2010 Total % Total
Dairy Imports
Milk Whole Dried 2,761 3,117 6,499 5,844 5,540 7,017 30,778 46%
Milk Skimmed Dry 619 1,659 1,577 3,469 5,630 6,230 19,184 28%
Cheese of Whole Cow Milk 442 507 637 1,149 1,347 1,852 5,934 9%
Butter Cow Milk 310 240 296 508 400 590 2,344 3%
Milk Whole Evp 686 288 340 464 288 251 2,317 3%
Cow milk, whole, fresh 34 1,164 151 545 44 110 2,048 3%
Milk Whole Cond 123 123 262 287 272 317 1,384 2%
Yogh Conc.Or Not 124 142 75 87 127 459 1,014 2%
Other 229 282 456 530 313 566 2,376 4%
Total Dairy Imports 5,328 7,522 10,293 12,883 13,961 17,392 67,379 100%
Dairy Exports
Cow milk, whole, fresh 190 135 286 408 1,281 1,448 3,748 37%
Butter Cow Milk 80 40 400 769 628 963 2,880 28%
Milk Skimmed Dry 1 1 1,416 67 23 33 1,541 15%
Milk Whole Dried 65 77 42 79 - 128 391 4%
Milk Skm of Cows - - 14 11 135 211 371 4%
Cheese of Whole Cow Milk - 2 10 47 103 190 352 3%
Yogh Conc.Or Not - - - 3 149 161 313 3%
Milk Whole Cond 2 - 3 9 33 231 278 3%
Other 1 12 14 10 37 294 368 4%
Total Dairy Exports 339 267 2,185 1,403 2,389 3,659 10,242 100%
Dairy Trade Balance (4,989) (7,255) (8,108) (11,480) (11,572) (13,733) (57,137)
FAOStat data
66
does not produce milk powder itself and the exports of dry milk in Table 4.8 reflect the re-export of
surplus product to other regional processors. In the table, the category for other includes items such as
processed cheese, fresh cream, ice creams, whey, buttermilk, and other minor dairy products.
4.54 Traditionally, large commercial farmers supplied almost all of the fresh milk used by
Zambia’s dairy processors. These producers, including some very large vertically integrated operations,
still supply over 90% of the raw milk used in commercial processing. Whereas smallholder dairy was
virtually unknown just 10-12 years ago, however, various USAID and other donor-funded projects have
led to a large upsurge in production by smallholder farmers, many with just 1-2 improved dairy cows each
organized around rural milk collection centers (MCCs). More recently, there has also been a large
upsurge in production by medium-scale farmers with 5-15 dairy cows that supply the processors directly
or through an MCC.
4.55 In total, there are now an estimated 3,000 to 4,000 small- and medium-scale dairy farmers
that sell around six million liters annually to commercial processors equal to about 8-10% of the
total milk used for processing with some dairies relying almost entirely on smallholder milk.
Compared with smallholder milk in East Africa, the quality of smallholder supply in Zambia is extremely
good so is highly sought after by modern processors looking to expand their operations. Importantly,
achieving these very high standards has been expensive and time consuming in terms of the need for
farmer training in dairy hygiene and distribution of stainless steel milking pails, milk cans, and other
improved dairy equipment. At the MCC level, the use of platform tests to check for bacteria load on
reception and milk chilling tanks to slow bacteria growth before pasteurization has also been essential.
4.56 For farmers and MCCs to achieve effective economies of scale, investments in high-yielding
dairy breeds have been required. Reliable artificial insemination (AI) services are absolutely essential
to sustain good quality dairy genetics and ensure a positive return on past dairy investments. Some
progress has been made developing these services around smallholder MCCs, but is still probably the
greatest challenge to the long-term success of smallholder dairy given that AI is inherently expensive and
difficult to manage.
Agriculture Inputs
4.57 Agriculture trade competitiveness begins with the decisions farmers make on the kinds of
seed, fertilizer, and other inputs they have access to. With respect to maize, Zambia has made
significant strides in increasing farmer access to hybrid maize seed and fertilizer through the Farmer Input
Support Program (FISP) and its predecessor the Fertilizer Support Program (FSP). These gains, however,
have come at a high cost not only to the government’s budget but also in terms of problems with late
delivery of inputs, delivery of inputs in different quantities than farmers were expecting, and stunted
private sector development in areas that could genuinely be served by the private sector.46
For other
smallholder crops including cotton and tobacco, and to a lesser extent soybeans and sugar, farmers rely
primarily on outgrower support for fertilizer, chemicals, and planting material.
4.58 In terms of trade facilitation, any savings on the cost of importing crop inputs through
streamlining of border procedures or minimizing of the requirements for testing and registering
new products, could go a long way to providing the same benefits as a subsidy without being a drain
on the national budget. Various studies of fertilizer markets in different parts of Africa have shown that
reducing trade costs together with promotion of domestic blending capacity can easily save USD 30-40
46 In 2010, a World Bank public sector expenditure tracking and service delivery report on the FSP recommended introducing a
dual approach with differences between well-connected farm areas that the private sector can realistically serve and remote areas
where small farmer demand is still too little to be of real commercial interest. See World Bank, 2010.
67
per ton.47
In 2012/13, Zambia’s FISP purchased a total of 183,000 tons of fertilizer meaning the total
direct savings from trade facilitation and increased reliance on domestic blends (as opposed to granular
compounds) could be as much as USD 7.32 million annually.
Fertilizer trade
4.59 Under the FISP and FSP, procurement of fertilizer has been handled each year through an
open tender. Despite these competitive arrangements, all fertilizer contracts have been awarded to the
same three companies since the program’s inception, namely to the state-owned manufacturer, Nitrogen
Chemicals of Zambia (NCZ), Omnia Small Scale Limited, and Nyiombo Investments Limited.48
Program
administrators argued that the main reason for this outcome is the lack of physical capacity of other
fertilizer companies to deliver the required volumes and/or mobilize the necessary finance.49
4.60 Unsurprisingly, the awarding of tenders to the same companies each year has led to
complaints by firms excluded from the program with some companies saying the tender
specifications were designed specifically to prevent them from winning a contract.
One such rule has been the requirement to supply granular compound fertilizer rather than
blended products that are now being produced by private local companies. The main justification
for this (other than to support NCZ, which produces granular compounds) is that blended
products are said to separate very easily when transported over long distances. Many local and
international fertilizer experts, however, dispute this claim and say that separation is not a
problem with modern products. They also observe that farmers in the US and other developed
countries have been using blended fertilizer for many years as it is cheaper to produce and
therefore more cost effective than granular compounds. One key advantage of locally blended
fertilizer over an imported granular compound is that blending avoids the need to transport inert
fillers over very long distances that account for 50-60% of the volume of most fertilizers. The
technology for producing blended fertilizer is reasonably simple and less energy intensive than
for granular compounds so likely offers good strategic potential and is an area Zambia could do
well to promote.
Another controversial tender rule of the FISP has been the requirement that suppliers have 100%
of the fertilizer tendered for already in the country at the time of making their bid. Very simply,
this is not realistic for any small (emerging Zambian) firm or, indeed, for any large company that
is not very certain of winning the government contract. In Malawi, by contrast, fertilizer tenders
have recently been awarded to over 20 companies of varying sizes, including local manufacturers
of blended compounds.
4.61 Both rules on fertilizer procurement were dropped from the 2012/13 FISP tender leading to
renewed interest in the program by many local companies. There were also strong indications that the
2012/13 program would include a pilot voucher mechanism whereby farmers would have been free to
choose any type of seed or fertilizer they wish from local private dealers.50
Apart from creating new
opportunities for private sector participation, one major advantage of this approach is that it would have
allowed farmers to move away from the universal application of Compound D to other products that are
better suited to their own local soil type. In many places, Compound D is barely useful and farmers would
47 See Bumb, et. al. 2011. 48 In 2013/14, 100% of the contract for Compound D was awarded to NCZ while 100% of the Urea was procured in a
government-to-government contract with Saudi Arabia effectively eliminating the Zambia private sector from the program. 49World Bank, 2010. 50 Government also announced that 2013/14 program would include a voucher mechanism but then cancelled the program barely
a month before the start of the agriculture season saying that technical arrangements were not in place.
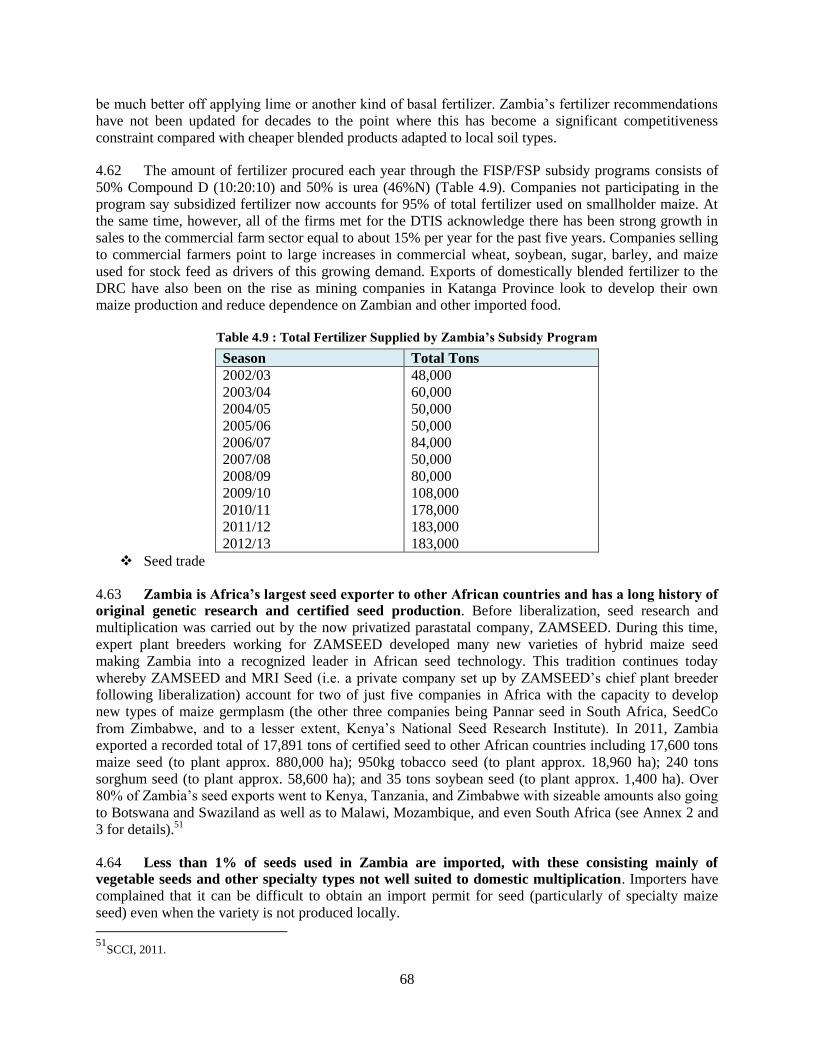
68
be much better off applying lime or another kind of basal fertilizer. Zambia’s fertilizer recommendations
have not been updated for decades to the point where this has become a significant competitiveness
constraint compared with cheaper blended products adapted to local soil types.
4.62 The amount of fertilizer procured each year through the FISP/FSP subsidy programs consists of
50% Compound D (10:20:10) and 50% is urea (46%N) (Table 4.9). Companies not participating in the
program say subsidized fertilizer now accounts for 95% of total fertilizer used on smallholder maize. At
the same time, however, all of the firms met for the DTIS acknowledge there has been strong growth in
sales to the commercial farm sector equal to about 15% per year for the past five years. Companies selling
to commercial farmers point to large increases in commercial wheat, soybean, sugar, barley, and maize
used for stock feed as drivers of this growing demand. Exports of domestically blended fertilizer to the
DRC have also been on the rise as mining companies in Katanga Province look to develop their own
maize production and reduce dependence on Zambian and other imported food.
Table 4.9 : Total Fertilizer Supplied by Zambia’s Subsidy Program
Season Total Tons
2002/03
2003/04
2004/05
2005/06
2006/07
2007/08
2008/09
2009/10
2010/11
2011/12
2012/13
48,000
60,000
50,000
50,000
84,000
50,000
80,000
108,000
178,000
183,000
183,000
Seed trade
4.63 Zambia is Africa’s largest seed exporter to other African countries and has a long history of
original genetic research and certified seed production. Before liberalization, seed research and
multiplication was carried out by the now privatized parastatal company, ZAMSEED. During this time,
expert plant breeders working for ZAMSEED developed many new varieties of hybrid maize seed
making Zambia into a recognized leader in African seed technology. This tradition continues today
whereby ZAMSEED and MRI Seed (i.e. a private company set up by ZAMSEED’s chief plant breeder
following liberalization) account for two of just five companies in Africa with the capacity to develop
new types of maize germplasm (the other three companies being Pannar seed in South Africa, SeedCo
from Zimbabwe, and to a lesser extent, Kenya’s National Seed Research Institute). In 2011, Zambia
exported a recorded total of 17,891 tons of certified seed to other African countries including 17,600 tons
maize seed (to plant approx. 880,000 ha); 950kg tobacco seed (to plant approx. 18,960 ha); 240 tons
sorghum seed (to plant approx. 58,600 ha); and 35 tons soybean seed (to plant approx. 1,400 ha). Over
80% of Zambia’s seed exports went to Kenya, Tanzania, and Zimbabwe with sizeable amounts also going
to Botswana and Swaziland as well as to Malawi, Mozambique, and even South Africa (see Annex 2 and
3 for details).51
4.64 Less than 1% of seeds used in Zambia are imported, with these consisting mainly of
vegetable seeds and other specialty types not well suited to domestic multiplication. Importers have
complained that it can be difficult to obtain an import permit for seed (particularly of specialty maize
seed) even when the variety is not produced locally.
51
SCCI, 2011.
69
4.65 Despite the success of Zambia’s seed exports, an important constraint has been that each
new seed variety must be tested and registered in every destination market. This process can take
from two to four years and often involves several thousand dollars of costs. As a result, seed companies
say they often register a limited number of varieties that are generally suitable for each destination market
rather than all of the seeds in their portfolio that may be even better suited for certain end users. The cost
of seed registration, therefore, is not only of direct financial importance to the seed companies, but can
also have a major impact on agriculture production and the time that farmers must wait to have access to
improved technologies. Zambia also requires new varieties of domestic and imported seed to be registered
before it can be sold in the local market.
4.66 While governments do have a responsibility to ensure that the seeds that enter their
markets are suited to local conditions, there is an increasing awareness for these costs and that
many of the tests are redundant. To improve the trade situation for seed, SADC and COMESA have
both developed harmonized systems for variety release, seed certification, and phytosanitary control
designed to make seed trade easier, faster, and cheaper. Under the regional systems, for example, any
variety that has been registered in two other Member States could be freely traded throughout the region
without the need for further registration tests (see Appendix 3 for details of the SADC System). Before
either the SADC or COMESA system can be implemented, however, domestic seed legislation in each
participating country must be brought in line with the regional approach. Zambia started the process of
redrafting its seed law in 2012, but the new legislation is still in draft stage and must then go to
Parliament for adoption. As Africa’s leading seed exporter, Zambia stands to benefit the most from
improved rules for regional seed trade and should therefore assign high priority to concluding the process
and to encouraging other countries to do the same.
4.67 With regard FISP/FSP, seed has always been single-sourced because of the special traits of
each type of seed and because farmers ideally are supposed to specify the type of seed they want.52
Several private firms (MRI Seed, SeedCo, ZAMSEED, Pannar Seed, Prime Agric Centre, Kamano Seed
Company, and Croppack Zambia) have therefore participated in the program for many years and
expressed less concern about the distorting impact of the government subsidies and tender procedures
than the fertilizer companies. Over 50% of hybrid maize seed now sold in Zambia is purchased through
the FISP with the total value of seed supplied under the program accounting for about 15% of program
costs.53
Farm machinery trade
4.68 Consistent with the overall picture of agriculture growth in Zambia, the mechanization
sector has also been expanding. In recent years, total import of new tractors is reported to have
increased from 103 units in 2009, to 290 units in 2010, and 347 units in 2011. Most of these imports,
however, were accounted for by the commercial farm sector and smallholder access to mechanization
services is still extremely limited in most parts of the country. There is no reliable figure for the total
number of working tractors in Zambia, but was last estimated by the World Bank to be around 6,000 total
units.54
4.69 To improve smallholder access to machine services, various private sector projects are
underway. The first of these is being managed by Dunavant Cotton with financial support from the Gates
Foundation, USAID, and World Food Program (WFP). Dunavant is Zambia’s largest ginning company
and currently provides inputs for cotton and soybeans (to be grown as a rotation crop with cotton) to
52 Given the wide variety of soil types and growing conditions across Zambia, farmers could also do well if they were allowed to
specify the type of basal fertilizer they want rather than be made to rely on Compound D. 53World Bank, 2010. 54FAOStat data.
70
around 170,000 smallholder farmers on an outgrower basis through1,700 village-based distributors.55
The
Dunavant tractor program is now in its fifth year and has so far managed to put 34 tractors on the ground
through a revolving fund whereby “lead farmers” are given credit and training in tractor operation and
management of local hire services (mainly for tillage and transport). The tractor program aims to serve
smallholders participating in the Dunavant outgrower program. Farmers in the outgrower program can
pay for the tractor service through a deduction from their cotton payment, which is refunded to the
operator. USAID provided management training and helped to get the program off the ground; WFP’s
Purchase for Progress (P4P) program and Gates Foundation provided the original finance for
establishment of the revolving fund. Dunavant reports that it is looking to expand the program with
commercial credit from Zambia National Commercial Bank (ZANACO).
4.70 A second tractor program is being managed by John Deere through its local distributor AFGRI in
cooperation with USAID and the Conservation Farming Unit (CFU) of the Zambia National Farmers’
Union (ZNFU). This program works in a very similar way to the Dunavant program whereby the
farmer/owner gets a loan from AFGRI together with management training. The owner is required to
provide 20% equity finance or around USD 9,000 against USD 45,000 total loan that covers delivery of a
45hp tractor, various attachments including a ripper and GPS for infield navigation, three-year service
package, and insurance. The loan period is three years and interest is 14%.
4.71 A third tractor program was previously attempted by the European Union (EU) together with
Food and Agriculture Organization (FAO) and ZNFU. Industry reports, however, are that EU project was
generally problematic with a large number of borrowers defaulting on their loan, in part due to receiving
too many pieces of equipment and too high of a credit burden. The EU program is currently on hold.
Managers of the Dunavant and John Deere program say they were able to learn from this early project to
avoid similar mistakes.
4.72 Against this background, tractor dealers met during the DTIS study expressed limited amount of
concern (caution) that new, highly concessional tractor programs not based on commercial credit terms
like the ones above could be introduced and would undermine private sector growth. While dealers said
they were not aware of any specific plans for such a program, a possible influx of donated tractors from
Japan and/or China was identified as an important risk.
Agriculture Trade with APEI Countries
4.73 Unmanufactured tobacco is by far Zambia’s most important commodity export to APEI
countries (Table 4.10). As discussed above, virtually all of this crop is grown in Eastern Province and
goes to Malawi for primary processing and onward sale to global tobacco manufacturers. According to
the official data, dairy is Zambia’s fourth most valuable category of agriculture exports to APEI countries
after sugar and maize/maize flour. The very high value of dairy in 2005, however, is a clear anomaly.
Excluding 2005, the average annual value of Zambia’s dairy exports to APEI countries was just USD
433,000 per year, which would place the sector at the bottom of the list of top-10 exports. Overall, APEI
countries accounted for 15% of Zambia’s agriculture exports with 74% of total APEI trade being in
agriculture. In addition to the commodities covered below, Zambia exported a further USD 2.87 million
of mineral or chemical fertilizers to APEI countries from 2005 to 2010 equal to an average annual value
of USD 239,000.
55 In total, Dunavant estimates there were at least 400,000 outgrower cotton farmers in the 2011/12 season.
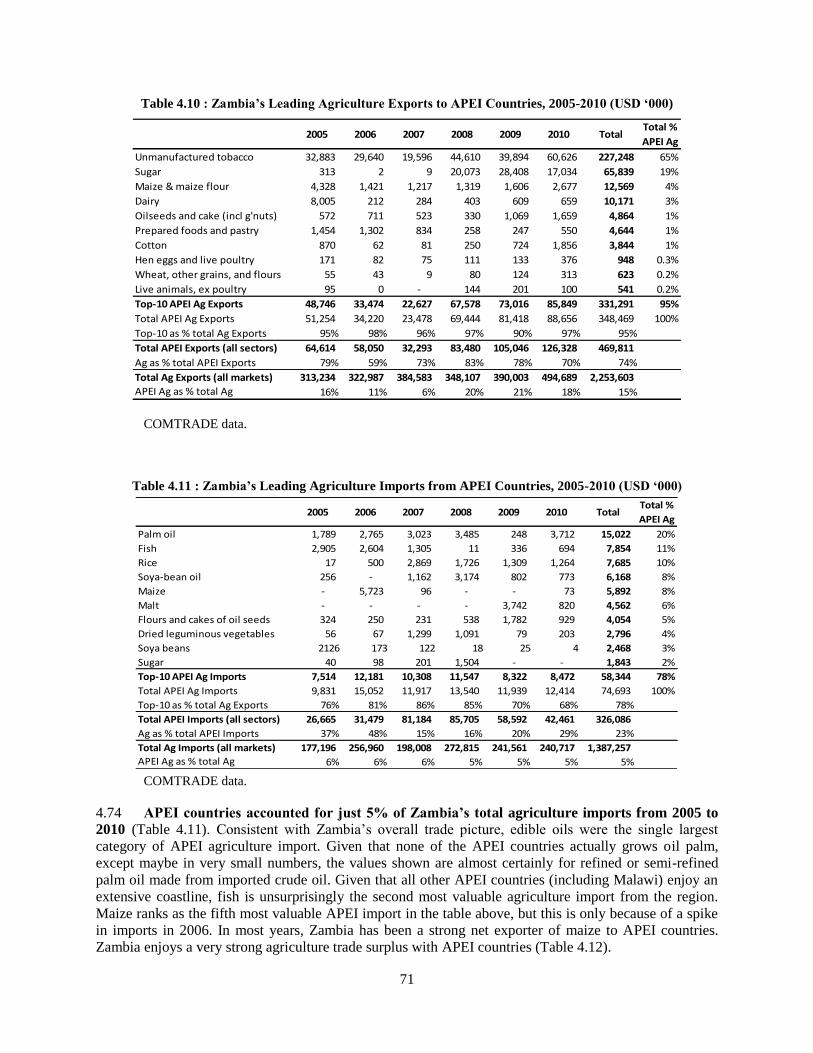
71
Table 4.10 : Zambia’s Leading Agriculture Exports to APEI Countries, 2005-2010 (USD ‘000)
COMTRADE data.
Table 4.11 : Zambia’s Leading Agriculture Imports from APEI Countries, 2005-2010 (USD ‘000)
COMTRADE data.
4.74 APEI countries accounted for just 5% of Zambia’s total agriculture imports from 2005 to
2010 (Table 4.11). Consistent with Zambia’s overall trade picture, edible oils were the single largest
category of APEI agriculture import. Given that none of the APEI countries actually grows oil palm,
except maybe in very small numbers, the values shown are almost certainly for refined or semi-refined
palm oil made from imported crude oil. Given that all other APEI countries (including Malawi) enjoy an
extensive coastline, fish is unsurprisingly the second most valuable agriculture import from the region.
Maize ranks as the fifth most valuable APEI import in the table above, but this is only because of a spike
in imports in 2006. In most years, Zambia has been a strong net exporter of maize to APEI countries.
Zambia enjoys a very strong agriculture trade surplus with APEI countries (Table 4.12).
2005 2006 2007 2008 2009 2010 TotalTotal %
APEI Ag
Unmanufactured tobacco 32,883 29,640 19,596 44,610 39,894 60,626 227,248 65%
Sugar 313 2 9 20,073 28,408 17,034 65,839 19%
Maize & maize flour 4,328 1,421 1,217 1,319 1,606 2,677 12,569 4%
Dairy 8,005 212 284 403 609 659 10,171 3%
Oilseeds and cake (incl g'nuts) 572 711 523 330 1,069 1,659 4,864 1%
Prepared foods and pastry 1,454 1,302 834 258 247 550 4,644 1%
Cotton 870 62 81 250 724 1,856 3,844 1%
Hen eggs and live poultry 171 82 75 111 133 376 948 0.3%
Wheat, other grains, and flours 55 43 9 80 124 313 623 0.2%
Live animals, ex poultry 95 0 - 144 201 100 541 0.2%
Top-10 APEI Ag Exports 48,746 33,474 22,627 67,578 73,016 85,849 331,291 95%
Total APEI Ag Exports 51,254 34,220 23,478 69,444 81,418 88,656 348,469 100%
Top-10 as % total Ag Exports 95% 98% 96% 97% 90% 97% 95%
Total APEI Exports (all sectors) 64,614 58,050 32,293 83,480 105,046 126,328 469,811
Ag as % total APEI Exports 79% 59% 73% 83% 78% 70% 74%
Total Ag Exports (all markets) 313,234 322,987 384,583 348,107 390,003 494,689 2,253,603
APEI Ag as % total Ag 16% 11% 6% 20% 21% 18% 15%
2005 2006 2007 2008 2009 2010 TotalTotal %
APEI Ag
Palm oil 1,789 2,765 3,023 3,485 248 3,712 15,022 20%
Fish 2,905 2,604 1,305 11 336 694 7,854 11%
Rice 17 500 2,869 1,726 1,309 1,264 7,685 10%
Soya-bean oil 256 - 1,162 3,174 802 773 6,168 8%
Maize - 5,723 96 - - 73 5,892 8%
Malt - - - - 3,742 820 4,562 6%
Flours and cakes of oil seeds 324 250 231 538 1,782 929 4,054 5%
Dried leguminous vegetables 56 67 1,299 1,091 79 203 2,796 4%
Soya beans 2126 173 122 18 25 4 2,468 3%
Sugar 40 98 201 1,504 - - 1,843 2%
Top-10 APEI Ag Imports 7,514 12,181 10,308 11,547 8,322 8,472 58,344 78%
Total APEI Ag Imports 9,831 15,052 11,917 13,540 11,939 12,414 74,693 100%
Top-10 as % total Ag Exports 76% 81% 86% 85% 70% 68% 78%
Total APEI Imports (all sectors) 26,665 31,479 81,184 85,705 58,592 42,461 326,086
Ag as % total APEI Imports 37% 48% 15% 16% 20% 29% 23%
Total Ag Imports (all markets) 177,196 256,960 198,008 272,815 241,561 240,717 1,387,257
APEI Ag as % total Ag 6% 6% 6% 5% 5% 5% 5%
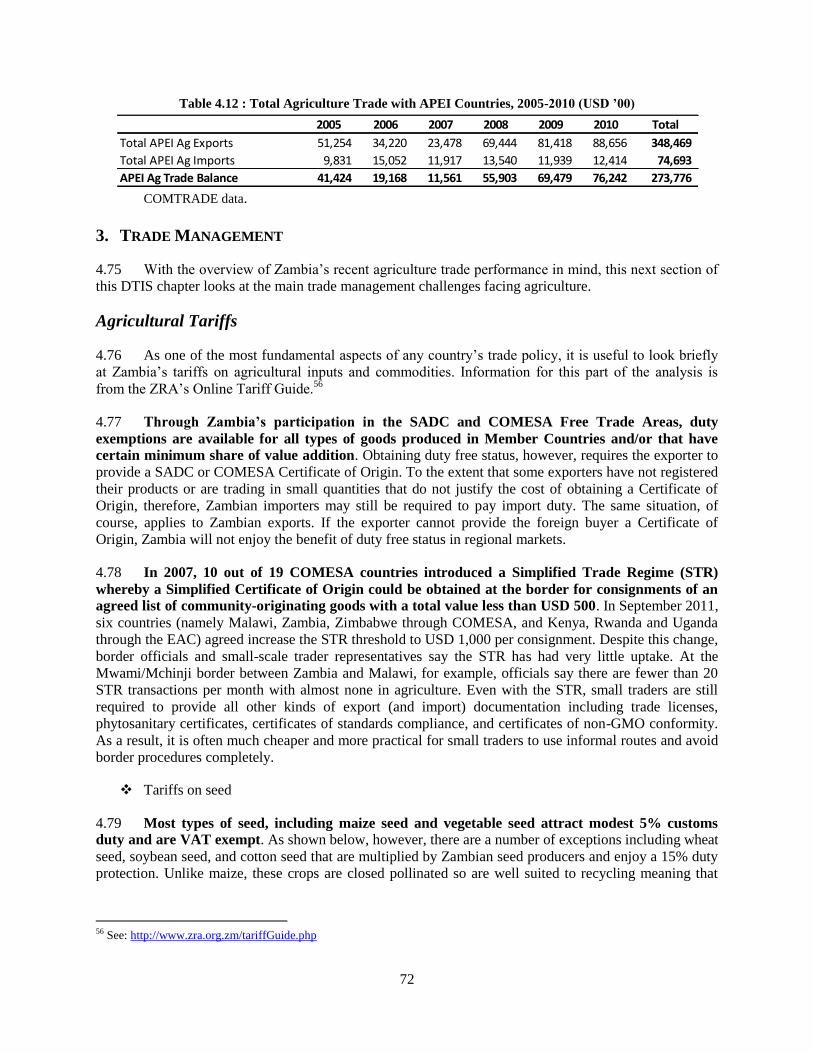
72
Table 4.12 : Total Agriculture Trade with APEI Countries, 2005-2010 (USD ’00)
COMTRADE data.
3. TRADE MANAGEMENT
4.75 With the overview of Zambia’s recent agriculture trade performance in mind, this next section of
this DTIS chapter looks at the main trade management challenges facing agriculture.
Agricultural Tariffs
4.76 As one of the most fundamental aspects of any country’s trade policy, it is useful to look briefly
at Zambia’s tariffs on agricultural inputs and commodities. Information for this part of the analysis is
from the ZRA’s Online Tariff Guide.56
4.77 Through Zambia’s participation in the SADC and COMESA Free Trade Areas, duty
exemptions are available for all types of goods produced in Member Countries and/or that have
certain minimum share of value addition. Obtaining duty free status, however, requires the exporter to
provide a SADC or COMESA Certificate of Origin. To the extent that some exporters have not registered
their products or are trading in small quantities that do not justify the cost of obtaining a Certificate of
Origin, therefore, Zambian importers may still be required to pay import duty. The same situation, of
course, applies to Zambian exports. If the exporter cannot provide the foreign buyer a Certificate of
Origin, Zambia will not enjoy the benefit of duty free status in regional markets.
4.78 In 2007, 10 out of 19 COMESA countries introduced a Simplified Trade Regime (STR)
whereby a Simplified Certificate of Origin could be obtained at the border for consignments of an
agreed list of community-originating goods with a total value less than USD 500. In September 2011,
six countries (namely Malawi, Zambia, Zimbabwe through COMESA, and Kenya, Rwanda and Uganda
through the EAC) agreed increase the STR threshold to USD 1,000 per consignment. Despite this change,
border officials and small-scale trader representatives say the STR has had very little uptake. At the
Mwami/Mchinji border between Zambia and Malawi, for example, officials say there are fewer than 20
STR transactions per month with almost none in agriculture. Even with the STR, small traders are still
required to provide all other kinds of export (and import) documentation including trade licenses,
phytosanitary certificates, certificates of standards compliance, and certificates of non-GMO conformity.
As a result, it is often much cheaper and more practical for small traders to use informal routes and avoid
border procedures completely.
Tariffs on seed
4.79 Most types of seed, including maize seed and vegetable seed attract modest 5% customs
duty and are VAT exempt. As shown below, however, there are a number of exceptions including wheat
seed, soybean seed, and cotton seed that are multiplied by Zambian seed producers and enjoy a 15% duty
protection. Unlike maize, these crops are closed pollinated so are well suited to recycling meaning that
56 See: http://www.zra.org.zm/tariffGuide.php
2005 2006 2007 2008 2009 2010 Total
Total APEI Ag Exports 51,254 34,220 23,478 69,444 81,418 88,656 348,469
Total APEI Ag Imports 9,831 15,052 11,917 13,540 11,939 12,414 74,693
APEI Ag Trade Balance 41,424 19,168 11,561 55,903 69,479 76,242 273,776
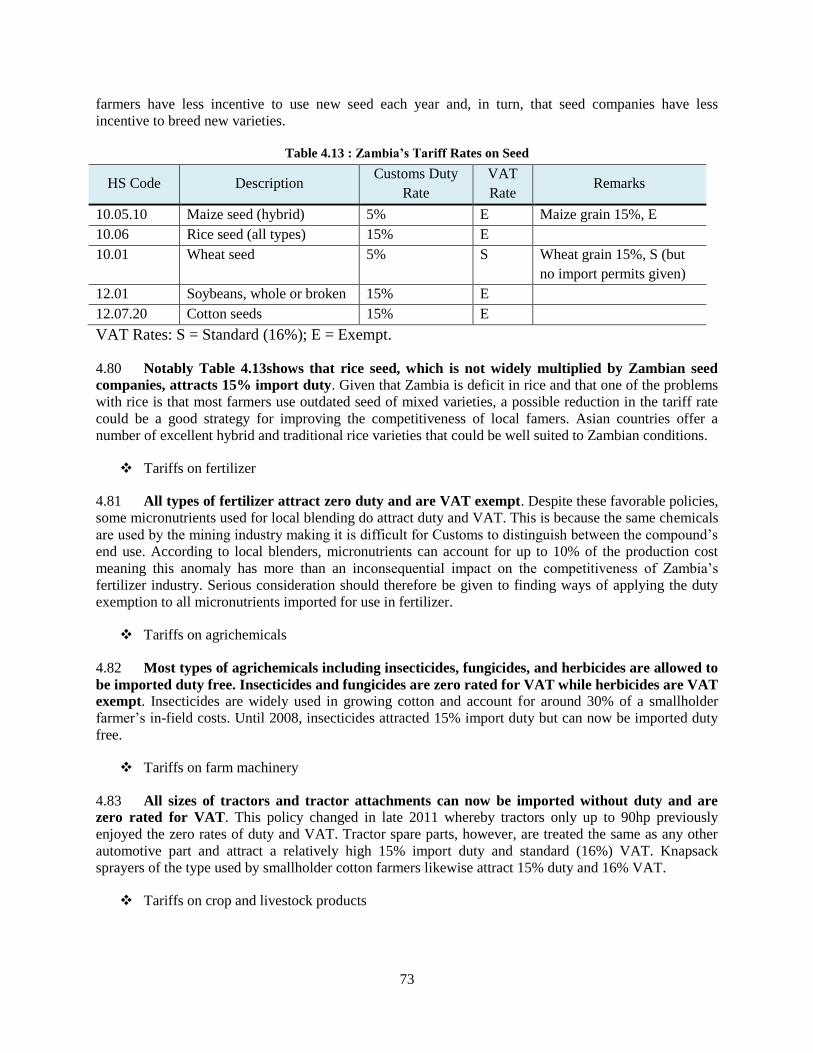
73
farmers have less incentive to use new seed each year and, in turn, that seed companies have less
incentive to breed new varieties.
Table 4.13 : Zambia’s Tariff Rates on Seed
HS Code Description Customs Duty
Rate
VAT
Rate Remarks
10.05.10 Maize seed (hybrid) 5% E Maize grain 15%, E
10.06 Rice seed (all types) 15% E
10.01 Wheat seed 5% S Wheat grain 15%, S (but
no import permits given)
12.01 Soybeans, whole or broken 15% E
12.07.20 Cotton seeds 15% E
VAT Rates: S = Standard (16%); E = Exempt.
4.80 Notably Table 4.13shows that rice seed, which is not widely multiplied by Zambian seed
companies, attracts 15% import duty. Given that Zambia is deficit in rice and that one of the problems
with rice is that most farmers use outdated seed of mixed varieties, a possible reduction in the tariff rate
could be a good strategy for improving the competitiveness of local famers. Asian countries offer a
number of excellent hybrid and traditional rice varieties that could be well suited to Zambian conditions.
Tariffs on fertilizer
4.81 All types of fertilizer attract zero duty and are VAT exempt. Despite these favorable policies,
some micronutrients used for local blending do attract duty and VAT. This is because the same chemicals
are used by the mining industry making it is difficult for Customs to distinguish between the compound’s
end use. According to local blenders, micronutrients can account for up to 10% of the production cost
meaning this anomaly has more than an inconsequential impact on the competitiveness of Zambia’s
fertilizer industry. Serious consideration should therefore be given to finding ways of applying the duty
exemption to all micronutrients imported for use in fertilizer.
Tariffs on agrichemicals
4.82 Most types of agrichemicals including insecticides, fungicides, and herbicides are allowed to
be imported duty free. Insecticides and fungicides are zero rated for VAT while herbicides are VAT
exempt. Insecticides are widely used in growing cotton and account for around 30% of a smallholder
farmer’s in-field costs. Until 2008, insecticides attracted 15% import duty but can now be imported duty
free.
Tariffs on farm machinery
4.83 All sizes of tractors and tractor attachments can now be imported without duty and are
zero rated for VAT. This policy changed in late 2011 whereby tractors only up to 90hp previously
enjoyed the zero rates of duty and VAT. Tractor spare parts, however, are treated the same as any other
automotive part and attract a relatively high 15% import duty and standard (16%) VAT. Knapsack
sprayers of the type used by smallholder cotton farmers likewise attract 15% duty and 16% VAT.
Tariffs on crop and livestock products
74
4.84 Most grains and oilseeds with the exception of wheat are subject to 15% import duty. Maize
and maize flour, rice, sorghum, barley, and millet are VAT exempt; soybeans attract the standard (16%)
rate of VAT. Wheat grain is likewise subject to 15% import duty and 16% VAT while wheat flour is
subject to 25% import duty and 16% VAT. In the case of wheat, however, a long-standing protectionist
policy means that import have not been issued since 2009 when Zambia became self-sufficient in wheat.
4.85 In the livestock sector, live animals for breeding attract 5% duty and are VAT exempt
while live animals for slaughter attract 15% duty and are VAT exempt. Chilled and frozen meats,
edible offal, and meat products, attract 25% duty but are VAT exempt. Most dairy products attract 25%
import duty and 16% VAT so enjoy a considerable amount of tariff protection.
Trade Requirements
4.86 For all types of agriculture commodities and crop inputs, Zambia imposes (and encounters)
a wide variety of paperwork and product registration requirements that make trade difficult and
expensive. This is seen on many levels beginning with the use of trade permits and risk of outright trade
bans through to multiple certification and inspection requirements that add to trade costs. On the one
hand, phytosanitary and other trade rules do serve legitimate purposes in terms of protecting human,
animal, and plant health, yet in practice there are frequently institutional overlaps whereby traders are
required to obtain certificates for the same or similar things from different agencies and to submit their
goods for duplicate inspections by both the exporting and importing country.
4.87 Such factors can be a particular disadvantage to small traders who often lack the necessary
economies of scale, financial resources, skills, and information needed to participate in formal
sector markets. As a result, considerable volumes of produce are known to slip across Zambia’s borders
through informal channels in small lots that can be even more expensive to navigate on a per ton basis
and potentially expose consumers to risk if the product is diseased or faulty. Moreover, from a value
chain perspective, every transaction cost takes away from the total profit available to flow upstream to
farmers, traders, transporters, processors, and all other domestic value chain participants. Streamlining of
trade procedures, therefore, is not only important for improving Zambia’s trade competitiveness, but can
also have a direct, positive impact on rural incomes and incentives for on-farm improvement.
Trade permit
4.88 In Zambia, trade permits are issued by the Agribusiness Unit of the Ministry of Agriculture
and Livestock (MAL) and are required to import or export most types of agriculture commodity.
For maize, traders say export permits are issued in 30-ton increments at a reported cost of ZMW 745
(about USD 140) per 510 tons. At this price, the cost works out to ZMW 43.80 (USD 8.26) per full 30-ton
truck or ZMW 1.46 (USD 0.28) per ton but can be much higher for traders dealing in smaller
consignments. Each truck must carry an original certificate signed by the Agribusiness Director of MAL.
On 9 September 2013, a formal ban on all private exports of maize grain, maize bran, and number three
maize meal was signed into law by the Minister of Agriculture and Livestock that applies to all exports
except for exports by (a) the Government of the Republic of Zambia to the Government of another
country and (b) the World Food Program.57
4.89 When export permits are available they valid for 30 days only. If the full number of
certificates purchases is not used within the 30-day period the balance does not carry forward and the
trader must apply for new permits. Traders must register with the Zambia Revenue Authority and present
57
Statutory Instrument No. 85 of 2013, Control of Goods (Import and Export) (Agriculture) (Prohibition of Exportation) Order
2013.
75
a valid phytosanitary certificate and non-GMO certificate to get an import or export permit. Moreover,
exporters have recently been required to specify the exact registration number of every truck and trailer
used to haul agriculture exports. These numbers are written onto the permit meaning that if the designated
vehicle suffers a breakdown or is delayed on other business, the permit itself effectively becomes null and
void.
4.90 More than the direct cost and inconvenience of obtaining trade permits, however, large
firms say the unpredictability of whether or not trade permits will be issued is an even bigger
constraint and major deterrent to much needed private investment. It has long known by agriculture
stakeholders that Zambia’s physical endowments and central location put the country in a unique position
to be a major grain exporter. Without a firm commitment to keeping Zambia’s borders open, however,
traders cannot engage in forward contracting and Zambia is unlikely ever to realize its full export
potential.
Phytosanitary certificate
4.91 In both domestic and international markets, sanitary and phytosanitary measures are
fundamentally concerned with ensuring food is safe for humans and preventing the spread of
animal and plant pests and diseases. Importing countries typically require guarantees that exports are
derived from areas that are free from specified pest and disease risks. Proof may also be required that
grain has been fumigated to eliminate pests and is free of contaminants such as pesticide residues, heavy
metals, dioxins, and other potentially dangerous substances.
4.92 In Zambia, phytosanitary certificates are issued by the Zambia Agriculture Research
Institute (ZARI) and cost ZMW 15.50 (USD 3.00) each. One certificate is required per truck, which
works out to USD 0.10 per ton for a full size 30-ton load or USD 0.43 for a smaller 7-ton load. To be
issued with a phytosanitary certificate, exporters are required to demonstrate compliance with the
importing country’s phytosanitary declaration conditions. These conditions vary from country to country,
but typically require the exporter to take samples of the product for laboratory analysis to determine
whether it is free from specific kinds of disease, insect damage, and storage pests. Depending on the trade
partner, proof of fumigation may also be required.
Non-GMO certificate
4.93 Regardless of the importing country’s phytosanitary declaration requirements, Zambia
further requires all agriculture exports to be certified as a non-genetically modified product as a
prerequisite for obtaining a phytosanitary certificate. No genetically modified seeds are allowed into
Zambia yet non-GMO testing is still required for every export shipment. Even when exporting to
countries that do not require non-GMO compliance, such as the DRC or South Africa, Zambian exporters
must still submit their product for non-GMO testing to obtain a phytosanitary certificate.
4.94 Like the SPS Certificate, non-GMO Certificates are issued by ZARI. The current cost is
ZMW 150 (USD 30) per certificate. One original signed certificate is required per truck meaning the cost
works out to USD 1.00 per ton for a full size 30-ton truck but can be much higher for traders dealing in
small quantities. All Zambian Non-GMO Certificates must be signed by the ZARI Director.
4.95 On top of the cost of the certificate itself, various levels of testing may be required by the
importing country to determine the shipment’s non-GMO status. Zimbabwe, for example, requires a
full GMO test whereas other countries only require a lateral flow test or so-called “quick test.” A GMO
“quick test” performed by a superintendent company was reported to cost ZMW 795 (USD 150) per
sample. One quick test can cover up to 2,000 tons of grain if stored in the same warehouse giving a
76
minimum cost of USD 0.08 per ton. For deals involving small quantities or when grain has to be sourced
from multiple depots, of course, the cost can be much higher.
4.96 Other than Zambia, countries in eastern and southern Africa with GMO restrictions
include Botswana, Malawi, Mozambique, Tanzania, Uganda, and Zimbabwe. Kenya began to allow
GMO imports in July 2011 on a case-by-case basis while regional traders say Namibia allows GMO
imports of South African maize meal but not of un-milled grain. Further complicating the matter,
countries including Botswana sometimes allow GMO imports for stock feed, but not for human
consumption. South Africa and the Democratic Republic of Congo do not have GMO restrictions.
4.97 During interviews for the DTIS, Zambian traders and farmers representatives pointed to
the country’s non-GMO policies as providing an element of non-tariff protection. For exports, it was
said that other non-GMO countries in the region have few other places to look to other than Zambia for
non-GMO maize. Similarly, for imports, Zambia’s non-GMO restrictions were said to be a key factor
underlying the surge in soybean production in that GM soya could be imported from Brazil, Argentina,
and the USA for less than the costs of domestic production. Given that COMESA, EAC, and SADC
countries are currently looking to establish a tripartite free trade area between the three regional bodies
non-GMO requirements are likely to be a hot negotiating topic in the near future.
4.98 There is also an important risk that unless and until Zambia becomes a reliable non-GMO
exporter (i.e. with steady and predictable availability of export permits for maize and other
commodities) that Zambia’s supposedly “protected” regional market will disappear because of
buyers having no choice but to look elsewhere. Moreover, without GMO restrictions Zambia itself
would have less reason to worry about being able to import maize in a deficit year so would have little
reason to impose export restrictions to begin with.
Quality analysis
4.99 Although Zambia does not require its exports to be accompanied by a quality certificate,
proof of compliance with Zambian Standards is compulsory for 44 different categories of import. In
agriculture, the products subject to mandatory inspection the Zambia Bureau of Standards (ZABS) are:
animal feeds for cattle, pigs, and poultry; maize meal; wheat flour; refined edible vegetable oil; and all
types of fertilizer. Compliance with standards is also mandatory for certain food products including clear
and opaque beer, fruit flavored drinks, and peanut butter. Zambia does not recognize foreign quality
certificates and to avoid delay at the border, importers are advised to send a pre-shipment sample for
ZABS testing at least two weeks before the expected arrival in Zambia.
4.100 The cost of ZABS inspection is shown in Table 4.14 using the example of imported
fertilizer. In this example, the total cost per 50kg bag is equal to about 2% of the commercial retail price
in Zambia’s main farm areas. Importers have complained they never hear back from ZABS on the quality
test results and must pay for separate private tests is they wish to have the results for commercial use.
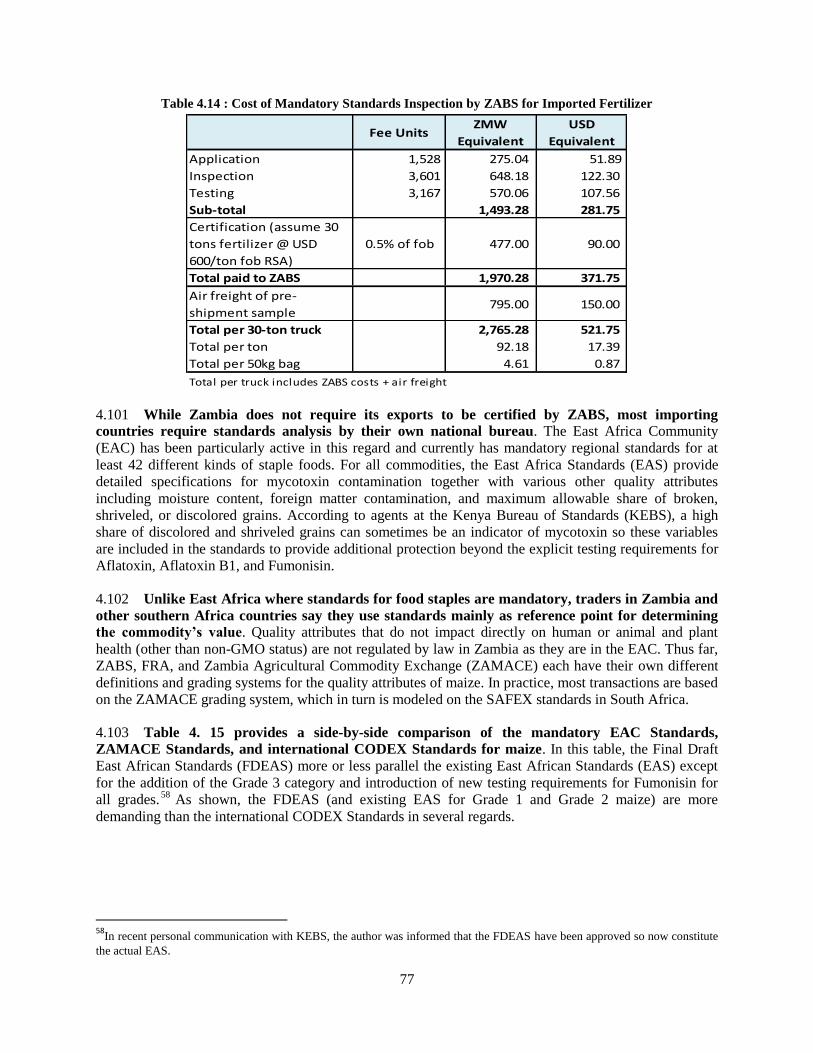
77
Table 4.14 : Cost of Mandatory Standards Inspection by ZABS for Imported Fertilizer
4.101 While Zambia does not require its exports to be certified by ZABS, most importing
countries require standards analysis by their own national bureau. The East Africa Community
(EAC) has been particularly active in this regard and currently has mandatory regional standards for at
least 42 different kinds of staple foods. For all commodities, the East Africa Standards (EAS) provide
detailed specifications for mycotoxin contamination together with various other quality attributes
including moisture content, foreign matter contamination, and maximum allowable share of broken,
shriveled, or discolored grains. According to agents at the Kenya Bureau of Standards (KEBS), a high
share of discolored and shriveled grains can sometimes be an indicator of mycotoxin so these variables
are included in the standards to provide additional protection beyond the explicit testing requirements for
Aflatoxin, Aflatoxin B1, and Fumonisin.
4.102 Unlike East Africa where standards for food staples are mandatory, traders in Zambia and
other southern Africa countries say they use standards mainly as reference point for determining
the commodity’s value. Quality attributes that do not impact directly on human or animal and plant
health (other than non-GMO status) are not regulated by law in Zambia as they are in the EAC. Thus far,
ZABS, FRA, and Zambia Agricultural Commodity Exchange (ZAMACE) each have their own different
definitions and grading systems for the quality attributes of maize. In practice, most transactions are based
on the ZAMACE grading system, which in turn is modeled on the SAFEX standards in South Africa.
4.103 Table 4. 15 provides a side-by-side comparison of the mandatory EAC Standards,
ZAMACE Standards, and international CODEX Standards for maize. In this table, the Final Draft
East African Standards (FDEAS) more or less parallel the existing East African Standards (EAS) except
for the addition of the Grade 3 category and introduction of new testing requirements for Fumonisin for
all grades.58
As shown, the FDEAS (and existing EAS for Grade 1 and Grade 2 maize) are more
demanding than the international CODEX Standards in several regards.
58
In recent personal communication with KEBS, the author was informed that the FDEAS have been approved so now constitute
the actual EAS.
Fee UnitsZMW
Equivalent
USD
Equivalent
Application 1,528 275.04 51.89
Inspection 3,601 648.18 122.30
Testing 3,167 570.06 107.56
Sub-total 1,493.28 281.75
Certification (assume 30
tons fertilizer @ USD
600/ton fob RSA)
0.5% of fob 477.00 90.00
Total paid to ZABS 1,970.28 371.75
Air freight of pre-
shipment sample 795.00 150.00
Total per 30-ton truck 2,765.28 521.75
Total per ton 92.18 17.39
Total per 50kg bag 4.61 0.87
Total per truck includes ZABS costs + air freight
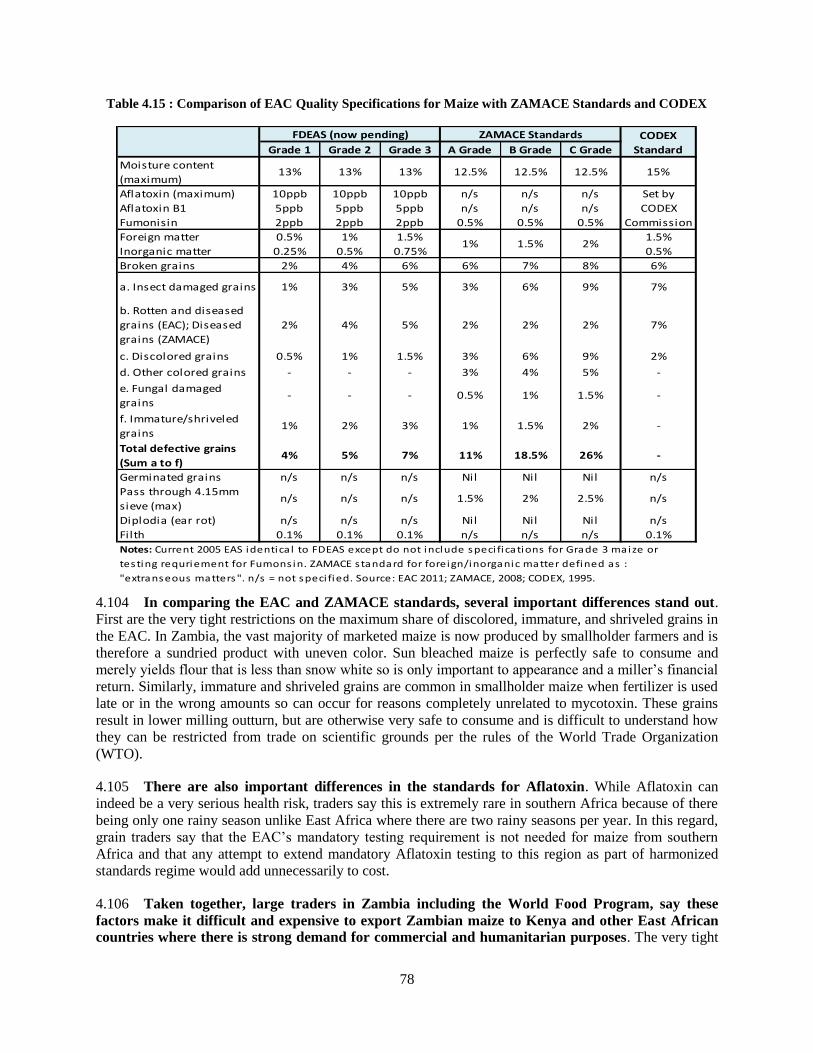
78
Table 4.15 : Comparison of EAC Quality Specifications for Maize with ZAMACE Standards and CODEX
4.104 In comparing the EAC and ZAMACE standards, several important differences stand out.
First are the very tight restrictions on the maximum share of discolored, immature, and shriveled grains in
the EAC. In Zambia, the vast majority of marketed maize is now produced by smallholder farmers and is
therefore a sundried product with uneven color. Sun bleached maize is perfectly safe to consume and
merely yields flour that is less than snow white so is only important to appearance and a miller’s financial
return. Similarly, immature and shriveled grains are common in smallholder maize when fertilizer is used
late or in the wrong amounts so can occur for reasons completely unrelated to mycotoxin. These grains
result in lower milling outturn, but are otherwise very safe to consume and is difficult to understand how
they can be restricted from trade on scientific grounds per the rules of the World Trade Organization
(WTO).
4.105 There are also important differences in the standards for Aflatoxin. While Aflatoxin can
indeed be a very serious health risk, traders say this is extremely rare in southern Africa because of there
being only one rainy season unlike East Africa where there are two rainy seasons per year. In this regard,
grain traders say that the EAC’s mandatory testing requirement is not needed for maize from southern
Africa and that any attempt to extend mandatory Aflatoxin testing to this region as part of harmonized
standards regime would add unnecessarily to cost.
4.106 Taken together, large traders in Zambia including the World Food Program, say these
factors make it difficult and expensive to export Zambian maize to Kenya and other East African
countries where there is strong demand for commercial and humanitarian purposes. The very tight
Grade 1 Grade 2 Grade 3 A Grade B Grade C Grade
Moisture content
(maximum)13% 13% 13% 12.5% 12.5% 12.5% 15%
Aflatoxin (maximum) 10ppb 10ppb 10ppb n/s n/s n/s
Aflatoxin B1 5ppb 5ppb 5ppb n/s n/s n/s
Fumonisin 2ppb 2ppb 2ppb 0.5% 0.5% 0.5%
Foreign matter 0.5% 1% 1.5% 1.5%
Inorganic matter 0.25% 0.5% 0.75% 0.5%
Broken grains 2% 4% 6% 6% 7% 8% 6%
a. Insect damaged grains 1% 3% 5% 3% 6% 9% 7%
b. Rotten and diseased
grains (EAC); Diseased
grains (ZAMACE)
2% 4% 5% 2% 2% 2% 7%
c. Discolored grains 0.5% 1% 1.5% 3% 6% 9% 2%
d. Other colored grains - - - 3% 4% 5% -
e. Fungal damaged
grains- - - 0.5% 1% 1.5% -
f. Immature/shriveled
grains1% 2% 3% 1% 1.5% 2% -
Total defective grains
(Sum a to f)4% 5% 7% 11% 18.5% 26% -
Germinated grains n/s n/s n/s Nil Nil Nil n/s
Pass through 4.15mm
sieve (max)n/s n/s n/s 1.5% 2% 2.5% n/s
Diplodia (ear rot) n/s n/s n/s Nil Nil Nil n/s
Filth 0.1% 0.1% 0.1% n/s n/s n/s 0.1%
Notes: Current 2005 EAS identica l to FDEAS except do not include speci fications for Grade 3 maize or
testing requriement for Fumons in. ZAMACE standard for foreign/inorganic matter defined as :
"extranseous matters". n/s = not speci fied. Source: EAC 2011; ZAMACE, 2008; CODEX, 1995.
FDEAS (now pending) ZAMACE Standards CODEX
Standard
Set by
CODEX
Commission
1% 1.5% 2%
79
restrictions on total defective grains (4-7% in the EAC compared with 11-26% according to ZAMACE)
was identified as a particular constraint.
4.107 Finally, it should be noted that any attempt to promote Zambia’s compliance with EAC and
other international standards needs to be supported with appropriate domestic marketing policies.
Given the FRA is driven in no small part by social and political concerns, Zambia’s farm gate marketing
system is not well geared to reject smallholder maize. Basic sieving is sometimes carried out at FRA
depots, but there are no other routine quality tests of the kind needed to ensure compliance with
international or even domestic quality standards. With the lack of such checks and absence of price
incentives (and price penalties) for quality, exporters and domestic millers say they have to visit several
FRA depots at a reported cost ZMW 13.25 (USD 2.50) per ton per place inspected to find acceptable
quality grain. In 2010 ZAMACE was implementing a project funded by USAID to train farmers in on-
farm grading, but reports this initiative was severely undermined by the FRA’s program of buying all
smallholder maize at fixed pan-territorial prices.
Product registration and testing
4.108 In addition to specific trade licenses, phytosanitary certificates, and quality certificates, all
types of seed, fertilizer, and agrichemicals imported to Zambia must be registered with ZARI
and/or other statutory agency. Product registration is customarily done to ensure the product is safe and
effective to use given the country’s own agri-climatic conditions. In Zambia, suitability trials for seed
require a minimum of two full crop cycles before a new product is approved (in Malawi and many other
countries, the process is longer and takes from three to four crop cycles). The costs of the seed tests are
paid for by the seed company. Once a product is approved, annual fees are also charged by ZARI for re-
registration. In addition, agribusiness firms must register each type of fertilizer, agrichemical, and seed
they plan to handle with the Zambia Environmental Management Agency (ZEMA) annually at cost of
ZMW 1,560 (USD 295) per product.
4.109 Given ZARI, ZABS, and ZEMA each claim responsibility for ensuring that products are
safe and effective to use through their own registration and testing procedures, traders complain
for widespread for confusion over which agency is truly responsible and speculate that the
procedures are more about collecting revenue than genuine quality control. At ZABS, for example, a
copy of the product standard for maize grains costs ZMW 250 (USD 47.17) and the standard for
compound fertilizer costs ZMW 200 (USD 37.74). Even to be shown a copy of the standards at the ZABS
Library, a potential importer or exporter must pay ZMW 100 (USD 18.87) per year to become a library
member. Apart from the lost revenue, ZABS could easily make pdf copies of Zambian Standards
available on its website that would go a long way to building a constituency for standards and, ultimately,
to improving regional trade conditions, product quality, and competitiveness.
4.110 In the livestock sector, high fees and duplicate charges also apply to the registration of
veterinary medicines. In this case, each medicine and even each different size vile must be registered
annually with the Pharmaceutical Registration Agency (PRA) at a cost of ZMW 1,900 (USD 358.50) per
product and with Zambia Environmental Management Agency (ZEMA) at a cost of ZMW 1,500 (USD
283.00) per product. On top of these fees, 2% of the invoice amount for all vet medicines imported to
Zambia must be paid to the Veterinary Department as “screening charge.”
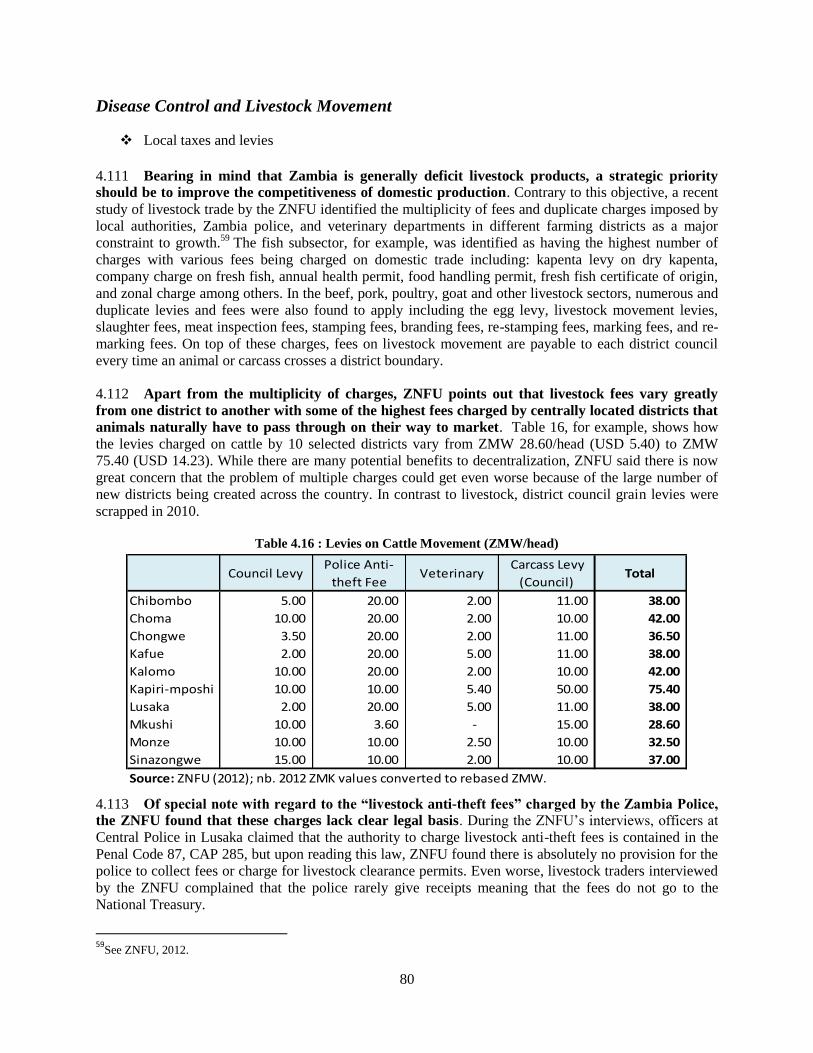
80
Disease Control and Livestock Movement
Local taxes and levies
4.111 Bearing in mind that Zambia is generally deficit livestock products, a strategic priority
should be to improve the competitiveness of domestic production. Contrary to this objective, a recent
study of livestock trade by the ZNFU identified the multiplicity of fees and duplicate charges imposed by
local authorities, Zambia police, and veterinary departments in different farming districts as a major
constraint to growth.59
The fish subsector, for example, was identified as having the highest number of
charges with various fees being charged on domestic trade including: kapenta levy on dry kapenta,
company charge on fresh fish, annual health permit, food handling permit, fresh fish certificate of origin,
and zonal charge among others. In the beef, pork, poultry, goat and other livestock sectors, numerous and
duplicate levies and fees were also found to apply including the egg levy, livestock movement levies,
slaughter fees, meat inspection fees, stamping fees, branding fees, re-stamping fees, marking fees, and re-
marking fees. On top of these charges, fees on livestock movement are payable to each district council
every time an animal or carcass crosses a district boundary.
4.112 Apart from the multiplicity of charges, ZNFU points out that livestock fees vary greatly
from one district to another with some of the highest fees charged by centrally located districts that
animals naturally have to pass through on their way to market. Table 16, for example, shows how
the levies charged on cattle by 10 selected districts vary from ZMW 28.60/head (USD 5.40) to ZMW
75.40 (USD 14.23). While there are many potential benefits to decentralization, ZNFU said there is now
great concern that the problem of multiple charges could get even worse because of the large number of
new districts being created across the country. In contrast to livestock, district council grain levies were
scrapped in 2010.
Table 4.16 : Levies on Cattle Movement (ZMW/head)
4.113 Of special note with regard to the “livestock anti-theft fees” charged by the Zambia Police,
the ZNFU found that these charges lack clear legal basis. During the ZNFU’s interviews, officers at
Central Police in Lusaka claimed that the authority to charge livestock anti-theft fees is contained in the
Penal Code 87, CAP 285, but upon reading this law, ZNFU found there is absolutely no provision for the
police to collect fees or charge for livestock clearance permits. Even worse, livestock traders interviewed
by the ZNFU complained that the police rarely give receipts meaning that the fees do not go to the
National Treasury.
59
See ZNFU, 2012.
Council LevyPolice Anti-
theft FeeVeterinary
Carcass Levy
(Council) Total
Chibombo 5.00 20.00 2.00 11.00 38.00
Choma 10.00 20.00 2.00 10.00 42.00
Chongwe 3.50 20.00 2.00 11.00 36.50
Kafue 2.00 20.00 5.00 11.00 38.00
Kalomo 10.00 20.00 2.00 10.00 42.00
Kapiri-mposhi 10.00 10.00 5.40 50.00 75.40
Lusaka 2.00 20.00 5.00 11.00 38.00
Mkushi 10.00 3.60 - 15.00 28.60
Monze 10.00 10.00 2.50 10.00 32.50
Sinazongwe 15.00 10.00 2.00 10.00 37.00
Source: ZNFU (2012); nb. 2012 ZMK values converted to rebased ZMW.
81
Prospects for a disease free export zone
4.114 In terms of potential beef exports, it should be noted that Zambia is fundamentally
constrained by the fact that food and mouth disease (FMD) is endemic. Unless this problem can be
addressed, Zambia cannot expect to export beef or beef products to non-FMD countries. There has thus
been a long-standing interest in the potential to establish a certified disease-free export corridor in order
access supposedly lucrative export markets in Europe and other developed country markets.
4.115 Botswana and Namibia, for example, each enjoy EU market access and there is a general
perception that Zambia would do well to target the same outlet. In reality, however, the certification
of Botswana and Namibia as disease free exporters has only come at a very high cost with very strict
controls on livestock movement (including construction of fences between the so-called red, yellow, and
green zones that span almost the entire width of Botswana) and animal traceability (either through ear
tagging or a bolus that must be used to track the complete vaccination record of every beef animal in the
disease free zone). In 2011, Botswana temporarily lost its EU export status and a recent detailed value
chain study of the Botswana beef sector study by the FAO raises serious questions over whether the EU is
even the most profitable market compared with closer by and easier to serve developing county markets.60
4.116 According to the livestock experts met for the Zambia DTIS, in fact, establishment of a
disease free export zone in Zambia is generally unfeasible for various reasons including: (i) very high
and uneconomical cost of establishing and maintaining such an area; (ii) the need to limit movement of all
other livestock into the disease free zone thereby preventing small farmers access to urban consumers;
and (iii) generally poor economies of scale for even very large companies to supply specific meat cut
requirements in the EU. The relatively high price of beef in Zambia compared with world prices and fact
that Zambia is deficit in livestock products further militates against the potential for establishing a disease
free zone. Very simply, meat suppliers say that it is much more profitable (and easier) to supply the
domestic market and that they would be interested in exporting to the EU even if this were possible.
Compared with high-profile EU markets, regional markets including the DRC where FMD restrictions do
not apply were identified as being of much greater commercial interest. Some companies already operate
sales points near the DRC border to cater to informal traders.
4. CASE STUDY EXAMPLES OF ACTUAL TRADE COSTS
4.117 This part of the DTIS chapter builds on the discussion of Zambia’s recent agriculture trade
performance and trade management challenges with two case study examples of actual trade costs.
The first example looks at the costs of formal and informal sector maize trade with the Democratic
Republic of Congo and the second considers the costs of cross border movement at the Mwami/Mchinji
border with Malawi. In an open economy, price is determined competitively and value flows upstream
from the consumer to each producer and marketing agent in the chain. All trade costs and profit margins
taken by government regulators, agriculture processors, rural traders, and other value chain participants
before the product’s value reaches the farm level therefore have a direct bearing on the price that can be
paid to producers, and thus rural incomes and potential for growth and livelihood improvement.
Maize Trade with Democratic Republic of Congo
4.118 The first example of how trade costs have a direct impact on rural incomes is to look at the
costs of cross-border movement at the Kasumbalesa border between Zambia and the Democratic
Republic of Congo. Compared with all other foreign markets, Katanga Province in the DRC is the one
location where Zambia enjoys a fundamental transport advantage over every other international
60
See Van Eglen, et. al. (2012).
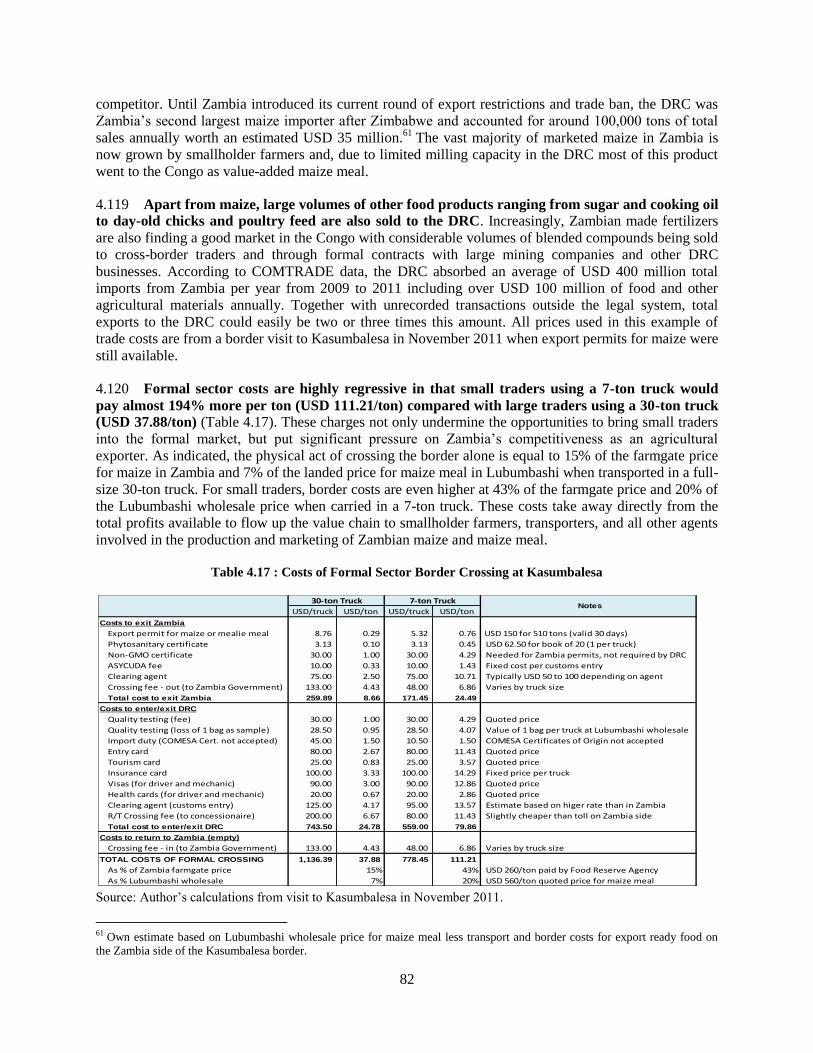
82
competitor. Until Zambia introduced its current round of export restrictions and trade ban, the DRC was
Zambia’s second largest maize importer after Zimbabwe and accounted for around 100,000 tons of total
sales annually worth an estimated USD 35 million.61
The vast majority of marketed maize in Zambia is
now grown by smallholder farmers and, due to limited milling capacity in the DRC most of this product
went to the Congo as value-added maize meal.
4.119 Apart from maize, large volumes of other food products ranging from sugar and cooking oil
to day-old chicks and poultry feed are also sold to the DRC. Increasingly, Zambian made fertilizers
are also finding a good market in the Congo with considerable volumes of blended compounds being sold
to cross-border traders and through formal contracts with large mining companies and other DRC
businesses. According to COMTRADE data, the DRC absorbed an average of USD 400 million total
imports from Zambia per year from 2009 to 2011 including over USD 100 million of food and other
agricultural materials annually. Together with unrecorded transactions outside the legal system, total
exports to the DRC could easily be two or three times this amount. All prices used in this example of
trade costs are from a border visit to Kasumbalesa in November 2011 when export permits for maize were
still available.
4.120 Formal sector costs are highly regressive in that small traders using a 7-ton truck would
pay almost 194% more per ton (USD 111.21/ton) compared with large traders using a 30-ton truck
(USD 37.88/ton) (Table 4.17). These charges not only undermine the opportunities to bring small traders
into the formal market, but put significant pressure on Zambia’s competitiveness as an agricultural
exporter. As indicated, the physical act of crossing the border alone is equal to 15% of the farmgate price
for maize in Zambia and 7% of the landed price for maize meal in Lubumbashi when transported in a full-
size 30-ton truck. For small traders, border costs are even higher at 43% of the farmgate price and 20% of
the Lubumbashi wholesale price when carried in a 7-ton truck. These costs take away directly from the
total profits available to flow up the value chain to smallholder farmers, transporters, and all other agents
involved in the production and marketing of Zambian maize and maize meal.
Table 4.17 : Costs of Formal Sector Border Crossing at Kasumbalesa
Source: Author’s calculations from visit to Kasumbalesa in November 2011.
61 Own estimate based on Lubumbashi wholesale price for maize meal less transport and border costs for export ready food on
the Zambia side of the Kasumbalesa border.
USD/truck USD/ton USD/truck USD/ton
Costs to exit Zambia
Export permit for maize or mealie meal 8.76 0.29 5.32 0.76 USD 150 for 510 tons (valid 30 days)
Phytosanitary certificate 3.13 0.10 3.13 0.45 USD 62.50 for book of 20 (1 per truck)
Non-GMO certificate 30.00 1.00 30.00 4.29 Needed for Zambia permits, not required by DRC
ASYCUDA fee 10.00 0.33 10.00 1.43 Fixed cost per customs entry
Clearing agent 75.00 2.50 75.00 10.71 Typically USD 50 to 100 depending on agent
Crossing fee - out (to Zambia Government) 133.00 4.43 48.00 6.86 Varies by truck size
Total cost to exit Zambia 259.89 8.66 171.45 24.49
Costs to enter/exit DRC
Quality testing (fee) 30.00 1.00 30.00 4.29 Quoted price
Quality testing (loss of 1 bag as sample) 28.50 0.95 28.50 4.07 Value of 1 bag per truck at Lubumbashi wholesale
Import duty (COMESA Cert. not accepted) 45.00 1.50 10.50 1.50 COMESA Certificates of Origin not accepted
Entry card 80.00 2.67 80.00 11.43 Quoted price
Tourism card 25.00 0.83 25.00 3.57 Quoted price
Insurance card 100.00 3.33 100.00 14.29 Fixed price per truck
Visas (for driver and mechanic) 90.00 3.00 90.00 12.86 Quoted price
Health cards (for driver and mechanic) 20.00 0.67 20.00 2.86 Quoted price
Clearing agent (customs entry) 125.00 4.17 95.00 13.57 Estimate based on higer rate than in Zambia
R/T Crossing fee (to concessionaire) 200.00 6.67 80.00 11.43 Slightly cheaper than toll on Zambia side
Total cost to enter/exit DRC 743.50 24.78 559.00 79.86
Costs to return to Zambia (empty)
Crossing fee - in (to Zambia Government) 133.00 4.43 48.00 6.86 Varies by truck size
TOTAL COSTS OF FORMAL CROSSING 1,136.39 37.88 778.45 111.21
As % of Zambia farmgate price 15% 43% USD 260/ton paid by Food Reserve Agency
As % Lubumbashi wholesale 7% 20% USD 560/ton quoted price for maize meal
30-ton Truck 7-ton Truck Notes
83
4.121 In terms of trade documents, formal sector traders at Kasumbalesa require an export
permit from the Zambia Ministry of Agriculture and Livestock and a phytosanitary from the
Zambia Agriculture Research Institute. The DRC does not require a non-GMO certificate, but traders
must still pay for this since it needs to be shown when exiting Zambia and is required to obtain both the
Zambia export permit and phytosanitary certificate. Trade with the DRC does not require quality analysis
by the Zambia Bureau of Standards. Nevertheless, DRC inspectors routinely draw one or two 25kg bags
from each truck for their own analysis and charge USD 30 for the inspection. Exporters have said they
never hear anything about the test results and speculate that the samples are sold or used for food instead.
4.122 The DRC is not a FTA member of COMESA and border officials therefore do not recognize
COMESA Certificates of Origin and instead charge a flat duty of USD 1.50 per ton regardless of
where the maize is from. Traders also noted that DRC requires all maize meal to be packed in bags
showing the expiry date. Zambia does not have the same requirement and millers must print special bags
to meet the DRC’s labeling standard.
4.123 In addition to the specific trade costs for maize, Table 4.17 shows that the DRC requires all
foreign trucks to purchase a vehicle entry card, tourism card, and insurance card, as well as visas
and health cards for the driver and driver’s assistant. The total cost of these certificates was reported
to be USD 315 equal to USD 10.50 per ton or 1.9% of the landed price of maize meal in Lubumbashi for
a large 30-ton load and USD 40.00 per ton (7.1% of the Lubumbashi price) for a small 7-ton load.
Moreover, licensed clearing agents must be used on both sides of the border for a total reported cost of
around USD 200 per 30-ton truck (6.67 per ton) or USD 170 (24.29 per ton) for a 7-ton truck.
4.124 Finally, Table 17 shows that traders must pay very substantial toll fees on both the Zambia
and DRC sides of the border to use the formal channel. New border posts were opened in both
countries in late 2011 by a concessionaire who was originally granted a license by the Zambian and the
DRC governments to charge a tolls, or “crossing fees” to use the facilities it constructed. Toll charges
vary by truck size, but are very high at USD 15.53/ton for a 30-ton truck (41% of all border costs) and
even higher at USD 25.14/ton (23% of all costs) for a 7-ton truck. In January 2012, the Zambian
Government terminated the concessionaire’s contract over concerns for corruption and took over the
revenue collection itself. The toll charges, however, were not reduced by GRZ and traders continue to pay
the same high fees as before.
4.125 Once on the DRC side of the border, Zambian millers further report they expect to pay an
additional USD 300 for official and unofficial fees and bribes to travel 100km from Kasumbalesa to
Lubumbashi plus USD 200 for driver allowances. In 2011, millers reported it had become very
difficult to find drivers willing to make the journey to Lubumbashi because of the many inconveniences
and lack of security on this route. In one example, a driver at the border reported he was fined USD 10 at
a DRC roadblock because he was wearing sunglasses but did not have sunglasses in his driving license
photo. More seriously, a Zambia miller said that one of his drivers accidentally knocked a cyclist off his
bicycle when turning a corner. The cyclist was not seriously injured, but it eventually cost over USD
15,000 in compensation and official and unofficial fines and took more than two weeks to get the driver
and vehicle back to Zambia. A return trip from an Ndola mill to Lubumbashi (total distance around
475km) was said to take seven to ten days on average. The trucks usually return empty since there are no
goods to send on a backload.
4.126 Other than the formal route, large amounts of agricultural commodities and other goods
are smuggled through informal channels at Kasumbalesa. Recent attempts to crack down on informal
trade as part of the current maize export restrictions notwithstanding, this trade takes place in broad
daylight immediately adjacent to the two border posts in which a steady stream of bicycles loaded with
heavy bags are walked across the border with Zambian and DRC agents in full view to meet the
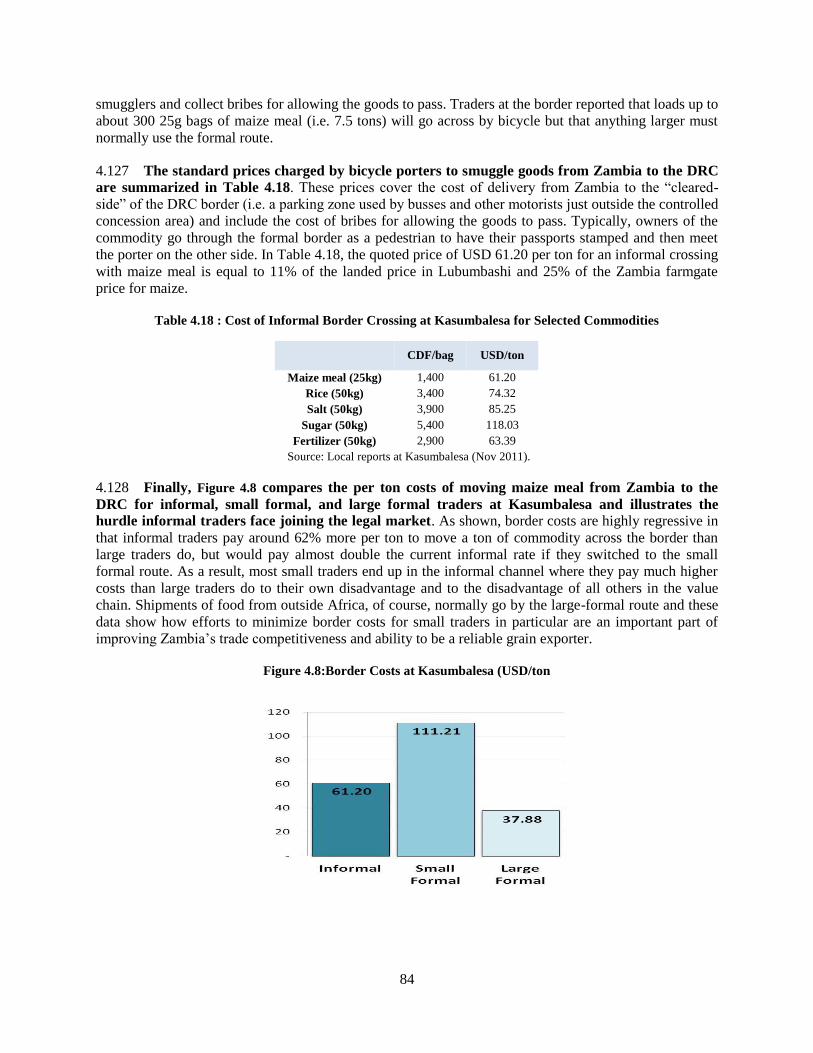
84
smugglers and collect bribes for allowing the goods to pass. Traders at the border reported that loads up to
about 300 25g bags of maize meal (i.e. 7.5 tons) will go across by bicycle but that anything larger must
normally use the formal route.
4.127 The standard prices charged by bicycle porters to smuggle goods from Zambia to the DRC
are summarized in Table 4.18. These prices cover the cost of delivery from Zambia to the “cleared-
side” of the DRC border (i.e. a parking zone used by busses and other motorists just outside the controlled
concession area) and include the cost of bribes for allowing the goods to pass. Typically, owners of the
commodity go through the formal border as a pedestrian to have their passports stamped and then meet
the porter on the other side. In Table 4.18, the quoted price of USD 61.20 per ton for an informal crossing
with maize meal is equal to 11% of the landed price in Lubumbashi and 25% of the Zambia farmgate
price for maize.
Table 4.18 : Cost of Informal Border Crossing at Kasumbalesa for Selected Commodities
CDF/bag USD/ton
Maize meal (25kg)
Rice (50kg)
Salt (50kg)
Sugar (50kg)
Fertilizer (50kg)
1,400
3,400
3,900
5,400
2,900
61.20
74.32
85.25
118.03
63.39
Source: Local reports at Kasumbalesa (Nov 2011).
4.128 Finally, Figure 4.8 compares the per ton costs of moving maize meal from Zambia to the
DRC for informal, small formal, and large formal traders at Kasumbalesa and illustrates the
hurdle informal traders face joining the legal market. As shown, border costs are highly regressive in
that informal traders pay around 62% more per ton to move a ton of commodity across the border than
large traders do, but would pay almost double the current informal rate if they switched to the small
formal route. As a result, most small traders end up in the informal channel where they pay much higher
costs than large traders do to their own disadvantage and to the disadvantage of all others in the value
chain. Shipments of food from outside Africa, of course, normally go by the large-formal route and these
data show how efforts to minimize border costs for small traders in particular are an important part of
improving Zambia’s trade competitiveness and ability to be a reliable grain exporter.
Figure 4.8:Border Costs at Kasumbalesa (USD/ton
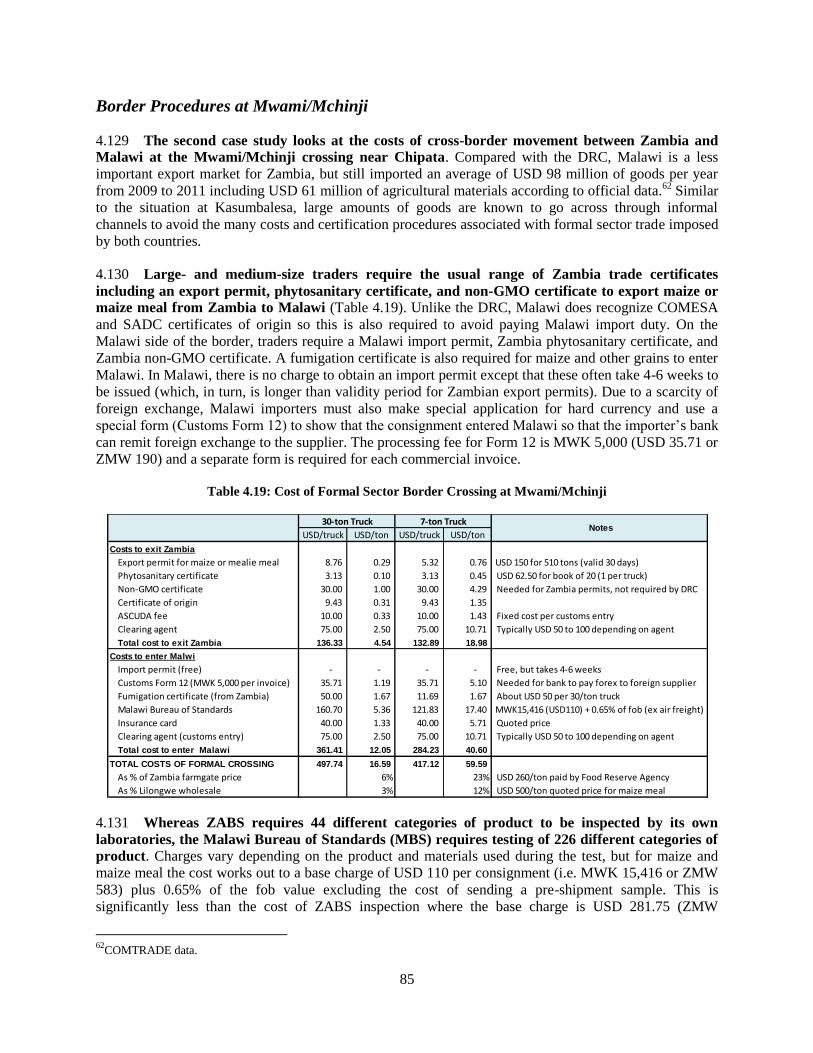
85
Border Procedures at Mwami/Mchinji
4.129 The second case study looks at the costs of cross-border movement between Zambia and
Malawi at the Mwami/Mchinji crossing near Chipata. Compared with the DRC, Malawi is a less
important export market for Zambia, but still imported an average of USD 98 million of goods per year
from 2009 to 2011 including USD 61 million of agricultural materials according to official data.62
Similar
to the situation at Kasumbalesa, large amounts of goods are known to go across through informal
channels to avoid the many costs and certification procedures associated with formal sector trade imposed
by both countries.
4.130 Large- and medium-size traders require the usual range of Zambia trade certificates
including an export permit, phytosanitary certificate, and non-GMO certificate to export maize or
maize meal from Zambia to Malawi (Table 4.19). Unlike the DRC, Malawi does recognize COMESA
and SADC certificates of origin so this is also required to avoid paying Malawi import duty. On the
Malawi side of the border, traders require a Malawi import permit, Zambia phytosanitary certificate, and
Zambia non-GMO certificate. A fumigation certificate is also required for maize and other grains to enter
Malawi. In Malawi, there is no charge to obtain an import permit except that these often take 4-6 weeks to
be issued (which, in turn, is longer than validity period for Zambian export permits). Due to a scarcity of
foreign exchange, Malawi importers must also make special application for hard currency and use a
special form (Customs Form 12) to show that the consignment entered Malawi so that the importer’s bank
can remit foreign exchange to the supplier. The processing fee for Form 12 is MWK 5,000 (USD 35.71 or
ZMW 190) and a separate form is required for each commercial invoice.
Table 4.19: Cost of Formal Sector Border Crossing at Mwami/Mchinji
4.131 Whereas ZABS requires 44 different categories of product to be inspected by its own
laboratories, the Malawi Bureau of Standards (MBS) requires testing of 226 different categories of
product. Charges vary depending on the product and materials used during the test, but for maize and
maize meal the cost works out to a base charge of USD 110 per consignment (i.e. MWK 15,416 or ZMW
583) plus 0.65% of the fob value excluding the cost of sending a pre-shipment sample. This is
significantly less than the cost of ZABS inspection where the base charge is USD 281.75 (ZMW
62
COMTRADE data.
USD/truck USD/ton USD/truck USD/ton
Costs to exit Zambia
Export permit for maize or mealie meal 8.76 0.29 5.32 0.76 USD 150 for 510 tons (valid 30 days)
Phytosanitary certificate 3.13 0.10 3.13 0.45 USD 62.50 for book of 20 (1 per truck)
Non-GMO certificate 30.00 1.00 30.00 4.29 Needed for Zambia permits, not required by DRC
Certificate of origin 9.43 0.31 9.43 1.35
ASCUDA fee 10.00 0.33 10.00 1.43 Fixed cost per customs entry
Clearing agent 75.00 2.50 75.00 10.71 Typically USD 50 to 100 depending on agent
Total cost to exit Zambia 136.33 4.54 132.89 18.98
Costs to enter Malwi
Import permit (free) - - - - Free, but takes 4-6 weeks
Customs Form 12 (MWK 5,000 per invoice) 35.71 1.19 35.71 5.10 Needed for bank to pay forex to foreign supplier
Fumigation certificate (from Zambia) 50.00 1.67 11.69 1.67 About USD 50 per 30/ton truck
Malawi Bureau of Standards 160.70 5.36 121.83 17.40 MWK15,416 (USD110) + 0.65% of fob (ex air freight)
Insurance card 40.00 1.33 40.00 5.71 Quoted price
Clearing agent (customs entry) 75.00 2.50 75.00 10.71 Typically USD 50 to 100 depending on agent
Total cost to enter Malawi 361.41 12.05 284.23 40.60
TOTAL COSTS OF FORMAL CROSSING 497.74 16.59 417.12 59.59
As % of Zambia farmgate price 6% 23% USD 260/ton paid by Food Reserve Agency
As % Lilongwe wholesale 3% 12% USD 500/ton quoted price for maize meal
30-ton Truck 7-ton Truck Notes
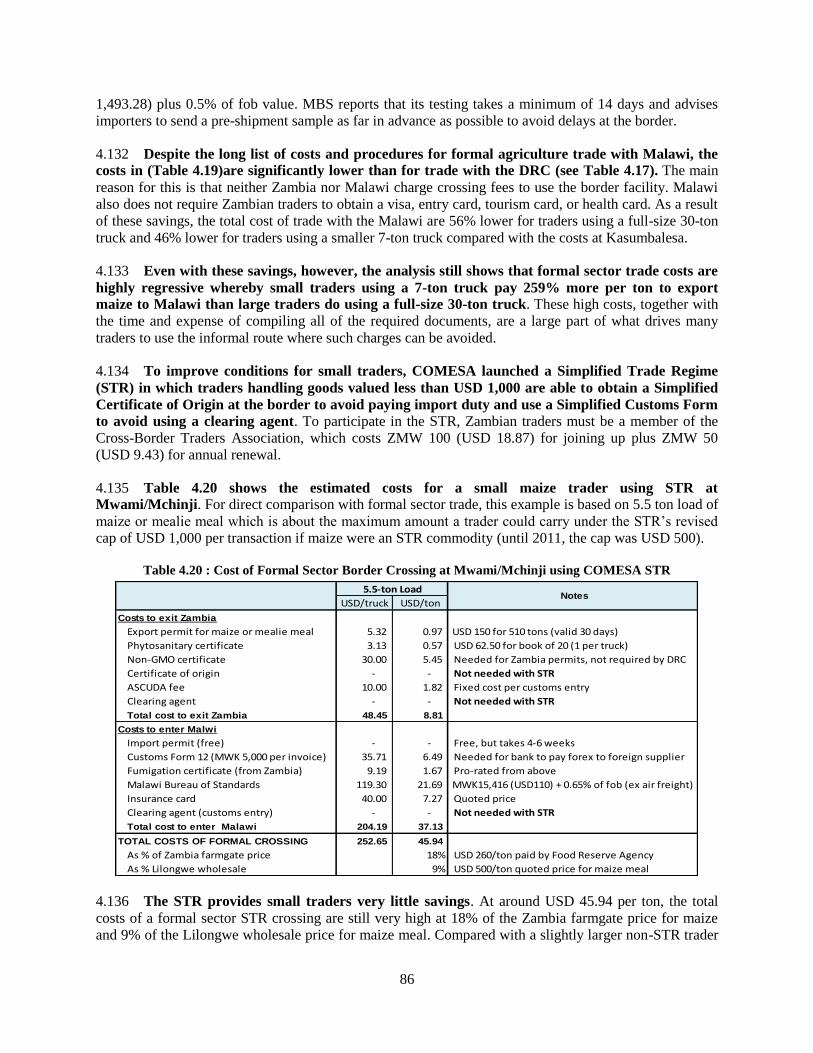
86
1,493.28) plus 0.5% of fob value. MBS reports that its testing takes a minimum of 14 days and advises
importers to send a pre-shipment sample as far in advance as possible to avoid delays at the border.
4.132 Despite the long list of costs and procedures for formal agriculture trade with Malawi, the
costs in (Table 4.19)are significantly lower than for trade with the DRC (see Table 4.17). The main
reason for this is that neither Zambia nor Malawi charge crossing fees to use the border facility. Malawi
also does not require Zambian traders to obtain a visa, entry card, tourism card, or health card. As a result
of these savings, the total cost of trade with the Malawi are 56% lower for traders using a full-size 30-ton
truck and 46% lower for traders using a smaller 7-ton truck compared with the costs at Kasumbalesa.
4.133 Even with these savings, however, the analysis still shows that formal sector trade costs are
highly regressive whereby small traders using a 7-ton truck pay 259% more per ton to export
maize to Malawi than large traders do using a full-size 30-ton truck. These high costs, together with
the time and expense of compiling all of the required documents, are a large part of what drives many
traders to use the informal route where such charges can be avoided.
4.134 To improve conditions for small traders, COMESA launched a Simplified Trade Regime
(STR) in which traders handling goods valued less than USD 1,000 are able to obtain a Simplified
Certificate of Origin at the border to avoid paying import duty and use a Simplified Customs Form
to avoid using a clearing agent. To participate in the STR, Zambian traders must be a member of the
Cross-Border Traders Association, which costs ZMW 100 (USD 18.87) for joining up plus ZMW 50
(USD 9.43) for annual renewal.
4.135 Table 4.20 shows the estimated costs for a small maize trader using STR at
Mwami/Mchinji. For direct comparison with formal sector trade, this example is based on 5.5 ton load of
maize or mealie meal which is about the maximum amount a trader could carry under the STR’s revised
cap of USD 1,000 per transaction if maize were an STR commodity (until 2011, the cap was USD 500).
Table 4.20 : Cost of Formal Sector Border Crossing at Mwami/Mchinji using COMESA STR
4.136 The STR provides small traders very little savings. At around USD 45.94 per ton, the total
costs of a formal sector STR crossing are still very high at 18% of the Zambia farmgate price for maize
and 9% of the Lilongwe wholesale price for maize meal. Compared with a slightly larger non-STR trader
USD/truck USD/ton
Costs to exit Zambia
Export permit for maize or mealie meal 5.32 0.97 USD 150 for 510 tons (valid 30 days)
Phytosanitary certificate 3.13 0.57 USD 62.50 for book of 20 (1 per truck)
Non-GMO certificate 30.00 5.45 Needed for Zambia permits, not required by DRC
Certificate of origin - - Not needed with STR
ASCUDA fee 10.00 1.82 Fixed cost per customs entry
Clearing agent - - Not needed with STR
Total cost to exit Zambia 48.45 8.81
Costs to enter Malwi
Import permit (free) - - Free, but takes 4-6 weeks
Customs Form 12 (MWK 5,000 per invoice) 35.71 6.49 Needed for bank to pay forex to foreign supplier
Fumigation certificate (from Zambia) 9.19 1.67 Pro-rated from above
Malawi Bureau of Standards 119.30 21.69 MWK15,416 (USD110) + 0.65% of fob (ex air freight)
Insurance card 40.00 7.27 Quoted price
Clearing agent (customs entry) - - Not needed with STR
Total cost to enter Malawi 204.19 37.13
TOTAL COSTS OF FORMAL CROSSING 252.65 45.94
As % of Zambia farmgate price 18% USD 260/ton paid by Food Reserve Agency
As % Lilongwe wholesale 9% USD 500/ton quoted price for maize meal
5.5-ton Load Notes
87
dealing in a 7-ton load, the total savings from the STR is a very modest only USD 13.65 per ton.
Compared with a full-size 30-ton load, in fact, costs paid by the STR trader are still USD 29.35/ton
greater due inherently poor economies of scale and continued high cost of complying with all other
formal sector trade procedures. Customs officials report there are currently around 20 STR transactions
per month at the Mwami/Muchinji border for all types of commodity and almost none in agriculture.
5. OPPORTUNITIES FOR ENHANCED TRADE COMPETITIVENESS
4.137 This final section of the DTIS chapter describes some of the main opportunities for Zambia
to improve its agriculture trade performance. While Zambia has enjoyed strong growth in many areas
of agriculture, the country faces a number of uncertainties with regard to maize policy that militate
against long-term investment and trade development. The preceding analysis also shows that agriculture
importers and exporters face a number of high costs, lengthy procedures, and duplicate charges that
undermine Zambia’s trade competitiveness and together lead to high consumer prices and low producer
prices. As discussed, these charges not only arise within Zambia itself but also occur in foreign markets.
Strengthening Zambia’s trade performance therefore depends not only on carefully planned domestic
policy reforms, but also on focused dialogue with regional trade partners to address strategic bottlenecks.
4.138 In approaching trade development, it is also important to bear in mind that any attempt to
pick winners as part of a pre-determined cluster strategy for specific districts and provinces would
be an inherently risky and dangerous strategy for Zambia. Commodities that were predicted to do
very well in the last DTIS such as paprika and export horticulture, for example, have generally not
performed as expected for reasons that would have been difficult if not impossible to predict. Horticulture
continues to struggle on at a fraction of its former size, but paprika is in near total collapse. Taken
together, these and other experiences discussed in this chapter show that development of new agriculture
exports primarily depends on a conducive and stable policy environment to promote domestic and foreign
investment in areas where the private sector itself sees the best growth potential.
Transparent Rules and Market Driven Pricing
4.139 Perhaps the most fundamental building block for rapid agriculture sector growth is the
need for transparent rules and market driven pricing. This is especially true for the maize sector
where input prices, producer prices, and consumer prices have been the subject of various subsidy and
price control interventions that deter private investment and do little to address Zambia’s underlying food
security challenge or to reduce the dependence on rain fed maize production.
4.140 While the question of how to reform Zambia’s input subsidy and output-marketing system
is well beyond the scope of this DTIS, one clear conclusion from the analysis of trade policy is that
there needs to be a firm commitment to keeping Zambia’s borders open. The risk of trade restrictions
or even outright trade bans together with input and output price distortions are important deterrents to
private investment and contribute to the problems of price volatility and uneven production. As discussed,
achieving domestic food security and export growth are not mutually exclusive or even opposing
objectives and could actually be complementary in an improved policy environment.
4.141 In this regard, there needs to be firm and clear government commitment to Zambia being a
reliable maize exporter. To achieve this, one specific strategy put forward by the Grain Traders
Association of Zambia (GTAZ) would be for government guarantee export permits for at least 75% of
GTAZ purchases with the remaining 25% held in reserve for domestic use until the overall food balance
is known. Such a policy would provide a solid foundation for commercial and emergent farmers to return
to maize production while simultaneously guarding against major food security risks. The transmission of
international prices to Zambian farmers through such a system would further lead to more predictable
88
market conditions to the benefit of smallholder farmers and rural consumers alike. To complement this
strategy, grain traders and farmer representatives are likewise of a strong view that the FRA must return
to its original mandated role of maintaining the national food reserve and move away from the
monopsonistic, price-setting role it has played in the recent past.
4.142 While trade bans are seldom successful in achieving their objectives and have been shown
to have many negative effects including forestalled investment and increased food price volatility,
Zambia does face a genuine food security risk of over-exporting its non-GMO maize. Together with
a firm commitment to allowing 75% of privately sourced maize to be exported through GTAZ, one
further strategy for Zambia and its regional trade partners to pursue would be to help traders cope better
with the risk of future bans and trade restrictions. Throughout Africa, trade bans on food staples are often
poorly communicated meaning that traders and even border officials often do not know what the real
situation is.
4.143 An obvious first step, therefore, would be to improve communication of when trade bans
are put in place, when they are lifted, and what restrictions actually apply. In practical terms, such
information could easily be communicated over the internet by way of an official COMESA or SADC
website. This would be a particularly good area for immediate dialogue with Zambia’s partners in APEI.
Building on the strategy for improved communication, a further area for dialogue would be to make
implementation of trade bans or other restrictions more predictable. This may be difficult to achieve, but
efforts to agree a set of verifiable conditions under which Zambia and other governments could exercise
their discretion to implement different kinds of restrictions would be a good area for dialogue, especially
if such a system were be geared to provide an early warning of when these measures might be put in
place. The USAID project, FEWS NET has done extensive work in Africa to develop systems for
predicting food shortages that could be a good starting point for such a system.
4.144 In a similar way, one final and very clear-cut area where much could be done to improve
market transparency to the benefit of smallholder farmers and traders alike would be to re-launch
the SMS-based price information system established under the Smallholder Enterprise Marketing
Program (SHEMP) together with ZNFU. Members of the Zambia Cross-Border Traders’ Association
said they used this system extensively but complained that it collapsed when SHEMP closed. Under this
system, market prices were available for 12 commodities including eight crops (maize, soybeans, wheat,
groundnuts, cassava, sunflower, sorghum, and beans) and four livestock products (beef, goats, pigs, and
sheep) by province and district.
Streamlining of Trade Procedures
4.145 The discussion of trade requirements showed how many duplicate and overlapping
procedures exist that add to the costs of trade and undermine Zambia’s export competitiveness.
While economies of scale are natural and to be expected, the worst effect of these charges are felt by
small-scale traders for whom the charges are highly regressive and leave little choice other than to engage
in informal transactions outside the legal system.
4.146 To improve this situation, dialogue at the national and regional levels on opportunities to
streamline and eliminate unnecessary trade procedures would be a good practical strategy for
Zambia to explore. One very obvious area for improvement, for example, would be to streamline the
procedures for non-GMO certification. Zambia does not allow any kind of GMO seed to enter its borders
yet requires non-GMO certification of all agriculture exports regardless of the importing country’s own
GMO requirements. Such procedures could easily be dropped without jeopardizing Zambia’s status as a
purely non-GMO country. In broader terms, there could also potential for transitioning to a spot check
system. While some small quantities of GMO seeds may have entered the country through illegal routes,
89
there have not been any major interceptions of GMO crops and random sampling of warehouses and grain
storage depots would be much less burdensome approach for Zambian traders (particularly for small
traders) compared with mandatory analysis of every export consignment.
4.147 Various requirements for product registration and testing could also be streamlined.
Whereas government departments such as ZARI remit their funds to the national budget, statutory
agencies such as ZABS, ZEMA, PRA, and others depend on the revenue collected to fund at least part of
their operations. Traders and farmer representatives have therefore complained that the requirements
these agencies impose are more about revenue collection than actual trade facilitation. Rather than charge
high prices for copies of its standards specifications, for example, ZABS could easily make pdf copies
available on its website for free that would go a long way to increasing awareness for standards and
building a constituency for quality improvement. Similarly, in the case of vet medicines, having to
register each product (and each different size vile) with both the PRA and Veterinary Office is clearly
redundant and could easily be streamlined to the benefit livestock development and trade competitiveness.
4.148 Whatever trade requirements Zambia and its regional partners choose to implement, the
most important is for these to match buyer requirements. At the regional level, standards certification
can be a particular problem whereby Zambia and other countries have imposed mandatory minimum
standards and testing procedures for various products that not only add to trade costs but also sometimes
do not even correspond with actual buyer requirements or supplier capabilities. The EAC harmonized
standards for maize grains is a good example of this where minimum specifications for discolored and
shriveled grains are a specific constraint to market participation by Zambian (and other southern Africa)
smallholder farmers. Increased awareness of these issues including the important distinction between
voluntary quality standards used to determine private value, and mandatory SPS requirements used to
protect human, animal, and plant health will be critical for successful economic integration between APEI
countries and at the broader tri-partite level as EAC, COMESA, and SADC begin to negotiate the terms
of on a regional free trade agreement.
Regional Trade of Inputs
4.149 Apart from the obvious need to improve FISP service delivery and increase opportunities
for emerging Zambian companies to participate in the supply of fertilizer, considerable potential
exists to enhance farmer access to quality inputs and boost Zambia’s exports of seed and fertilizer
through regional trade.
4.150 In the case of seed, the SADC Harmonized Seed Regulatory System has been under
development for more than two decades involving Zambian negotiators. More recently, COMESA
has also proposed a similar harmonized seed system. Among other benefits, the SADC and COMESA
systems would allow for the free trade of any variety of seed that has been registered in two Member
Countries without the need for further testing so would greatly improve farmer access to the latest seed
technologies and create new market opportunities for Zambian seed exports. As Africa’s largest exporter
of seed to other African countries and host of the SADC Seed Unit and COMESA Secretariat, Zambia
potentially has the most to gain from implementation of the SADC and COMESA Seed Systems.
4.151 Before Zambia can benefit from harmonized seed trade, however, the country’s national
seed legislation must be amended so that it is consistent with the regional approach. Towards this
end, Zambia has started to prepare new draft legislation but still needs to conclude the review and push
the revised legislation through Parliament. Other partner countries in SADC and COMESA also need to
adopt appropriate legislation to allow regional trade under the harmonized system. Zambia’s partners in
APEI (Malawi, Mozambique, Seychelles and Mauritius), for example, are all members of SADC and fast
track implementation of regional seed agreement would be good strategy for increased trade.
90
4.152 A further area for regional dialogue through APEI and other channels would be to allow
different blends of fertilizer to be traded freely between countries. At present, Zambian and other
regional exporters face problems moving different blends across borders that do not correspond with each
country’s national specifications and have to submit samples for laboratory analysis in each destination
market. Details of such a system would need to be worked out, but the like the harmonized regulatory
systems for seed, the idea of such an approach would be to (i) permit free entry of fertilizer between
members; (ii) provide for acceptance of fertilizer compounds that have been approved by another
member; and (iii) allow shipments of fertilizer inspected by another member. Harmonized regional
policies would not only reduce transaction costs, but the resulting common market could be of
considerable commercial interest to Zambian fertilizer manufacturers and blending companies.
91
CHAPTER 5: INFORMAL CROSS-BORDER TRADE
1. BACKGROUND ON INFORMAL CROSS-BORDER TRADE
5.1 Informality in general, and informal cross-border trade in particular, are major features of
African economic and social landscapes. Despite the inherent difficulty in measuring informality, this
sector is thought to account for about 40% of African economies, and to have contributed to around 44%
of the observed GDP of Zambia in 2007 (Schneider et al. 2010). The available evidence for sub-Saharan
Africa also suggest that a dominant, and rising, share of non-agricultural jobs is informal (OECD 2009)
and that the informal sector often proves more dynamic than formal economies (Benjamin and Mbaye
2012). Informal cross-border trade (ICBT) 63
is a major component of the informal sector, notably in
Africa. A significant amount of cross-border trade does take place between African countries, but it is
constricted to informal channels and is not measured in official statistics. Such trade is essential for
welfare and poverty reduction, since poor people are intensively engaged in the informal production and
trading of the goods and services that are actually crossing African borders. Allowing these traders to
flourish and gradually integrate into the formal economy would boost trade and the private sector base for
future growth and development.
5.2 While informal trade activities can take place as stand-alone cross-border transactions (e.g.
crossing borders outside of the areas covered by border posts), in many cases informal trade takes
place next to formal trade at border posts. The same goods can cross the border formally or
informally—by foot, bicycle, motorbike, passenger car, bus, carried in small quantities. This requires
measures that will improve the conditions of firms and individuals in informal sectors, increasing their
opportunities to interact with formal sector firms and providing a coherent route towards formality.
Informal sector actors must be seen as providing an enormous opportunity for growth and poverty
reduction rather than simply as a source of revenue loss that must be removed.
5.3 The main drivers of ICBT are: avoidance of burdensome administrative procedures and
taxes and escape from abuses at the border. Informal activities flourish when the transaction costs
incurred by operating through official channels are perceived to be too high, are not compensated by
sufficient benefits, and the required procedures are not transparent. Such conditions are particularly
burdensome for people with small consignments that may not cover the fixed costs of complying with
formal sector procedures. In the case of cross-border trade, this notably includes high customs duties and
taxes, as well as procedures at the border which can be time-consuming, inefficient, or unclear (e.g.
customs, SPS, TBT, immigration). Small traders are likely to find it even harder to comply with complex
requirements and controls, and may not have the capacity and resources needed to take advantage of
regional agreements, such as duty-free entry in COMESA and SADC countries for Zambian products.
Moreover, trade taxes and fixed fees are more easily paid by large traders who can exploit economies of
scale than by cross-border traders dealing in small quantities. Informality can also be used as a means of
avoiding high remaining tariffs for products originating outside a free trade area (e.g. Asian products in
the case of Zambia) or export/import bans64
. Finally, weak enforcement of rules by border officials can
63ICBT here only refers to legitimately produced goods, excluding illicit or banned merchandise. 64
In Zambia, bans or restrictions on exports of maize and other cereal products to neighboring countries have periodically been
imposed by the Food Reserve Agency (FRA), most recently in May 2012 and again in December of the same year, out of concern
for food security or to protect the local livestock sector. Although maize export bans/restriction are a politically sensitive issue,
the efficiency of such measures has been questioned because informal exports of maize tend to replace formal flows. Ad hoc and
inconsistent export bans (for example in February 2013 the FRA blocked exports of 17,000 tons of maize to Zimbabwe but
shortly after agreed to sell 20,000 tons to Tanzania) have also made Zambia an unreliable regional grain supplier, limiting private
sector participation in regional trade and the capacity of regional markets to smooth price and supply shocks (Chapoto 2012).
92
encourage the resort to illegal practices at the border, while arbitrary application of trade procedures, rent
seeking in the form of request for bribes and harassment by officials can lead traders to smuggle goods or
to avoid official border crossings altogether65
.
5.4 Another important factor causing people to engage in ICBT is the lack of better and
accessible income-generating opportunities in the formal sector, especially for more vulnerable
categories such as women and the youth. While informality can be a springboard to growth, people can
be also forced into informality by a degradation of the general environment, such as the recent global
downturn, or by adjustments related to structural transformations, such as the job losses that can result
from large-scale privatizations. This transfer to informality is all the more likely to occur in the absence of
social safety nets or effective policies to support formal job creation. Indeed, the experience shows that
small-scale cross-border trade can play a buffer role in times of economic and political hardships. This
was, for example, the case at the height of economic crisis in Zimbabwe in 2007/08, when many people
went to Zambia and Botswana to buy cheaper products (these trade flows have reportedly declined since
the situation improved in Zimbabwe). Finally, ICBT is an easily entered activity for women, who usually
do not enjoy the same access as men to the formal labor market66
.
5.5 Cross-border trade plays a vital role in bringing goods to consumers that would otherwise
be unavailable. For example, unfavorable weather or conflict can trigger cross-border flows of staple
commodities from surplus to deficit areas, which highlights the role played by these exchanges for food
security in the region. Established informal export and import patterns have for instance been documented
from Mozambique to Malawi, South Africa to Zimbabwe, or Zambia to the DRC67
. Additionally,
products in border regions may flow more naturally to the other side of the border than to the national
market, especially if this area is far from the main domestic consumption centers – this is notably the case
of northern Mozambique, which is fertile but far from Maputo. In Africa, CBT also often reflects long-
standing cultural or ethnic ties between people on each side of an arbitrarily drawn administrative border
(Lesser and Moisé-Leeman 2009).
5.6 Although situations differ in specific countries or border crossings, similarities have been
observed concerning the types of goods exchanged through ICBT and the characteristics of traders.
A wide range of products are traded informally in Southern Africa, which usually mirror to some degree
the products recorded in official trade statistics. The bulk of ICBT concerns small consignments of staple
foods (e.g. maize, rice, beans) and prepared food, as well as basic consumer manufactures (e.g. clothing,
shoes, blankets, small appliances) and cosmetics. While foodstuffs originate to a large extent regionally 68
,
manufactured products include not only regional goods (notably from South Africa) but also extra-
regional ones (particularly from Asia). In fact, a large share of ICBT flows concern re-exports of products
originating from a third country, regional or not, or even donated as food aid (Ackello-Ogutu 1996).
Goods produced outside of the COMESA or SADC FTAs do not benefit from duty-free entry in the
participating countries creating incentives to avoid customs.
5.7 ICBT is therefore of critical economic and social importance for many households in Sub-
Saharan Africa, particularly so in poor households without other income earners (e.g. absent or
unemployed husband). A consistent finding of most studies is that a majority of individual traders are
women, for whom this activity is the main or the only source of income (Lesser and Moisé-Leeman 2009,
65
See Lesser and Moisé-Leeman (2009) for a detailed review of the factors which can foster ICBT. 66
See OECD (2009) for an analysis of the links between economic growth, formal and informal employment. 67
See http://v4.fews.net/docs/Publications/sa_fullmap_maize_norm.pdf 68 According to a recent survey of ICBT between Zambia/Zimbabwe, Zambia/Malawi and Uganda/Kenya, the five most
frequently traded products originating from these countries were agricultural commodities (Njiwa 2012).
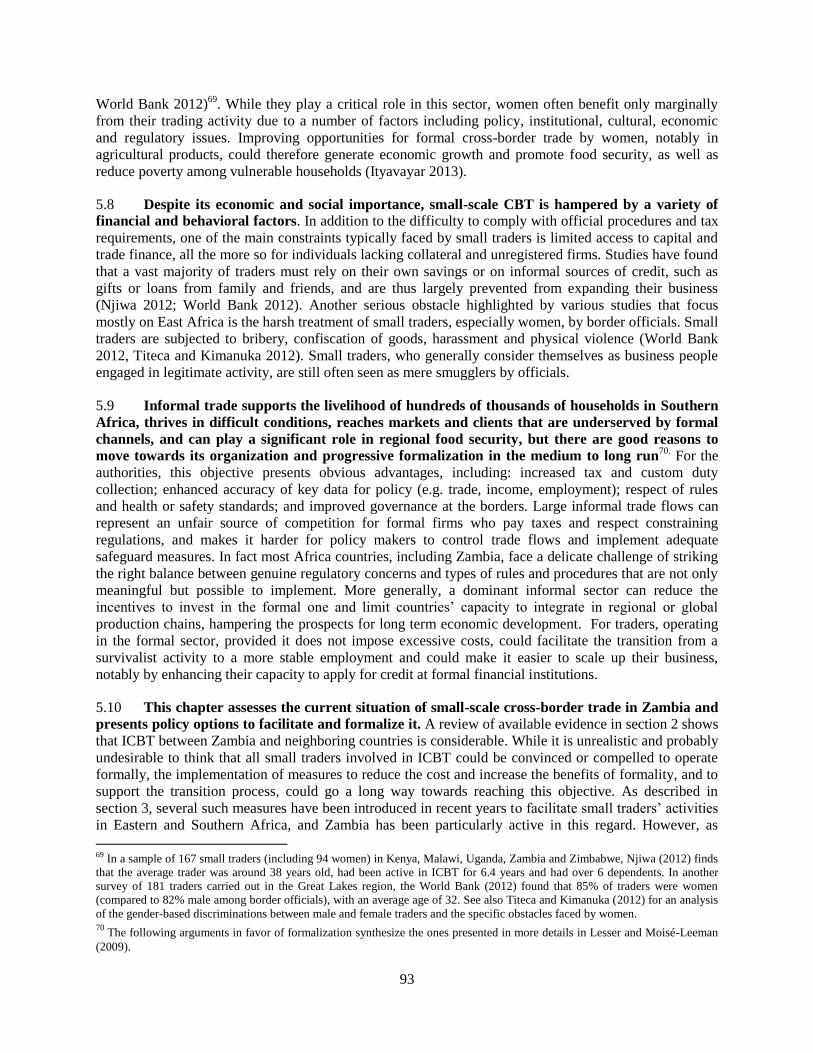
93
World Bank 2012)69
. While they play a critical role in this sector, women often benefit only marginally
from their trading activity due to a number of factors including policy, institutional, cultural, economic
and regulatory issues. Improving opportunities for formal cross-border trade by women, notably in
agricultural products, could therefore generate economic growth and promote food security, as well as
reduce poverty among vulnerable households (Ityavayar 2013).
5.8 Despite its economic and social importance, small-scale CBT is hampered by a variety of
financial and behavioral factors. In addition to the difficulty to comply with official procedures and tax
requirements, one of the main constraints typically faced by small traders is limited access to capital and
trade finance, all the more so for individuals lacking collateral and unregistered firms. Studies have found
that a vast majority of traders must rely on their own savings or on informal sources of credit, such as
gifts or loans from family and friends, and are thus largely prevented from expanding their business
(Njiwa 2012; World Bank 2012). Another serious obstacle highlighted by various studies that focus
mostly on East Africa is the harsh treatment of small traders, especially women, by border officials. Small
traders are subjected to bribery, confiscation of goods, harassment and physical violence (World Bank
2012, Titeca and Kimanuka 2012). Small traders, who generally consider themselves as business people
engaged in legitimate activity, are still often seen as mere smugglers by officials.
5.9 Informal trade supports the livelihood of hundreds of thousands of households in Southern
Africa, thrives in difficult conditions, reaches markets and clients that are underserved by formal
channels, and can play a significant role in regional food security, but there are good reasons to
move towards its organization and progressive formalization in the medium to long run70.
For the
authorities, this objective presents obvious advantages, including: increased tax and custom duty
collection; enhanced accuracy of key data for policy (e.g. trade, income, employment); respect of rules
and health or safety standards; and improved governance at the borders. Large informal trade flows can
represent an unfair source of competition for formal firms who pay taxes and respect constraining
regulations, and makes it harder for policy makers to control trade flows and implement adequate
safeguard measures. In fact most Africa countries, including Zambia, face a delicate challenge of striking
the right balance between genuine regulatory concerns and types of rules and procedures that are not only
meaningful but possible to implement. More generally, a dominant informal sector can reduce the
incentives to invest in the formal one and limit countries’ capacity to integrate in regional or global
production chains, hampering the prospects for long term economic development. For traders, operating
in the formal sector, provided it does not impose excessive costs, could facilitate the transition from a
survivalist activity to a more stable employment and could make it easier to scale up their business,
notably by enhancing their capacity to apply for credit at formal financial institutions.
5.10 This chapter assesses the current situation of small-scale cross-border trade in Zambia and
presents policy options to facilitate and formalize it. A review of available evidence in section 2 shows
that ICBT between Zambia and neighboring countries is considerable. While it is unrealistic and probably
undesirable to think that all small traders involved in ICBT could be convinced or compelled to operate
formally, the implementation of measures to reduce the cost and increase the benefits of formality, and to
support the transition process, could go a long way towards reaching this objective. As described in
section 3, several such measures have been introduced in recent years to facilitate small traders’ activities
in Eastern and Southern Africa, and Zambia has been particularly active in this regard. However, as
69 In a sample of 167 small traders (including 94 women) in Kenya, Malawi, Uganda, Zambia and Zimbabwe, Njiwa (2012) finds
that the average trader was around 38 years old, had been active in ICBT for 6.4 years and had over 6 dependents. In another
survey of 181 traders carried out in the Great Lakes region, the World Bank (2012) found that 85% of traders were women
(compared to 82% male among border officials), with an average age of 32. See also Titeca and Kimanuka (2012) for an analysis
of the gender-based discriminations between male and female traders and the specific obstacles faced by women. 70
The following arguments in favor of formalization synthesize the ones presented in more details in Lesser and Moisé-Leeman
(2009).
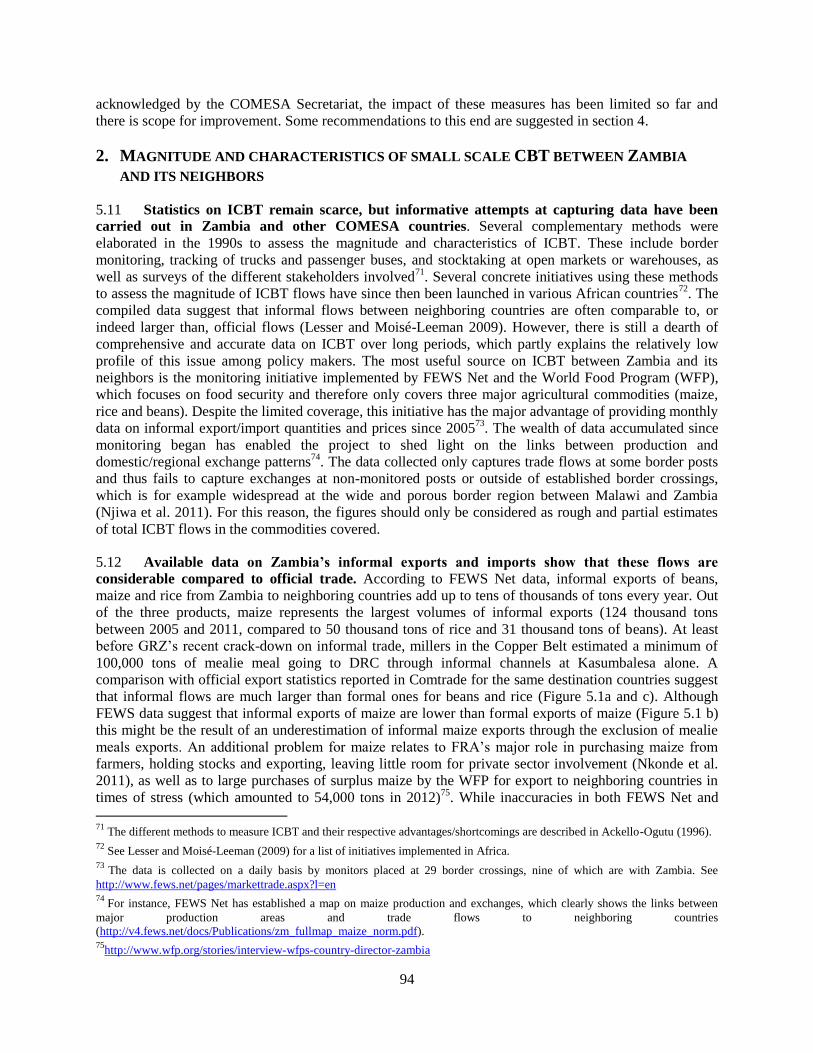
94
acknowledged by the COMESA Secretariat, the impact of these measures has been limited so far and
there is scope for improvement. Some recommendations to this end are suggested in section 4.
2. MAGNITUDE AND CHARACTERISTICS OF SMALL SCALE CBT BETWEEN ZAMBIA
AND ITS NEIGHBORS
5.11 Statistics on ICBT remain scarce, but informative attempts at capturing data have been
carried out in Zambia and other COMESA countries. Several complementary methods were
elaborated in the 1990s to assess the magnitude and characteristics of ICBT. These include border
monitoring, tracking of trucks and passenger buses, and stocktaking at open markets or warehouses, as
well as surveys of the different stakeholders involved71
. Several concrete initiatives using these methods
to assess the magnitude of ICBT flows have since then been launched in various African countries72
. The
compiled data suggest that informal flows between neighboring countries are often comparable to, or
indeed larger than, official flows (Lesser and Moisé-Leeman 2009). However, there is still a dearth of
comprehensive and accurate data on ICBT over long periods, which partly explains the relatively low
profile of this issue among policy makers. The most useful source on ICBT between Zambia and its
neighbors is the monitoring initiative implemented by FEWS Net and the World Food Program (WFP),
which focuses on food security and therefore only covers three major agricultural commodities (maize,
rice and beans). Despite the limited coverage, this initiative has the major advantage of providing monthly
data on informal export/import quantities and prices since 200573
. The wealth of data accumulated since
monitoring began has enabled the project to shed light on the links between production and
domestic/regional exchange patterns74
. The data collected only captures trade flows at some border posts
and thus fails to capture exchanges at non-monitored posts or outside of established border crossings,
which is for example widespread at the wide and porous border region between Malawi and Zambia
(Njiwa et al. 2011). For this reason, the figures should only be considered as rough and partial estimates
of total ICBT flows in the commodities covered.
5.12 Available data on Zambia’s informal exports and imports show that these flows are
considerable compared to official trade. According to FEWS Net data, informal exports of beans,
maize and rice from Zambia to neighboring countries add up to tens of thousands of tons every year. Out
of the three products, maize represents the largest volumes of informal exports (124 thousand tons
between 2005 and 2011, compared to 50 thousand tons of rice and 31 thousand tons of beans). At least
before GRZ’s recent crack-down on informal trade, millers in the Copper Belt estimated a minimum of
100,000 tons of mealie meal going to DRC through informal channels at Kasumbalesa alone. A
comparison with official export statistics reported in Comtrade for the same destination countries suggest
that informal flows are much larger than formal ones for beans and rice (Figure 5.1a and c). Although
FEWS data suggest that informal exports of maize are lower than formal exports of maize (Figure 5.1 b)
this might be the result of an underestimation of informal maize exports through the exclusion of mealie
meals exports. An additional problem for maize relates to FRA’s major role in purchasing maize from
farmers, holding stocks and exporting, leaving little room for private sector involvement (Nkonde et al.
2011), as well as to large purchases of surplus maize by the WFP for export to neighboring countries in
times of stress (which amounted to 54,000 tons in 2012)75
. While inaccuracies in both FEWS Net and
71
The different methods to measure ICBT and their respective advantages/shortcomings are described in Ackello-Ogutu (1996). 72
See Lesser and Moisé-Leeman (2009) for a list of initiatives implemented in Africa. 73
The data is collected on a daily basis by monitors placed at 29 border crossings, nine of which are with Zambia. See
http://www.fews.net/pages/markettrade.aspx?l=en 74
For instance, FEWS Net has established a map on maize production and exchanges, which clearly shows the links between
major production areas and trade flows to neighboring countries
(http://v4.fews.net/docs/Publications/zm_fullmap_maize_norm.pdf). 75
http://www.wfp.org/stories/interview-wfps-country-director-zambia
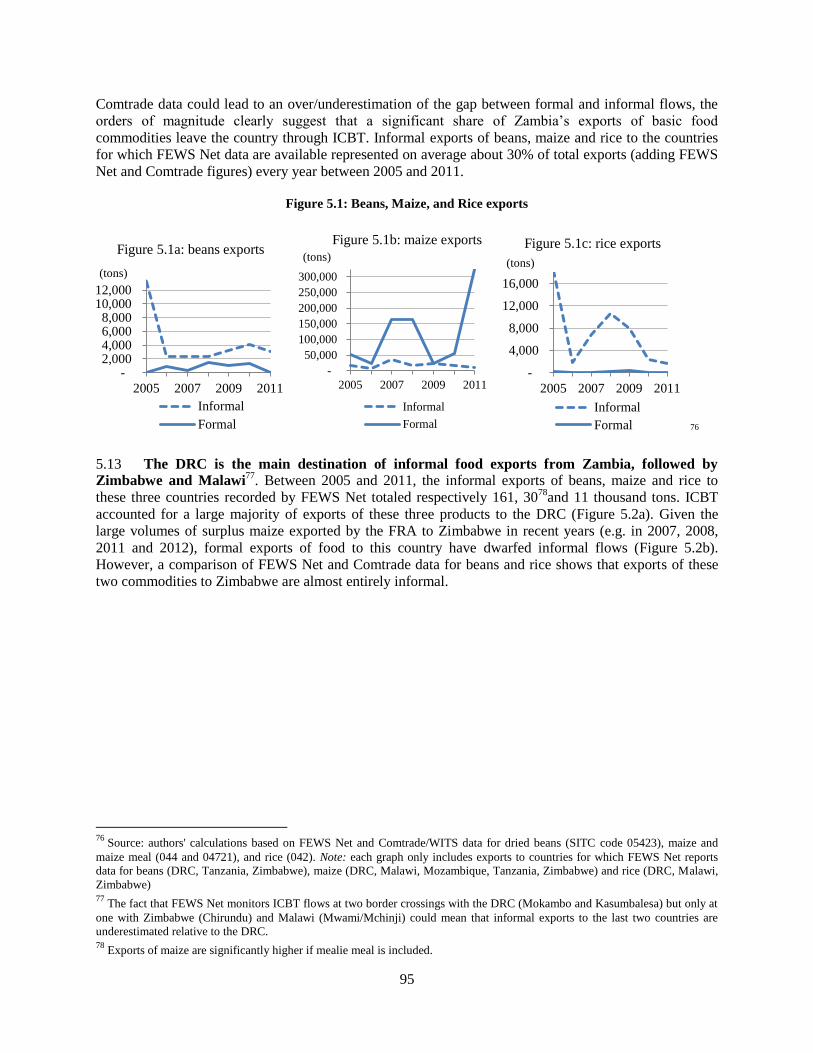
95
Comtrade data could lead to an over/underestimation of the gap between formal and informal flows, the
orders of magnitude clearly suggest that a significant share of Zambia’s exports of basic food
commodities leave the country through ICBT. Informal exports of beans, maize and rice to the countries
for which FEWS Net data are available represented on average about 30% of total exports (adding FEWS
Net and Comtrade figures) every year between 2005 and 2011.
Figure 5.1: Beans, Maize, and Rice exports
76
5.13 The DRC is the main destination of informal food exports from Zambia, followed by
Zimbabwe and Malawi77
. Between 2005 and 2011, the informal exports of beans, maize and rice to
these three countries recorded by FEWS Net totaled respectively 161, 3078
and 11 thousand tons. ICBT
accounted for a large majority of exports of these three products to the DRC (Figure 5.2a). Given the
large volumes of surplus maize exported by the FRA to Zimbabwe in recent years (e.g. in 2007, 2008,
2011 and 2012), formal exports of food to this country have dwarfed informal flows (Figure 5.2b).
However, a comparison of FEWS Net and Comtrade data for beans and rice shows that exports of these
two commodities to Zimbabwe are almost entirely informal.
76
Source: authors' calculations based on FEWS Net and Comtrade/WITS data for dried beans (SITC code 05423), maize and
maize meal (044 and 04721), and rice (042). Note: each graph only includes exports to countries for which FEWS Net reports
data for beans (DRC, Tanzania, Zimbabwe), maize (DRC, Malawi, Mozambique, Tanzania, Zimbabwe) and rice (DRC, Malawi,
Zimbabwe) 77
The fact that FEWS Net monitors ICBT flows at two border crossings with the DRC (Mokambo and Kasumbalesa) but only at
one with Zimbabwe (Chirundu) and Malawi (Mwami/Mchinji) could mean that informal exports to the last two countries are
underestimated relative to the DRC. 78
Exports of maize are significantly higher if mealie meal is included.
- 2,000 4,000 6,000 8,000
10,000 12,000
2005 2007 2009 2011
Figure 5.1a: beans exports
Informal
Formal
(tons)
-
50,000
100,000
150,000
200,000
250,000
300,000
2005 2007 2009 2011
Figure 5.1b: maize exports
Informal
Formal
(tons)
-
4,000
8,000
12,000
16,000
2005 2007 2009 2011
Figure 5.1c: rice exports
Informal
Formal
(tons)
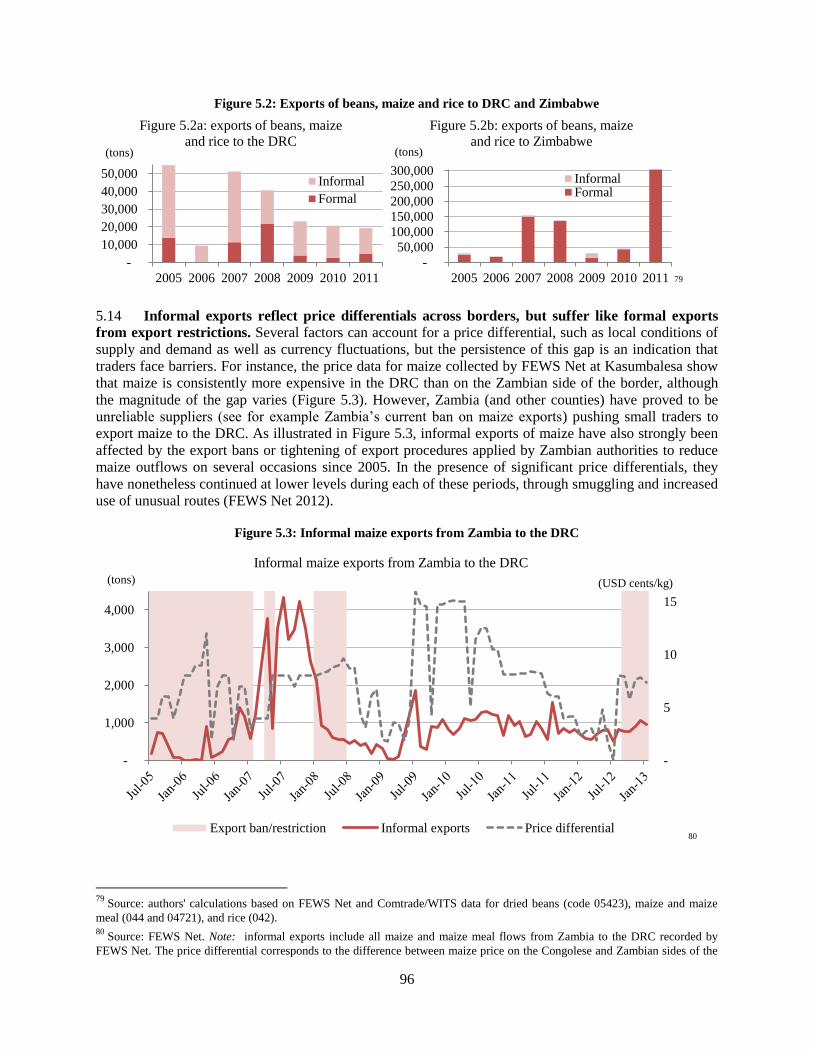
96
Figure 5.2: Exports of beans, maize and rice to DRC and Zimbabwe
79
5.14 Informal exports reflect price differentials across borders, but suffer like formal exports
from export restrictions. Several factors can account for a price differential, such as local conditions of
supply and demand as well as currency fluctuations, but the persistence of this gap is an indication that
traders face barriers. For instance, the price data for maize collected by FEWS Net at Kasumbalesa show
that maize is consistently more expensive in the DRC than on the Zambian side of the border, although
the magnitude of the gap varies (Figure 5.3). However, Zambia (and other counties) have proved to be
unreliable suppliers (see for example Zambia’s current ban on maize exports) pushing small traders to
export maize to the DRC. As illustrated in Figure 5.3, informal exports of maize have also strongly been
affected by the export bans or tightening of export procedures applied by Zambian authorities to reduce
maize outflows on several occasions since 2005. In the presence of significant price differentials, they
have nonetheless continued at lower levels during each of these periods, through smuggling and increased
use of unusual routes (FEWS Net 2012).
Figure 5.3: Informal maize exports from Zambia to the DRC
80
79
Source: authors' calculations based on FEWS Net and Comtrade/WITS data for dried beans (code 05423), maize and maize
meal (044 and 04721), and rice (042). 80
Source: FEWS Net. Note: informal exports include all maize and maize meal flows from Zambia to the DRC recorded by
FEWS Net. The price differential corresponds to the difference between maize price on the Congolese and Zambian sides of the
-
10,000
20,000
30,000
40,000
50,000
2005 2006 2007 2008 2009 2010 2011
Figure 5.2a: exports of beans, maize
and rice to the DRC
Informal
Formal
(tons)
-
50,000
100,000
150,000
200,000
250,000
300,000
2005 2006 2007 2008 2009 2010 2011
Figure 5.2b: exports of beans, maize
and rice to Zimbabwe
InformalFormal
(tons)
-
5
10
15
-
1,000
2,000
3,000
4,000
Informal maize exports from Zambia to the DRC
Export ban/restriction Informal exports Price differential
(tons) (USD cents/kg)
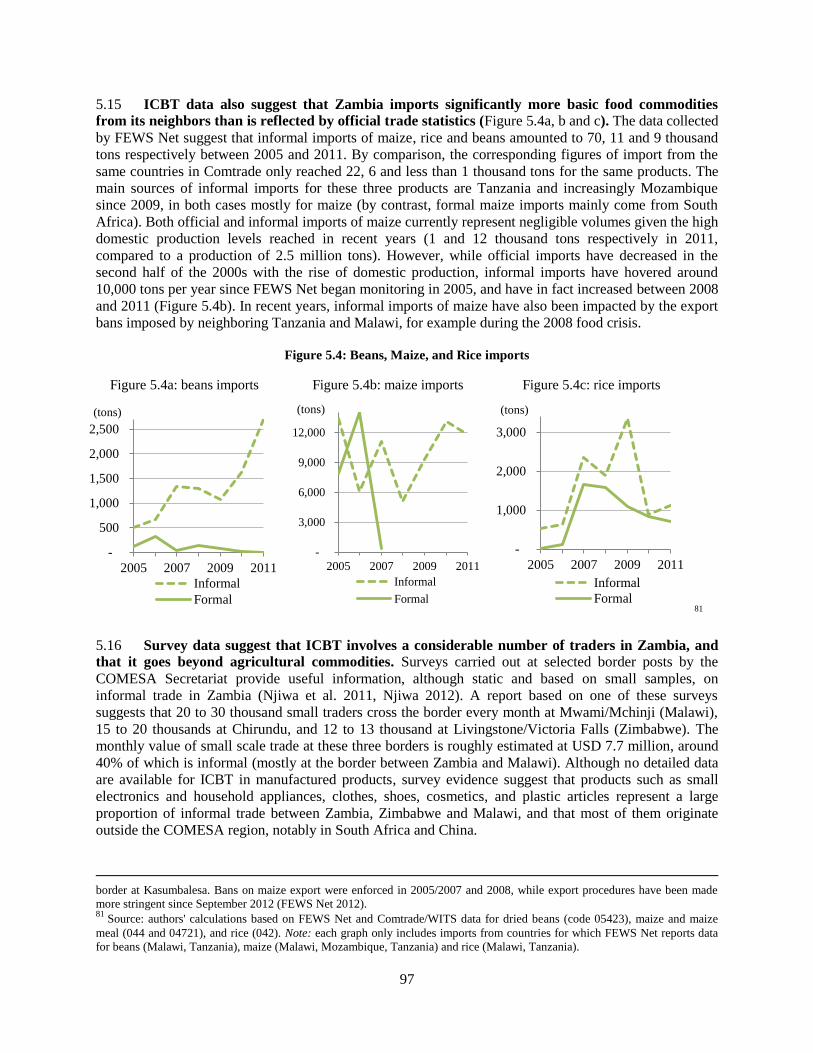
97
5.15 ICBT data also suggest that Zambia imports significantly more basic food commodities
from its neighbors than is reflected by official trade statistics (Figure 5.4a, b and c). The data collected
by FEWS Net suggest that informal imports of maize, rice and beans amounted to 70, 11 and 9 thousand
tons respectively between 2005 and 2011. By comparison, the corresponding figures of import from the
same countries in Comtrade only reached 22, 6 and less than 1 thousand tons for the same products. The
main sources of informal imports for these three products are Tanzania and increasingly Mozambique
since 2009, in both cases mostly for maize (by contrast, formal maize imports mainly come from South
Africa). Both official and informal imports of maize currently represent negligible volumes given the high
domestic production levels reached in recent years (1 and 12 thousand tons respectively in 2011,
compared to a production of 2.5 million tons). However, while official imports have decreased in the
second half of the 2000s with the rise of domestic production, informal imports have hovered around
10,000 tons per year since FEWS Net began monitoring in 2005, and have in fact increased between 2008
and 2011 (Figure 5.4b). In recent years, informal imports of maize have also been impacted by the export
bans imposed by neighboring Tanzania and Malawi, for example during the 2008 food crisis.
Figure 5.4: Beans, Maize, and Rice imports
81
5.16 Survey data suggest that ICBT involves a considerable number of traders in Zambia, and
that it goes beyond agricultural commodities. Surveys carried out at selected border posts by the
COMESA Secretariat provide useful information, although static and based on small samples, on
informal trade in Zambia (Njiwa et al. 2011, Njiwa 2012). A report based on one of these surveys
suggests that 20 to 30 thousand small traders cross the border every month at Mwami/Mchinji (Malawi),
15 to 20 thousands at Chirundu, and 12 to 13 thousand at Livingstone/Victoria Falls (Zimbabwe). The
monthly value of small scale trade at these three borders is roughly estimated at USD 7.7 million, around
40% of which is informal (mostly at the border between Zambia and Malawi). Although no detailed data
are available for ICBT in manufactured products, survey evidence suggest that products such as small
electronics and household appliances, clothes, shoes, cosmetics, and plastic articles represent a large
proportion of informal trade between Zambia, Zimbabwe and Malawi, and that most of them originate
outside the COMESA region, notably in South Africa and China.
border at Kasumbalesa. Bans on maize export were enforced in 2005/2007 and 2008, while export procedures have been made
more stringent since September 2012 (FEWS Net 2012). 81
Source: authors' calculations based on FEWS Net and Comtrade/WITS data for dried beans (code 05423), maize and maize
meal (044 and 04721), and rice (042). Note: each graph only includes imports from countries for which FEWS Net reports data
for beans (Malawi, Tanzania), maize (Malawi, Mozambique, Tanzania) and rice (Malawi, Tanzania).
-
500
1,000
1,500
2,000
2,500
2005 2007 2009 2011
Figure 5.4a: beans imports
Informal
Formal
(tons)
-
3,000
6,000
9,000
12,000
2005 2007 2009 2011
Figure 5.4b: maize imports
Informal
Formal
(tons)
-
1,000
2,000
3,000
2005 2007 2009 2011
Figure 5.4c: rice imports
Informal
Formal
(tons)
98
5.17 Greater recognition by policy makers of the importance of smallholder trade, together with
enhanced quality and quantity of relevant information, are needed in Zambia. There is a dearth of
detailed data on (informal) cross border trade between Zambia and its neighbors. The authorities could
consider conducting regular data-collection exercises and surveys covering as many border crossings,
means of transportation and type of products as possible. They could follow the model developed by the
Uganda Bureau of Statistics and the Bank of Uganda to undertake a series of surveys of informal cross-
border trade between Zambia and its neighboring countries. Such data would be a major asset to guide
policy on trade, regional integration, food security and poverty reduction. In the meantime, the available
evidence already suggests that informal cross-border trade flows are large, notably concerning
agricultural commodities. This fully justifies the initiatives in Zambia and at the COMESA level to
facilitate and progressively formalize this trade.
3. INITIATIVES TO FORMALIZE ICBT IN ZAMBIA AND IMPLEMENTATION
CHALLENGES
5.18 Zambia has been at the forefront of recent regional efforts intended to facilitate small scale
cross-border trade. Those efforts build on the idea that general trade facilitation measures aimed at
reducing the complexity, time and cost of formal trade procedures benefit all traders, and can also serve to
entice SMEs -which totally or partially resort to informality in their trade activities- to comply with
existing rules82
. Several such measures have been implemented at the COMESA level (e.g. the
community’s single Customs Document) or bilaterally (e.g. the pilot one-stop border post between
Zambia and Zimbabwe at Chirundu). However, the characteristics of most small scale cross-border
traders, including their limited resources and the very low volume of their transactions, require targeted
facilitation and support measures. Since 2009, Zambia has been part of a small group of countries which
have taken part in regional initiatives on ICBT spearheaded by the COMESA Secretariat and its Cross-
Border Trade Desk83
:
- Simplified Trade Regime (STR): the STR is implemented since 2010 at Zambia’s borders with
Zimbabwe (three border posts) and with Malawi (one border post). In principle, traders carrying
certain goods produced in the COMESA FTA and worth less than USD 1,000, don’t need to use a
certificate of origin or licensed clearing agent in order to enable them to claim duty free
treatment84
. The STR has been improved in 2011 based on evaluations and traders’ requests, but
it still only offers a partial solution to the issues faced by small traders85
. In particular, the STR
does not relieve small traders of other costly obligations at the borders, such as permits and
certificates (e.g. SPS compliance for agricultural products), and the payment of non-customs
taxes. Moreover, implementation of the STR on the ground by customs officials is often
incomplete or perceived as arbitrary by traders86
. Finally, the STR is currently not in place at
borders with the DRC (non-FTA member of the COMESA) and does not apply to products
originating from non COMESA countries such as Botswana, Tanzania, Mozambique, South
Africa or China. All this has so far resulted in a low usage of the STR by small traders, who
82
See Lesser and Moisé-Leeman (2009) for a full discussion. 83
http://cbtcomesa.com 84
Another advantage is the fact that transactions using the STR’s Simplified Customs Document (SCD) can be captured in
ASYCUDA, providing valuable data on small-scale cross border trade that was previously unrecorded (Njiwa 2012). 85
See DPC & Associates (2010), COMESA (2011) and Njiwa and Oldham (2011) for detailed information about the STR, the
challenges related to its implementation and its evolution. 86
For instance, some traders complain that the common list of products eligible to the STR is “disregarded” by Zimbabwean
officials at Livingstone/Victoria Falls, and claim that they have been refused STR treatment for consignments that should have
qualified (interviews November 2012).
99
continue to resort to smuggling and/or alternative methods87
. One such method is to declare under
the “traveler’s rebate” system, which grants duty-free entry for small quantities of goods for
personal use, irrespective of their origin (Njiwa 2012). This system is not adapted to commercial
activity and only applies to people carrying very limited number of items, forcing small traders to
do numerous trips across the border and preventing them from scaling up their business88
.
Officials are aware of the use of this system, but tolerate it at a small scale and receive facilitation
payment.
- Trade Information Desks (TIDs): COMESA has supported the institution of such desks with one
officer at each STR implementing border to (i) help small traders use the STR and deal with other
formalities, (ii) disseminate information on trade procedures and regional initiatives, and (iii) act
as a liaison between traders and border authorities in daily operations. TIDs have generally been
found to provide useful services to traders where they exist, but there are still issues concerning
their sustainability in terms of funding and staffing (Njiwa and Oldham 2011). For example, a
financing gap of the COMESA Secretariat’s CBT program has recently resulted in a long
payment delays for officers at TIDs and the departure of some of these officers.
- Cross-Border Traders’ Associations (CBTAs): these associations have been founded in several
COMESA countries over the past decade (the Zambian CBTA is the oldest and was registered in
2000). They have played a significant role to help organize small traders and raise the profile of
ICBT-related issues at the domestic and the regional levels. However, most still have small active
memberships as well as insufficient human and financial resources, and offer limited concrete
services to traders. CBTAs’ limited capacity to develop evidence-based analysis and their erratic
participation at policy debates have so far restricted their ability to defend their policy agenda and
their members’ interests.
5.19 Despite recent progress, significant obstacles continue to hamper small traders’ operations
and to make informality a more attractive option. The main obstacles fall in three broad categories:
- Cost of trade procedures: interviews with cross-border traders in Livingstone/Victoria Falls and
Kazungula made it clear that the level of taxes and other costs of formal procedures at the border
is a major concern, and one of the main reasons for resorting to informality. The STR does not
exempt traders from paying applicable domestic taxes on entering goods, such as VAT89
, excise
on certain products (e.g. alcoholic beverages, tobacco, fuels) and presumptive tax for traders who
are not registered tax payers90
. The distinction between customs duty (waived under the STR for
products originating from the COMESA FTA) and other taxes may not be easily understood by
87
For example a female trader who imports blankets from South Africa and sells them at the “Zimbabwe Market” in Livingstone
explained that officials try to overvalue the goods in order to charge more duties, and that traders are “forced to undervalue” or
conceal items to make a profit. 88
Another female trader interviewed at the COMESA market in Victoria Falls explained that customs officials allow her to carry
six pieces of linen clothing per day under the rebate system (which she buys in Lusaka and sells for around two dollars each), but
that she would be charged duties and taxes that can exceed the value of the goods if she brought them in bulk. She admitted
openly that the only way for her to make a profit was to smuggle more items, despite the risk of being caught. 89
Agricultural products and basic foodstuffs are zero rated or exempt of VAT in several countries, including Malawi, Zambia,
and Zimbabwe. This tax is thus normally not be paid by traders importing such products in these countries. 90
This tax is notably charged in Zimbabwe at a rate of 6% of the value of goods. The equivalent in Zambia is the Advance
Income Tax, also charged at 6% (see http://www.zra.org.zm).
100
small traders, who claim that what they officially have to pay is too high given the value of their
goods and does not allow them to make a profit. In addition, fees are generally applied to certain
procedures (e.g. SPS certification, data entry into ASYCUDA during STR transactions), which
can be disproportionately high for small traders given the very small margins they are working
with. For instance, Zambia and Malawi still charge ten and thirty dollars respectively for each
STR transaction processed in ASYCUDA, despite the lobbying of CBTAs and the ministerial
recommendation that the fee be pegged at one dollar (COMESA 2011a, Njiwa 2012). This heavy
burden creates strong incentives for small traders to avoid official border crossings, smuggle
goods or pay bribes to officials. Focusing on customs duty only is therefore unlikely to
significantly reduce the level of ICBT.
- Complexity of trade procedures: even when small traders manage to take advantage of the STR,
the number, the complexity, the length and the cost of trade procedures is a major obstacle for
actors who have limited capacities and frequently cross the border. The centralization of certain
procedures, notably the issuance of export/import permit and SPS certification for agricultural
products in capital cities, make them costly for all traders but prohibitively so for the smaller
ones. For instance, traders at Livingstone/ Victoria Falls can obtain a permit from the Ministry of
Agriculture in Livingstone to import products in Zambia, but must go to Harare if they want to do
the same in Zimbabwe. This permit is deemed expensive and only has a limited validity in time,
making it not worthy to trade agricultural products, at least through official channels.
- Other practical limitations at borders, such as the lack of storage or testing infrastructure for SPS
controls, also tend to make compliance with the rules complicated for small traders (Njiwa 2012).
As a result a majority of small scale trade in agricultural products remains informal - up to 70% in
the case of trade with Malawi according to Njiwa et al (2011).
- Although the length of procedures at the borders does not seem to be a major issue for small
traders (presumably because many of them resort to facilitation payments), obtaining clearance of
goods can be much longer for SMEs trading larger quantities.
- Finally, access to clear information on export and import procedures is often a challenge for
traders, especially if they are inexperienced and/or illiterate. For instance, a person interviewed in
Lusaka planned on exporting maize bran to Botswana, where it is in short supply. He explained
how he lost considerable time figuring out the requirements and sequence to be followed, in part
because the officials he met in various institutions were not able to give him clear and consistent
indications. In his words “lack of information is what is derailing the whole thing”. Three weeks
after a contract was signed with an interested buyer in Botswana, the exporter was still struggling
to obtain the required documentation in Lusaka.
- Opaque and arbitrary application of rules also often means that small traders are not able to claim
the advantages they are entitled to, even when they are aware of them. In this case, it is much
easier and less risky to pay a bribe and pass than to argue with officials.
- Hostility towards small traders: despite policymakers growing interest in facilitating CBT and
effective progress at some border points, crossing some of Zambia’s borders remains a challenge
for small traders, due to explicit or implicit obstacles imposed to limit their activities. Beside
formal rules, officials’ attitude towards small traders is an important factor in their decision on
where to cross the border. For example, Njiwa et al (2011) observed that many more traders pass
through the official border post at Mwami in Zambia than at Mchinji on the Malawian side (by
101
crossing borders outside of the areas covered by border posts), meaning that they use alternative
routes to avoid the less trader-friendly Malawian border post.
- Traders at Kazungula affirmed that border officials on both sides are only concerned with trucks
but “do not need” small traders, and that they voluntarily impose obstacles to discourage them
from crossing the border there (one trader declared: “at Kazungula, a small trader is an enemy”).
Traders notably complain that they are charged high duties, and that officials often refuse to let
them carry goods under the “grocery entitlement” for personal use as is practiced at other borders.
- Other reasons advanced by traders include high customs duties despite the STR, excessive
processing fees, foreign exchange restrictions, and numerous police check points. Another female
trader in Livingstone explained that groups of traders bringing manufactured goods from South
Africa by minibus drive through Botswana and then through Zimbabwe in order to cross the
border at Livingstone/Victoria Falls (i.e. cross an extra border), rather than crossing directly from
Botswana at Kazungula where officials are deemed less “flexible”.
- Another obstacles recently imposed is the refusal to let small traders be carried by car all the way
to the Kazungula ferry dock like they used to, meaning that they must offload at the Botswana
border post and walk over half a kilometer with their goods (boys hired to help carry the goods
have reportedly been banned from getting near the Zambian border post).
- Finally, obstacles are not always faced at the borders, or imposed by officials: one trader in
Livingstone reported that sellers in Botswana refuse to deal with Zambian traders if they do not
use local transport up to the border, and that they can be reported to the police if they come with
their own cars. As a result, some traders stopped bringing goods from Botswana. As another
example, Njiwa (2012) reports that traders frequently complain about the high market fees they
have to pay and the poor trading, storage and sanitation infrastructure at markets.
4. MOVING FORWARD TO FACILITATE SMALL SCALE CBT
5.20 Genuine attempts to facilitate CBT and create incentives for formalization have been made
in recent years, but more efforts are needed to generalize progress. This section provides
recommendations to improve existing initiatives, such as the STR, and suggests ways to reduce small-
scale trade transaction costs and tackle other major obstacles leading small traders and SMEs to
informality. In practice, small traders face both common constraints, due to their limited resources and the
characteristics of their activity, and specific obstacles at different borders. While it is advisable that the
Zambian authorities implement general domestic interventions to facilitate small scale CBT, a
complementary way of tackling the most binding issues would be to organize bilateral or regional
consultations between Zambia and neighboring countries, with the relevant public agencies, CBTAs and
other stakeholders such as the COMESA Secretariat’s CBT Desk. The analysis on the Mwami/Mchinji
border crossing in the Malawi DTIS shows that Zambia’s practice of charging for trade permits (while
Malawi does not) renders the STR uncompetitive. These consultations would have a broader scope than
custom duties and rules of origin (addressed through the STR), and would aim at identifying and
committing to remove the main obstacles faced by small traders, starting with “quick wins” that are both
easily implemented and beneficial for traders.
Simplified trade regime
5.21 The STR must be comprehensively reformed and improved to maximize its usage by small
traders and ensure its sustainability. Several evaluations carried out since the launch of the STR (e.g.
DPC & Associates 2010, Njiwa and Oldham 2011, Njiwa 2012) offer detailed recommendations to
102
improve the system, but were adopted at the ministerial level (COMESA 2011a). Decisions such as
capping the processing fee charged to enter STR transactions in ASYCUDA at USD 1 have not been
implemented in practice. The level of the STR threshold is also a contentious issue and traders have been
advocating for an upward revision, although most transactions are below the current threshold of USD
1,000 (Njiwa 2012). One alternative to raising the threshold per trip could be to give registered traders an
equivalent maximum monthly value of STR transactions, allowing traders to carry more goods per trip,
reduce transaction costs and scale up their trade activity.
5.22 The STR common lists need to be expanded. Another area where improvement is needed is the
use of “common lists” to determine which products are eligible for the STR, as this system creates room
for fraud by traders and arbitrary application by officials (Njiwa 2012). In addition, requirements to
comply with various standards and mandatory inspections render STR uncompetitive.
5.23 Finally, one limitation of the STR is the small number of countries that are applying it. Although
the creation of an single STR at the Tripartite level (COMESA-EAC-SADC) is desirable in the medium
run, Zambia should push for its implementation at its border with the DRC (once this country joins the
COMESA FTA) and for the adoption of a similar mechanism in the SADC, which would facilitate small
scale CBT with Botswana, Mozambique and Tanzania.
5.24 While the authorities have embraced the concept of the STR, monitoring of the system’s
implementation on the ground has been insufficient and should be enhanced. For example, several
decisions taken at the ministerial in 2011 have still not been implemented. In some cases, traders
complain that officials do not respect the STR and charge duties for products on the common list. The
Zambian authorities should therefore ensure the respect of commitments made and regularly monitor the
effective implementation of the mechanism at all border posts, for example through periodic checks on
the ground or consultations with customs and the CBTA. In cases where the STR rules are not respected,
the Zambia CBTA and TIDs should gather concrete evidence and lobby the government to correct the
situation or push partner countries to do so if the issue is on the other side of the border. Bilateral
meetings associating border agencies and CBTAs on both sides of the border could also be organized at
the technical level on a biannual basis or when a particular issue related to the implementation of the STR
arises.
5.25 It is critical to ensure that all actors have access to complete and up-to-date information
about procedures at the border, including the STR. Interviews with small traders suggest that many
still have no or very limited knowledge of the STR’s purpose and rules (e.g. why products originating
outside the COMESA are not eligible, why taxes other than custom duties still have to be paid even for
eligible products). Better information sharing and sensitization on trade and customs procedures ranked
first on the list of recommendations provided by traders surveyed by Njiwa (2102) to facilitate their
activities. Efforts are also needed to ensure that all customs officials at STR implementing borders have a
complete understanding of the system and are aware of its most recent revisions. One issue is that, despite
training on the STR, the high turnover among custom officials has made it hard to build durable capacity.
Moreover, the implementation of the STR may be conflicting with other objectives given to officials,
such as revenue collection targets from higher authorities, and more clarity is needed in this regard. Better
information dissemination on the STR and other applicable trade regulations/taxes would be a relatively
easy and cheap way to ensure a better take up by small traders and to incentivize them to operate
formally. Providing accessible information is primarily the responsibility of border agencies (including
the display of the updated common list at all implementing border post and prior notice of changes to the
rules), but the CBTA and TIDs are natural partners to ensure that this information reaches all small
traders and MSMEs. This could for example be done by updating and distributing the STR guide prepared
when the initiative was launched, or by organizing communication campaigns and meetings with traders
at borders and in the main trading centers.
103
Cross Border Traders Associations(CBTA) and Trade Information Desks (TID)
5.26 The Zambia Cross Border Traders Association could play a pivotal role to facilitate and
formalize ICBT, but it must develop its capacity and provide better services to its members. CBTAs
in Zambia and neighboring countries are essential to defend small traders’ interest and promote initiatives
such as a reformed STR that brings real benefits to traders In the absence of a strong representative
association, traders are left to “look for solutions at the individual level on a case-by-case basis through
informal agreements with customs officials” or to avoid official border posts altogether, which makes
changing the equilibrium and progressing towards formalization likely difficult (Titeca and Kimanuka
2012). Although it is already more experienced than its counterparts in the COMESA, the CBTA in
Zambia should strive to (i) establish more stable structures with a clear leadership and accountability to
members, to become a credible interlocutor for domestic and regional authorities, (ii) reinforce
membership and provide more services of value to members (e.g. training on trade procedures, business
development services, registering of complaints and negotiations with border officials), (iii) develop its
own resources to sustain activities (e.g. membership fees, fee for other services). The COMESA
Secretariat’s CBT Desk has already provided support to CBTAs, but other development partners and
NGOs could consider stepping up capacity building efforts for these associations in Zambia and
neighboring countries.
5.27 TIDs’ role in helping small traders deal with trade procedures and act as liaison with
authorities at the border should be reinforced. A sustainable arrangement to secure the financial and
human resources needed for TIDs to operate still has to be found, as COMESA support is not intended to
be permanent. It seems that participating countries, including Zambia, and CBTAs should contribute to
meeting these limited costs – Rwanda has for example committed to maintain TIDs at all its border posts
(Njiwa 2012). The Zambian authorities, in coordination with neighboring countries, should also enhance
the proximity and cooperation between TIDs and border agencies, both physically (at some borders, the
TID is housed in the customs building, while it other it is isolated in a small stand) and in daily
operations.
Taxes and fees
5.28 The taxes and fees applicable to small scale CBT should be reviewed to increase compliance.
At present, the cost of trading formally is perceived as excessive by small traders and is avoided through
informal payments, alternative systems such as the traveler’s rebate or the use of unofficial border
crossings, despite the risks, arbitrariness and unpredictability associated with these methods. The
Zambian authorities should ensure that the number and the overall level of taxes and fees charged to small
traders are not disproportionately high given the low volumes and margins concerned, and should explore
options to harmonize and lower these costs with neighboring countries. Regarding goods attracting VAT,
a solution should be found for small traders which do not have the sophistication to register for tax
purposes and reclaim VAT paid at the point of entry after the product is sold. Another option could be to
replace the various taxes and fees applicable (e.g. VAT, presumptive income tax, excise, permits and
certificates) with a flat and low rate for all transactions qualifying for the STR. This rate could be jointly
set by Zambia and its neighbors and charged once at the border on the importing side. While perfect
compliance by traders, especially the smallest ones, is unlikely, it seems that a majority of them would be
willing to pay the official rate if it was perceived as reasonable, predictable and transparent. In the short
run, Zambia and Malawi should emulate Zimbabwe and cap the ASYCUDA fee charged for STR
transactions at USD 1 (cf. above), and the CBTAs should continue to lobby for this fee to be removed.
5.29 More efforts must be done to reduce informal payments demanded by officials and made by
small traders. Although this problem is pervasive at most border posts in Africa, the Zambian authorities
104
should renew their commitment to fight informal payments and ensure that only officially applicable
taxes and fees are paid. As discussed above, compliance should improve if measures are taken to reduce
the cost of formal trade, but complementary actions are needed to improve transparency, for example by
ensuring that clear information on the official taxes and fees that must be paid by small traders are
displayed at all border post, centralizing payments at a single point and making it mandatory that an
official receipt be issued for each payment. When gaps exist between official rules and practices on the
ground, the CBTA should relay trader’s complaints to the authorities who should investigate and take
sanctions if needed. The Charter for Cross-Border Traders can help address the issue of informal
payments (Annex 4).
Trade procedures
5.30 At regional level, the trade procedures for small traders should be streamlined, and the
requirements in terms of permits and certificates for agricultural products should be reduced. The
simplification of procedures for small scale CBT in Zambia should be done in coordination with
authorities in neighboring countries, and after consulting the CBTAs to assess which procedures are the
most constraining for small traders and how they could be improved. The time and the cost implied by
procedures to trade agricultural products (e.g. export/import permits, SPS certification) have resulted in
the majority of small scale CBT in these products to take place informally. This is in spite of the strong
potential for agricultural trade, and the fact that the STR was initially designed to facilitate trade in these
products. Regarding SPS certification, the COMESA Secretariat has been working on a “Green Pass”
system91, but it has not move past the concept stage and it is not clear how the system would apply to
small, unregistered traders. Instead of testing SPS at the transaction level, one alternative could be to test
crops at the regional level and introduce a system of blanket SPS clearance. Such a SPS clearance system
could be applied to both small and large traders who carry products from a region in which no disease has
been observed (alternatively, only random checks could be performed on a limited number of small
traders carrying agricultural products to mitigate risk). Import and export permit requirements for
agricultural products are more clearly a non-tariff barrier (NTB) and the authorities in Zambia and
neighboring countries should seek to reduce compliance cost for small traders (for example by
decentralizing the delivery of these permits in Zimbabwe).
5.31 Beside the specific constraints faced by small traders with very low volumes, reducing the
general transaction costs associated with formal trade procedures is also critical to facilitate cross
border trade. This is important to ensure that small traders do not remain stuck in a low level
equilibrium and have sufficient incentives to scale up their business. The trade facilitation agenda is
broader than the issue of small scale CBT and is addressed elsewhere in this DTIS and in other studies,
but it is particularly relevant for MSMEs with limited trade experience and less capacity to offset trade
transaction costs and fixed fees by shipping large volumes (Lesser and Moisé-Leeman 2009).
Perception of small traders and relations with border officials
5.32 Beside simplification of formal rules, cross border trade would benefit from a higher level
of trust between traders and border officials. The discourse in favor of CBT by national and regional
authorities has so far not been accompanied by an improvement of attitudes towards small traders at all
borders, which contributes to maintaining informality. Political commitment is needed to face resistances
by officials who may benefit from the current system or do not see the interest of facilitating small
91
This system would allow complying producers to receive pre-clearance for their agricultural products, which would then relax
SPS requirements at the border for these products.
105
traders’ activities. Perceptions and behaviors must also change from the bottom-up, at borders and within
households. Trust and mutual understanding between officials and traders are essential to improve
compliance with rules and to make sure that traders’ rights are respected (International Alert 2012, Lesser
and Moisé-Leeman 2009). In this regard, platforms could be set up locally to allow officials, traders and
other interested actors (e.g. CBTAs and TIDOs) on each side of a border to meet regularly and discuss
issues related to CBT.
5.33 Strengthening communication efforts aimed at raising mutual awareness of stakeholders’
rights and obligations could improve partnership, transparency and compliance at borders. While
altering perceptions and practices is likely to take time, Ityavayar (2013) suggests useful ways to
implement Behavior Change Communications (BCC) strategies for ICBT, for instance using information
and communication technologies. One simple tool to achieve this objective could be the World Bank’s
proposed initiative of Charter for Cross-Border Traders, which promotes the recognition by traders and
officials of the essential rules and principles which constitutes the framework for CBT activities. The
Charter would be displayed in strategic locations at border posts, translated in locally used languages and
disseminated to all stakeholders groups. The principles emphasized in the Charter (see Annex 4) could be
supported by Governments and development partners through training of officials and programs to
support behavioral change at the border.
General support to small traders
5.34 More services and capacity building initiatives should be made available to small traders in
support of their activity. The authorities should, in coordination with the CBTA, seek ways to develop
services demanded by small traders, such as microcredit, training on trade procedures and business
processes, information on markets and business opportunities, and better market infrastructure. Such
services could primarily target registered traders, so as to increase the payoff of operating formally and
increase the opportunity cost of informality. Sensitization campaigns could be organized to explain the
benefits of formality. Development partners could help with capacity building to develop such trade
support services, or by contributing to key infrastructure investments targeting small traders (e.g. storage,
trading space, ICT, sanitation/accommodation). Relevant examples include the pilot project recently
launched by the Uganda Export Promotion Board to facilitate trade for women involved in CBT. The
project targeted four of Uganda’s key borders and included a fast-track clearance process, a customs
integrity action plan, trade capacity hubs targeting women at each border crossing, and capacity building
modules developed and approved by women involved in informal trade. Through training on export
opportunities and capacity building for trade participation, the project is expected to assist informal
women traders to formalize their agribusinesses and become small- and medium-sized export businesses
by strengthening the quality of their products and forming market linkages with international buyers
(Ityavayar 2013).
106
Mainstreaming small scale CBT
5.35 Beside official recognition of its role, there is a need to design a coherent policy framework
for small scale CBT in Zambia and at regional level. There is currently no structured policy and
institutional framework to deal with issues related to (informal) CBT, which are also largely absent in
policies regarding trade, regional integration, private sector development, food security and poverty
reduction. Specific objectives for the facilitation of small scale CBT between Zambia and its neighbors
should be included in the country’s national trade strategy92
, and the progress towards the realization of
these objectives should be monitored. Dealing with CBT effectively will also require the Government to
dedicate some resources to this issue, notably a limited number of trained staffs at the central ministry and
at the borders, and possibly a budget to reinforce data collection efforts on small scale trade (building on
existing efforts at STR implementing borders).
5. CONCLUSION
5.36 Small scale cross-border trade represents an opportunity to many Zambians, and the
authorities should facilitate this activity and encourage its progressive formalization. Small scale
trade, whether informal or not, is still often viewed as a threat or a nuisance more than as a legitimate
entrepreneurial activity contributing to regional integration, livelihoods and food security, as well as a
basis for more formal activity and employment. If offered a favorable environment to grow, cross border
trade has the potential to create stable jobs and make trade more broad-based and inclusive that it has so
far been in Zambia. At present, the transaction costs imposed by official trade procedures and taxes still
result in informality being seen by a majority of small traders as a more profitable way of conducting
business. The analysis clearly shows that excessively tight controls and high taxes are self-defeating as
they are relatively easily avoided by traders, often with the complicity of border officials. Trade
facilitation measures tailored to the needs and constraints of small traders are therefore required. The
launch of the COMESA’s simplified trade regime, implemented by Malawi, Zambia and Zimbabwe, was
an important step in the right direction, but the experience has shown that it only brings a partial solution
to the issues faced by small traders. The authorities now need to design more comprehensive actions,
covering all dimensions of trade transaction costs for small traders and all of Zambia’s borders. The
recommendations provided in this chapter can constitute a basis for such a program, but monitoring the
actual implementation and impact of interventions on the ground will be as important as deciding new
measures.
92
A draft version of Zambia’s National Trade Strategy circulated in January 2013 only briefly mentions small scale CBT, but
does not provide an analysis of the constraints it faces and how they can be reduced.
107
CHAPTER 6: TRADE FACILITATION AND LOGISTICS
1. INTRODUCTION
6.1 Zambia is a landlocked country that depends on its neighbors to reach ports for seaborne
trade. Therefore, trade logistics performance is much lower than other countries at similar levels of
income93
. Efforts to reduce costs require sound policies and interventions at the local level and a high
level of cooperation and coordination with other countries in order to ensure that appropriate
infrastructure, policies and procedures are in place to facilitate transport and logistics operations. Over the
past decade Zambia has adopted several progressive policies to ease market entry into transport services.
The country also has a long history of engagement with all her neighbors and other countries in Southern
Africa. It is a founding member of COMESA and SADC and has agreements with other countries in the
region for the provision of transport services.
6.2 Generally, Zambia has several options to reduce its logistics costs, ranging from domestic
policy choices to policies rooted in bilateral and regional cooperation mechanisms. The DTIS
Update identifies the policy options that have the potential to reduce the country’s trade costs. In
particular, this chapter discusses and identifies opportunities for improvement surrounding four main
topics:
Domestic policies that impact on the logistics services industry;
Regional and international connectivity and its impact on trade facilitation and logistics costs;
Customs and border management, as the points of interface between systems of Zambia and those
of other countries; and
The potential of Zambia to serve as a logistics hub or node for the Southern Africa region.
6.3 The diagnostic assessment for this chapter was carried out using the Trade and Transport
Facilitation Assessment (TTFA)94
and the Trade and Transport Corridor Management (TTCM)95
toolkits, both developed by the World Bank. The TTFA approach were used to gather information on:
The state of transport and logistics infrastructure and the extent to which it has sufficient capacity
and availability to handle current and projected trade flows;
The nature of regulatory, documentary and procedural requirements related to international trade
transactions and corresponding transport operations;
The provision and quality of transport services for trade in Zambia and obstacles to their
modernization and development; and
Transit issues and the potential of Zambia as a regional logistics hub.
6.4 The above information is essential to obtain an holistic picture of the infrastructure, regulatory
and institutional environment for trade and transport facilitation in a country. This assessment in Zambia
93
Based on the 2010 Logistics Performance Index published by the World Bank Zambia was ranked 138 out of the 155 countries
assessed. 94
World Bank (2010) Trade and Transport Facilitation Assessment: A Practical Toolkit for Country Implementation, World Bank,
Washington, DC. 95
Kunaka, C. and R. Carruthers (2013) Trade and Transport Corridor Management Toolkit, World Bank, Washington, DC
(forthcoming).
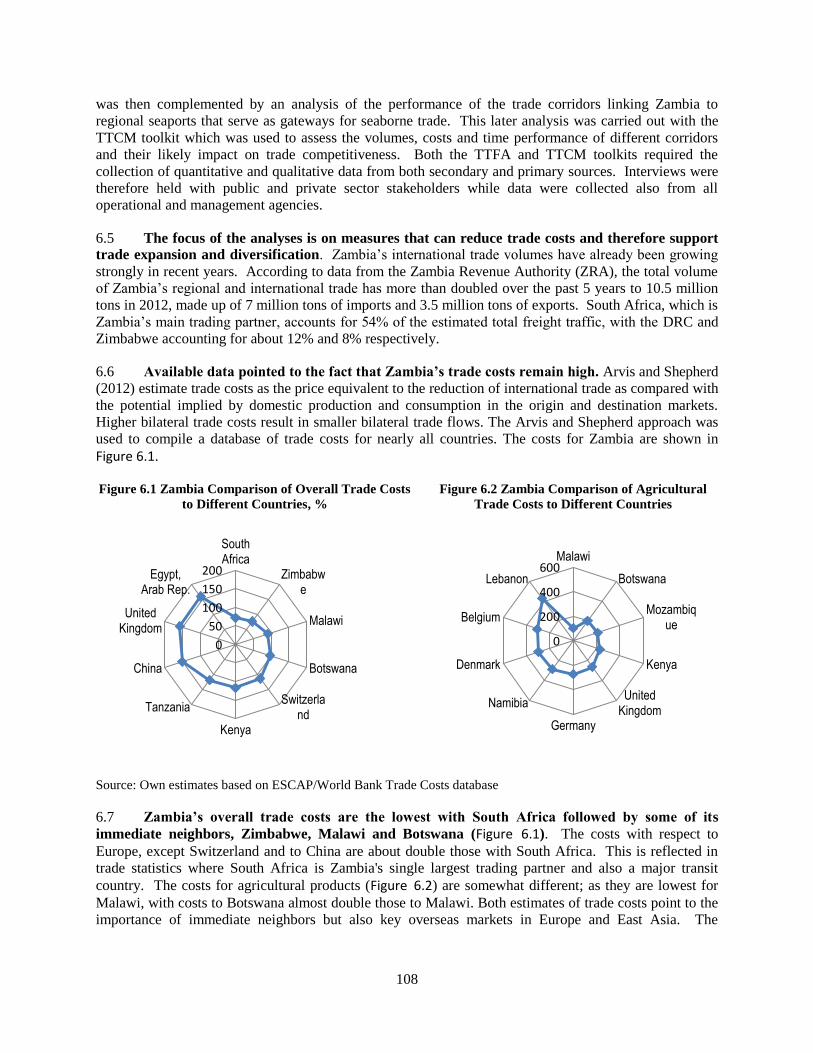
108
was then complemented by an analysis of the performance of the trade corridors linking Zambia to
regional seaports that serve as gateways for seaborne trade. This later analysis was carried out with the
TTCM toolkit which was used to assess the volumes, costs and time performance of different corridors
and their likely impact on trade competitiveness. Both the TTFA and TTCM toolkits required the
collection of quantitative and qualitative data from both secondary and primary sources. Interviews were
therefore held with public and private sector stakeholders while data were collected also from all
operational and management agencies.
6.5 The focus of the analyses is on measures that can reduce trade costs and therefore support
trade expansion and diversification. Zambia’s international trade volumes have already been growing
strongly in recent years. According to data from the Zambia Revenue Authority (ZRA), the total volume
of Zambia’s regional and international trade has more than doubled over the past 5 years to 10.5 million
tons in 2012, made up of 7 million tons of imports and 3.5 million tons of exports. South Africa, which is
Zambia’s main trading partner, accounts for 54% of the estimated total freight traffic, with the DRC and
Zimbabwe accounting for about 12% and 8% respectively.
6.6 Available data pointed to the fact that Zambia’s trade costs remain high. Arvis and Shepherd
(2012) estimate trade costs as the price equivalent to the reduction of international trade as compared with
the potential implied by domestic production and consumption in the origin and destination markets.
Higher bilateral trade costs result in smaller bilateral trade flows. The Arvis and Shepherd approach was
used to compile a database of trade costs for nearly all countries. The costs for Zambia are shown in
Figure 6.1.
Figure 6.1 Zambia Comparison of Overall Trade Costs
to Different Countries, %
Figure 6.2 Zambia Comparison of Agricultural
Trade Costs to Different Countries
Source: Own estimates based on ESCAP/World Bank Trade Costs database
6.7 Zambia’s overall trade costs are the lowest with South Africa followed by some of its
immediate neighbors, Zimbabwe, Malawi and Botswana (Figure 6.1). The costs with respect to
Europe, except Switzerland and to China are about double those with South Africa. This is reflected in
trade statistics where South Africa is Zambia's single largest trading partner and also a major transit
country. The costs for agricultural products (Figure 6.2) are somewhat different; as they are lowest for
Malawi, with costs to Botswana almost double those to Malawi. Both estimates of trade costs point to the
importance of immediate neighbors but also key overseas markets in Europe and East Asia. The
0
50
100
150
200
SouthAfrica
Zimbabwe
Malawi
Botswana
Switzerland
Kenya
Tanzania
China
UnitedKingdom
Egypt,Arab Rep.
0
200
400
600Malawi
Botswana
Mozambique
Kenya
UnitedKingdom
Germany
Namibia
Denmark
Belgium
Lebanon
109
diagnostic assessment therefore does analyze in some detail the performance of the transport corridors
that link Zambia to neighboring countries as well as to seaport gateways for overseas trade.
2. CORE LOGISTICS INFRASTRUCTURE AND SERVICES
6.8 Trade facilitation and logistics in Zambia is driven mainly by the needs and outputs of the
mining industry, especially copper. Copper makes up three-fourths of the country’s exports and the
Government of the Republic of Zambia (GRZ) wants to increase its role by raising the country’s output
from 0.7 million ton in 2009 to about 1 million ton in the next few years (Engman, 2009). The extent to
which the needs of the sector are met is therefore a useful indicator of the overall performance of the
country’s trade logistics system. Generally, Zambian copper producers rely heavily on imported inputs for
production. Heavy equipment and various other supplies are imported mainly from or through South
Africa. This is partly influenced by the availability of equipment and routes capable of accommodating
oversized cargos. Generally, the Durban routes are better suited to such cargos than Dar es Salaam.
6.9 Zambian exporters are typically responsible for overland transport and logistics of their
exports and imports. For example, copper is sold typically FOB96
at 90% LME97
(once the Bill of
Lading is issued). The producers are therefore responsible for the overland transport of copper to the
preferred port. In 2010, one mining house estimated that shipping and logistic costs were 70% of the final
cost. Thus, high logistic costs become a serious barrier to the global competiveness of the Zambia copper
industry. While imports are typically through Durban, there is some diversification of routes for exports.
The frequency of vessel calls at different ports in the region is a major consideration in deciding which
port to use for exports. Dar es Salaam is preferred for some shipments to the East—the greater likelihood
of empty vessels also makes it attractive. However, for greater reliability Durban is preferred as it has a
higher frequency of vessel calls to most global markets. Several of the mining houses spread their
shipments across the different routes (Box 6).
Box 6 : Hedging Risks: An Example of Route Distribution for a Zambia Copper Mining House
Transportation of copper from the mines to the final port destination involves a series of complex steps. First,
copper is road hauled to smelter (or moved through inter-mine rail transport). Once processed, about 80% of the
copper cathodes are again road hauled to Kapiri Mposhi where they are loaded to The Tanzania-Zambia Railway
Authority (TAZARA) trains to be transported to one of several ICD facilities around the Port of Dar-es-Salaam.
Alternatively, some of the copper is road hauled to Durban. The residual is road hauled to the Port of Beira in
Mozambique. Ideally, the mine seeks to achieve a different combination of port usage. In 2010 the shares were
55-35-10 respectively for Dar, Durban and Beira or Walvis Bay.
While Dar is the nearest port, the performance of the overland logistics system poses risks that have to be
managed and minimized:
Rail transport is constrained by TAZARA’s inability to handle cargo reliably. Rail transport transit times can
vary between 15-30 days depending on the ability of TAZARA to provide wagons and locomotives to move
the cargo to the port. The mine has an agreement with TAZARA by which they pay a set of agreed fees and
provide TAZARA with additional investment resources. Those resources have been used to pay salaries,
maintenance, spare parts, etc.
Road transport is constrained by supply of trucks, axle load restrictions on Tanzania roads, and transit times.
The Port of Dar is a bottleneck, with cargo dwell time is around 6-7 days, and particularly in cashew season
the port is congested. As a result, utilization rates for the port vary throughout the year.
Source: Authors
96 FOB is and INCOTERM which stands for Free on Board 97 LME is the London Metal Exchange
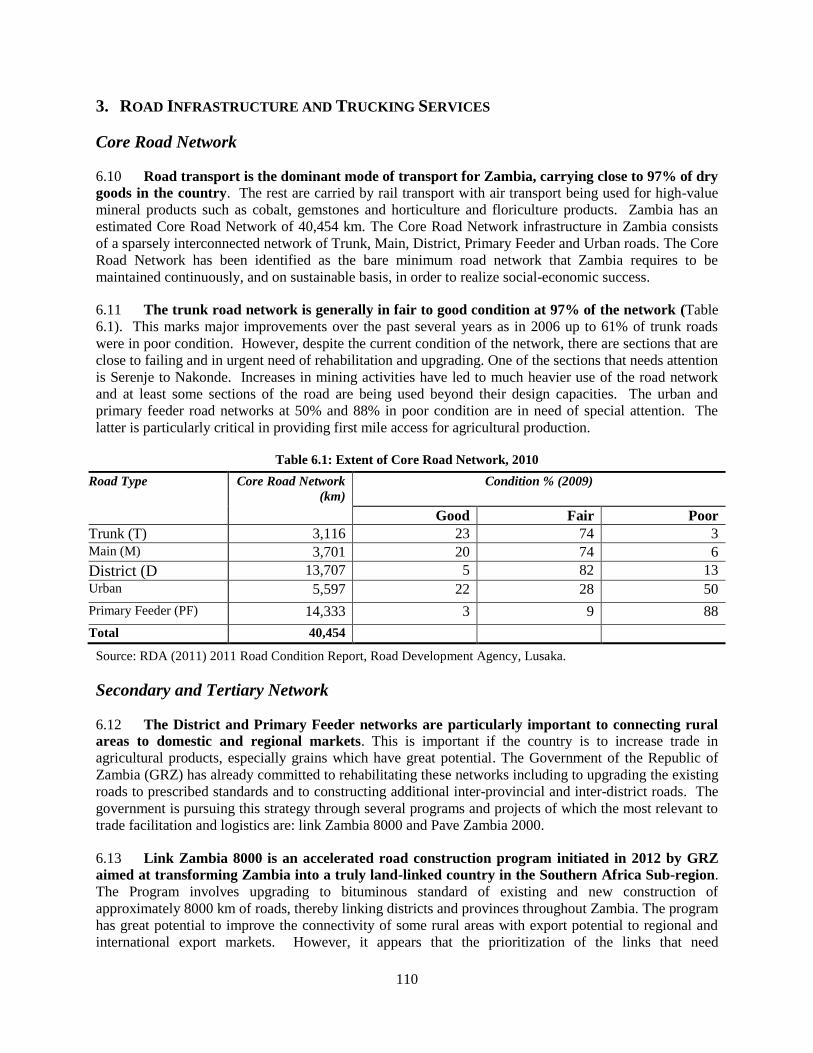
110
3. ROAD INFRASTRUCTURE AND TRUCKING SERVICES
Core Road Network
6.10 Road transport is the dominant mode of transport for Zambia, carrying close to 97% of dry
goods in the country. The rest are carried by rail transport with air transport being used for high-value
mineral products such as cobalt, gemstones and horticulture and floriculture products. Zambia has an
estimated Core Road Network of 40,454 km. The Core Road Network infrastructure in Zambia consists
of a sparsely interconnected network of Trunk, Main, District, Primary Feeder and Urban roads. The Core
Road Network has been identified as the bare minimum road network that Zambia requires to be
maintained continuously, and on sustainable basis, in order to realize social-economic success.
6.11 The trunk road network is generally in fair to good condition at 97% of the network (Table
6.1). This marks major improvements over the past several years as in 2006 up to 61% of trunk roads
were in poor condition. However, despite the current condition of the network, there are sections that are
close to failing and in urgent need of rehabilitation and upgrading. One of the sections that needs attention
is Serenje to Nakonde. Increases in mining activities have led to much heavier use of the road network
and at least some sections of the road are being used beyond their design capacities. The urban and
primary feeder road networks at 50% and 88% in poor condition are in need of special attention. The
latter is particularly critical in providing first mile access for agricultural production.
Table 6.1: Extent of Core Road Network, 2010
Road Type Core Road Network
(km)
Condition % (2009)
Good Fair Poor
Trunk (T) 3,116 23 74 3
Main (M) 3,701 20 74 6
District (D 13,707 5 82 13
Urban 5,597 22 28 50
Primary Feeder (PF) 14,333 3 9 88
Total 40,454
Source: RDA (2011) 2011 Road Condition Report, Road Development Agency, Lusaka.
Secondary and Tertiary Network
6.12 The District and Primary Feeder networks are particularly important to connecting rural
areas to domestic and regional markets. This is important if the country is to increase trade in
agricultural products, especially grains which have great potential. The Government of the Republic of
Zambia (GRZ) has already committed to rehabilitating these networks including to upgrading the existing
roads to prescribed standards and to constructing additional inter-provincial and inter-district roads. The
government is pursuing this strategy through several programs and projects of which the most relevant to
trade facilitation and logistics are: link Zambia 8000 and Pave Zambia 2000.
6.13 Link Zambia 8000 is an accelerated road construction program initiated in 2012 by GRZ
aimed at transforming Zambia into a truly land-linked country in the Southern Africa Sub-region.
The Program involves upgrading to bituminous standard of existing and new construction of
approximately 8000 km of roads, thereby linking districts and provinces throughout Zambia. The program
has great potential to improve the connectivity of some rural areas with export potential to regional and
international export markets. However, it appears that the prioritization of the links that need
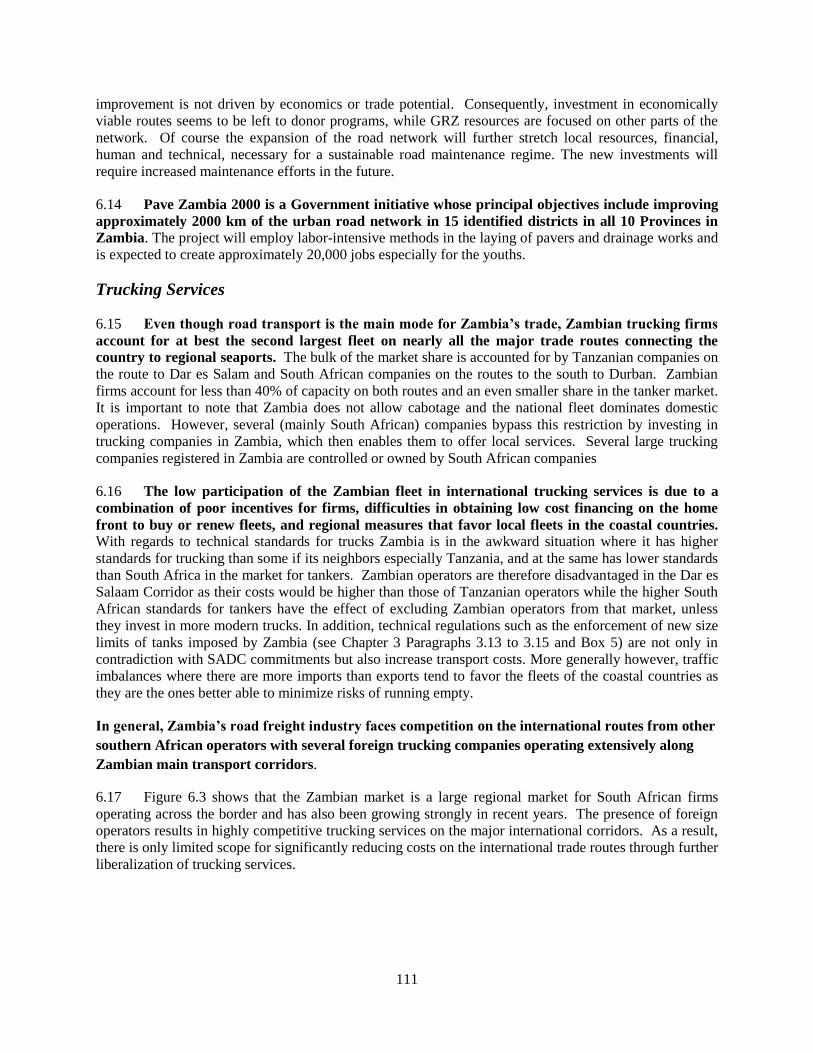
111
improvement is not driven by economics or trade potential. Consequently, investment in economically
viable routes seems to be left to donor programs, while GRZ resources are focused on other parts of the
network. Of course the expansion of the road network will further stretch local resources, financial,
human and technical, necessary for a sustainable road maintenance regime. The new investments will
require increased maintenance efforts in the future.
6.14 Pave Zambia 2000 is a Government initiative whose principal objectives include improving
approximately 2000 km of the urban road network in 15 identified districts in all 10 Provinces in
Zambia. The project will employ labor-intensive methods in the laying of pavers and drainage works and
is expected to create approximately 20,000 jobs especially for the youths.
Trucking Services
6.15 Even though road transport is the main mode for Zambia’s trade, Zambian trucking firms
account for at best the second largest fleet on nearly all the major trade routes connecting the
country to regional seaports. The bulk of the market share is accounted for by Tanzanian companies on
the route to Dar es Salam and South African companies on the routes to the south to Durban. Zambian
firms account for less than 40% of capacity on both routes and an even smaller share in the tanker market.
It is important to note that Zambia does not allow cabotage and the national fleet dominates domestic
operations. However, several (mainly South African) companies bypass this restriction by investing in
trucking companies in Zambia, which then enables them to offer local services. Several large trucking
companies registered in Zambia are controlled or owned by South African companies
6.16 The low participation of the Zambian fleet in international trucking services is due to a
combination of poor incentives for firms, difficulties in obtaining low cost financing on the home
front to buy or renew fleets, and regional measures that favor local fleets in the coastal countries. With regards to technical standards for trucks Zambia is in the awkward situation where it has higher
standards for trucking than some if its neighbors especially Tanzania, and at the same has lower standards
than South Africa in the market for tankers. Zambian operators are therefore disadvantaged in the Dar es
Salaam Corridor as their costs would be higher than those of Tanzanian operators while the higher South
African standards for tankers have the effect of excluding Zambian operators from that market, unless
they invest in more modern trucks. In addition, technical regulations such as the enforcement of new size
limits of tanks imposed by Zambia (see Chapter 3 Paragraphs 3.13 to 3.15 and Box 5) are not only in
contradiction with SADC commitments but also increase transport costs. More generally however, traffic
imbalances where there are more imports than exports tend to favor the fleets of the coastal countries as
they are the ones better able to minimize risks of running empty.
In general, Zambia’s road freight industry faces competition on the international routes from other
southern African operators with several foreign trucking companies operating extensively along
Zambian main transport corridors.
6.17 Figure 6.3 shows that the Zambian market is a large regional market for South African firms
operating across the border and has also been growing strongly in recent years. The presence of foreign
operators results in highly competitive trucking services on the major international corridors. As a result,
there is only limited scope for significantly reducing costs on the international trade routes through further
liberalization of trucking services.
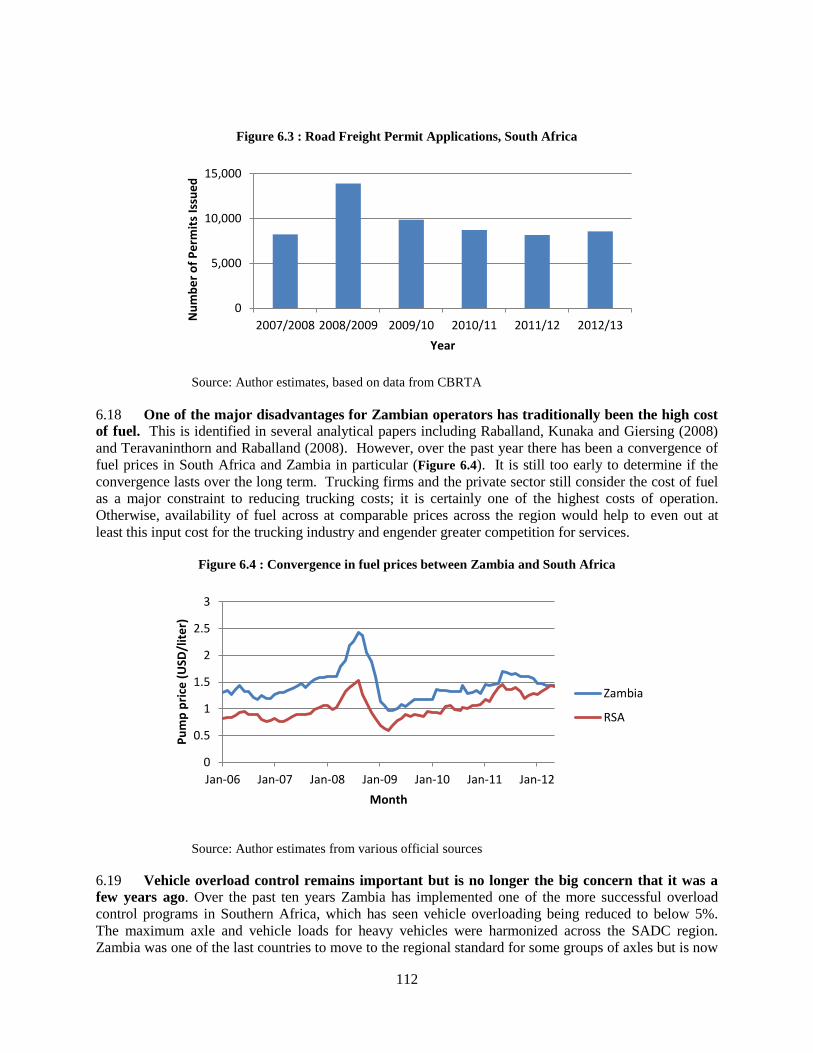
112
Figure 6.3 : Road Freight Permit Applications, South Africa
Source: Author estimates, based on data from CBRTA
6.18 One of the major disadvantages for Zambian operators has traditionally been the high cost
of fuel. This is identified in several analytical papers including Raballand, Kunaka and Giersing (2008)
and Teravaninthorn and Raballand (2008). However, over the past year there has been a convergence of
fuel prices in South Africa and Zambia in particular (Figure 6.4). It is still too early to determine if the
convergence lasts over the long term. Trucking firms and the private sector still consider the cost of fuel
as a major constraint to reducing trucking costs; it is certainly one of the highest costs of operation.
Otherwise, availability of fuel across at comparable prices across the region would help to even out at
least this input cost for the trucking industry and engender greater competition for services.
Figure 6.4 : Convergence in fuel prices between Zambia and South Africa
Source: Author estimates from various official sources
6.19 Vehicle overload control remains important but is no longer the big concern that it was a
few years ago. Over the past ten years Zambia has implemented one of the more successful overload
control programs in Southern Africa, which has seen vehicle overloading being reduced to below 5%.
The maximum axle and vehicle loads for heavy vehicles were harmonized across the SADC region.
Zambia was one of the last countries to move to the regional standard for some groups of axles but is now
0
5,000
10,000
15,000
2007/2008 2008/2009 2009/10 2010/11 2011/12 2012/13
Nu
mb
er
of
Pe
rmit
s Is
sue
d
Year
0
0.5
1
1.5
2
2.5
3
Jan-06 Jan-07 Jan-08 Jan-09 Jan-10 Jan-11 Jan-12
Pu
mp
pri
ce (
USD
/lit
er)
Month
Zambia
RSA
113
in compliance. The maximum gross vehicle mass has been set at 56 tons and the maximum axle loads
between 8 tons and 10 tons. Major differences and a source of non-compliance by operators is due to
differences in tolerances for axle loads and the GVM. Some countries do not have any tolerance while
others, including Zambia, allow as much as 5%. It is important to push for regional standardization of
such tolerances.
4. RAILWAYS
6.20 Zambia has two main railway systems, Zambia Railways Limited (ZRL) and Tanzania-
Zambia Railways (TAZARA). Both are integral parts of the largest single gauge interconnected multi-
country railway network in Africa. In theory, there is almost full railway interconnectivity within the
Eastern and Southern Africa region enabling trains to run from Cape Town to Dar es Salaam. However,
axle loads in most countries are a low 15 tons to 18 tons. Only in South Africa are they up to 26 tons. To
make rail transport more competitive with road transport, axle weights should not be less than 20 tons.
This would allow a railway wagon to carry almost twice as much as the most common truck configuration
found on Zambia’s trade corridors.
6.21 The railways have in common a long running trend of losing traffic over the past three
decades. The regional road transport sector is a highly competitive, deregulated private system
competing openly with rail services which has led to a marked shift in general freight volumes from rail
to road. The shift in traffic is also partly attributable to unreliable service, because of poor management,
inadequate use of assets and poor costing practices. The permissible gross vehicle mass of 56 tons for a 7-
axle truck is one of the highest in the world (with only Australia having a higher allowable GVM) and has
the effect of increasing the competitiveness of road against rail, and also of significantly increasing the
cost of road maintenance, which is not fully compensated for in the setting of road user charges and toll
fees. As a result, road haulage on long distances on a full return load basis is often directly competitive
with the railway general freight tariffs (about US$ 0.05 per net ton-km, 2008/9). In effect, there is a
degree of cross subsidization of road freight from passenger vehicles and directly from government,
though provision of road infrastructure with less than full cost recovery from user fees. On the other
hand, railways have to bear the full cost of providing and maintaining their infrastructure.
6.22 Governments have experimented with different responses to the poor performance of the
railways, typically by conceding them to private operators. Almost all the regional railway systems,
including in Zimbabwe (BBR), Zambia (RSZ), Malawi (CEAR), central Mozambique (CCFB), northern
Mozambique (CDN) and Tanzania (TRC) have in the past been privatized through concession
agreements. However, the performance of the concessions has been mixed and a few have since been
reversed, among them the one in Zambia.
6.23 The railway concession in Zambia was cancelled due to poor railway performance even
after operations were privatized. The public sector monopoly was replaced by a private sector one
which was also not able to invest significantly in upgrading the infrastructure and services. Now that the
operations are back under state control the GRZ is mobilizing and developing a strategy to rehabilitate the
ZRL network and to restore it to conditions last seen in the 1980s and 1990s. Through bond issues the
authorities have already raised part of the funding that is needed. They expect to issue more bonds to raise
as much as $15bn that will be required to implement the plans that are taking shape. The emerging plans
are heavily focused on mining traffic, both inter-mine within Zambia and international shipments.
6.24 It is expected that an improved railway system will relieve the road network of some traffic.
However, a major uncertainty for the near future is the type of incentives that could be used to shift
some of the supply chains, especially related to the mining industry, from road to rail. It is
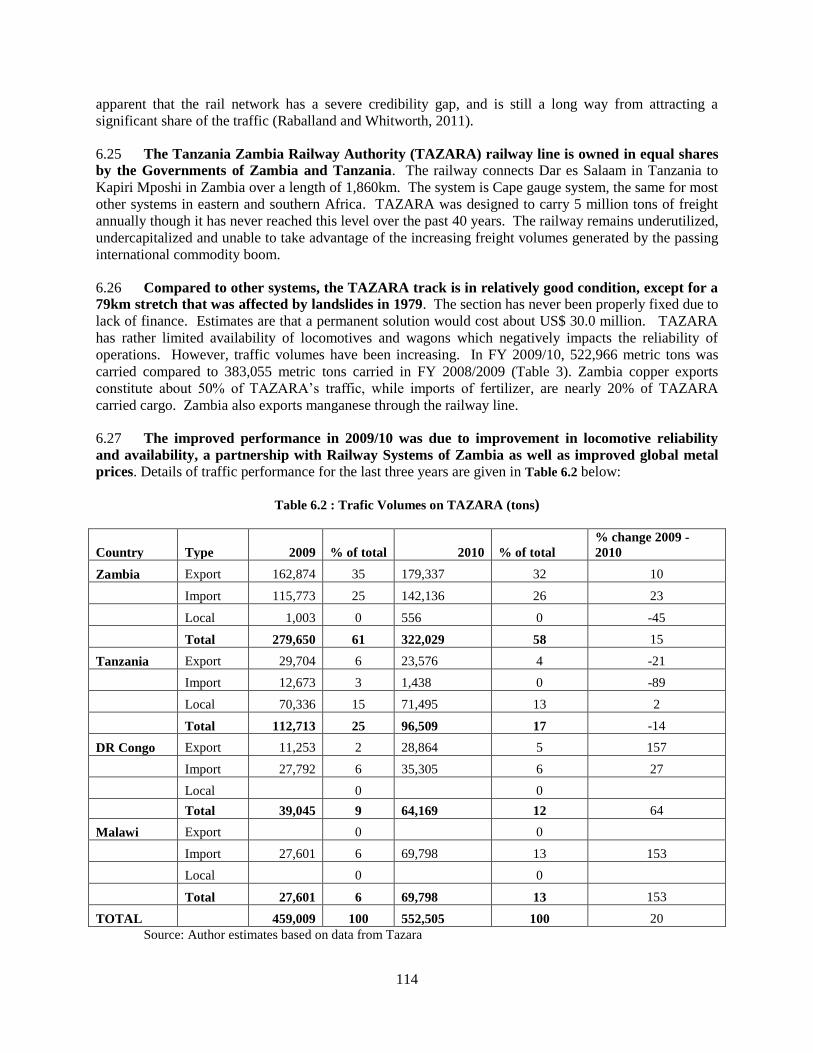
114
apparent that the rail network has a severe credibility gap, and is still a long way from attracting a
significant share of the traffic (Raballand and Whitworth, 2011).
6.25 The Tanzania Zambia Railway Authority (TAZARA) railway line is owned in equal shares
by the Governments of Zambia and Tanzania. The railway connects Dar es Salaam in Tanzania to
Kapiri Mposhi in Zambia over a length of 1,860km. The system is Cape gauge system, the same for most
other systems in eastern and southern Africa. TAZARA was designed to carry 5 million tons of freight
annually though it has never reached this level over the past 40 years. The railway remains underutilized,
undercapitalized and unable to take advantage of the increasing freight volumes generated by the passing
international commodity boom.
6.26 Compared to other systems, the TAZARA track is in relatively good condition, except for a
79km stretch that was affected by landslides in 1979. The section has never been properly fixed due to
lack of finance. Estimates are that a permanent solution would cost about US$ 30.0 million. TAZARA
has rather limited availability of locomotives and wagons which negatively impacts the reliability of
operations. However, traffic volumes have been increasing. In FY 2009/10, 522,966 metric tons was
carried compared to 383,055 metric tons carried in FY 2008/2009 (Table 3). Zambia copper exports
constitute about 50% of TAZARA’s traffic, while imports of fertilizer, are nearly 20% of TAZARA
carried cargo. Zambia also exports manganese through the railway line.
6.27 The improved performance in 2009/10 was due to improvement in locomotive reliability
and availability, a partnership with Railway Systems of Zambia as well as improved global metal
prices. Details of traffic performance for the last three years are given in Table 6.2 below:
Table 6.2 : Trafic Volumes on TAZARA (tons)
Country Type 2009 % of total 2010 % of total
% change 2009 -
2010
Zambia Export 162,874 35 179,337 32 10
Import 115,773 25 142,136 26 23
Local 1,003 0 556 0 -45
Total 279,650 61 322,029 58 15
Tanzania Export 29,704 6 23,576 4 -21
Import 12,673 3 1,438 0 -89
Local 70,336 15 71,495 13 2
Total 112,713 25 96,509 17 -14
DR Congo Export 11,253 2 28,864 5 157
Import 27,792 6 35,305 6 27
Local
0
0
Total 39,045 9 64,169 12 64
Malawi Export
0
0
Import 27,601 6 69,798 13 153
Local
0
0
Total 27,601 6 69,798 13 153
TOTAL
459,009 100 552,505 100 20
Source: Author estimates based on data from Tazara

115
6.28 TAZARA faces several challenges, chief among them the long distance from the origin of
export bulk freight to the port of Dar es Salaam. The key to rail competitiveness is reliability – but
improving reliability requires substantial investment, which in turn requires a realistic and bankable
strategic business plan. Provision of emergency funding for new equipment and repairs alone, as is the
case presently, will not guarantee sustainability.
6.29 The present traffic volumes carried and income generated by TAZARA are not sufficient to
cover the full operating costs (including maintenance of the track and equipment, necessary upgrading
and replacement). For TAZARA to achieve threshold volumes of freight traffic and revenue for long term
sustainability, it will have to capture freight from road, specifically intermodal (container) traffic and bulk
freight. However, a challenge for TAZARA is the fact that Zambia’s copper exports are dominated by
cathode, which is three times the value, but one third the volume of copper concentrate. The nearest
TAZARA railhead in the Copperbelt is also some 200km which requires tight integration with ZRL or the
use of road transport with transloading at Kapiri Mposhi. Greater prospects would probably lie in DRC
volumes which are predominantly concentrated and transit through Zambia. However, unless there are
significant improvements to TAZARA it will face even more competition in the near future as
rehabilitation works are completed on the Lobito, Nacala and Beira corridors – all of which compete with
the TAZARA railway line for the copper belt traffic.
6.30 Several few options that have been considered for improving TAZARA’s operations:
a. Depend on grants from the government. Generally, TAZARA has been heavily dependent on
financial support from the Government of China. This is reflected in part by the signature to date
of 14 financial protocols (grants) between the three governments. In addition several Chinese
enterprises have also been contracted by the Chinese Government to deliver capacity building to
TAZARA. Often there appears to be a disconnect between the immediate needs of TAZARA and
what the Chinese Government agrees to finance, with the final decision being with the Chinese
government as the money is grant money.
b. Engage large scale users. In recent years TAZARA has been expanding its capacity by engaging
willing large shippers to advance funds for the repair of wagons and locomotives that in turn are
ring fenced for transportation of their traffic. These measures have contributed to an increase in
traffic. Expectations are that these and other measures will increase traffic above 700,000 tons,
which would be the highest level since 1999.
c. Concessioning. The option of concessioning TAZARA as a public-private partnership will be
examined, but taking into full account the unsuccessful regional experience of existing railway
concessions, expectations are low. In addition, the ownership and management structures of
TAZARA are a lot more complex than those of national railways that have been concessioned.
From a trade logistics perspective, TAZARA should pursue option b) “Engage large scale users”.
Ultimately, it is by responding to the needs of the major shippers that the railways will be able to attract
more traffic and in turn perform on a sustainable basis. In addition, it is important for the two railway
systems in Zambia to play complementary roles depending on the destination of the cargo. In this regard,
the previous system of SADC railways, which operated the different routes as corridors, would be worth
considering. Presently, railway traffic faces considerable delays at the border posts while waiting for
clearance and changes of locomotives (Figure 6.5).

116
Figure 6.5 : Example of Lubumbashi to Durban Rail Time/Cost-Distance
Source: Author estimates, data from various sources
6.31 Up until the concessioning of different railways in Southern Africa, several routes were
operated as corridors with close coordination between the different operators which allowed almost
seamless movement. The practice offered several advantages to both operators and users including:
Cross-border operation of locomotives and crews;
International train timetables and joint planning and marketing;
Communication among corridor railways on the movement of the international trains;
Prioritization of international trains in the allocation of resources such as locomotives and
wagons;
Through billing and revenue collection at one point; and
Development and use of same maintenance manual.
6.32 The system broke down when some of the railways could not operate at the required level of
quality while some of the concessioned operators were not keen to cooperate. The system could be
revived again through the association of regional railways, the Southern Africa Railways Association
(SARA).
5. INLAND WATER TRANSPORT
6.33 Zambia exports a few commodities over the Lake Tanganyika to the Great Lakes countries
especially the western part of Tanzania, eastern part of Congo DR as well as Burundi and Rwanda.
The Port of Mpulungu serves as the gateway for these trade activities. The Mpulungu Harbor and Port
provides the easiest and cheapest route to the Great Lakes Region and is therefore a strategic and
principal exit for Zambia’s exports such as cement, maize and other agricultural produce.
0
1,000
2,000
3,000
4,000
5,000
6,000
7,000
0.00
100.00
200.00
300.00
400.00
500.00
600.00
700.00
800.00
900.00
1000.00
0 1,000 2,000 3,000 4,000 5,000
Cost (U
SD
) T
ime
(hrs
)
Distance (km)
Time Cost
Nd
ola
Vic
tori
a F
alls
Bei
tbri
dg
e
Cit
y D
eep
Du
rban
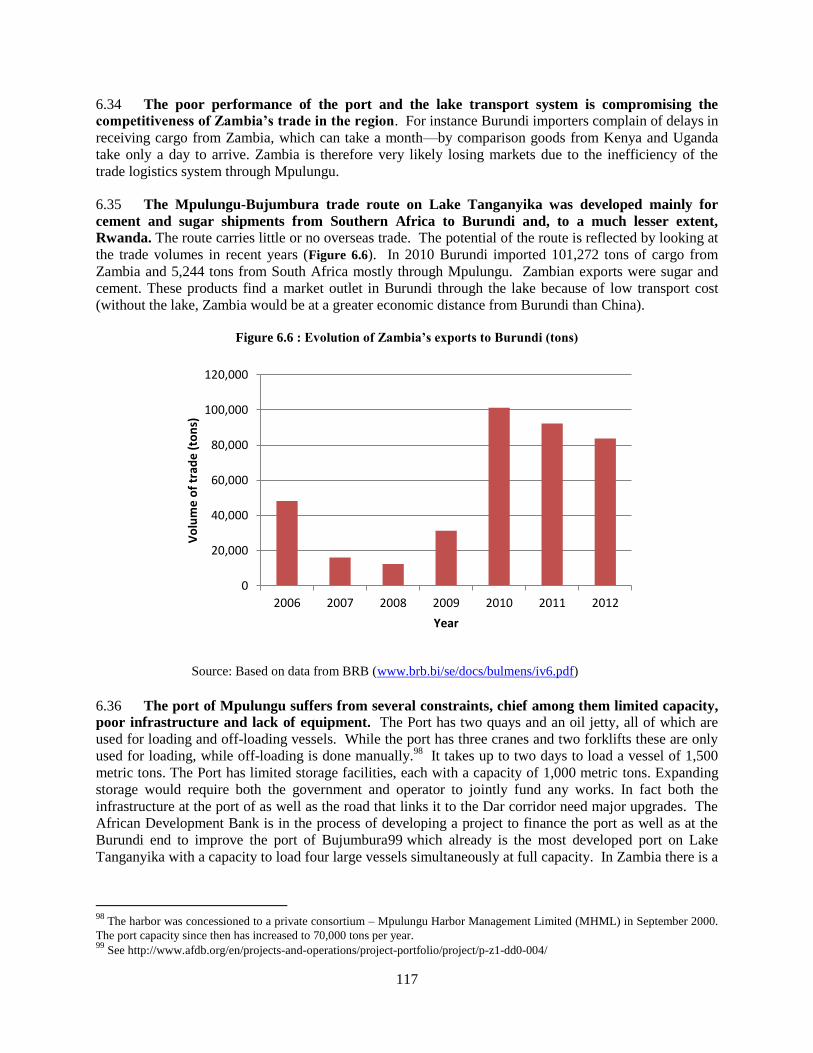
117
6.34 The poor performance of the port and the lake transport system is compromising the
competitiveness of Zambia’s trade in the region. For instance Burundi importers complain of delays in
receiving cargo from Zambia, which can take a month—by comparison goods from Kenya and Uganda
take only a day to arrive. Zambia is therefore very likely losing markets due to the inefficiency of the
trade logistics system through Mpulungu.
6.35 The Mpulungu-Bujumbura trade route on Lake Tanganyika was developed mainly for
cement and sugar shipments from Southern Africa to Burundi and, to a much lesser extent,
Rwanda. The route carries little or no overseas trade. The potential of the route is reflected by looking at
the trade volumes in recent years (Figure 6.6). In 2010 Burundi imported 101,272 tons of cargo from
Zambia and 5,244 tons from South Africa mostly through Mpulungu. Zambian exports were sugar and
cement. These products find a market outlet in Burundi through the lake because of low transport cost
(without the lake, Zambia would be at a greater economic distance from Burundi than China).
Figure 6.6 : Evolution of Zambia’s exports to Burundi (tons)
Source: Based on data from BRB (www.brb.bi/se/docs/bulmens/iv6.pdf)
6.36 The port of Mpulungu suffers from several constraints, chief among them limited capacity,
poor infrastructure and lack of equipment. The Port has two quays and an oil jetty, all of which are
used for loading and off-loading vessels. While the port has three cranes and two forklifts these are only
used for loading, while off-loading is done manually.98
It takes up to two days to load a vessel of 1,500
metric tons. The Port has limited storage facilities, each with a capacity of 1,000 metric tons. Expanding
storage would require both the government and operator to jointly fund any works. In fact both the
infrastructure at the port of as well as the road that links it to the Dar corridor need major upgrades. The
African Development Bank is in the process of developing a project to finance the port as well as at the
Burundi end to improve the port of Bujumbura99 which already is the most developed port on Lake
Tanganyika with a capacity to load four large vessels simultaneously at full capacity. In Zambia there is a
98
The harbor was concessioned to a private consortium – Mpulungu Harbor Management Limited (MHML) in September 2000.
The port capacity since then has increased to 70,000 tons per year. 99
See http://www.afdb.org/en/projects-and-operations/project-portfolio/project/p-z1-dd0-004/
0
20,000
40,000
60,000
80,000
100,000
120,000
2006 2007 2008 2009 2010 2011 2012
Vo
lum
e o
f tr
ade
(to
ns)
Year
118
proposal to extend one of the existing quays by 120m and provide a navigation aid system of transit lights
and day marks. The project is in the AfDB pipeline for late 2014.
6.37 There is also need to invest in bonded warehouses and water vessels as a way of facilitating
more trade flows between Zambia and Burundi. Common investors could be encouraged to build
bonded warehouses at Bujumbura as well as water vessels to ply between Mpulungu and Bujumbura.
This will complement the bounded warehouses operating on the shores of Lake Tanganyika in Burundi
and increase efficiency in the distribution chain of Zambian products. Similarly, investment in water
vessels will complement the current 13 vessels operating between the two ports. Customs infrastructure
and procedures at Mpulungu also need modernization.
6. AIR TRANSPORT CONNECTIVITY
6.38 Zambia exports perishable products, such as cut flowers and vegetables by air. These are
destined largely to the European market. In fact air cargo in Zambia was growing strongly up to the
global financial crisis. A study by Jacobs Consultancy (2010) established that volume at Lusaka airport
more than doubled between 2002 and 2008, increasing from 19,511 metric tons in 2002 to 45,404 tons in
2008. Volumes are expected to increase at almost 8% per annum up to 2020 (Jacobs Consultancy, 2010).
Most of the growth has been and will continue to be on the international routes while the domestic air
transport sector will remain modest. As a significant proportion will be transported as belly cargo,
Lusaka will continue to dominate cargo flows. This will not necessarily be a constraint as the most
economically significant cities are relatively close together and well connected by road and rail transport
links.
6.39 Even as overall traffic has increased, connectivity (measured by the number of city pairs
served) has declined from 35 to 25 in recent years. However, through regional hubs (Johannesburg,
Nairobi, Addis Ababa) and international hubs (Dubai, London, Amsterdam) Zambia is well connected to
regional and global markets by air. There is adequate capacity in the short- and medium-term to increase
capacity to suit growth in volumes of commodities exportable by air. There are presently some 15 private
airlines serving Zambia. Zambian Airways was formed in 1999 and became the de facto national carrier
before it collapsed in 2009. The major international airlines are South African Airways, British Airways,
KLM Dutch Airlines and Emirates which all operate direct regional and intercontinental flights into
Johannesburg, London, Amsterdam and Dubai respectively. However, the market is still not that
competitive and airfares in and out of Zambia are expensive.
6.40 The collapse of Zambian Airways was a major blow to the domestic market. There is again
increased interest in establishing a national airline. However, Zambia could learn from the experience of
other countries in the region that have seen the establishment of fairly successful privately owned airlines.
Tanzania is a case in point. Following the demise of Air Tanzania, a joint venture was set up to form the
private airline Precision Air, with 51 per cent ownership by Tanzanian interests and 49 per cent by
Kenyan Airways. The airline has grown substantially, and Tanzania now has one of the most vibrant
domestic air transport markets in Africa, offering competing services on all routes.
6.41 In addition to passenger services, before 2006 Zambia had regular freighter services with a
capacity of 80 – 100 tons per week (Schlumberger, 2009). However, these were stopped due to the high
cost of fuel and small volumes. As volumes have begun to recover there are now several scheduled
freight services by SAA, British Airways while Kenya Airways has expressed interest in serving the
Zambian market. There are also express cargo services by DHL and FedEx as well as the Zambian
Export Growers Association (ZEGA) which charters flights for agricultural exports. The routing for
some of the charter freighter services includes Zimbabwe and Malawi. A major constraint in Zambia is
the lack of refrigeration capacity at Lusaka airport.
119
6.42 Lusaka is relatively well connected within Africa, largely through the regional hubs of
Addis Ababa, Johannesburg and Nairobi. Lusaka is the largest of the four international airports
accounting for close to two-thirds of the traffic in and out of the country followed by Livingstone, Ndola
and Mfuwe. Ndola is strongly growing reflecting the revival of copper mining. The Government has
commenced major rehabilitation and upgrade of the four international airports to bring the facilities up to
the international standard. In addition, the Government plans to upgrade airstrips in districts to facilitate
access by air.
6.43 Zambia’s Air Transport Policy is defined in its National Air Transport Policy paper100
, of
2002. Recognizing the importance of air transport for the development of the economy, the policy paper
argues that the air transport industry is small due to poor infrastructure, small passenger loads, and the
lack of properly managed tourist destinations. The implementation of the air transport strategy has made
modest progress in terms of policies to create a competitive and liberalized environment (including the
assignment of international traffic routes) and to ensure effective regulation (based on ICAO international
standards). Zambia has fully privatized its air services, following the liquidation of the loss making
Zambia Airways in 1994 and the liberalization of entry into its market.
6.44 After 1994, Zambia renegotiated several of its BASAs with other countries, and provided
for multiple designation of carriers. However, several routes are still restricted especially South Africa
– Zambia where South African Airways which has the capacity is unable to add capacity at Lusaka or
Livingstone. Only a Zambian carrier can add to the current capacity. The other route is Angola – Zambia
where the former has limited weekly frequencies at a level that seems to be below demand.
Implementation of the Yamoussoukro Decision across Sub-Saharan Africa has been lethargic, as some
countries seek to protect their national airlines. However, its implementation remains a priority for both
COMESA and SADC.
6.45 Since 2009 Zambia has been on a European Union list of countries whose aviation oversight
was considered to be unsafe and whose airlines are not permitted to operate within the European
Union. While this is not a major constraint now as Zambia does not have an airline capable of offering
services to Europe, strengthening regulatory capacity will be critical if the domestic airline industry is to
grow.
7. CUSTOMS AND BORDER MANAGEMENT
6.46 Border post delays and lengthy processing times are a major factor in the choice of route
and impact overall efficiency of the trade facilitation and logistics environment in Zambia and the
general SADC region. Despite periodic interventions, Zambia’s land borders are well known for delays
to the movement of traffic especially at the main border posts of Chirundu and Beitbridge. This affects
both road and railway borne traffic. As volumes of traffic have increased the problems have become even
more acute and will likely get worse as trade volumes continue to increase. The authorities are already
implementing several measures to improve performance, especially directed at customs.
Modernization of Customs
6.47 Zambia has implemented several measures to modernize its customs services since the 2005
DTIS. The reforms were particularly intense in 2006. Simultaneously the country acceded to the revised
100
Key objectives outlined in the National Air Transport Policy include: creation of a competitive and liberalized environment;
ensuring effective regulation, based on international standards (ICAO); ensuring safe, efficient, and cost-effective services;
promoting air transport through trade and development; attracting private investment in airports and airlines; and protecting the
domestic market, while supporting Zambian carrier in obtaining equal international traffic rights.
120
Kyoto Convention, which promotes the simplification and harmonization of customs legislation and
procedures. Some of the measures that were implemented include:
Introducing pre-clearance at selected border posts, notably Chirundu;
Piloting a web based transit data transfer module,
Eliminating pre-shipment inspection and replacing it with destination inspection, and
Strengthening the risk management regime.
6.48 The strengthening of the risk management regime was accompanied by the introduction in
2011 of an authorized client regime (similar to AEO) under which pre-approved shippers are
subjected to expedited clearance through the border. However, the pilot initiatives are not always
rolled out in full. Examples include the electronic payment platform, which is limited to three relatively
small banks, and the AEO regime, which excludes other logistics players such as clearing and forwarding
agents. Of course the existence of a highly atomized clearing industry does not help with reforms.
6.49 The modernization measures have had significant impacts on clearance times. The private
sector claims pre-arrival lodgment of customs declaration at Chirundu has had a bigger impact in
reducing clearance times than the introduction of one-stop operations. Despite the progress that has been
made, ZRA should address other operational weaknesses that are still faced at the border. These relate
especially to expediting RTGS payments and expanding the electronic payment system to other banks.
RTGS payments still face delays and require physical follow-ups by agents, thereby defeating the purpose
of this mode of payment. Electronic payments should also be extended to other banks that have a bigger
footprint in the country.
6.50 The authorities have also taken steps to address the problem of poor coordination at
Zambia’s borders. A bill aimed at improving coordination in border management has been submitted
for consideration by the Cabinet. The bill seeks to streamline, harmonize and rationalize operations at the
border posts in order to facilitate the clearance of goods and travelers. There are two fundamental
weaknesses with Zambia's legal and institutional environment for border management, namely a) there is
no legislation that provides for management of border posts. The various agencies have each their own
legislation, regulations, processes and procedures that impact on trade facilitation and b) there is no
institution that is responsible for the development, maintenance and management of border infrastructure.
At several of the main ports of entry ZRA has assumed responsibility, though without proper legal
authority. This is the case at Chirundu for instance, where the Chanda Commission (2011) recommended
that management of the facility should be transferred from a private contractor appointed by the Ministry
of Transport, Works, Supply and Communication to ZRA.
6.51 The proposed Border Management Bill will address the remaining weaknesses, and to avoid
overlaps, will incorporate the provisions of the One-Stop Border Control Act which would then be
repealed. The specific objectives are consistent with contemporary advice on good practice in border
management, especially with respect to coordination across different agencies and cooperation between
countries.101 The bill will identify a lead border agency which will be responsible for coordinating the
activities of all agencies in their operations with traders. This agency will also be responsible for ensuring
that procedures are followed. The bill is expected to be submitted to parliament in late 2013.
101 For coverage of modern practices in border management see McLinden, G., E. Fanta, D. Widdowson and T. Doyle (2011)
Customs and Border Management Modernization Handbook (eds), World Bank. http://www-
wds.worldbank.org/external/default/WDSContentServer/WDSP/IB/2011/01/07/000356161_20110107013015/Rendered/PDF/588
450PUB0Bord101public10BOX353816B.pdf
121
One-Stop Border posts
6.52 The most visible policy change since the DTIS was the establishment of one-stop border
posts (OSBP) at Zambia’s main land border crossing points. The government enacted the necessary
legal instrument to allow the introduction of OSBPs across the country in the form of the Zambia One-
Stop Border Control Act (No. 8) of 2009. The act enables the negotiation and signature of bilateral
agreements with each country that Zambia wants to establish an OSBP with. This is already the case with
Zimbabwe and Tanzania with which such agreements were signed in 2007 and 2010, respectively.
6.53 The Chirundu border post shared with Zimbabwe was subsequently converted in 2009 into
the first one-stop border post. The introduction of the OSBP has received tremendous attention
globally. However, the experience at Chirundu so far is mixed. This is reflected in the varying opinions
of stakeholders who use the border post. Among official circles the Chirundu OSBP is considered a
tremendous success, and serves as a model for the nationwide program to convert all major border posts
in Zambia into similar operating modalities. Tis group stresses that there has been a reduction in border
clearance times despite an increase in traffic. By contrast, the private sector does not attribute the
reduction of time to the OSBP, but to other measures such as the introduction of pre-arrival clearance
facilities that the authorities have implemented at the same time. In fact, the private sector makes the
point, which this report supports, that there is a risk in focusing too much on the border post facilities and
sitting arrangements and overlooking other critical streamlining and harmonization measures that can
result in even greater efficiencies.
6.54 In principle, OSBPs facilities allow for economies of scale, better cooperation, simplified
formalities, improved control over fraud, and data and intelligence exchanges. OSBP offer several
potential benefits:
The staff of an authority (such as customs) of both countries is stationed in one set of offices and
on one side of the border.
The driver of the truck, or the traveler, is attended to by such an authority of both countries in one
place.
In the case of customs, the vehicle and its load are inspected by the authorities of both countries,
either together or one after the other.
The documents for the goods, while possibly being entered on two sets of documents, are
nevertheless processed in one set of offices.
A truck only needs to queue once, on one side of the border.
6.55 However, there is need for a balanced approach, which is particularly relevant at crossing
points where OSBPs may take time to be introduced. While Chirundu is the best performing of
Zambia’s major ports of entry the other border posts face numerous problems. In particular, the
Kasumbalesa border post with DRC experiences serious delays despite the modern infrastructure on both
sides. Problems at Kasumbalesa limit intra-regional trade and generate market distortions and rent-
seeking behaviors. Reducing crossing times at all borders remains a pressing challenge for Zambia’s
trade facilitation agenda. It should be emphasized, however, that these challenges cannot be addressed
without cooperation with the neighboring countries, and, Zambia being landlocked its leverage on this
kind of matter is low.
6.56 Complementary measures to maximize the benefits of One Stop Border Posts (OSBPs).
Delays at border crossings have long been identified as one of the top non-tariff barriers that increase
Zambia’s trade costs. Contributing factors include inefficient paperwork and processes, lack of cross-
122
border information exchange between customs, and out-of-date or nonexistent transit and trade statistics.
Zambia’s preferred solution of establishing One Stop Border Posts (OSBPs) is useful, but by no means
sufficient. Several complementary measures (such as pre-arrival clearance facilities) are also needed.
Done properly, reforms and judicious automation can significantly reduce the resources required for
infrastructure improvements. Procedural and process reforms should be implemented before the physical
development of any new OSBPs. This will ensure that improved and streamlined procedures will inform
the physical layout and flow of goods, instead of having outdated procedures locked into physical layouts
that are more difficult to reconcile and correct later.
6.57 A comprehensive approach covering infrastructure, IT and procedural reforms is needed to
improve border performance. Experience from other countries suggests that systems for efficient
customs and transit data exchange, management, and reporting can have a huge impact. For example, in
addition to improving connectivity through infrastructure, documents, and procedures, countries in East
Africa have also recently electronically interconnected their customs systems to facilitate trade. Traders
typically lose a great deal of time because agencies in each country re-enter trade-related information in
their computer systems for customs and other border-control purposes. Re-entering data also makes the
process vulnerable to the risk of input errors and fraud; border management measures to combat this risk
can further delay the clearance process. Starting from a document that has already been verified by one
customs authority ensures data integrity and, more importantly, traceability of the declarations across
borders, which is critical for reconciliation and risk management. IT can help improve transit for
landlocked countries, but it is by no means a panacea. Several complementary measures are also needed,
and IT is often the last to be put into place so as not to substitute for real reforms. Done properly, reforms
and judicious automation can significantly reduce the resources required for infrastructure improvements.
It is recommended to prioritize procedural reforms even before establishing any new OSBPs (Box 7.)
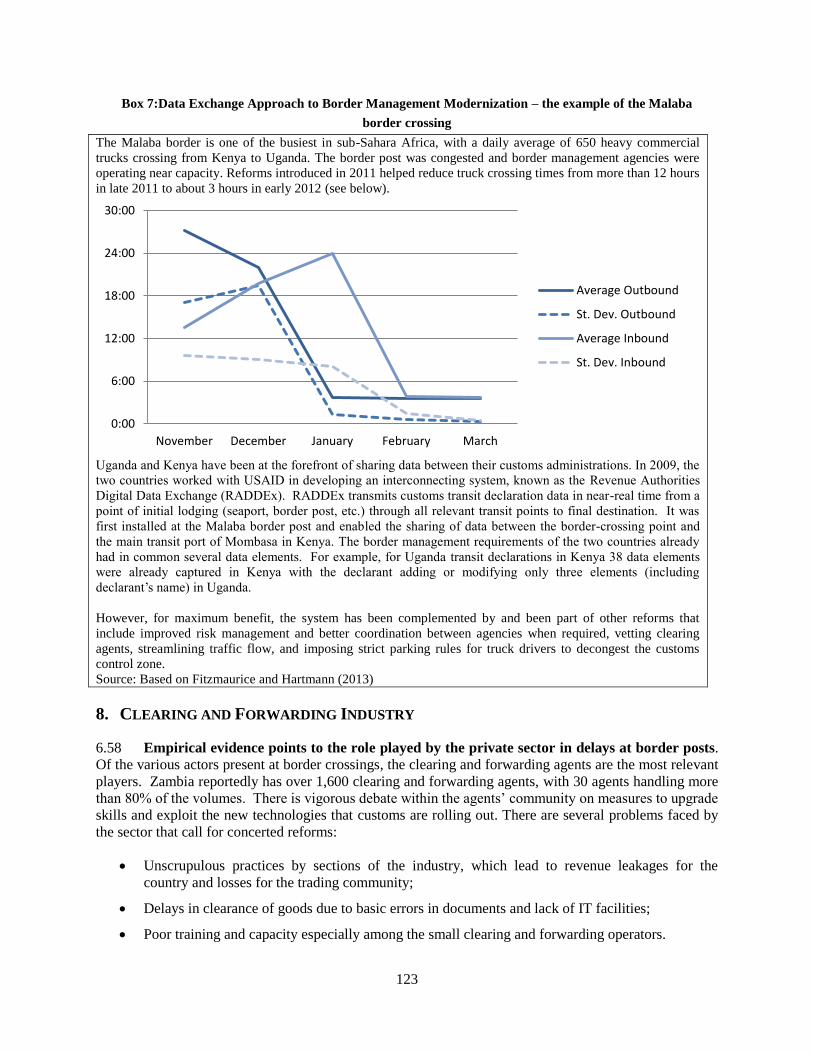
123
Box 7:Data Exchange Approach to Border Management Modernization – the example of the Malaba
border crossing
The Malaba border is one of the busiest in sub-Sahara Africa, with a daily average of 650 heavy commercial
trucks crossing from Kenya to Uganda. The border post was congested and border management agencies were
operating near capacity. Reforms introduced in 2011 helped reduce truck crossing times from more than 12 hours
in late 2011 to about 3 hours in early 2012 (see below).
Uganda and Kenya have been at the forefront of sharing data between their customs administrations. In 2009, the
two countries worked with USAID in developing an interconnecting system, known as the Revenue Authorities
Digital Data Exchange (RADDEx). RADDEx transmits customs transit declaration data in near-real time from a
point of initial lodging (seaport, border post, etc.) through all relevant transit points to final destination. It was
first installed at the Malaba border post and enabled the sharing of data between the border-crossing point and
the main transit port of Mombasa in Kenya. The border management requirements of the two countries already
had in common several data elements. For example, for Uganda transit declarations in Kenya 38 data elements
were already captured in Kenya with the declarant adding or modifying only three elements (including
declarant’s name) in Uganda.
However, for maximum benefit, the system has been complemented by and been part of other reforms that
include improved risk management and better coordination between agencies when required, vetting clearing
agents, streamlining traffic flow, and imposing strict parking rules for truck drivers to decongest the customs
control zone.
Source: Based on Fitzmaurice and Hartmann (2013)
8. CLEARING AND FORWARDING INDUSTRY
6.58 Empirical evidence points to the role played by the private sector in delays at border posts.
Of the various actors present at border crossings, the clearing and forwarding agents are the most relevant
players. Zambia reportedly has over 1,600 clearing and forwarding agents, with 30 agents handling more
than 80% of the volumes. There is vigorous debate within the agents’ community on measures to upgrade
skills and exploit the new technologies that customs are rolling out. There are several problems faced by
the sector that call for concerted reforms:
Unscrupulous practices by sections of the industry, which lead to revenue leakages for the
country and losses for the trading community;
Delays in clearance of goods due to basic errors in documents and lack of IT facilities;
Poor training and capacity especially among the small clearing and forwarding operators.
0:00
6:00
12:00
18:00
24:00
30:00
November December January February March
Average Outbound
St. Dev. Outbound
Average Inbound
St. Dev. Inbound
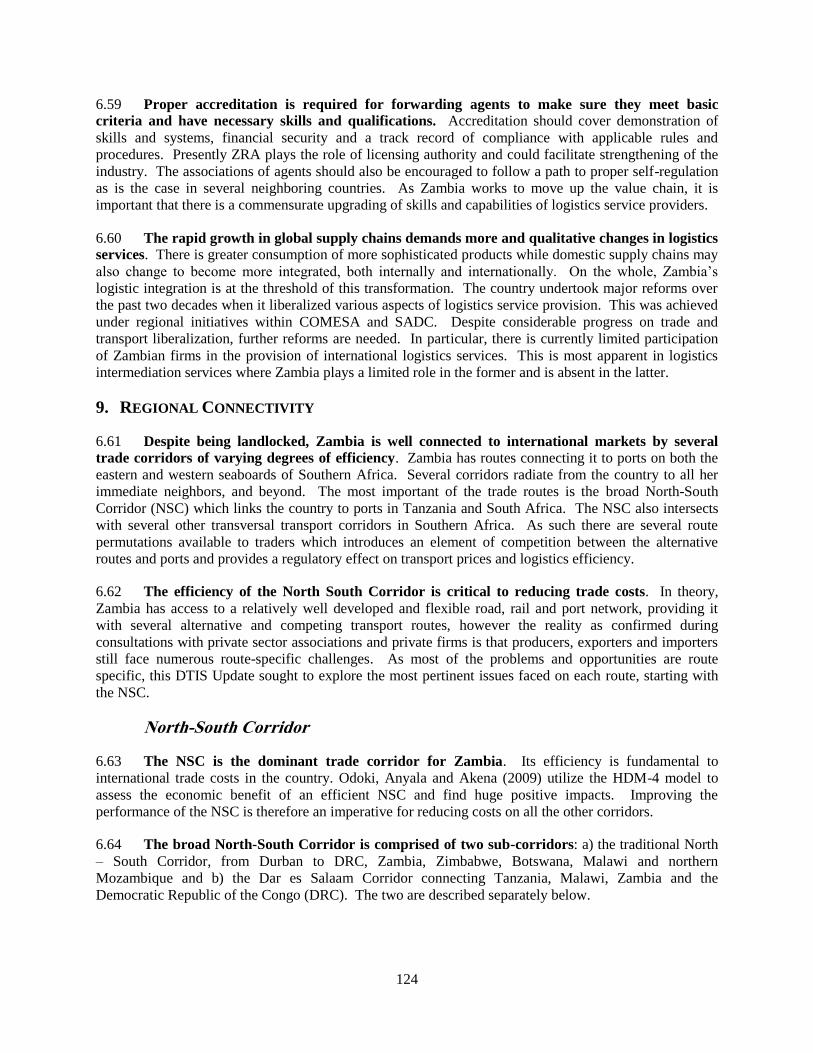
124
6.59 Proper accreditation is required for forwarding agents to make sure they meet basic
criteria and have necessary skills and qualifications. Accreditation should cover demonstration of
skills and systems, financial security and a track record of compliance with applicable rules and
procedures. Presently ZRA plays the role of licensing authority and could facilitate strengthening of the
industry. The associations of agents should also be encouraged to follow a path to proper self-regulation
as is the case in several neighboring countries. As Zambia works to move up the value chain, it is
important that there is a commensurate upgrading of skills and capabilities of logistics service providers.
6.60 The rapid growth in global supply chains demands more and qualitative changes in logistics
services. There is greater consumption of more sophisticated products while domestic supply chains may
also change to become more integrated, both internally and internationally. On the whole, Zambia’s
logistic integration is at the threshold of this transformation. The country undertook major reforms over
the past two decades when it liberalized various aspects of logistics service provision. This was achieved
under regional initiatives within COMESA and SADC. Despite considerable progress on trade and
transport liberalization, further reforms are needed. In particular, there is currently limited participation
of Zambian firms in the provision of international logistics services. This is most apparent in logistics
intermediation services where Zambia plays a limited role in the former and is absent in the latter.
9. REGIONAL CONNECTIVITY
6.61 Despite being landlocked, Zambia is well connected to international markets by several
trade corridors of varying degrees of efficiency. Zambia has routes connecting it to ports on both the
eastern and western seaboards of Southern Africa. Several corridors radiate from the country to all her
immediate neighbors, and beyond. The most important of the trade routes is the broad North-South
Corridor (NSC) which links the country to ports in Tanzania and South Africa. The NSC also intersects
with several other transversal transport corridors in Southern Africa. As such there are several route
permutations available to traders which introduces an element of competition between the alternative
routes and ports and provides a regulatory effect on transport prices and logistics efficiency.
6.62 The efficiency of the North South Corridor is critical to reducing trade costs. In theory,
Zambia has access to a relatively well developed and flexible road, rail and port network, providing it
with several alternative and competing transport routes, however the reality as confirmed during
consultations with private sector associations and private firms is that producers, exporters and importers
still face numerous route-specific challenges. As most of the problems and opportunities are route
specific, this DTIS Update sought to explore the most pertinent issues faced on each route, starting with
the NSC.
North-South Corridor
6.63 The NSC is the dominant trade corridor for Zambia. Its efficiency is fundamental to
international trade costs in the country. Odoki, Anyala and Akena (2009) utilize the HDM-4 model to
assess the economic benefit of an efficient NSC and find huge positive impacts. Improving the
performance of the NSC is therefore an imperative for reducing costs on all the other corridors.
6.64 The broad North-South Corridor is comprised of two sub-corridors: a) the traditional North
– South Corridor, from Durban to DRC, Zambia, Zimbabwe, Botswana, Malawi and northern
Mozambique and b) the Dar es Salaam Corridor connecting Tanzania, Malawi, Zambia and the
Democratic Republic of the Congo (DRC). The two are described separately below.
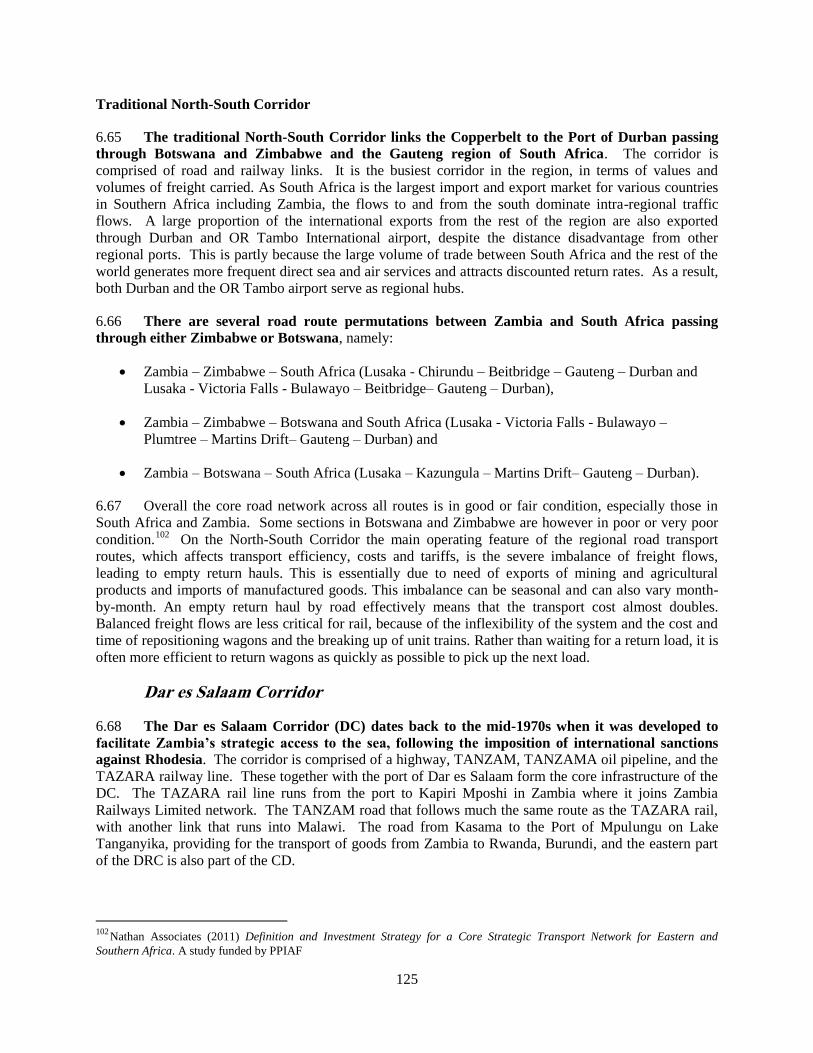
125
Traditional North-South Corridor
6.65 The traditional North-South Corridor links the Copperbelt to the Port of Durban passing
through Botswana and Zimbabwe and the Gauteng region of South Africa. The corridor is
comprised of road and railway links. It is the busiest corridor in the region, in terms of values and
volumes of freight carried. As South Africa is the largest import and export market for various countries
in Southern Africa including Zambia, the flows to and from the south dominate intra-regional traffic
flows. A large proportion of the international exports from the rest of the region are also exported
through Durban and OR Tambo International airport, despite the distance disadvantage from other
regional ports. This is partly because the large volume of trade between South Africa and the rest of the
world generates more frequent direct sea and air services and attracts discounted return rates. As a result,
both Durban and the OR Tambo airport serve as regional hubs.
6.66 There are several road route permutations between Zambia and South Africa passing
through either Zimbabwe or Botswana, namely:
Zambia – Zimbabwe – South Africa (Lusaka - Chirundu – Beitbridge – Gauteng – Durban and
Lusaka - Victoria Falls - Bulawayo – Beitbridge– Gauteng – Durban),
Zambia – Zimbabwe – Botswana and South Africa (Lusaka - Victoria Falls - Bulawayo –
Plumtree – Martins Drift– Gauteng – Durban) and
Zambia – Botswana – South Africa (Lusaka – Kazungula – Martins Drift– Gauteng – Durban).
6.67 Overall the core road network across all routes is in good or fair condition, especially those in
South Africa and Zambia. Some sections in Botswana and Zimbabwe are however in poor or very poor
condition.102
On the North-South Corridor the main operating feature of the regional road transport
routes, which affects transport efficiency, costs and tariffs, is the severe imbalance of freight flows,
leading to empty return hauls. This is essentially due to need of exports of mining and agricultural
products and imports of manufactured goods. This imbalance can be seasonal and can also vary month-
by-month. An empty return haul by road effectively means that the transport cost almost doubles.
Balanced freight flows are less critical for rail, because of the inflexibility of the system and the cost and
time of repositioning wagons and the breaking up of unit trains. Rather than waiting for a return load, it is
often more efficient to return wagons as quickly as possible to pick up the next load.
Dar es Salaam Corridor
6.68 The Dar es Salaam Corridor (DC) dates back to the mid-1970s when it was developed to
facilitate Zambia’s strategic access to the sea, following the imposition of international sanctions
against Rhodesia. The corridor is comprised of a highway, TANZAM, TANZAMA oil pipeline, and the
TAZARA railway line. These together with the port of Dar es Salaam form the core infrastructure of the
DC. The TAZARA rail line runs from the port to Kapiri Mposhi in Zambia where it joins Zambia
Railways Limited network. The TANZAM road that follows much the same route as the TAZARA rail,
with another link that runs into Malawi. The road from Kasama to the Port of Mpulungu on Lake
Tanganyika, providing for the transport of goods from Zambia to Rwanda, Burundi, and the eastern part
of the DRC is also part of the CD.
102
Nathan Associates (2011) Definition and Investment Strategy for a Core Strategic Transport Network for Eastern and
Southern Africa. A study funded by PPIAF
126
Figure 6.7 : Zambia trade volumes through Dar es Salaam Port
Source: Author estimates data from Tanzania Ports Authority
6.69 Over the past decade, the volume of Zambia cargo passing though Dar es Salaam port and
therefore moving along the corridor has grown significantly (Figure 6.7). Zambia and DRC account
together for 21 percent of container imports, and 42 percent of container exports respectively through Dar
es Salaam. All that volume moves at stage through the Zambian road and railway networks. There is
more containerized Zambian cargo being imported through Dar es Salaam port than there are exports. In
fact, the private sector in Zambia generally prefers to ship containers through Dar rather than bulk or
other types of cargo. The corridor infrastructure is not well designed to handle oversized shipments, such
as those often used in the mining industry. Most of the cargo is removed from the port by road (Figure
6.8). The railway has been contributing less and less to Zambian traffic movement in and out of the port.
This is despite the fact that for some of the types of traffic and distances involved railway transport has a
comparative advantage. While transit traffic volumes between the port of Dar es Salaam and the
Copperbelt, the main source of traffic has increased considerably over the past 5 years. Most of the
growth has been picked up by road services, while rail volumes have declined.
Figure 6.8 : Zambia Cargo Removals from Port of Dar es Salaam
Source: Data from TPA
0
5,000
10,000
15,000
20,000
19
93
19
94
19
95
19
96
19
97
19
98
19
99
20
00
20
01
20
02
20
03
20
04
20
05
20
06
20
07
20
08
20
09
20
10
20
11
20
12
Nu
mb
er
of
Co
nta
ine
rs (
TEU
)
Year
Import Export
0
10,000
20,000
30,000
40,000
50,000
60,000
Jan-1
0
Mar
-10
May
-10
Jul-
10
Sep
-10
Nov-1
0
Jan-1
1
Mar
-11
May
-11
Jul-
11
Sep
-11
Nov-1
1
Jan-1
2
Mar
-12
May
-12
Jul-
12
Tra
ffic
Volu
me,
ton
s
Road
Rail
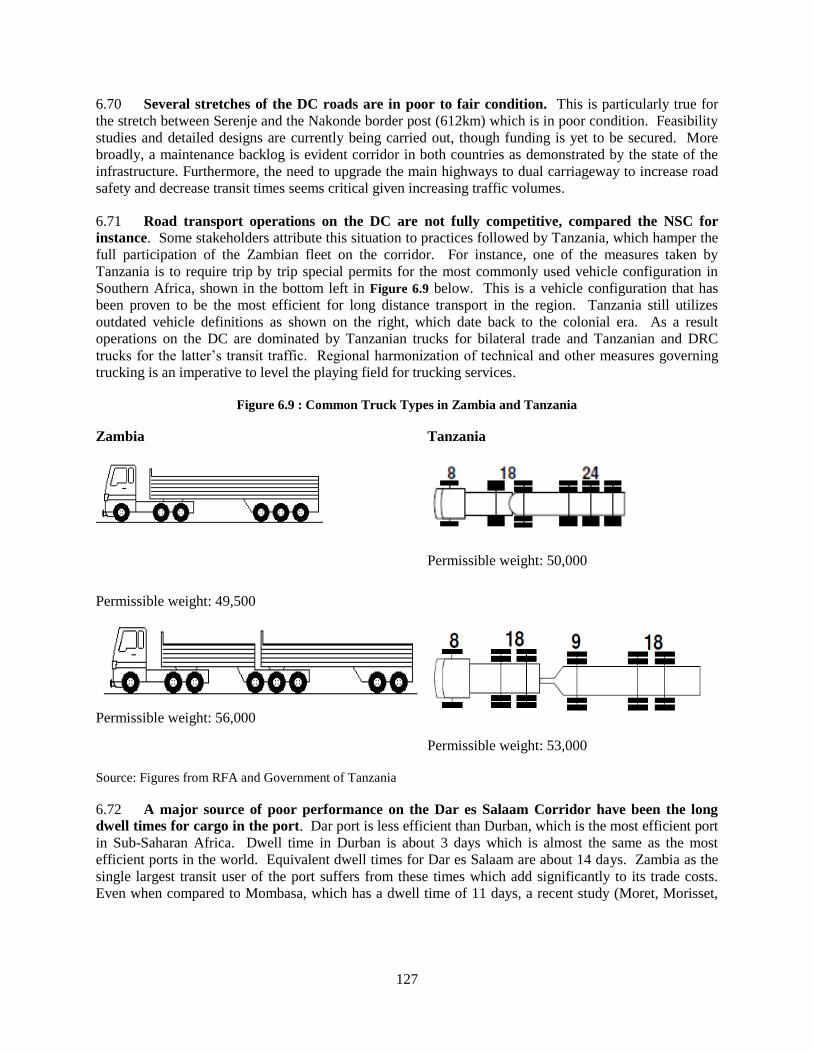
127
6.70 Several stretches of the DC roads are in poor to fair condition. This is particularly true for
the stretch between Serenje and the Nakonde border post (612km) which is in poor condition. Feasibility
studies and detailed designs are currently being carried out, though funding is yet to be secured. More
broadly, a maintenance backlog is evident corridor in both countries as demonstrated by the state of the
infrastructure. Furthermore, the need to upgrade the main highways to dual carriageway to increase road
safety and decrease transit times seems critical given increasing traffic volumes.
6.71 Road transport operations on the DC are not fully competitive, compared the NSC for
instance. Some stakeholders attribute this situation to practices followed by Tanzania, which hamper the
full participation of the Zambian fleet on the corridor. For instance, one of the measures taken by
Tanzania is to require trip by trip special permits for the most commonly used vehicle configuration in
Southern Africa, shown in the bottom left in Figure 6.9 below. This is a vehicle configuration that has
been proven to be the most efficient for long distance transport in the region. Tanzania still utilizes
outdated vehicle definitions as shown on the right, which date back to the colonial era. As a result
operations on the DC are dominated by Tanzanian trucks for bilateral trade and Tanzanian and DRC
trucks for the latter’s transit traffic. Regional harmonization of technical and other measures governing
trucking is an imperative to level the playing field for trucking services.
Figure 6.9 : Common Truck Types in Zambia and Tanzania
Zambia Tanzania
Permissible weight: 49,500
Permissible weight: 50,000
Permissible weight: 56,000
Permissible weight: 53,000
Source: Figures from RFA and Government of Tanzania
6.72 A major source of poor performance on the Dar es Salaam Corridor have been the long
dwell times for cargo in the port. Dar port is less efficient than Durban, which is the most efficient port
in Sub-Saharan Africa. Dwell time in Durban is about 3 days which is almost the same as the most
efficient ports in the world. Equivalent dwell times for Dar es Salaam are about 14 days. Zambia as the
single largest transit user of the port suffers from these times which add significantly to its trade costs.
Even when compared to Mombasa, which has a dwell time of 11 days, a recent study (Moret, Morisset,
128
and Regolo, 2012)103
estimated that inefficiency at Dar port adds 5% and 24% to the cost of a bulk ton
and container respectively, passing through the port. The cost disadvantage to Durban would be much
higher than this.
Trans-Caprivi Corridor
6.73 The Trans-Caprivi Highway links the Port of Walvis Bay to the inland areas of Zambia
(Livingstone, Lusaka, Ndola and Kitwe) and the South Eastern Democratic Republic of Congo
(Lubumbashi area) via the bridge across the Zambezi at Katima Mulilo. A road through the Corridor
stretches over 2,500 km and is supported by a railway line between Walvis Bay and Grootfontein, where
transloading facilities are available. In addition to Zambia the Trans-Caprivi Corridor covers also DRC
and Zimbabwe. The main markets it serves are the Zambia and DRC copper belts. The TCC is of
strategic importance to Zambia and the other countries as it offers the only available access route to the
west coast port for international trade. Despite longer overland distances the TCC has shorter sailing
times to and from markets in Europe and North America.
6.74 In fact the TCC has developed in part at the instigation of the mining firms which in 2006
expressed interest in a third corridor to the sea. Initially a shortage of smelting capacity in the copper
belt led to the transport of copper to Tsumeb, Namibia for smelting and export through Walvis Bay. The
Lumwana mine in Western Zambia will be served by a road directly to Sesheke for which a pre-feasibility
study has been done. The corridor also handles imports from Europe and North America for the mining
industry especially of machinery, chemicals and other imports. In addition, the corridor serves DRC
which exports copper, cobalt and other minerals on the route and inputs food stuffs and other consumer
goods. DRC imports frozen beef and chicken, which is transported from South America through Walvis
Bay and then carried inland by truck. DRC also receives shipments of vegetables and other goods from
major South African grocery chains, some via the Trans Caprivi.
6.75 Cargo volumes for the Zambian and DRC (Lubumbashi) markets has since then grown significantly over the past 5 years (Figure 6.10). Namibia has also joined hands with the Zambian and DRC governments to establish joint forums to address issues along the corridor such as border transit times. As soon as the economy of Zimbabwe improves, the Welvis Bay Corridor Group (WBCG) is expected to start an aggressive marketing campaign to transport goods to this market.
103
Charles Moret, Jacques Morisset, Julie Regolo (2012) THE TWO BILLION DOLLAR QUESTION: HOW TO PUSH
EFFICIENCY ENHANCING REFORMS IN THE PORT OF DAR ES SALAAM?, Policy Research Working Paper.
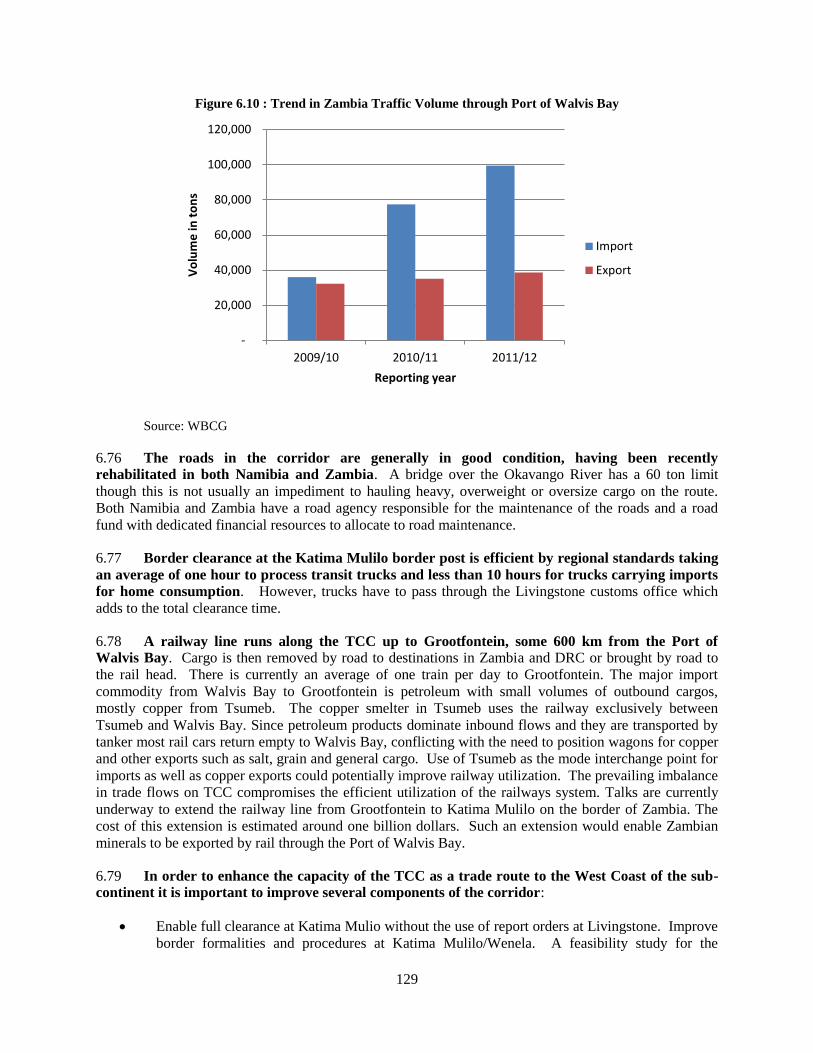
129
Figure 6.10 : Trend in Zambia Traffic Volume through Port of Walvis Bay
Source: WBCG
6.76 The roads in the corridor are generally in good condition, having been recently
rehabilitated in both Namibia and Zambia. A bridge over the Okavango River has a 60 ton limit
though this is not usually an impediment to hauling heavy, overweight or oversize cargo on the route.
Both Namibia and Zambia have a road agency responsible for the maintenance of the roads and a road
fund with dedicated financial resources to allocate to road maintenance.
6.77 Border clearance at the Katima Mulilo border post is efficient by regional standards taking
an average of one hour to process transit trucks and less than 10 hours for trucks carrying imports
for home consumption. However, trucks have to pass through the Livingstone customs office which
adds to the total clearance time.
6.78 A railway line runs along the TCC up to Grootfontein, some 600 km from the Port of
Walvis Bay. Cargo is then removed by road to destinations in Zambia and DRC or brought by road to
the rail head. There is currently an average of one train per day to Grootfontein. The major import
commodity from Walvis Bay to Grootfontein is petroleum with small volumes of outbound cargos,
mostly copper from Tsumeb. The copper smelter in Tsumeb uses the railway exclusively between
Tsumeb and Walvis Bay. Since petroleum products dominate inbound flows and they are transported by
tanker most rail cars return empty to Walvis Bay, conflicting with the need to position wagons for copper
and other exports such as salt, grain and general cargo. Use of Tsumeb as the mode interchange point for
imports as well as copper exports could potentially improve railway utilization. The prevailing imbalance
in trade flows on TCC compromises the efficient utilization of the railways system. Talks are currently
underway to extend the railway line from Grootfontein to Katima Mulilo on the border of Zambia. The
cost of this extension is estimated around one billion dollars. Such an extension would enable Zambian
minerals to be exported by rail through the Port of Walvis Bay.
6.79 In order to enhance the capacity of the TCC as a trade route to the West Coast of the sub-
continent it is important to improve several components of the corridor:
Enable full clearance at Katima Mulio without the use of report orders at Livingstone. Improve
border formalities and procedures at Katima Mulilo/Wenela. A feasibility study for the
-
20,000
40,000
60,000
80,000
100,000
120,000
2009/10 2010/11 2011/12
Vo
lum
e in
to
ns
Reporting year
Import
Export
130
implementation was commissioned by SADC and carried out in early 2007 with funding from
JICA. The Study provides an analysis of procedural changes, draft legal framework and
engineering drawings for the reconfiguration of the facilities under construction.
Expand and redesign the ICD at Tsumeb to handle the increased volumes with separate
receiving and dispatching areas and access roads, increased handling equipment, 24-hour
operations and a customs officer in residence so that cargo can travel under special bond
arrangements and be cleared or checked at the railhead facility.
Improve the road from Solwezi to Katima Mulilo via Mongu. The road segments from Sesheke
to Mongu, Kaoma to Kasempa, and Kasempa to junction with M008, are all part of Zambia’s
Western Corridor and a high priority for addressing under-development in Zambia. They are
ranked, respectively, 4,5 and 6 out of 31 in the list of priority roads in Zambia’s Road Sector
Investment Program (April 2007). These segments form the road linking the mines near
Solwezi and Lumwana to the Sesheke/Katima Mulilo Bridge and Walvis Bay.
As a long term initiative build a rail link between Livingstone and Tsumeb which already been
proposed by the two governments. This intervention for it to be viable would require
operational improvements in the rest of the Zambian railways.
Benguela Corridor
6.80 The Benguela Corridor (also known as the Lobito Corridor), has traditionally been an
important outlet to the sea for much of the Democratic Republic of Congo and Zambia.104
The
corridor extends from the port of Lobito in Angola and runs through the Shaba Province in Congo to the
Copperbelt of Zambia. When operational it is the shortest route linking these countries to Western
Europe and America. Prior to 1975, the Lobito Corridor served as the main international trade route for
the DRC and Zambian copper belts, with up to 2.5 mtpa being carried by the Benguela railway. However
following the protracted civil war starting in 1975 traffic volumes fell significantly such that by 2000 the
corridor carried only 414,000t of traffic, most of it Angolan. Traffic volumes have been rising in recent
years, as infrastructure on the Angolan side has been rehabilitated through financial support from China.
In 2010 the corridor carried around 1m tons, most of it still Angolan.
6.81 The main constraints to the Benguela Corridor attracting some Zambian trade traffic are
infrastructural and competition from other corridors. The road link between Angola and Zambia and
DRC are poor, and most often closed during the rainy season. While there is a surfaced road from Lobito
to Kuito (450 km), the rest of the route is presently unsurfaced and not suitable as an all-weather freight
transport route. The route carries only limited trade in foodstuffs during the dry season, while the routes
through Namibia are used during the wet season. Still, there are plans in both Angola and Zambia in
particular to improve connectivity between the Angolan, Zambian and DRC road networks.
6.82 The Benguela Corridor has traditionally been a railway based corridor and this is where
the prospects for an alternative route for Zambian trade lie. The railway was built between 1903 and
1924, at a time when road transport over long distances was not considered to be viable. The track is
1067 mm gauge, the same as the rest of the Southern African system. The track on the Angola side has
been rehabilitated from Lobito to the border with DRC with Chinese financial support. On the DRC side,
104
The corridor is part of the Trans-African Highway 9 which links the Atlantic Ocean, from Lobito in Angola with Beira on the
Indian Ocean in Mozambique passing through the Democratic Republic of the Congo, Zambia and Zimbabwe
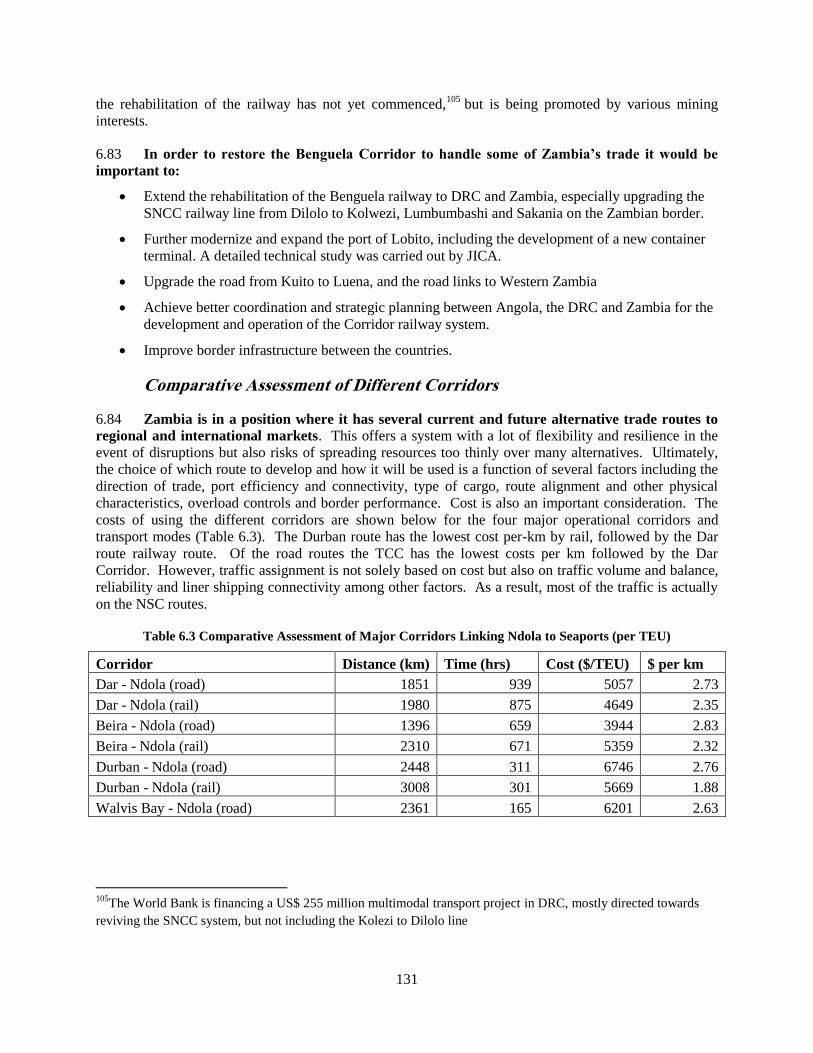
131
the rehabilitation of the railway has not yet commenced,105
but is being promoted by various mining
interests.
6.83 In order to restore the Benguela Corridor to handle some of Zambia’s trade it would be
important to:
Extend the rehabilitation of the Benguela railway to DRC and Zambia, especially upgrading the
SNCC railway line from Dilolo to Kolwezi, Lumbumbashi and Sakania on the Zambian border.
Further modernize and expand the port of Lobito, including the development of a new container
terminal. A detailed technical study was carried out by JICA.
Upgrade the road from Kuito to Luena, and the road links to Western Zambia
Achieve better coordination and strategic planning between Angola, the DRC and Zambia for the
development and operation of the Corridor railway system.
Improve border infrastructure between the countries.
Comparative Assessment of Different Corridors
6.84 Zambia is in a position where it has several current and future alternative trade routes to
regional and international markets. This offers a system with a lot of flexibility and resilience in the
event of disruptions but also risks of spreading resources too thinly over many alternatives. Ultimately,
the choice of which route to develop and how it will be used is a function of several factors including the
direction of trade, port efficiency and connectivity, type of cargo, route alignment and other physical
characteristics, overload controls and border performance. Cost is also an important consideration. The
costs of using the different corridors are shown below for the four major operational corridors and
transport modes (Table 6.3). The Durban route has the lowest cost per-km by rail, followed by the Dar
route railway route. Of the road routes the TCC has the lowest costs per km followed by the Dar
Corridor. However, traffic assignment is not solely based on cost but also on traffic volume and balance,
reliability and liner shipping connectivity among other factors. As a result, most of the traffic is actually
on the NSC routes.
Table 6.3 Comparative Assessment of Major Corridors Linking Ndola to Seaports (per TEU)
Corridor Distance (km) Time (hrs) Cost ($/TEU) $ per km
Dar - Ndola (road) 1851 939 5057 2.73
Dar - Ndola (rail) 1980 875 4649 2.35
Beira - Ndola (road) 1396 659 3944 2.83
Beira - Ndola (rail) 2310 671 5359 2.32
Durban - Ndola (road) 2448 311 6746 2.76
Durban - Ndola (rail) 3008 301 5669 1.88
Walvis Bay - Ndola (road) 2361 165 6201 2.63
105
The World Bank is financing a US$ 255 million multimodal transport project in DRC, mostly directed towards
reviving the SNCC system, but not including the Kolezi to Dilolo line
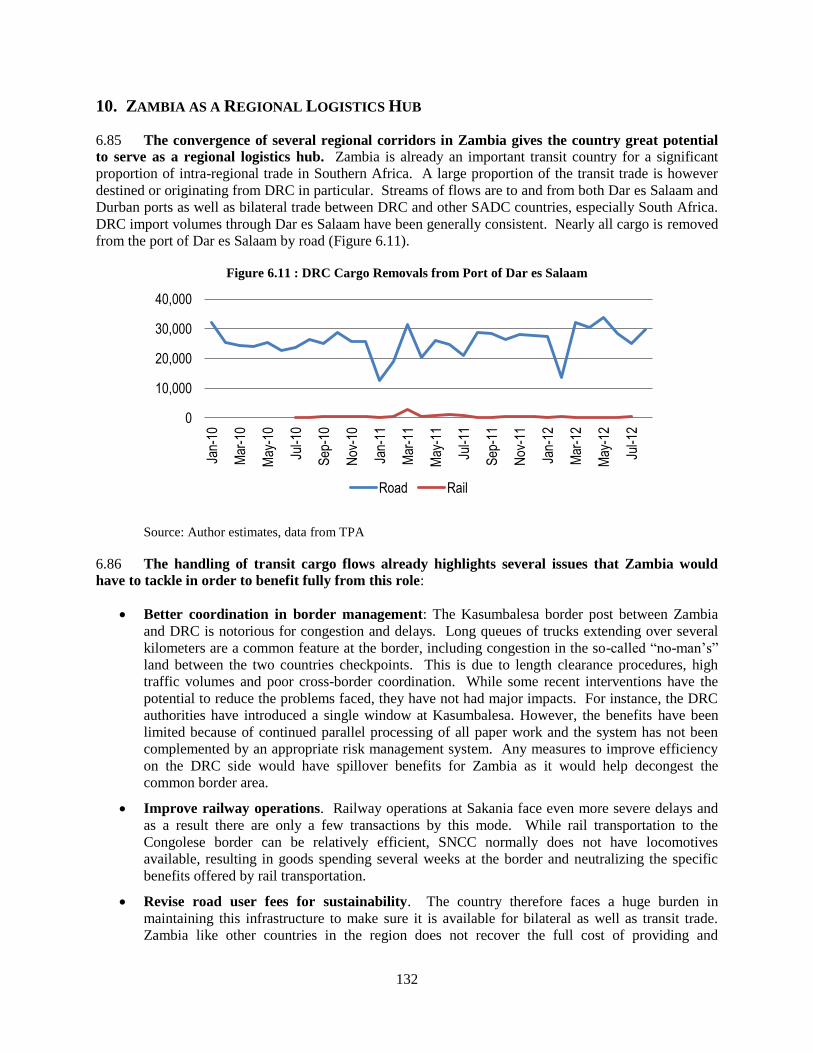
132
10. ZAMBIA AS A REGIONAL LOGISTICS HUB
6.85 The convergence of several regional corridors in Zambia gives the country great potential
to serve as a regional logistics hub. Zambia is already an important transit country for a significant
proportion of intra-regional trade in Southern Africa. A large proportion of the transit trade is however
destined or originating from DRC in particular. Streams of flows are to and from both Dar es Salaam and
Durban ports as well as bilateral trade between DRC and other SADC countries, especially South Africa.
DRC import volumes through Dar es Salaam have been generally consistent. Nearly all cargo is removed
from the port of Dar es Salaam by road (Figure 6.11).
Figure 6.11 : DRC Cargo Removals from Port of Dar es Salaam
Source: Author estimates, data from TPA
6.86 The handling of transit cargo flows already highlights several issues that Zambia would
have to tackle in order to benefit fully from this role:
Better coordination in border management: The Kasumbalesa border post between Zambia
and DRC is notorious for congestion and delays. Long queues of trucks extending over several
kilometers are a common feature at the border, including congestion in the so-called “no-man’s”
land between the two countries checkpoints. This is due to length clearance procedures, high
traffic volumes and poor cross-border coordination. While some recent interventions have the
potential to reduce the problems faced, they have not had major impacts. For instance, the DRC
authorities have introduced a single window at Kasumbalesa. However, the benefits have been
limited because of continued parallel processing of all paper work and the system has not been
complemented by an appropriate risk management system. Any measures to improve efficiency
on the DRC side would have spillover benefits for Zambia as it would help decongest the
common border area.
Improve railway operations. Railway operations at Sakania face even more severe delays and
as a result there are only a few transactions by this mode. While rail transportation to the
Congolese border can be relatively efficient, SNCC normally does not have locomotives
available, resulting in goods spending several weeks at the border and neutralizing the specific
benefits offered by rail transportation.
Revise road user fees for sustainability. The country therefore faces a huge burden in
maintaining this infrastructure to make sure it is available for bilateral as well as transit trade.
Zambia like other countries in the region does not recover the full cost of providing and
0
10,000
20,000
30,000
40,000
Jan-
10
Mar
-10
May
-10
Jul-1
0
Sep
-10
Nov
-10
Jan-
11
Mar
-11
May
-11
Jul-1
1
Sep
-11
Nov
-11
Jan-
12
Mar
-12
May
-12
Jul-1
2
Road Rail
133
maintaining the road infrastructure from transit trucks.106
Road transit fees in COMESA were last
set more than ten years ago. Several efforts by SADC to update the fees have not been successful
due to disagreements over the methodology for calculating the new fees. Clearly the authorities
are conscious of the country’s international obligations to facilitate such traffic. Alternative
strategies are currently being explored to recover road user costs of which tolling along the main
corridors seems the one receiving most attention by GRZ. Otherwise tolling could be an effective
strategy to internalize some of the costs of road infrastructure, whose exclusion from road pricing
is often blamed for the dominance of road transport over rail in Zambia.
Introduce a functional regional bond guarantee scheme. An efficient customs transit regime is
in many respects a keystone of regional trade connectivity, and in fact can serve an array of
corridors in the region. Though a relatively new concept, most of the core principles of transit are
centuries old. So far a viable and efficient transit regime has proven elusive for Southern Africa.
The objective of a transit reform should be to implement it along the established and proven
benchmarks, without tampering with core mechanisms or omitting key features of an existing,
well-functioning Customs transit regime, as is often the case with some misplaced innovations.
There is certainly need for such a system either within the COMESA or SADC frameworks,
ideally a common one for both.
6.87 In order to serve as a logistics hub it is important to have a clear national strategy, ideally
based on specific target supply chains and value addition. For instance, Mauritius which is a member
of the APEI grouping has such a strategy where it seeks to serve as a global launch pad for access to the
broader African market. The country seeks to serve as a value-adding business services platform in
Africa – Asia trade. In this regard transport connectivity with continental Africa is important. The
seaport already serves, though at limited levels, as a transshipment point for traffic to some ports on the
eastern seaboard of Africa including with Mozambique. As such, the performance of the sea port at Port
Louis and the international airport are critical. The main point is that for the APEI countries to benefit
fully from the initiative, they each need to take steps to exploit their comparative advantages and to
nurture real value addition in specific regional and international trades. The current lack of convergence
on the treatment of rules of origin, in particular, is one of the most critical challenges faced. This is one
aspect that Mauritius is driving within SADC so as to increase potential access for goods produced in the
country.
11. REGIONAL MECHANISMS FOR TRADE FACILITATION AND LOGISTICS
COMESA and SADC
6.88 COMESA and SADC both have several trade facilitation instruments that provide a basis
for regional harmonization of policies and procedures between Zambia and neighboring countries. The instruments are comprehensive as they cover infrastructure planning and standards, harmonization of
policies for the cross border movement of means of transport and goods by all modes road, air and
maritime transport as well as frameworks for the regulation of transport services. By implementing those
instruments Zambia and other countries in Southern Africa have already achieved convergence on several
aspects of regional trade logistics. However, there remain several other mostly technical areas where
harmonization and even standardization is necessary but is yet to be achieved. These include measures
for truly integrated regional services especially in trucking, railway operations and air transport market
access. Some of the measures in road transport include third party insurance regimes and regionally
operational transit systems. It is recommended that Zambia approaches these on a corridor basis or by
working with small groups of countries. It is often at such levels that constraints have a practical impact
106
While a review of road user fees carried out for SADC in 2007 suggested Zambia was over-recovering costs, the report only
covered maintenance needs rather than full cost recovery.
134
and the effects of their resolution can be most visible. Zambia of course is already pursuing such a
strategy by working with like-minded countries, notably though the Accelerated Program for Economic
Integration (APEI).
Accelerated Program for Economic Integration
6.89 One of the recent initiatives that offers great potential to reduce Zambia’s trade costs
especially to selected regional markets in Southern Africa is the Accelerated Program for Economic
Integration (APEI). The APEI which was launched in 2012 brings together Malawi, Mauritius,
Mozambique, Seychelles and Zambia. The program seeks to expedite implementation of reforms that the
countries are already committed to, at the domestic, bilateral or multi-country levels. From a trade
facilitation perspective the potential will be unlocked by measures that will reduce the costs of accessing
each other’s as well as other markets more broadly. APEI does acknowledge the complexity of regional
reforms which has often delayed implementation as evident from the COMESA and SADC experiences.
6.90 As the APEI countries are not all contiguous, there are reforms that the countries have to
take individually and others that the contiguous group (Malawi, Mozambique, and Zambia) can
pursue as a group. The measures fall into two broad categories, improving border management and
improving transport and logistics connectivity between the countries. Both could create environments
that can nurture integrated regional supply chains which are so far largely lacking across Southern Africa.
Border Management
6.91 One area where the APEI countries have made most progress is with respect to border
management, often based on the Revised Kyoto Convention. The International Convention on the
Simplification and Harmonization of Customs Procedures 1999 (the Revised Kyoto Convention) outlines
modern and efficient customs procedures and has often been a catalyst from reform and modernization in
most countries that are party to it. It advocates for better management of risks in a way that at the same
time promotes trade facilitation while ensuring effective control.
6.92 All APEI countries have either ratified or are in the process of ratifying the Convention.
Zambia was one of the first countries under the grouping to adopt the Convention in 2006. However,
based on a recent needs assessment Zambia has to enhance the application of existing risk management
frameworks and work towards compliance with the principles contained in the convention. Other APEI
countries are making progress in implementing the Convention:
Malawi and Seychelles are both in the process of finalizing accession to the Revised Kyoto
Convention. They expect to see reduced clearance times at borders by increasingly applying risk-
management procedures. In addition Malawi is also taking steps to reduce the number of
agencies present at the border and to better coordinate those that will remain. In early 2013 the
government adopted measures to reduce the number of agencies at border points from 17 to 5 and
other steps to improve efficiency such as pre-arrival clearance of goods, an improved transit bond
system and direct trader input of customs declaration data.
Mauritius implemented a Customs Management System in 1997, which was broadly consistent
with the Revised Kyoto Convention, then yet to enter into force. The system has been enhanced
since, with current focus being on the application of ICT and customs controls (including risk
management) at the border. Mauritius is already implementing a trade portal to bring together all
the information on administrative requirements for the business operations. As in most countries,
such information is presently dispersed across the various agencies and their websites which
increases trade costs. The trade portal should be live in late 2013. In addition the government is
135
also working on introducing a single-window system to enhance border management. Already
the Mauritius Customs Authority and other agencies at the main seaport are co-located providing
a one-stop shop for clearance purposes. The single window system, expected to be operational in
2014, will be an electronic and enhanced implementation of the current system. In fact Mauritius
has the most efficient border management system of the APEI countries. A time release study in
2008 found that half of declarations were cleared within an hour, and two-thirds of all
declarations were cleared within 7 hours. The MRA has in place a fairly robust, though evolving
risk management system. As a result, physical inspections are minimal. Export clearances are
handled within a few minutes. Zambia and the other APEI countries can learn valuable lessons
from the Mauritius experience.
Mozambique acceded to the Revised Kyoto Convention in 2010. Implementation is expected by
2015 based on an action plan that is now being executed. Already in 2011 the government of
Mozambique introduced an electronic Single Window system (Janela Unica), though a private-
public partnership. The system permits customs brokers to submit declarations electronically to
customs and other agencies as well as to commercial banks. A transit component is currently
being added to the system. The problem across Southern Africa is the proliferation of transit
system. Harmonization of the systems is of paramount importance, especially for landlocked
Malawi and Zambia. Related to this the governments of Malawi and Mozambique now plan to
establish an OSBP at the Mwanza/Zobue border.
Mozambique has traditionally performed poorly in availing information on border requirements
and operations. In an effort to address this, the government is building a trade portal to improve
transparency while at the same time reviewing the roles of the various government agencies
present at borders with a view to enhance operational efficiency.
Transport Connectivity
6.93 Among the group of contiguous countries, enhancing Malawi and Zambia’s access to transit
facilities in Mozambique could offer a lower cost alternative trade route, at least to the island states
and to markets in South and East Asia. It is in this regard that the Nacala Corridor which the three
governments are keen to develop will realize its full potential. Zambia is keen to develop an alternative
corridor to the sea connecting to the port of Nacala in Mozambique along the Nacala Corridor. The
corridor is comprised of road and rail links, though the former is still being developed. Road transport is
via the M2 in Malawi to the Milange border post, then via the unpaved EN7 to Mocuba, and the paved N1
to Nampula and Nacala. The total distance from Blantyre to Nacala by road is about 780km, compared to
about 850 km to Beira, all surfaced road, via Tete. In June 2009, AfDB approved the Nacala Road
Corridor Project, designed to support the Nacala to Lusaka Corridor, SADC RTRN Route 20. The first
phase includes paving the missing link of 510 km between Nampula and the Malawi border and
constructing a bypass road around Lilongwe. The second phase is improvements in Zambia. The third
phase involves further improvements in Mozambique and Malawi and development of two one stop
border posts.
6.94 Historically, railway is the established mode of transport in the corridor, especially between
Malawi and Mozambique. The Nacala Corridor was developed initially to serve northern Mozambique
with a railway line running from Nacala, through Nampula and Cuamba to Lichinga. In the early 1970s
the railway line was extended 150km to connect to the Malawi rail system at Liwonde. Until then, the
Malawi system was linked only to Beira via the Sena line. In 2010 a 35km extension was completed
from Mchinji in Malawi to Chipata just across the border in Zambia, thereby providing a head for Zambia
to access Nacala by rail. The extension provides a possibility for Zambia to export agricultural and
mineral products through Nacala. According to the ZDA the eastern province produces more than 20%
and 73% of Zambia’s maize and sunflower produce respectively while tobacco exports produced in
136
eastern Zambia provided the initial impetus for connecting Chipata to Nacala. However, the line is still to
be fully operational, as it lacks a proper terminal at Chipata as well as running stock.
6.95 Further developments of the railway system are planned. There are plans to build a 250km
long link from Chipata via Petauke to join the TAZARA system at Mpika thereby providing full railway
access from the Copperbelt to the Port of Nacala. Once completed the line to Nacala could be the second
shortest rail link for Zambia to a seaport, after Beira. However, given the poor performance and low
freight volumes by all three affected railway systems (ZRL, TAZARA, CEAR), with combined volumes
less than would be required for a viable operation on one system, the proposal is unlikely to produce a
viable core regional transport network (Nathan Associates, 2011).
6.96 Success of the connectivity strategy to Nacala would depend in part on improvements in
operation in Malawi. The rail in Malawi has never been particularly successful, because the distance
from Blantyre to Beira is much shorter and from Lilongwe the distance to both ports is about the same –
but also because Nacala port has a much lower throughput than Beira, despite its depth advantage, and as
a result fewer ship calls. Nacala is a small feeder port, with a total throughput in 2008 of 870,000 tons.
Though the port and railway were concessioned, traffic volumes on the railway system between Malawi
and Mozambique have remained in the 200,000 tons per annum range, not nearly enough for financial
sustainability, and not sufficient to justify significant new infrastructure investments. Further, the bridge
over the Shire River was washed away and not rebuilt for two years, thereby closing the Nacala Corridor
for traffic from central Malawi. By the time it was reopened, shippers had established alternative routes.
However, interest in the line has been revived through the involvement of Vale which is mining coal in
the Moatize area of Mozambique and is keen to export coal from Northern Mozambique through Nacala
using part of the Nacala Corridor. At its peak around 20mtpa of coal will be exported over the Nacala
Corridor from Moatize. The flows could be transformational for transport operations and capacity along
the corridor, though the likely impact on general cargo is still unclear.
6.97 The priorities for Zambia under the APEI initiative should be the following:
Extending the automation of border management systems and eventually interconnecting with
systems of neighboring countries so as to minimize duplication of data capture, enhance integrity
and reduce border crossing costs;
Coordinating and co-planning infrastructure improvements especially on the Nacala Corridor
with Malawi and Mozambique; and
Implementing a functional and efficient regional transit bond guarantee system. Presently there
are several systems under development, each led by different countries or partners. Benefits will
be maximized if a regional system is developed.
12. RECOMMENDATIONS
6.98 The broad but strategic issues that impact on trade costs fall into two categories: those that
can be impacted by domestic policy reforms and regional ones that require coordination and
cooperation with regional partners. While Zambia is in a select group of landlocked countries that
have numerous options for access to the sea its trade costs are still much higher than other countries with
which it has to compete in international markets. The main broad issues and recommendations for action
are identified below.
137
Domestic Issues and Priorities
Define a clear and coherent logistics approach. Zambia has several agencies that contribute to
the national logistics system. These include the three main transport sector agencies (RDA,
RTSA, NRFA), those looking after railways, air transport, and customs as well as the private
sector which provides most of the services. Presently, each sub-sector is pursuing narrow sectoral
interests with minimal attempts to optimize overall system performance. It is recommended that
the authorities should mandate the existing trade facilitation committee to guide the development
of such a national logistics approach as a matter of priority. Given the numerous choices
available for international trade routes, it becomes imperative to have a strategy to assist with
prioritizing national and regional investments. Otherwise there is a risk of spreading resources too
thinly or overinvesting in capacity through numerous interventions. Having a clear strategy will
help also clarify the role that Zambia should play in regional supply chains and logistics
operations in general.
Encourage strategic participation in logistics services markets. The logistics services sector
is important to the economy for its ability to facilitate trade. Yet it is important also for its
potential to create jobs. However, for this to happen it is important to adopt policies that enhance
the performance of the sector in the face of regional competition. Actions that can be taken in
this regard include the development of warehousing and value addition in regional supply chains.
On the former, Zambia is in a similar situation to Uganda in East Africa. Uganda has leveraged
its central location in East Africa vis-a-vis South Sudan and Eastern DRC to develop a regional
warehousing capacity. While presently this activity is exploiting insecurity in the two other
countries, improvements in efficiency should make for a sustainable regional distribution sector.
On the latter, the World Bank (2010b) carried out an integrated value chain analysis for coffee,
cotton, and soybean farming, plus soybean and other food processing activities in Zambia,
Zimbabwe and Malawi. It was found that there were good prospects for Zambia to serve as a
value addition center for some selected supply chains, such as soybean. However for this to
happen it is important to (a) strengthen the value chains to support small- and medium-enterprises
and producers; (b) improve the conditions for private investments through business environment
and policy reforms; and (c) establish dedicated mechanisms for private-public dialogue. One of
the impediments to realizing these other objectives is poor performance of the regional logistics
system, especially delays at the border posts. The overriding message is that improvements in
trade facilitation and logistics are often in support of some other specific economic objectives.
The growth of some specific sectors can be facilitated by the development of specialized logistics
services. It is often the case that job creation is in the other sector rather than directly in the
logistics services sector.
Regional Issues and Priorities
Adopt a proactive approach to regional cooperation. In common with other landlocked
countries, regional cooperation is an imperative to improve trade facilitation and logistics
performance to regional and international markets. Several of the constraints to improving
logistics performance and lowering trade costs that Zambia faces derive from inefficient
interfaces with the systems of neighboring states. This is particularly the case with DRC to the
North, Angola to the west and Tanzania to the east. In all these cases there are various
impediments to the smooth movement of both goods and traffic through the border posts,
including NTBs and procedural hurdles. Routes to Malawi and the states to the south have some
constraints but these are not systematic but route specific. However, in all instances Zambia
should purse regional approaches complemented by bilateral mechanisms to engage with its
neighbors to resolve specific constraints. Co-production of infrastructure development is critical.
138
The close cooperation Zambia has had with Namibia and Zimbabwe over the three new bridges
across the Zambezi are examples worth replicating. There are, of course, difficulties where
infrastructure deep inside a neighboring country needs to be developed. In such instances
regional institutions such as SADC or COMESA should be fully exploited.
Share data for improved border management. Delays at border crossings have long been
identified as one of the largest non-tariff barriers to trade between Zambia and neighboring
countries. Contributing factors include inefficient paperwork and processes, lack of cross-border
information exchange between customs, and out-of-date or nonexistent transit and trade statistics.
The preferred solution in Zambia of establishing OSBPs is useful, but by no means adequate.
Improve cross-border access to transport infrastructure and markets. As noted above, there
is limited participation of the Zambian trucking fleet in regional transport markets. The reasons
are varied but include limited financing, high fuel costs (certainly in the past) and thin markets
which lead to empty running on at least one leg of an international trip. While access to NSC
markets is more open, the same is not the case with respect to the Tanzania and DRC markets in
particular. Zambia should engage the authorities in those countries to even the operating
environment and adopt non-discriminatory policies as provided for in regional protocols on
transport. Distortionary routing of international rail services has been addressed by the
cancellation of the RSZ concession. However, services could be improved in future by allowing
third party access rights to the railway network, once improved. It is also critical to improve
TAZARA services as that is the railway option that has good prospects for reducing trade costs
for Zambia.
6.99 Specific actions to improve Zambia’s trade facilitation and logistics environment to support and
growth and diversification of exports are identified in the Action Matrix.
139
CHAPTER 7: SERVICES RELATED TO MINING
1. INTRODUCTION
7.1 Zambia is Africa’s largest copper producer and the 7th largest in the world.107
The copper
mining sector has performed significantly well during the last decade. Export values increased from US$
474 million in 2000 to almost US$ 4 billion in 2008. Following the recent global economic downturn,
they fell to US$ 3.17 billion in 2009. By 2011 however exports had recovered to US$ 6.8 billion, thanks
to a combination of price recovery and new production, which brought total output to 668,000 tons.108
7.2 The positive performance of Zambia’s copper sector can be ascribed to exceptionally
favorable world copper prices, as well as the injection of new investment capital. World copper prices,
which averaged 2,223 US$/t in the 1990s, increased dramatically after 2003, peaking to 7,131 US$/t in
2007. After a short-lived decline in 2008, world prices recovered to an average of 7,538 US$/t in 2010,
8,823 US$/t in 2011, and 7,958 US$/t in 2012.109
7.3 Following Zambia’s privatization process in the late 1990s, the copper mining sector
received significant inflows of foreign direct investment. Zambia Consolidated Copper Mines
(ZCCM), majority-owned by the state (60.3 percent), with a minority share owned by Anglo-American
Corporation (27.3 percent), was dismantled and, between 1997 and 2001, all the mines but one were sold
to foreign investors. Transactions over Konkola Copper Mines, the largest mining assets, were concluded
in 2004. The multinational companies invested into plant rehabilitation, expansions and new copper
extraction and refining projects (Chamber of Mines, 2005). By December 2011, Zambia’s inward FDI
stock into the mining sector stood at US$ 7.8 billion (Bank of Zambia, 2012). The largest sources of FDI
stock were Australia (US$ 3.05 billion), Canada (US$ 2.05 billion), UK (US$ 1.47 billion, mostly
accounted for by Indian-based, UK-listed Vedanta), and China (US$ 852 million).
7.4 The expansion of the mining sector has created significant demand for goods and services.
These open up opportunities for local upstream industries which could contribute to GDP growth,
employment generation, skills development, technological sophistication, and entrepreneurship
development. Until recently, Zambia’s strategy towards upstream industries to the copper mining sector
has been weak. Since 2012 however, a private sector-driven initiative is trying to develop a coherent
approach to developing linkages to benefit local businesses.
7.5 Section II provides a definition of upstream linkages and identifies the category of linkages
covered in this report. This is followed by a background on Zambia’s local supply chain, and an outline of
local service providers and their response to the privatization process and the recent economic downturn.
Section IV presents recent findings on the performance of local service providers and the constraints to
their upgrading trajectory. Section V discusses the policy and regulatory framework for local service
providers. Section VI concludes.
107
2012 world copper output retrieved on 15/04/2013 from http://minerals.usgs.gov/minerals/pubs/commodity/copper/mcs-2013-
coppe.pdf 108 Zambia copper export data retrieved on 15/04/2013 from http://comtrade.un.org/db/ 109 IMF Primary Commodity Price Data, retrieved on 15/04/2013 from http://www.imf.org/external/np/res/commod/index.aspx
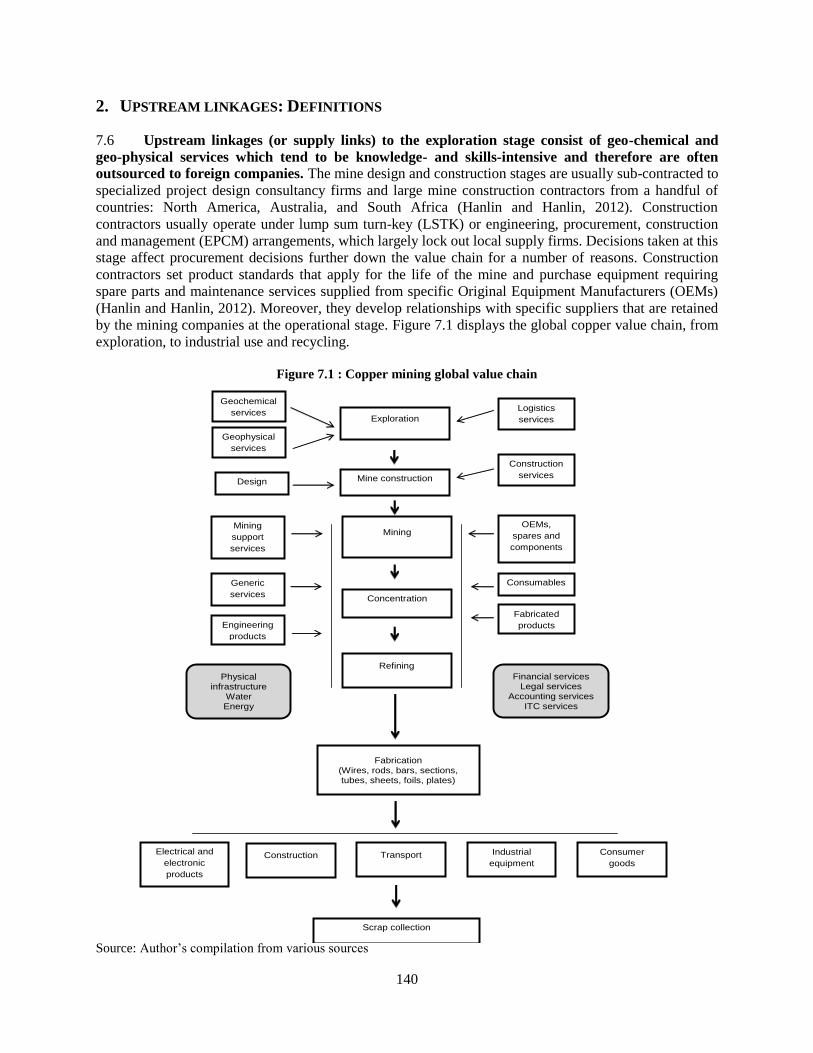
140
Design
Exploration
Concentration
Mining
Mine construction
Electrical and
electronic
products
Fabrication (Wires, rods, bars, sections, tubes, sheets, foils, plates)
Refining
Construction Transport Industrial
equipment
Consumer
goods
Geochemical
services
Geophysical
services
Logistics
services
Construction
services
Consumables
OEMs,
spares and
components
Generic
services
Mining
support
services
Fabricated
products
Financial services Legal services
Accounting services ITC services
Physical infrastructure
Water Energy
Scrap collection
Engineering
products
2. UPSTREAM LINKAGES: DEFINITIONS
7.6 Upstream linkages (or supply links) to the exploration stage consist of geo-chemical and
geo-physical services which tend to be knowledge- and skills-intensive and therefore are often
outsourced to foreign companies. The mine design and construction stages are usually sub-contracted to
specialized project design consultancy firms and large mine construction contractors from a handful of
countries: North America, Australia, and South Africa (Hanlin and Hanlin, 2012). Construction
contractors usually operate under lump sum turn-key (LSTK) or engineering, procurement, construction
and management (EPCM) arrangements, which largely lock out local supply firms. Decisions taken at this
stage affect procurement decisions further down the value chain for a number of reasons. Construction
contractors set product standards that apply for the life of the mine and purchase equipment requiring
spare parts and maintenance services supplied from specific Original Equipment Manufacturers (OEMs)
(Hanlin and Hanlin, 2012). Moreover, they develop relationships with specific suppliers that are retained
by the mining companies at the operational stage. Figure 7.1 displays the global copper value chain, from
exploration, to industrial use and recycling.
Figure 7.1 : Copper mining global value chain
Source: Author’s compilation from various sources
141
7.7 The operational stage of a mining project consists of core extraction, crushing,
concentration, smelting and refining. Upstream linkages to these operations usually open more
opportunities for local suppliers. One reason for this is that, as shown in Table 7. 1, upstream linkages
are highly heterogeneous in terms of value-added content, entry barriers, and market concentration. For
example, cleaning, catering, security services and general transport are generally low value-added content
services, which tend to be largely localized. Conversely, in Africa, the manufacturing, installation and
servicing of large equipment like smelters and shafts is controlled by a handful of specialized OEMs from
Australia and North America. The market structure for capital goods—such as drilling and haulage
equipment, excavators, handling equipment (conveyors, locomotives and scrapers), crushing and grinding
equipment—is less concentrated. These supply chains are controlled by OEMs from North America,
Europe and few other countries that rely on networks of local agents, subsidiaries, and sole distributors
for marketing, distribution, and after-sale services.
Table 7.1 : Categories of supplies required by the copper mining sector
Stage of the GVC
Type of suppliers
Open-pit mining Explosives, detonators, drilling equipment and parts, conveyors, haulage
and excavators and their parts, tires, consumables (fuel and lubricants),
services
Underground mining Explosives, detonators, drilling equipment and services, bulk materials
handling (conveyors, locomotives, scrapers, etc.), pumps and valves,
vehicles, head gear (motors, chains, cables), ventilation equipment,
services
Minerals processing Crushing and grinding equipment, storage tanks, chemicals and reagents,
liquid-solid separation equipment, materials handling (conveyors,
pumps)
Smelting Furnaces, dryers, refractories, tapping equipment
SX-EW Reagents, chemicals, lime, handling equipment, vessels
General supplies and services Personal protective equipment (PPE), health services, electrical
equipment, electrical and mechanical engineering services, security
services, catering, cleaning, administration, process control, civil
engineering services, fabrication products, construction material, rubber
products, transport, power, laboratory testing services, pneumatic and
hydraulic equipment and services
Source: Adapted from Ahmad and Walker, 2005
7.8 Finally, there is an intermediate category of supplies with skills-, knowledge- and
technological- content. This includes services such as electrical and mechanical engineering, process
control, civil engineering, transport, laboratory testing, and pneumatic and hydraulic equipment and
services. Manufacturing products in this category include fabrication products, construction material, and
rubber products. In some African countries, such as Nigeria and Ghana, local manufacturers have
successfully entered these supply chains (Morris et al., 2012).
7.9 In the short-to -medium term, the main opportunities for Zambian local supply firms to
participate in the mining value chain rest on goods and services characterized by intermediate
entry barriers in terms of skills, capital and technology. This chapter focuses on opportunities for local
service providers - these are particularly significant if the mining companies require supplier locational
proximity and local value-addition. In the longer term, however, Zambia’s linkage development strategy
should also aim at broadening and deepening its manufacturing linkages upstream and downstream the
copper mining sector.
142
3. BACKGROUND ON ZAMBIA’S LOCAL MINING SUPPLY CHAIN
Historical background
7.10 Copper mining in Zambia dates back to the early twentieth century. This, coupled with the
relatively peaceful past of the country, and specific industrialization strategies pursued in the 1970s and
1980s, has contributed to the development of a local supply cluster which is relatively well established
compared to neighboring countries.
7.11 In the context of the 1969 copper mines nationalization, upstream linkage development
became a key component of Zambia’s industrialization strategy (Fessehaie, 2012b). Linkage
development was pursued through a combination of direct state ownership of some large-scale supply
firms, preferential sourcing, import substitution industrialization and value chain cooperation between
ZCCM, its suppliers and public research and training institutions.
7.12 These policies resulted in the development of a manufacturing sector populated by large
state-owned entities, family-run businesses established by European and Indian migrants, and some
OEM subsidiaries, such as Chloride (batteries), Dunlop (tires) and Boart Longyear (drilling
equipment). These firms could tap into a skilled local workforce thanks to the extensive technical and
vocational education system and to programs sponsored by the mining sector.
7.13 Notwithstanding the high value-added content of the local supply industry, there were
significant competitiveness bottlenecks as a result of external and internal factors. After the mid-
1970s, Zambia’s copper sector came under increasing pressure from, on the one hand, plummeting world
copper prices, and on the other hand, limited re-investment by state-owned ZCCM into exploration, mine
development, and crucially, mines re-capitalization. Local suppliers operated in a difficult environment:
ZCCM’s supply chain management was poor, and its liquidity constraints caused heavy delays in vendor
payments. Economy-wide foreign exchange shortages curtailed the supply firms’ capacity to import parts
and inputs. Low levels of competition and weak R&D capabilities, among other factors, caused local
manufacturers to fall behind international standards in terms of quality, price and lead times. As a result,
suppliers often did not meet the required technical specifications; yet they were not excluded from the
supply chain, because ZCCM was mandated to procure locally and lacked the foreign exchange to import,
or due to collusive behaviors between mines’ procurement personnel and suppliers.
The impact of privatization and liberalization processes on local supply firms
7.14 The privatization process had a lasting yet not necessarily positive impact on the extent and
depth of Zambia’s upstream linkages to copper mining (Fessehaie, 2012b). The 1995 Mines and
Minerals Act set the legal framework for the mines privatization. Fiscal incentives and other provisions
were to be negotiated in bilateral Development Agreements between Zambia and the mining companies.
Although these bilateral agreements generally included provisions for the development of a local supply
base, the latter were not binding. In reality, government lacked the resources and political will to
implement these provisions (see Section V). From the mid-2000s onwards, Zambia’s National
Development Plan and other industrial policy and strategy documents put emphasis on private sector
development, but focused on export-oriented activities and copper mining development, thus excluding
the mining supplier industry.
7.15 At the sectoral level, the mining companies benefitted from tax exemption on capital
equipment imports, while at the macro-level, investment and trade liberalization opened the door to
the establishment of foreign-owned supply firms and to the import of goods and services. Mining
companies were no longer subject to restrictions with regard to their procurement strategies. On the
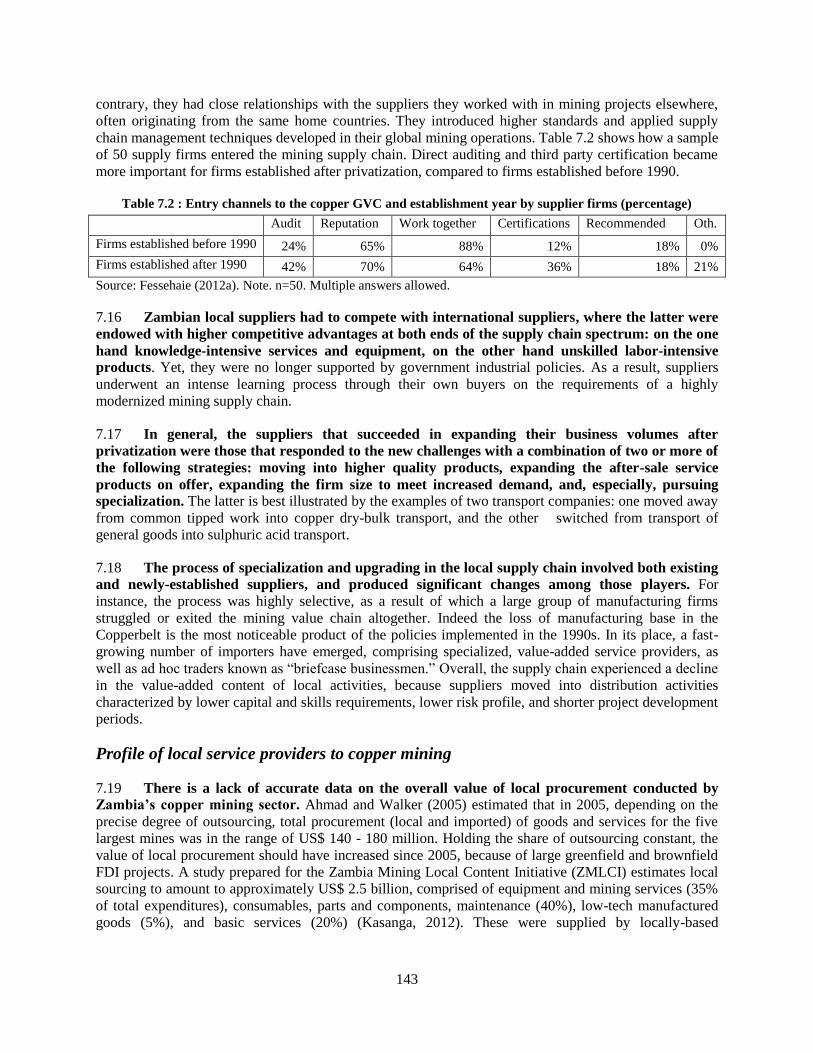
143
contrary, they had close relationships with the suppliers they worked with in mining projects elsewhere,
often originating from the same home countries. They introduced higher standards and applied supply
chain management techniques developed in their global mining operations. Table 7.2 shows how a sample
of 50 supply firms entered the mining supply chain. Direct auditing and third party certification became
more important for firms established after privatization, compared to firms established before 1990.
Table 7.2 : Entry channels to the copper GVC and establishment year by supplier firms (percentage)
Audit Reputation Work together Certifications Recommended Oth.
Firms established before 1990 24% 65% 88% 12% 18% 0%
Firms established after 1990 42% 70% 64% 36% 18% 21%
Source: Fessehaie (2012a). Note. n=50. Multiple answers allowed.
7.16 Zambian local suppliers had to compete with international suppliers, where the latter were
endowed with higher competitive advantages at both ends of the supply chain spectrum: on the one
hand knowledge-intensive services and equipment, on the other hand unskilled labor-intensive
products. Yet, they were no longer supported by government industrial policies. As a result, suppliers
underwent an intense learning process through their own buyers on the requirements of a highly
modernized mining supply chain.
7.17 In general, the suppliers that succeeded in expanding their business volumes after
privatization were those that responded to the new challenges with a combination of two or more of
the following strategies: moving into higher quality products, expanding the after-sale service
products on offer, expanding the firm size to meet increased demand, and, especially, pursuing
specialization. The latter is best illustrated by the examples of two transport companies: one moved away
from common tipped work into copper dry-bulk transport, and the other switched from transport of
general goods into sulphuric acid transport.
7.18 The process of specialization and upgrading in the local supply chain involved both existing
and newly-established suppliers, and produced significant changes among those players. For
instance, the process was highly selective, as a result of which a large group of manufacturing firms
struggled or exited the mining value chain altogether. Indeed the loss of manufacturing base in the
Copperbelt is the most noticeable product of the policies implemented in the 1990s. In its place, a fast-
growing number of importers have emerged, comprising specialized, value-added service providers, as
well as ad hoc traders known as “briefcase businessmen.” Overall, the supply chain experienced a decline
in the value-added content of local activities, because suppliers moved into distribution activities
characterized by lower capital and skills requirements, lower risk profile, and shorter project development
periods.
Profile of local service providers to copper mining
7.19 There is a lack of accurate data on the overall value of local procurement conducted by
Zambia’s copper mining sector. Ahmad and Walker (2005) estimated that in 2005, depending on the
precise degree of outsourcing, total procurement (local and imported) of goods and services for the five
largest mines was in the range of US$ 140 - 180 million. Holding the share of outsourcing constant, the
value of local procurement should have increased since 2005, because of large greenfield and brownfield
FDI projects. A study prepared for the Zambia Mining Local Content Initiative (ZMLCI) estimates local
sourcing to amount to approximately US$ 2.5 billion, comprised of equipment and mining services (35%
of total expenditures), consumables, parts and components, maintenance (40%), low-tech manufactured
goods (5%), and basic services (20%) (Kasanga, 2012). These were supplied by locally-based
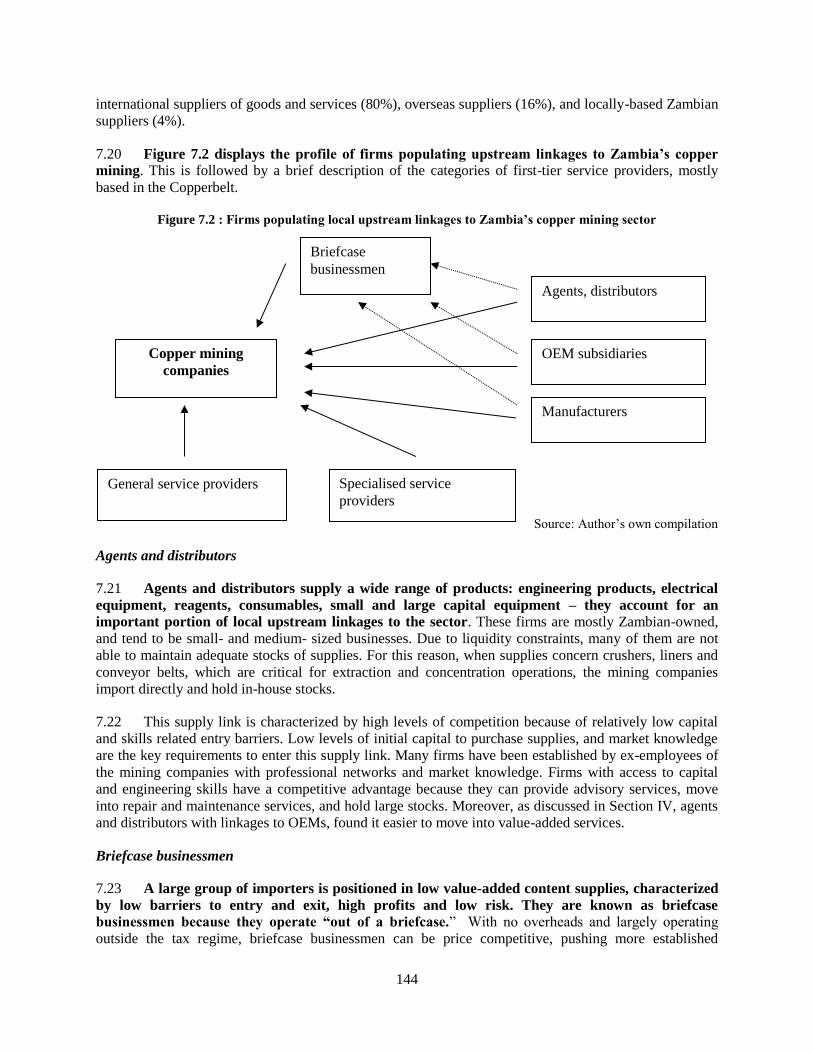
144
international suppliers of goods and services (80%), overseas suppliers (16%), and locally-based Zambian
suppliers (4%).
7.20 Figure 7.2 displays the profile of firms populating upstream linkages to Zambia’s copper
mining. This is followed by a brief description of the categories of first-tier service providers, mostly
based in the Copperbelt.
Figure 7.2 : Firms populating local upstream linkages to Zambia’s copper mining sector
Source: Author’s own compilation
Agents and distributors
7.21 Agents and distributors supply a wide range of products: engineering products, electrical
equipment, reagents, consumables, small and large capital equipment – they account for an
important portion of local upstream linkages to the sector. These firms are mostly Zambian-owned,
and tend to be small- and medium- sized businesses. Due to liquidity constraints, many of them are not
able to maintain adequate stocks of supplies. For this reason, when supplies concern crushers, liners and
conveyor belts, which are critical for extraction and concentration operations, the mining companies
import directly and hold in-house stocks.
7.22 This supply link is characterized by high levels of competition because of relatively low capital
and skills related entry barriers. Low levels of initial capital to purchase supplies, and market knowledge
are the key requirements to enter this supply link. Many firms have been established by ex-employees of
the mining companies with professional networks and market knowledge. Firms with access to capital
and engineering skills have a competitive advantage because they can provide advisory services, move
into repair and maintenance services, and hold large stocks. Moreover, as discussed in Section IV, agents
and distributors with linkages to OEMs, found it easier to move into value-added services.
Briefcase businessmen
7.23 A large group of importers is positioned in low value-added content supplies, characterized
by low barriers to entry and exit, high profits and low risk. They are known as briefcase
businessmen because they operate “out of a briefcase.” With no overheads and largely operating
outside the tax regime, briefcase businessmen can be price competitive, pushing more established
Copper mining
companies
Agents, distributors
OEM subsidiaries
Manufacturers
Specialised service
providers
Briefcase
businessmen
General service providers
145
suppliers out of the value chain. Often, though, lower operating costs are not passed onto the buyers in the
form of lower price, as they collude with mine personnel (cooperative bidding, corruption).
7.24 Briefcase businessmen either import from South Africa or procure goods from first-tier
suppliers in Zambia – they play quite a critical role along the supply chain. When briefcase
businessmen source from OEMs, power relations are skewed in favor of the OEMs, who can charge
market prices. On the contrary, briefcase businessmen hold considerable bargaining power versus local
manufacturers, because the latter are not protected by brands and face stiff competition. In this case,
briefcase businessmen can appropriate the largest share of the profit margins. Notwithstanding their
profitability, however, only a few briefcase businessmen specialized or upgraded into established
businesses. Their lack of technical expertise, facilities or capital often translates into poor delivery times,
and no advisory and after-sale services.
7.25 The Association for Mining Suppliers and Contractors of Zambia, which has primarily
represented the interests of briefcases businessmen vis-à-vis the Government and mining
companies, had around 400 to 500 members in 2009 (Fessehaie, 2012a). Other estimates however put
the total number between a few hundred and 5,000 individuals. Before 2008, briefcase businessmen
represented up to 80 percent of the vendors list of a few mining companies. The Association was
particularly effective in lobbying government and mining companies for opportunities in the mining
supply chain; and because of the copper price boom and high profit margins, the mining companies could
cushion these inefficiency costs. This changed with the global economic downturn, as mining companies
adopted cost-cutting strategies and attempted to reduce this category of suppliers in their vendor lists in
favor of more established ones.
Original Equipment Manufacturers subsidiaries
7.26 In general, the mining companies purchase capital equipment through local OEM
subsidiaries, recurring to direct imports when there are no local subsidiaries or agents. Indeed the
largest mining OEMs originate from Europe, US and South Africa (Atlas Copco, Barloworld for
Caterpillar equipment, Bell, Sandvik).After privatization, most OEMs relocated their manufacturing
activities in low-cost production countries, whilst consolidating and localizing after-sale services in
Zambia. Many OEMs established a direct presence in the Copperbelt, eliminating sole distributorship and
agency agreements with local firms. By doing this, they achieved two goals: first, to tighten control over
the quality of the goods and services provided, and second, to control revenue streams from highly
profitable after-sale services. OEMs enforce stringent warranty systems, which tie buyers to such after-
sale services (spares, maintenance and repair). This has had the effect of reducing competition from
independent service providers.
7.27 Most after-sale services are locally available, but when specific expertise is required,
technical personnel from the South African subsidiaries is flown into Zambia on a temporary basis. In particular, this is required for maintenance and repair of equipment with computerized components.
Specialized firms
7.28 The local supply chain includes a relatively small number of capital-intensive, specialized
firms involved, for example, in drilling and specialized transport. Local businesses struggle to enter
these supply links because of high capital requirements. There is a relatively higher presence of local
businesses in skill-intensive activities such as electrical and mechanical engineering services. However,
highly specialized services such as pneumatic and hydraulic equipment installation and servicing are
mostly imported.
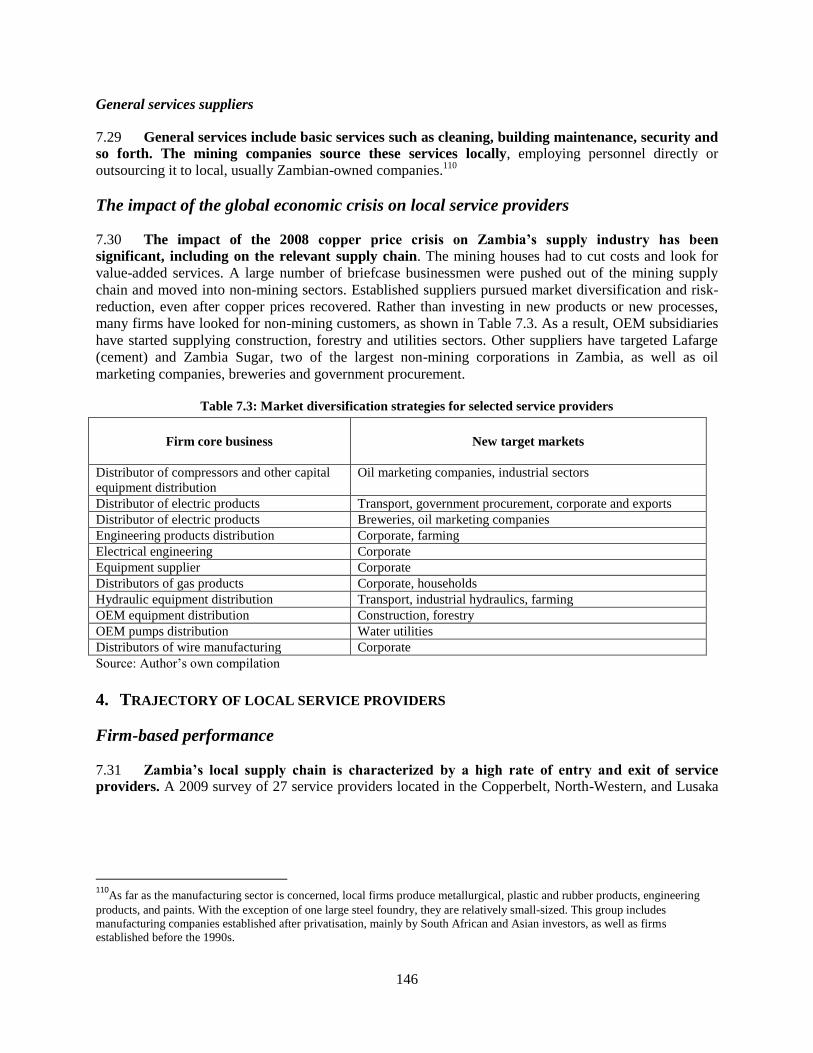
146
General services suppliers
7.29 General services include basic services such as cleaning, building maintenance, security and
so forth. The mining companies source these services locally, employing personnel directly or
outsourcing it to local, usually Zambian-owned companies.110
The impact of the global economic crisis on local service providers
7.30 The impact of the 2008 copper price crisis on Zambia’s supply industry has been
significant, including on the relevant supply chain. The mining houses had to cut costs and look for
value-added services. A large number of briefcase businessmen were pushed out of the mining supply
chain and moved into non-mining sectors. Established suppliers pursued market diversification and risk-
reduction, even after copper prices recovered. Rather than investing in new products or new processes,
many firms have looked for non-mining customers, as shown in Table 7.3. As a result, OEM subsidiaries
have started supplying construction, forestry and utilities sectors. Other suppliers have targeted Lafarge
(cement) and Zambia Sugar, two of the largest non-mining corporations in Zambia, as well as oil
marketing companies, breweries and government procurement.
Table 7.3: Market diversification strategies for selected service providers
Firm core business
New target markets
Distributor of compressors and other capital
equipment distribution
Oil marketing companies, industrial sectors
Distributor of electric products Transport, government procurement, corporate and exports
Distributor of electric products Breweries, oil marketing companies
Engineering products distribution Corporate, farming
Electrical engineering Corporate
Equipment supplier Corporate
Distributors of gas products Corporate, households
Hydraulic equipment distribution Transport, industrial hydraulics, farming
OEM equipment distribution Construction, forestry
OEM pumps distribution Water utilities
Distributors of wire manufacturing Corporate
Source: Author’s own compilation
4. TRAJECTORY OF LOCAL SERVICE PROVIDERS
Firm-based performance
7.31 Zambia’s local supply chain is characterized by a high rate of entry and exit of service
providers. A 2009 survey of 27 service providers located in the Copperbelt, North-Western, and Lusaka
110
As far as the manufacturing sector is concerned, local firms produce metallurgical, plastic and rubber products, engineering
products, and paints. With the exception of one large steel foundry, they are relatively small-sized. This group includes
manufacturing companies established after privatisation, mainly by South African and Asian investors, as well as firms
established before the 1990s.
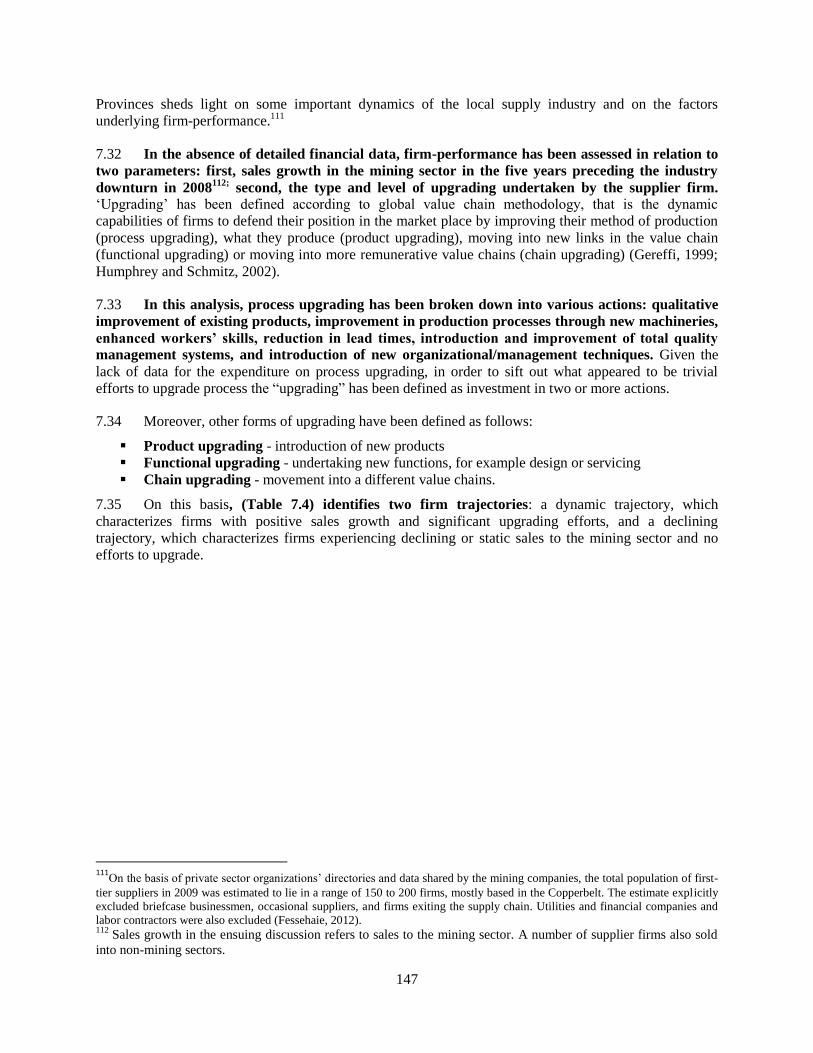
147
Provinces sheds light on some important dynamics of the local supply industry and on the factors
underlying firm-performance.111
7.32 In the absence of detailed financial data, firm-performance has been assessed in relation to
two parameters: first, sales growth in the mining sector in the five years preceding the industry
downturn in 2008112;
second, the type and level of upgrading undertaken by the supplier firm. ‘Upgrading’ has been defined according to global value chain methodology, that is the dynamic
capabilities of firms to defend their position in the market place by improving their method of production
(process upgrading), what they produce (product upgrading), moving into new links in the value chain
(functional upgrading) or moving into more remunerative value chains (chain upgrading) (Gereffi, 1999;
Humphrey and Schmitz, 2002).
7.33 In this analysis, process upgrading has been broken down into various actions: qualitative
improvement of existing products, improvement in production processes through new machineries,
enhanced workers’ skills, reduction in lead times, introduction and improvement of total quality
management systems, and introduction of new organizational/management techniques. Given the
lack of data for the expenditure on process upgrading, in order to sift out what appeared to be trivial
efforts to upgrade process the “upgrading” has been defined as investment in two or more actions.
7.34 Moreover, other forms of upgrading have been defined as follows:
Product upgrading - introduction of new products
Functional upgrading - undertaking new functions, for example design or servicing
Chain upgrading - movement into a different value chains.
7.35 On this basis, (Table 7.4) identifies two firm trajectories: a dynamic trajectory, which
characterizes firms with positive sales growth and significant upgrading efforts, and a declining
trajectory, which characterizes firms experiencing declining or static sales to the mining sector and no
efforts to upgrade.
111
On the basis of private sector organizations’ directories and data shared by the mining companies, the total population of first-
tier suppliers in 2009 was estimated to lie in a range of 150 to 200 firms, mostly based in the Copperbelt. The estimate explicitly
excluded briefcase businessmen, occasional suppliers, and firms exiting the supply chain. Utilities and financial companies and
labor contractors were also excluded (Fessehaie, 2012). 112
Sales growth in the ensuing discussion refers to sales to the mining sector. A number of supplier firms also sold
into non-mining sectors.
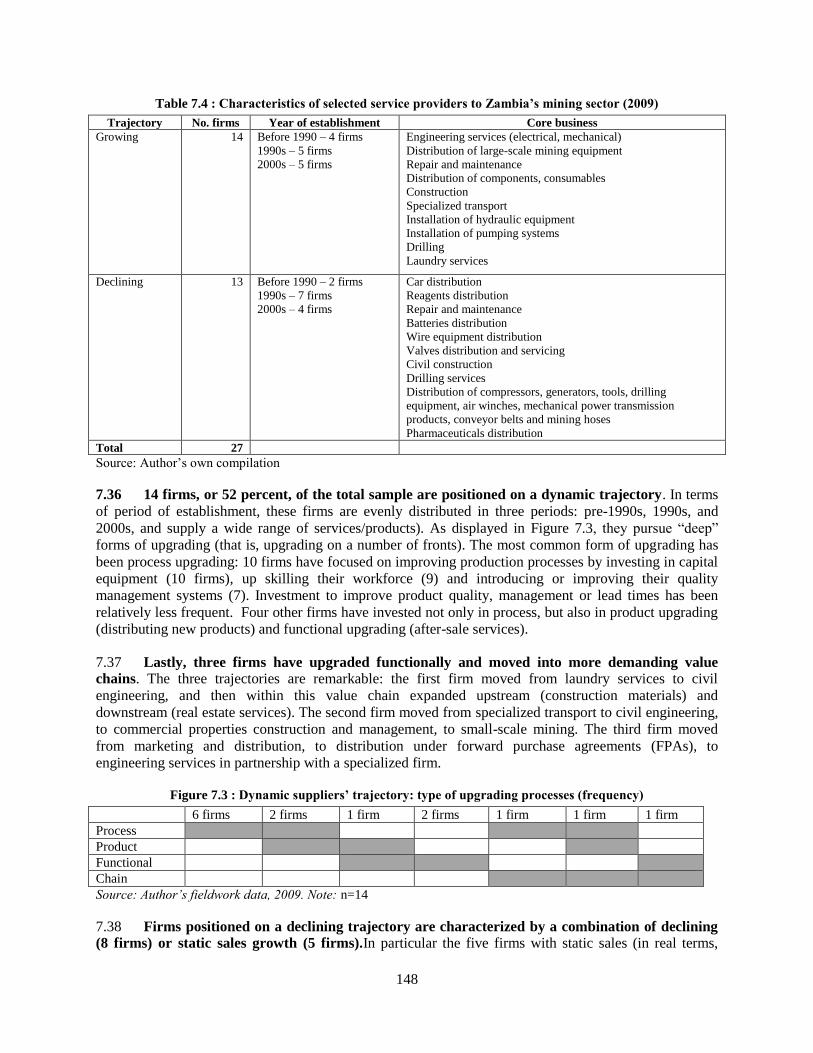
148
Table 7.4 : Characteristics of selected service providers to Zambia’s mining sector (2009)
Trajectory No. firms Year of establishment Core business
Growing 14 Before 1990 – 4 firms
1990s – 5 firms
2000s – 5 firms
Engineering services (electrical, mechanical)
Distribution of large-scale mining equipment
Repair and maintenance
Distribution of components, consumables
Construction
Specialized transport
Installation of hydraulic equipment
Installation of pumping systems
Drilling
Laundry services
Declining 13 Before 1990 – 2 firms
1990s – 7 firms
2000s – 4 firms
Car distribution
Reagents distribution
Repair and maintenance
Batteries distribution
Wire equipment distribution
Valves distribution and servicing
Civil construction
Drilling services
Distribution of compressors, generators, tools, drilling
equipment, air winches, mechanical power transmission
products, conveyor belts and mining hoses
Pharmaceuticals distribution
Total 27
Source: Author’s own compilation
7.36 14 firms, or 52 percent, of the total sample are positioned on a dynamic trajectory. In terms
of period of establishment, these firms are evenly distributed in three periods: pre-1990s, 1990s, and
2000s, and supply a wide range of services/products). As displayed in Figure 7.3, they pursue “deep”
forms of upgrading (that is, upgrading on a number of fronts). The most common form of upgrading has
been process upgrading: 10 firms have focused on improving production processes by investing in capital
equipment (10 firms), up skilling their workforce (9) and introducing or improving their quality
management systems (7). Investment to improve product quality, management or lead times has been
relatively less frequent. Four other firms have invested not only in process, but also in product upgrading
(distributing new products) and functional upgrading (after-sale services).
7.37 Lastly, three firms have upgraded functionally and moved into more demanding value
chains. The three trajectories are remarkable: the first firm moved from laundry services to civil
engineering, and then within this value chain expanded upstream (construction materials) and
downstream (real estate services). The second firm moved from specialized transport to civil engineering,
to commercial properties construction and management, to small-scale mining. The third firm moved
from marketing and distribution, to distribution under forward purchase agreements (FPAs), to
engineering services in partnership with a specialized firm.
Figure 7.3 : Dynamic suppliers’ trajectory: type of upgrading processes (frequency)
6 firms 2 firms 1 firm 2 firms 1 firm 1 firm 1 firm
Process
Product
Functional
Chain
Source: Author’s fieldwork data, 2009. Note: n=14
7.38 Firms positioned on a declining trajectory are characterized by a combination of declining
(8 firms) or static sales growth (5 firms).In particular the five firms with static sales (in real terms,
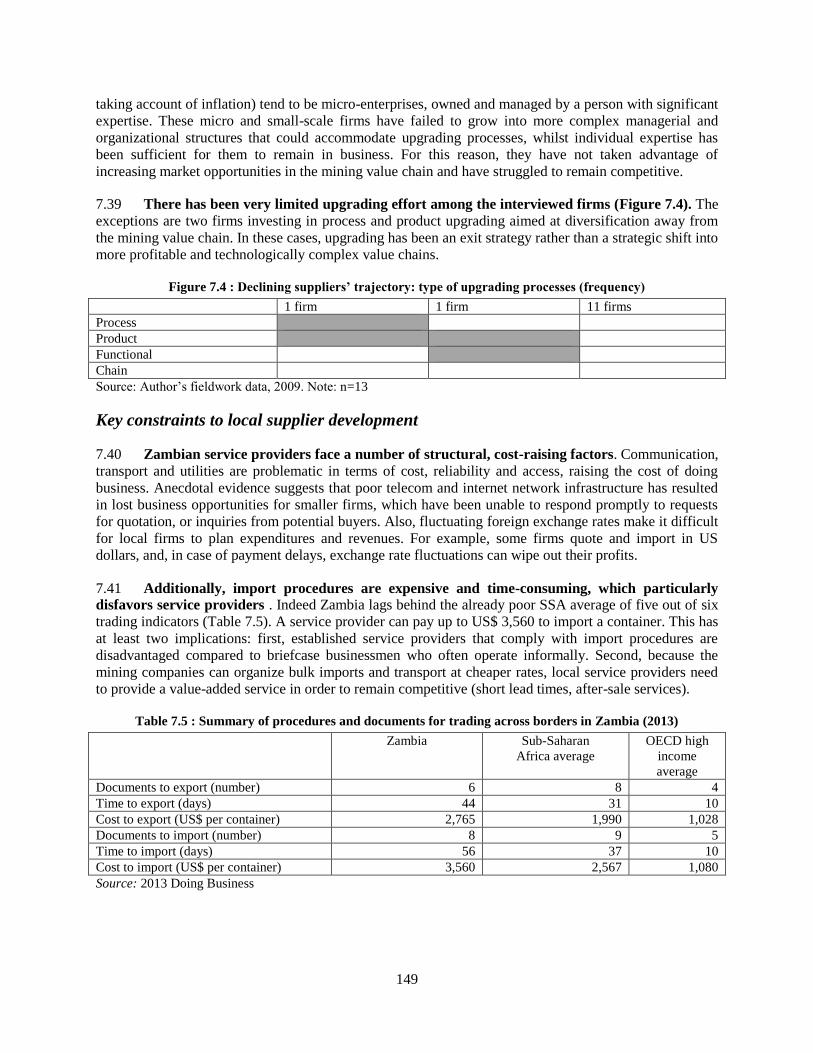
149
taking account of inflation) tend to be micro-enterprises, owned and managed by a person with significant
expertise. These micro and small-scale firms have failed to grow into more complex managerial and
organizational structures that could accommodate upgrading processes, whilst individual expertise has
been sufficient for them to remain in business. For this reason, they have not taken advantage of
increasing market opportunities in the mining value chain and have struggled to remain competitive.
7.39 There has been very limited upgrading effort among the interviewed firms (Figure 7.4). The
exceptions are two firms investing in process and product upgrading aimed at diversification away from
the mining value chain. In these cases, upgrading has been an exit strategy rather than a strategic shift into
more profitable and technologically complex value chains.
Figure 7.4 : Declining suppliers’ trajectory: type of upgrading processes (frequency)
1 firm 1 firm 11 firms
Process
Product
Functional
Chain
Source: Author’s fieldwork data, 2009. Note: n=13
Key constraints to local supplier development
7.40 Zambian service providers face a number of structural, cost-raising factors. Communication,
transport and utilities are problematic in terms of cost, reliability and access, raising the cost of doing
business. Anecdotal evidence suggests that poor telecom and internet network infrastructure has resulted
in lost business opportunities for smaller firms, which have been unable to respond promptly to requests
for quotation, or inquiries from potential buyers. Also, fluctuating foreign exchange rates make it difficult
for local firms to plan expenditures and revenues. For example, some firms quote and import in US
dollars, and, in case of payment delays, exchange rate fluctuations can wipe out their profits.
7.41 Additionally, import procedures are expensive and time-consuming, which particularly
disfavors service providers . Indeed Zambia lags behind the already poor SSA average of five out of six
trading indicators (Table 7.5). A service provider can pay up to US$ 3,560 to import a container. This has
at least two implications: first, established service providers that comply with import procedures are
disadvantaged compared to briefcase businessmen who often operate informally. Second, because the
mining companies can organize bulk imports and transport at cheaper rates, local service providers need
to provide a value-added service in order to remain competitive (short lead times, after-sale services).
Table 7.5 : Summary of procedures and documents for trading across borders in Zambia (2013)
Zambia Sub-Saharan
Africa average
OECD high
income
average
Documents to export (number) 6 8 4
Time to export (days) 44 31 10
Cost to export (US$ per container) 2,765 1,990 1,028
Documents to import (number) 8 9 5
Time to import (days) 56 37 10
Cost to import (US$ per container) 3,560 2,567 1,080
Source: 2013 Doing Business
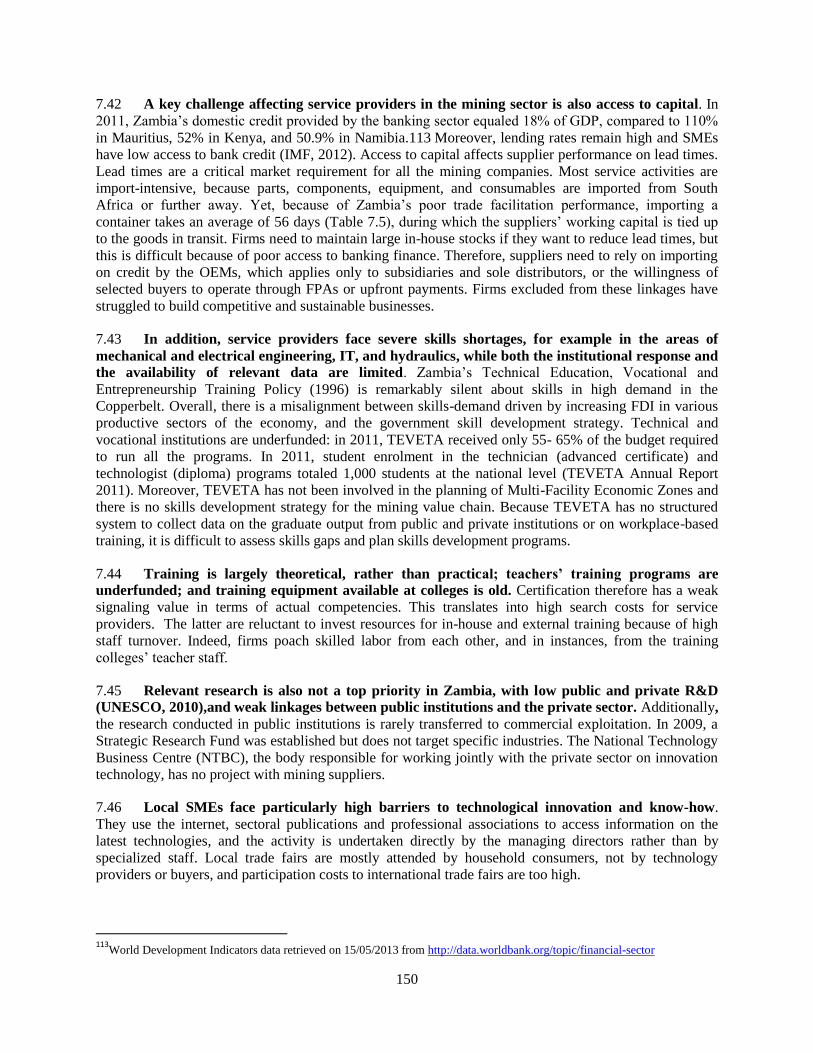
150
7.42 A key challenge affecting service providers in the mining sector is also access to capital. In
2011, Zambia’s domestic credit provided by the banking sector equaled 18% of GDP, compared to 110%
in Mauritius, 52% in Kenya, and 50.9% in Namibia.113 Moreover, lending rates remain high and SMEs
have low access to bank credit (IMF, 2012). Access to capital affects supplier performance on lead times.
Lead times are a critical market requirement for all the mining companies. Most service activities are
import-intensive, because parts, components, equipment, and consumables are imported from South
Africa or further away. Yet, because of Zambia’s poor trade facilitation performance, importing a
container takes an average of 56 days (Table 7.5), during which the suppliers’ working capital is tied up
to the goods in transit. Firms need to maintain large in-house stocks if they want to reduce lead times, but
this is difficult because of poor access to banking finance. Therefore, suppliers need to rely on importing
on credit by the OEMs, which applies only to subsidiaries and sole distributors, or the willingness of
selected buyers to operate through FPAs or upfront payments. Firms excluded from these linkages have
struggled to build competitive and sustainable businesses.
7.43 In addition, service providers face severe skills shortages, for example in the areas of
mechanical and electrical engineering, IT, and hydraulics, while both the institutional response and
the availability of relevant data are limited. Zambia’s Technical Education, Vocational and
Entrepreneurship Training Policy (1996) is remarkably silent about skills in high demand in the
Copperbelt. Overall, there is a misalignment between skills-demand driven by increasing FDI in various
productive sectors of the economy, and the government skill development strategy. Technical and
vocational institutions are underfunded: in 2011, TEVETA received only 55- 65% of the budget required
to run all the programs. In 2011, student enrolment in the technician (advanced certificate) and
technologist (diploma) programs totaled 1,000 students at the national level (TEVETA Annual Report
2011). Moreover, TEVETA has not been involved in the planning of Multi-Facility Economic Zones and
there is no skills development strategy for the mining value chain. Because TEVETA has no structured
system to collect data on the graduate output from public and private institutions or on workplace-based
training, it is difficult to assess skills gaps and plan skills development programs.
7.44 Training is largely theoretical, rather than practical; teachers’ training programs are
underfunded; and training equipment available at colleges is old. Certification therefore has a weak
signaling value in terms of actual competencies. This translates into high search costs for service
providers. The latter are reluctant to invest resources for in-house and external training because of high
staff turnover. Indeed, firms poach skilled labor from each other, and in instances, from the training
colleges’ teacher staff.
7.45 Relevant research is also not a top priority in Zambia, with low public and private R&D
(UNESCO, 2010),and weak linkages between public institutions and the private sector. Additionally,
the research conducted in public institutions is rarely transferred to commercial exploitation. In 2009, a
Strategic Research Fund was established but does not target specific industries. The National Technology
Business Centre (NTBC), the body responsible for working jointly with the private sector on innovation
technology, has no project with mining suppliers.
7.46 Local SMEs face particularly high barriers to technological innovation and know-how.
They use the internet, sectoral publications and professional associations to access information on the
latest technologies, and the activity is undertaken directly by the managing directors rather than by
specialized staff. Local trade fairs are mostly attended by household consumers, not by technology
providers or buyers, and participation costs to international trade fairs are too high.
113
World Development Indicators data retrieved on 15/05/2013 from http://data.worldbank.org/topic/financial-sector
151
7.47 One important, yet not adequately used avenue of technological acquisition is import of
capital equipment. Indeed capital investment by local service providers is low, and there is very little
technological adaptation of imported technologies. Investment in technologically advanced equipment is
curtailed by different factors: capital constraints, reluctance to invest due to stiff competition from low-
cost imports and flat or erratic demand from the mines. Moreover, firms are not willing to invest in
computerized equipment because of scarce local skills for its maintenance and repair.
7.48 The Copperbelt can be defined as a “shallow” cluster, because the network of specialized
second-tier suppliers is underdeveloped. As a result, service providers pursue vertical integration and
internalize many non-core activities, in particular maintenance and repair functions. For example, a
specialized transport company reported having invested in in-house maintenance, repairs, servicing,
engine and gearbox rebuilds.
Forward and backward linkages
7.49 Buyer-supplier relationships are important to support firm performance. The nature of these
relationships however varies significantly between mining companies.114
7.50 European, North American, Australian and South African mining companies follow highly
well-developed outsourcing strategies, informed by world class management. They focus on core
competence, reduce the size of supply networks to fewer, bigger suppliers, set highly detailed and
demanding standards for core suppliers, and intensively monitor supplier performance. They often rely on
historical suppliers, which make it difficult for new entrants to participate in their supply chains. These
mining companies demand value-added services: suppliers should be able to provide technical advice,
engage in joint problem solving, and devise innovations to reduce the buyers’ transaction and production
costs. Moreover, suppliers are expected to have minimum levels of quality, environmental and
occupational health and safety management systems in place. Following the 2008 price crisis and the
credit crunch, these mining houses put new projects on hold and adopted drastic cost-cutting strategies.
As a result, their supply chains have become increasingly price-driven.
7.51 European, North American, Australian and South African mining houses have also engaged
in various levels of buyer-supplier cooperation to upgrade local supplier capabilities. For example,
they directly assist suppliers through intense information sharing, upfront payments and transport
arrangements. Moreover, they are willing to operate through forward purchase agreements which provide
some level of certainty to local suppliers. Cooperation does not tackle areas such as joint product
development or technical upgrading. There are also forms of indirect cooperation, through third parties,
such as the IFC Supplier Development Program, or a partnership with Northern Technical College and
Solwezi Technical College to offer technical and vocational training.115
Courses include welding, heavy
equipment repair, mechanical and electrical engineering, and mineral processing operations.
114
The mining companies operating in Zambia vary significantly in terms of country of origin and ownership structure. China
Non-Ferrous Metals Corporation (CNMC) is one of China’s largest state-owned enterprises, under direct supervision of the State-
owned Assets Supervision and Administration Commission of the State Council (SASAC). In the 2000s, CNMC’s presence in
Zambia’s copper sector expanded with the acquisition of additional mines and investment in the Chambishi Zambia-China
Economic and Trade Cooperation Zone. Indian-based Vedanta Resources is listed on London stock exchange. Other large mining
companies originated from Australia, Europe, North America, and South Africa. All but one of these Western firms were listed
on the major stock exchanges, and two out of three were operating as JVs. 115
These are dual-based training systems, where students spend 5 months in a college (academic year), and 7 months in the work
place acquiring practical skills. The final assessment mark represents an aggregated performance of the student in college and the
work place.
152
7.52 It should be noted that mining companies are more interested in cooperation with local
suppliers when the services and goods are “critical,”116
or when locational proximity is required. In
these circumstances, the mining companies are more likely to support existing local suppliers and
facilitate their upgrading (see Box 8).
Box 8: Direct cooperation, low supplier capabilities and upgrading
A mining company situated in a remote geographical area has found it difficult to localize its supply chain because
supply firms are mainly located in Kitwe, Chingola and Ndola. This has created an incentive for the mining
company to assist the few existing local suppliers. In one particular case, the mining company entered into a long-
term relationship with the supplier, purchasing the equipment required and renting it out to the supplier. The supplier
specialized in laundry, a low-value, large-volume service which requires geographical proximity. A combination of
positive turnover and intense cooperation has allowed this firm to expand its market size and move into different
value chains – moving into skill-intensive services (civil engineering).
In another case, a Zambian-owned supply firm has played a valuable intermediary role between mining companies
and local coal producers. Mining companies imported from South Africa because Zambian coal producers are small-
scale and scattered. Importing ensures reliable supplies but is not cost-effective due to high transportation costs. The
supplier has incurred search and monitoring costs, and, through exclusive distributorship rights, is linking coal
producers to mining companies. The supply firm is positioned in a profitable niche market, and the mining
companies benefit because of lower transportation costs. Through a forward purchasing agreement with the mining
companies, the supply firm has been able to expand the range of products supplied and reduce delivery times,
supplying Just In Time results.
7.53 NFCA (China), and to a less extent KCM (India), are more vertically integrated than the
others mining houses. This has curtailed opportunities for some local service providers, such as
engineering services. Local and regional procurement by NFCA and KCM however is still significant in
value terms. Their supply chains open opportunities to local firms because of lower entry barriers and
lower brand loyalty compared to other mining companies. The KCM supply chain is primarily price-
driven, unlike NFCA which requires specific high-quality critical supplies. NFCA has an efficient vendor
payment system and operates with minimal red tape, which has a positive impact on local suppliers.
Nevertheless, cultural and language barriers can be problematic. KCM delayed vendor payments
following the 2008-2009 copper price crisis, which caused many of them to close down or operate at a
loss, and deteriorated relationships with local suppliers. In general, both NFCA and KCM have not
allocated resources for cooperating with suppliers, but have rather operated at arms’ length.
7.54 In this context, the type of firms that perform well in the supply chain to NFCA and KCM
are those which rely on another important source of competitiveness: backward linkages to parent
companies abroad. These are mining OEM subsidiaries and sole distributors for foreign manufacturers.
The parent companies provide them with incentives and resources (capital, knowledge, know-how) to
pursue product and process upgrading. In fact, all the firms with these types of backward linkages operate
on global standards.
7.55 Mining OEM subsidiaries have greatly benefited from the 1990s investment boom in the
mining sector. They are supported by parent companies through investment in workers’ up skilling
(including establishment of two training centers), “state of the art” capital equipment, and world class
quality control systems and internal management structures. Their contribution to job and skills creation
has been significant, with local subsidiaries employing hundreds of skilled workers.
116 Critical supplies are “supplies which, if not available, could cause production to stop.”
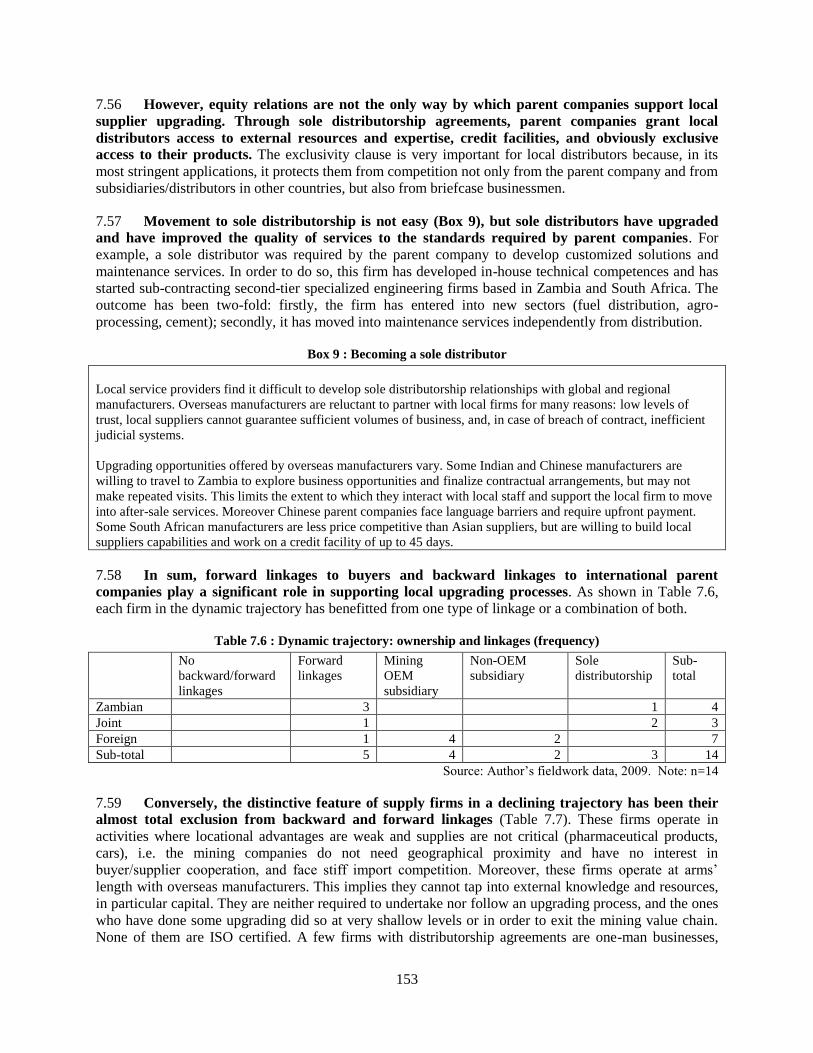
153
7.56 However, equity relations are not the only way by which parent companies support local
supplier upgrading. Through sole distributorship agreements, parent companies grant local
distributors access to external resources and expertise, credit facilities, and obviously exclusive
access to their products. The exclusivity clause is very important for local distributors because, in its
most stringent applications, it protects them from competition not only from the parent company and from
subsidiaries/distributors in other countries, but also from briefcase businessmen.
7.57 Movement to sole distributorship is not easy (Box 9), but sole distributors have upgraded
and have improved the quality of services to the standards required by parent companies. For
example, a sole distributor was required by the parent company to develop customized solutions and
maintenance services. In order to do so, this firm has developed in-house technical competences and has
started sub-contracting second-tier specialized engineering firms based in Zambia and South Africa. The
outcome has been two-fold: firstly, the firm has entered into new sectors (fuel distribution, agro-
processing, cement); secondly, it has moved into maintenance services independently from distribution.
Box 9 : Becoming a sole distributor
Local service providers find it difficult to develop sole distributorship relationships with global and regional
manufacturers. Overseas manufacturers are reluctant to partner with local firms for many reasons: low levels of
trust, local suppliers cannot guarantee sufficient volumes of business, and, in case of breach of contract, inefficient
judicial systems.
Upgrading opportunities offered by overseas manufacturers vary. Some Indian and Chinese manufacturers are
willing to travel to Zambia to explore business opportunities and finalize contractual arrangements, but may not
make repeated visits. This limits the extent to which they interact with local staff and support the local firm to move
into after-sale services. Moreover Chinese parent companies face language barriers and require upfront payment.
Some South African manufacturers are less price competitive than Asian suppliers, but are willing to build local
suppliers capabilities and work on a credit facility of up to 45 days.
7.58 In sum, forward linkages to buyers and backward linkages to international parent
companies play a significant role in supporting local upgrading processes. As shown in Table 7.6,
each firm in the dynamic trajectory has benefitted from one type of linkage or a combination of both.
Table 7.6 : Dynamic trajectory: ownership and linkages (frequency)
No
backward/forward
linkages
Forward
linkages
Mining
OEM
subsidiary
Non-OEM
subsidiary
Sole
distributorship
Sub-
total
Zambian 3 1 4
Joint 1 2 3
Foreign 1 4 2 7
Sub-total 5 4 2 3 14
Source: Author’s fieldwork data, 2009. Note: n=14
7.59 Conversely, the distinctive feature of supply firms in a declining trajectory has been their
almost total exclusion from backward and forward linkages (Table 7.7). These firms operate in
activities where locational advantages are weak and supplies are not critical (pharmaceutical products,
cars), i.e. the mining companies do not need geographical proximity and have no interest in
buyer/supplier cooperation, and face stiff import competition. Moreover, these firms operate at arms’
length with overseas manufacturers. This implies they cannot tap into external knowledge and resources,
in particular capital. They are neither required to undertake nor follow an upgrading process, and the ones
who have done some upgrading did so at very shallow levels or in order to exit the mining value chain.
None of them are ISO certified. A few firms with distributorship agreements are one-man businesses,
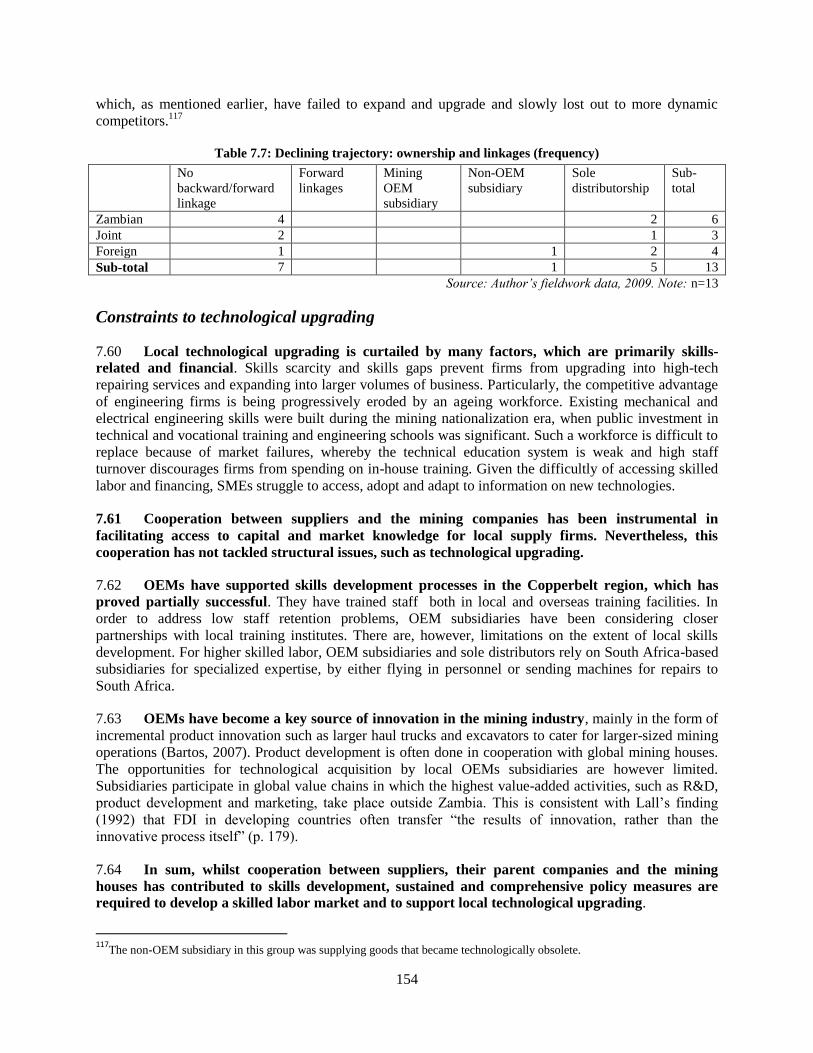
154
which, as mentioned earlier, have failed to expand and upgrade and slowly lost out to more dynamic
competitors.117
Table 7.7: Declining trajectory: ownership and linkages (frequency)
No
backward/forward
linkage
Forward
linkages
Mining
OEM
subsidiary
Non-OEM
subsidiary
Sole
distributorship
Sub-
total
Zambian 4 2 6
Joint 2 1 3
Foreign 1 1 2 4
Sub-total 7 1 5 13
Source: Author’s fieldwork data, 2009. Note: n=13
Constraints to technological upgrading
7.60 Local technological upgrading is curtailed by many factors, which are primarily skills-
related and financial. Skills scarcity and skills gaps prevent firms from upgrading into high-tech
repairing services and expanding into larger volumes of business. Particularly, the competitive advantage
of engineering firms is being progressively eroded by an ageing workforce. Existing mechanical and
electrical engineering skills were built during the mining nationalization era, when public investment in
technical and vocational training and engineering schools was significant. Such a workforce is difficult to
replace because of market failures, whereby the technical education system is weak and high staff
turnover discourages firms from spending on in-house training. Given the difficultly of accessing skilled
labor and financing, SMEs struggle to access, adopt and adapt to information on new technologies.
7.61 Cooperation between suppliers and the mining companies has been instrumental in
facilitating access to capital and market knowledge for local supply firms. Nevertheless, this
cooperation has not tackled structural issues, such as technological upgrading.
7.62 OEMs have supported skills development processes in the Copperbelt region, which has
proved partially successful. They have trained staff both in local and overseas training facilities. In
order to address low staff retention problems, OEM subsidiaries have been considering closer
partnerships with local training institutes. There are, however, limitations on the extent of local skills
development. For higher skilled labor, OEM subsidiaries and sole distributors rely on South Africa-based
subsidiaries for specialized expertise, by either flying in personnel or sending machines for repairs to
South Africa.
7.63 OEMs have become a key source of innovation in the mining industry, mainly in the form of
incremental product innovation such as larger haul trucks and excavators to cater for larger-sized mining
operations (Bartos, 2007). Product development is often done in cooperation with global mining houses.
The opportunities for technological acquisition by local OEMs subsidiaries are however limited.
Subsidiaries participate in global value chains in which the highest value-added activities, such as R&D,
product development and marketing, take place outside Zambia. This is consistent with Lall’s finding
(1992) that FDI in developing countries often transfer “the results of innovation, rather than the
innovative process itself” (p. 179).
7.64 In sum, whilst cooperation between suppliers, their parent companies and the mining
houses has contributed to skills development, sustained and comprehensive policy measures are
required to develop a skilled labor market and to support local technological upgrading.
117
The non-OEM subsidiary in this group was supplying goods that became technologically obsolete.
155
5. POLICY AND REGULATORY FRAMEWORK
Mining sector legislation with reference to local suppliers
7.65 The bilateral Development Agreements signed between 1997 and 2004 by Zambia and the
mining companies included provisions on local procurement.118
The mining companies were to grant
local firms an adequate opportunity to bid for tenders and had to ensure against unfair discrimination.
They also had to submit a local business development program. This was to be monitored by a cabinet-
appointed, inter-ministerial committee comprising the Ministry of Mines and Mineral Development and
the Ministry of Commerce, Trade and Industry.
7.66 For various reasons, however, the provisions of the Development Agreements on local
suppliers were largely disregarded by both the mining companies and government, with the
exception of the IFC Suppliers’ Development Program.119
The explanation was three-fold. First, the
years after privatization were focused on recapitalizing the mines. During the copper price boom, public
attention focused on revenue and mining labor issues (wages, safety). Second, the provisions for local
suppliers were not implemented because of the poor institutional capacity of the Ministries involved.
Neither was a comprehensive assessment of the supply chain conducted, nor were monitoring
mechanisms established or support programs designed. This was due to, among other reasons, high staff
turnover in the Ministries, lack of clear implementation and monitoring mechanisms, weak political
guidance and scarce financial resources.
7.67 Third, in the past, policy-makers have failed to see the opportunities for private sector
development inherent in upstream linkage development. The 2006 Fifth National Development Plan
(FNDP), which guided the policies of the Zambian Government at the time, noted that the copper mining
sector had not promoted broad-based economic growth. The underlying response of the FNDP was the
promotion of export-oriented, private sector growth. Since 2005, government also targeted measures to
cut the cost of doing business, through the Private Sector Development Reform Program. The 2007
Zambia Development Agency Act set a framework to promote investment, through a range of regulatory
simplifications and fiscal incentives, and established Multi-Facilities Economic Zones for selected
priority sub-sectors. Zambia adopted a sectoral approach to industrial policy, under the 2008 Commercial,
Trade and Industrial Policy.120
Industries upstream to copper mining, especially service providers, were
not included in these policy initiatives. In 2007, the IFC undertook a Suppliers’ Development Program.
This was a donor and private sector-funded program, with little ownership from government. Staff from
the relevant ministries attended only a few initial meetings. The project was implemented solely by the
mines’ supply managers, with guidance from their CEOs, and IFC staff.
7.68 The experience of the IFC Supplier Development Program shows that linkage programs
can deliver quick wins. The program has achieved positive results in improving firm capabilities in areas
such as business planning, cost management, marketing, product development, quality control, and in
diversifying their markets (Newton Lungu and Associates, 2010). However, there are important lessons
for future local supplier development programs. First, often the beneficiaries of the IFC Supplier
Development Program were not critical suppliers (paint, PPE, fabricated products). Targeting critical
118 Development Agreements between Government of the Republic of Zambia and NFC Africa (1998), Chibuluma Mines Plc
(1997), Konkola Copper Mines Plc. (2004), Mopani Copper Mines Plc. (2000), Cyprus Amax Kansanshi Plc (1997).
119The IFC Supplier Development Program ran from 2007 to 2010, with funding from the mining companies, the IFC and
Japanese International Cooperation Agency. The mining companies were Mopani Copper Mines, First Quantum Minerals Ltd,
Lumwana Mines, and Chambishi Metals (the latter left after the 2008 crisis). 120 The 2006 Citizens Economic Empowerment Act provided for measures to support Zambian-owned, “indigenous” enterprises.
One of the most significant measures was preferential government procurement policies.
156
suppliers could have resulted in additional interest by buyers to strengthen cooperation and continue
cooperating in future. Second, the IFC Supplier Development Program was driven by buyers and the IFC.
Future initiatives should have a cluster approach and find internal agents of change to drive the process
together with buyers. Suppliers should be able to act collectively to address structural or unforeseen
problems, and to set up programs that span beyond the three years of the IFC program. Third, the IFC
Supplier Development Program focused on manufacturers and included distributors only at the end of the
program. Service providers with high potential for upgrading, skills and job creation, should be included
in future initiatives. Last, the IFC Supplier Development Program could not deliver on improving access
to finance because local banking institutions did not cooperate (Newton Lungu and Associates, 2010).
Barrier to local financing remain a critical constraint to linkage development that needs to be addressed.
7.69 Briefcase businessmen have benefited from the lack of a coherent policy on upstream
linkage development. Political connections, and the pressure put on the mining companies to show some
level of local sourcing, enabled briefcase businessmen to gain access to mining procurement and capture a
rent. They had almost no overhead costs compared to established businesses (rent, labor, utilities) and did
not spend resources to add value to their products. At the same time, they often charged high prices
thanks to irregular procurement practices. Indeed, the primary interest of their business association has
been to maintain market access to mining procurement rather than to promote local upgrading.
7.70 The role played by briefcase businessmen in upstream linkage development is best
illustrated by the example of the proposed introduction, in 2007, of an electronic procurement
system by one of the largest mining companies. The electronic procurement system would have
outsourced data processing to a Dutch company, with requests for quotation sent automatically to
preferred suppliers. The association representing briefcase businessmen claimed that the new system
would have disadvantaged local suppliers compared to South African suppliers, and successfully lobbied
the government to intervene. The system was however open for registration to local suppliers, but would
have reduced the discretionary power of local procurement offices in awarding tenders. The mining
company’s consultations with stakeholders started too late in the process, which meant that suppliers in
favor of the new system were not given an opportunity to voice their support, yet a more transparent
procurement process would have improved market access for these established suppliers. A presidential
statement against the new procurement system put an end to the issue (Lusaka Times, 22.5.2007).
Ultimately, the presidential decision appeased a vocal constituency in the Copperbelt, preserving their
market access, but did little to promote a comprehensive approach to local supply chain development.
Following the 2008-2009 copper price crisis, the mining companies excluded briefcase businessmen from
their supply chains, and took the opportunity to re-organize their supply chains around established
suppliers.
7.71 The Development Agreements were unilaterally withdrawn by the 2008 Mines and Minerals
Development Act, which set new provisions on local supply firms. These best endeavor measures
dictate that, to the extent possible, the mining companies extend preferences to “materials and products
made in Zambia” and to “service agencies located in Zambia and owned by Zambia citizens or citizens
owned companies”.121
This approach tries to build mutual trust and collaboration between local suppliers
and the mining industry rather than setting compulsory regulations on local sourcing (Kasanga, 2012).
7.72 It is noteworthy that with regard to service providers, the Act focuses on firm ownership
rather than value-added content. The risk however is that, if this is not coupled with supplier
development programs, preferential procurement would encourage rent seeking behavior rather than
genuine upgrading processes. The experience of briefcase businessmen has shown that large expenditures
by the mining companies on local procurement through small-scale Zambian-owned importers do not
121
Section XIII of the Mines and Mineral Development Act (2008)
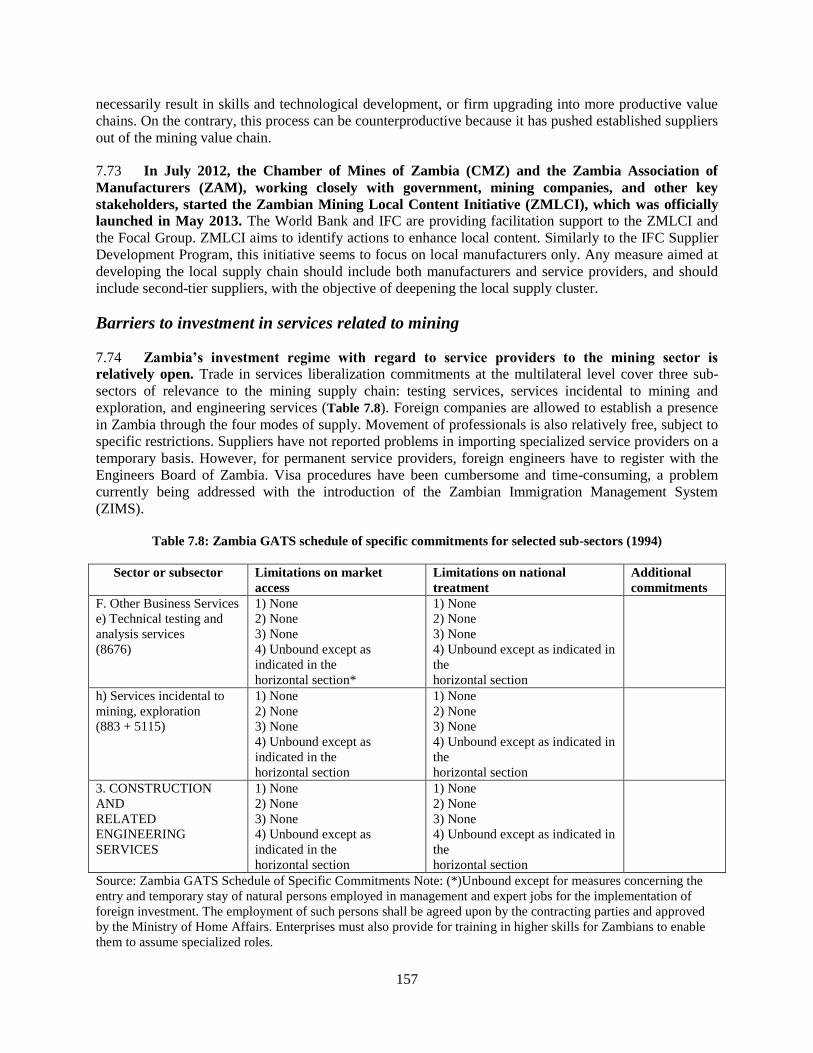
157
necessarily result in skills and technological development, or firm upgrading into more productive value
chains. On the contrary, this process can be counterproductive because it has pushed established suppliers
out of the mining value chain.
7.73 In July 2012, the Chamber of Mines of Zambia (CMZ) and the Zambia Association of
Manufacturers (ZAM), working closely with government, mining companies, and other key
stakeholders, started the Zambian Mining Local Content Initiative (ZMLCI), which was officially
launched in May 2013. The World Bank and IFC are providing facilitation support to the ZMLCI and
the Focal Group. ZMLCI aims to identify actions to enhance local content. Similarly to the IFC Supplier
Development Program, this initiative seems to focus on local manufacturers only. Any measure aimed at
developing the local supply chain should include both manufacturers and service providers, and should
include second-tier suppliers, with the objective of deepening the local supply cluster.
Barriers to investment in services related to mining
7.74 Zambia’s investment regime with regard to service providers to the mining sector is
relatively open. Trade in services liberalization commitments at the multilateral level cover three sub-
sectors of relevance to the mining supply chain: testing services, services incidental to mining and
exploration, and engineering services (Table 7.8). Foreign companies are allowed to establish a presence
in Zambia through the four modes of supply. Movement of professionals is also relatively free, subject to
specific restrictions. Suppliers have not reported problems in importing specialized service providers on a
temporary basis. However, for permanent service providers, foreign engineers have to register with the
Engineers Board of Zambia. Visa procedures have been cumbersome and time-consuming, a problem
currently being addressed with the introduction of the Zambian Immigration Management System
(ZIMS).
Table 7.8: Zambia GATS schedule of specific commitments for selected sub-sectors (1994)
Sector or subsector Limitations on market
access
Limitations on national
treatment
Additional
commitments
F. Other Business Services
e) Technical testing and
analysis services
(8676)
1) None
2) None
3) None
4) Unbound except as
indicated in the
horizontal section*
1) None
2) None
3) None
4) Unbound except as indicated in
the
horizontal section
h) Services incidental to
mining, exploration
(883 + 5115)
1) None
2) None
3) None
4) Unbound except as
indicated in the
horizontal section
1) None
2) None
3) None
4) Unbound except as indicated in
the
horizontal section
3. CONSTRUCTION
AND
RELATED
ENGINEERING
SERVICES
1) None
2) None
3) None
4) Unbound except as
indicated in the
horizontal section
1) None
2) None
3) None
4) Unbound except as indicated in
the
horizontal section
Source: Zambia GATS Schedule of Specific Commitments Note: (*)Unbound except for measures concerning the
entry and temporary stay of natural persons employed in management and expert jobs for the implementation of
foreign investment. The employment of such persons shall be agreed upon by the contracting parties and approved
by the Ministry of Home Affairs. Enterprises must also provide for training in higher skills for Zambians to enable
them to assume specialized roles.
158
7.75 Investments in services related to mining are also favored by other factors. Business
registration is straightforward thanks to substantial regulatory simplification and institutional
improvement at the Patents and Companies Registration Agency. Getting construction permits for
warehouses, however, is still a hurdle (2013 Cost of Doing Business). Moreover, Zambia has signed a
number of bilateral investment treaties and double taxation agreements. The multi-facility economic
zones provide fiscal incentives, and improved physical and administrative facilities. Chambishi Zambia-
China Economic and Trade Cooperation Zone (ZCCZ), a US$800million investment by the state-owned
China Non-Ferrous Metals Corporation, includes copper mining related activities and is likely to attract a
cluster of mining service providers, most probably from China.
Tax and payment regulations
7.76 With the Statutory Instrument (SI) 33 which became effective in May 2012, the Ministry of
Finance and National Planning has prohibited domestic transactions in foreign currency (quoting,
paying or demanding to be paid or receiving). There are concerns that this regulation creates incentives
for the mining companies to stipulate contractual arrangements in foreign currency with overseas supply
firms rather than procuring locally in domestic currency.
7.77 Under the 1995 Mines and Minerals Development Act, and later the 2008 Act, mining
companies benefit from VAT exemption and the elimination of custom and excise duties on capital
equipment. The tax regime only applies to the firms holding mining rights, which includes most the
mines, but not their suppliers. Therefore, local service providers have to pay customs duties ranging from
15 to 25 percent for some goods - unless these goods qualify for SADC FTA preferences - plus VAT on
all imports. The fiscal regime confers a cost penalty on local suppliers which should be urgently
redressed.
6. CONCLUSION AND POLICY RECOMMENDATIONS
7.78 Service providers to Zambia’s copper mining sector face severe competitiveness
bottlenecks, including high communication, transport and utilities costs, and fluctuating foreign
exchange rates. A key challenge is access to capital, which curtails local firms’ opportunities to invest in
upgrading and business expansion. Undersupply of technical skills, in terms of level and quality, emerged
as an important constraint to firms’ expansion, especially for small-scale, skills-intensive businesses. In
contrast, larger firms, such as OEM subsidiaries, have a very aggressive training policy, because they tap
into parent companies’ resources. Finally, access to new technologies, weak technology adoption and
adaptation capabilities are constraining local upgrading processes.
7.79 In this context, forward linkages to the mining companies and backward linkages to parent
companies have been instrumental in supporting local supplier upgrading processes. Nevertheless,
these forms of buyer/supplier cooperation have been very selective and have not tackled structural
problems. A more structured intervention is needed in order to develop an internationally competitive
supply cluster, where a broad range of value-added goods and services can be efficiently procured locally.
Zambia’s government and private sector should design and implement a comprehensive strategy to build
the competitiveness of the existing supply cluster in the Copperbelt and to facilitate supplier entry into
new mining areas such as Solwezi.
7.80 The ultimate goal of developing a local supply chain has multiple dimensions. First,
Zambia’s government and mining stakeholders should aim at increasing local value-added content,
by increasing the technological, skills and capital intensity of their activities, and by facilitating
their upgrading processes. It is very important that this goal is not confused with the goal of simply
159
increasing turnover for Zambian-owned businesses. Increasing the degree of local value addition can kick
start a process of knowledge intensification, industrialization and employment generation.
7.81 Second, Zambia’s government and mining stakeholders should aim to expand the number
of new entrants participating in the mining supply chain. This will increase the range of services
provided locally, and promote competition. Such an objective should be coupled with efforts to facilitate
suppliers’ specialization. There is a misalignment between the mining companies demand for specialized
local suppliers, and the suppliers’ offer of a broad range of services with little value addition. A better
understanding of the market requirements by suppliers is critical.
7.82 Third, Zambia’s government and mining stakeholders should aim to expand market
opportunities for existing service providers. These market opportunities consist of expanding sales to
current customers, selling to other mining and non-mining companies, and expanding into regional
markets. The expansion of the DRC mining sector opens significant opportunities for Zambian suppliers
to reach the economies of scale they lacked so far. Indeed, Zambian-based OEMs subsidiaries and a
number of sole distributors already supply DRC mining buyers, either directly or through DRC-based
firms.
7.83 Developing the competitiveness of Zambia’s local service providers would reduce operation costs
for the mining companies through several channels:
a) Lower procurement costs
7.84 Price reduction and quality improvement would reduce procurement costs for the mining
companies both directly (unit price reductions) and indirectly (better quality and after-sale services
reduce total cost management).
b) Higher outsourcing
7.85 Lead time reduction by local service providers would enable the mining companies to
outsource more non-core activities, such as stockholding or engineering services. The mining
companies would free working capital from activities outside their core business for which they would
rely on more efficient, specialized suppliers.
c) Improved knowledge flows
7.86 Service providers with know-how, expertise and technical knowledge are in a good position
to assist the mining companies to find the most suitable solutions for their operations and in
problem solving. It is important to note that solutions are highly mine-specific, because the technical
requirements of the mines vary greatly from deposit to deposit. For this reason, the price premium
attached to local expertise can be significant.
7.87 In order to achieve the above stated goals, there are three top policy priorities for Zambia’s
mining sector stakeholders. These are: establishment of an effective institutional mechanism, inclusive
of all stakeholders, to design and deliver a local content initiative; removal of regulatory barriers; and
skills development for labor and management.
1) Establishment of an effective stakeholders’ partnership
7.88 Zambia’s government and private sector need to partner and to set up an effective
institutional framework. The resulting stakeholders’ alliance should be responsible for the design and
implementation of a local content strategy, with measurable activities, outputs, milestones, and evaluation
160
mechanisms. The stakeholders’ alliance should be inclusive of mining suppliers, mining companies,
government institutions, and other relevant institutions. Each group of stakeholders is discussed below.
7.89 Suppliers: In order to become an effective cluster, suppliers have to work collectively to
identify, design and implement priority interventions. This will enable them to achieve collective
efficiencies, economies of scale and scope, and build social capital and learning networks. Supply
firms in the Copperbelt province are geographically agglomerated, but, so far, horizontal cooperation
between them has been weak: knowledge sharing and joint actions (such as joint bids or joint bulk
purchases) are scarce, and the cluster is largely populated by non-specialized suppliers with few linkages
to second-tier suppliers. Cooperation through the Kitwe Chamber of Commerce and Industry has not dealt
with structural issues affecting suppliers’ competitiveness.
7.90 Mining companies: The mining companies CEOs should be actively involved in the design
and implementation of any local content strategy. First, they would need to be committed to the
goal of increasing local procurement. The empirical evidence suggests that buyer/supplier cooperation
is critical to stimulate local supplier upgrading processes. However, Chinese and Indian mining firms,
which have become important players in Zambia’s mining sector, have been less inclined to cooperate
with suppliers, either indirectly (IFC Supplier Development Program), or directly. Their involvement in a
stakeholders’ alliance would signal a commitment to improve local supplier capabilities and increase
local content. The other mining companies have shown willingness to be involved in such initiatives, but
through this stakeholders’ body they would commit to a longer term, more comprehensive strategy than
in the past.
7.91 Second, there is a misalignment between suppliers and buyers’ views on the market
parameters driving the mining companies’ procurement decisions. For example, they have different
perceptions on the importance of price, quality or local value-added content. Government departments
lack the market knowledge to design actions that meet the requirements of the mining supply chain. The
mining companies’ participation will help bridge this information gap. It will ensure that the strategies are
well informed, designed to make local sourcing economically and financially efficient for the buyers and,
ultimately, that the process is sustainable.
7.92 Last, the mining companies should be invited to share procurement data in a format that
facilitates the monitoring and evaluation process (for example data should be provided net of fuel,
electricity and contractors expenses, and disaggregating by services/goods and other useful categories).
7.93 Government: Zambia’s government needs be committed to this process at the high-
government or senior official level, allocate sufficient resources to every stage of this initiative and
provide public goods required to improve the mining cluster competitiveness. The Ministry of
Commerce, Trade and Industry should be the leading government institution and should facilitate
inter-ministerial coordination. The Ministry is better placed than other departments because it is
responsible for legislation impacting on industrial and commercial development and its staff is more
technically capable to deal with linkage development. Among other government institutions that should
be part of the stakeholders’ alliance are: the ministries responsible for finance, mines and mineral
development, education, technology and infrastructure, the Zambia Development Agency, National
Technology Business Centre and TEVETA.
7.94 Other stakeholders: a number of institutions should be involved in the design and
implementation stages of specific activities. These include the Zambia Bureau of Standards, the
Engineering Institution of Zambia, universities and technical institutes, business development service
providers, and international institutions such as the IFC.
161
7.95 The Zambia Mining Local Content Initiative provides the basis for this process, especially
given that it has received support at the highest political level. Participation however should be
broadened to a wider group of stakeholders and its programs need to tackle structural factors affecting
supplier development.
2) Review of laws and regulations affecting supplier development
7.96 The stakeholders’ alliance should review current legislation and regulations hampering
local supplier competitiveness, and formulate proposals to the Government to improve their design
or implementation. This constitutes a “low hanging fruit” in terms of resource requirements. One of the
priorities will be the review of the tax exemption regime for the mining sector. Stakeholders should
formulate proposals that, whilst ensuring that the mining companies are not negatively affected, would
remove the cost disadvantage faced by suppliers.
3) Skills development for labor and management
7.97 The importance of addressing the workforce skills gap is two-fold: first, access to a skilled
labor force would support suppliers’ efforts to upgrade into new functions and to expand their operations.
For example, distributors would have access to the skills required to move into after-sale services,
customized assembly and stock management; engineering firms could expand their capacity and invest in
computerized equipment. Second, skills development initiatives would tap into the employment
generation potential of the mining cluster because existing firms could employ more people, and foreign
firms could be incentivized to set up local firms.
7.98 The Ministry of Science, Technology and Vocational Training and TEVETA should
increase resources for training and vocational institutes and ensure that their curriculum matches
the market demand for specific skills. A few technical institutes in the Copperbelt are working with
suppliers and mining companies in developing curriculums, but this collaboration needs to be supported
with public resources and expanded to delivering training. In this regard, TEVETA is exploring potential
collaboration with Zambia Association of Manufacturers and the Chamber of Mines. This effort should be
supported politically and financially.
7.99 Additionally, skills gaps affecting the management of SMEs businesses need to be
addressed. The stakeholders’ alliance should work through business development service providers and
international organizations to strengthen SMEs’ operational and financial skills, and knowledge of world
class manufacturing and manufacturing excellence. This could be done on a cost-sharing basis between
firms and government/international organizations.
7.100 One particular aspect of SME’ operation management is becoming increasingly important:
quality management. Some mining companies require their suppliers to have internal quality
management systems in place. In the future, they will require such systems to be internationally certified.
The stakeholders’ alliance should devise a program to assist selected local suppliers to comply with these
requirements. ISO certification is costly and requires sophisticated internal firms capabilities. Some
dynamic firms are willing to work towards ISO certification because they expect this to be a future
market requirement. Their certification process should be financially supported, because costs are high
due to lack of accredited certification bodies. Other firms should be supported in establishing internal
quality control systems which could be a stepping stone for future international certification. Such
programs should be inclusive of second-tier suppliers.
162
There are other important policy recommendations, as follows:
4) Suppliers’ access to finance
7.101 Capital market imperfections, such as information asymmetry and lack of collateral,
constrain access to working and investment capital for smaller firms. Yet, access to capital is
critical for supplier upgrading and to expand operations to the new mining areas in Zambia and
the region, in particular the DRC. The IFC Supplier Development Program did not manage to tackle
this factor. The ministries responsible for industrial development and finance, in partnership with all
stakeholders, should establish a small- and medium-enterprise financing scheme.
5) Transparency in mining companies’ procurement
7.102 Transparent procurement procedures are critical to facilitate the entry of capable local
suppliers and to improve supply chain efficiency. An electronic procurement system could be a step in
this direction. In the past, misunderstandings and poor consultations between stakeholders over the
establishment of this system led to a failure of this project. This experience highlights the importance of
adequate consultations before and after implementing such procurement reforms.
Improved cooperation between the mining companies could also be effective in improving transparency,
for example by cooperating in black listing fraudulent suppliers.
6) Facilitating technological upgrading
7.103 Given Zambia’s early stage of development, technological innovation should be pursued by
supporting technology adoption and adaptation rather than high-value R&D. The Ministry of
Science, Technology and Vocational Training should work with the ministries responsible for finance and
industrial development to design firm-level incentives to invest in new equipment and training (for
example through matching grant programs), and by encouraging technology transfer agreements.
7) FDI promotion
7.104 In order to facilitate new entrants, specialization and linkages between parent companies
and local suppliers, government should continue promoting FDI and encourage technology transfer
and joint ventures. The investment regime is relatively open, but TNCs prefer to operate at arm’s length
rather than partner with local firms because of low knowledge and/or trust of local businesses, and weak
local capabilities (skills, finance, etc.). The Ministry of Commerce, Trade and Industry could take several
mitigating actions in this regard. Possible actions include, for the short term, promotion of business-to-
business events to facilitate linkages, and, for the long term, collaboration with the Ministry of Justice to
improve contract enforcement mechanisms.
8) Fostering regional integration
7.105 Regional integration can open market opportunities for Zambia’s local supply cluster.
Regional integration efforts should prioritize infrastructure development and trade facilitation – both are
indeed important to cut operational costs across the board for local firms, as well as to facilitate their
insertion in regional value chains. SADC, COMESA and the Tripartite (COMESA-EAC-SADC)
frameworks offer ideal platforms to raise investment in infrastructural projects and to harmonize export
and import procedures, custom transit and transport regulations.
163
7.106 Trade in goods negotiations with the DRC, which is not implementing the SADC FTA,
should aim at improving market access for local suppliers to the DRC mining value chain. These
negotiations should be accompanied by negotiations on trade facilitation and NTBs.
7.107 Trade in services negotiations within SADC and COMESA are important to bind
liberalization commitments, improve and harmonize domestic regulations of key service sectors—
such as telecommunication, financial and transport sectors—and facilitate the movement of natural
persons. By doing so, these negotiations would facilitate regional value chains and lower transaction and
operating costs for Zambian service providers. In parallel, Zambia should focus on enforcing current
regional frameworks on investment and competition.
7.108 The Accelerated Economic Integration among the five like-minded countries (Malawi,
Mauritius, Mozambique, Seychelles and Zambia) can play an important role in driving the regional
integration process. The market access interests of Zambian mining service providers into the five
countries is limited to Mozambique and, possibly Malawi, neighboring countries which are attracting
significant levels of investment into the mining sector. The five-country initiative however is important
for other two reasons. First, the initiative can contribute to the reduction of Zambia’s domestic costs of
doing business, for example by removing trading barriers (trade facilitation, NTBs) and improving
regulations and competition in critical infrastructural service sectors. Second, the initiative can have
demonstrative effects and encourage countries in which Zambia has direct market access interests to join.
164
CHAPTER 8: EDUCATION AND PROFESSIONAL SERVICES
1. UNLEASHING THE POTENTIAL OF SERVICES FOR ZAMBIA’S GROWTH AND EXPORT
DIVERSIFICATION – A CASE STUDY ON PROFESSIONAL SERVICES
8.1 This chapter presents a diagnostics regarding the level of development and the availability
of professional services and services providers in Zambia. These sectors, selected in consultation with
the government, are important for the country’s growth, skills generation and export diversification, and
are priority sectors in the COMESA and APEI services discussions. The analysis also identifies which
policies explain the underdevelopment of professional services in Zambia and the segmentation of these
markets in Sub-Saharan Africa. While the focus is on trade policies and domestic regulation, limiting the
analysis to those areas would only partially address the diagnosed problems. It is also important to
analyze the education challenges, in order to remedy the origin of the skills shortages and skills
mismatches in financial and professional services. Similarly, the general immigration restrictions have to
be analyzed to address the free movement of various professionals.
8.2 Particular attention is given to policy action at the regional level to illustrate how Zambia
can benefit from regional regulatory cooperation that can advance its domestic services reforms
and facilitate trade. For example, the report shows that the mutual recognition of qualifications and
licensing requirements in professional services can accelerate the development of these services in
Zambia and reduce the fragmentation of services markets in Africa. Concrete technical assistance
activities related to the implementation of this section’s recommendations could be pursued as part of the
on-going World Bank APEI project.
Professional services are important for Zambia’s growth
8.3 High value, knowledge-intensive services such as professional services contribute directly
and indirectly to economic growth, including by lowering transactions costs and by creating
spillovers of knowledge to other sectors. For example, engineering and IT services are knowledge-
intensive sectors essential to the productivity and sustainability of other economic activities, including the
oil sector. Civil engineering is critical for the development and maintenance of a country’s physical
infrastructure, while electrical engineering is important to the operation of public networks such as
utilities or commercial facilities and communication systems (Cattaneo et al., 2010). IT –based services
including application services (such as application development and maintenance, system integration, IT
infrastructure services, IT consulting), or IT engineering services (such as manufacturing engineering and
software product development) also have an important impact on productivity and growth (World Bank,
2011). Accountancy is critical for accountability, sound financial management, and good corporate
governance (Trolliet and Hegarty, 2003).
High demand for professional services in Zambia
8.4 Firms using accounting, architectural, engineering and legal services — whether externally
outsourced or provided in-house — have higher average labor productivity than firms without such
professional services linkages. A surprising finding of the business surveys undertaken in Zambia is the
relatively high level of demand reported by the surveyed firms. Demand for all examined professional
services sectors is already important and is expected to increase with economic growth in Zambia. For
example, the results of the user surveys suggest that about 90% of the surveyed firms use accounting
services, 70% of them use legal services and almost 50 % of the interviewed firms use engineering
services. By contrast, demand is less important in architectural services. In all cases, the usage of
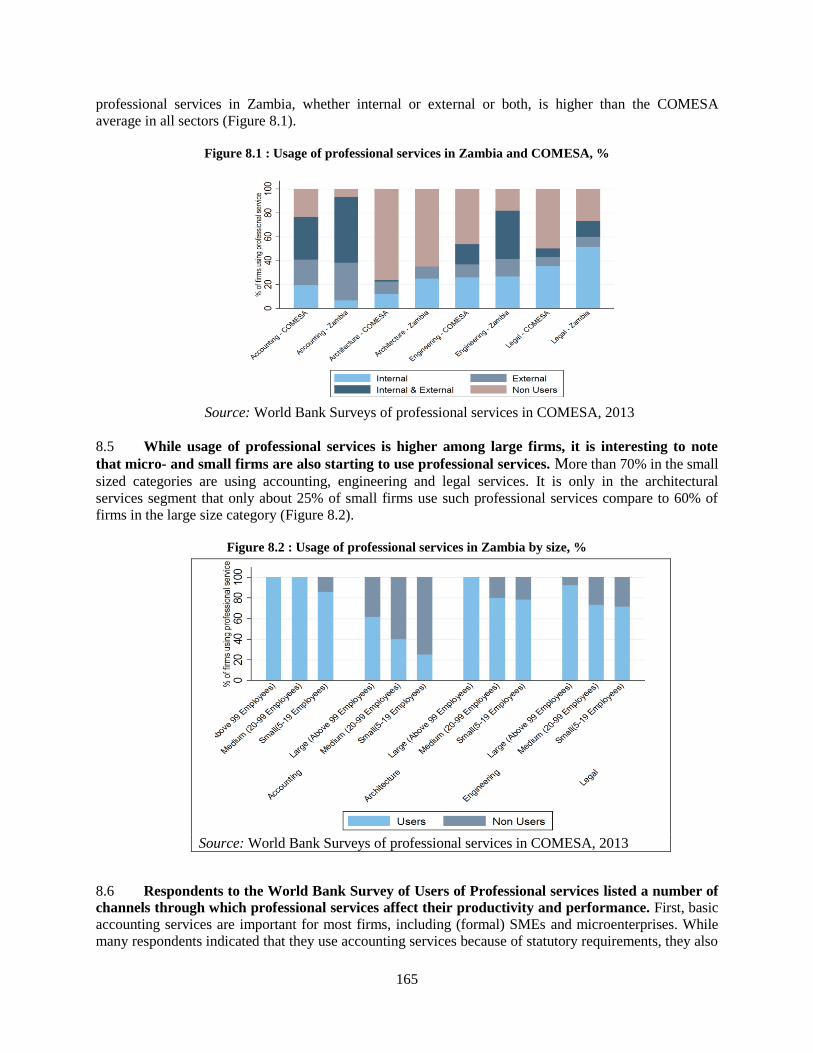
165
professional services in Zambia, whether internal or external or both, is higher than the COMESA
average in all sectors (Figure 8.1).
Figure 8.1 : Usage of professional services in Zambia and COMESA, %
Source: World Bank Surveys of professional services in COMESA, 2013
8.5 While usage of professional services is higher among large firms, it is interesting to note
that micro- and small firms are also starting to use professional services. More than 70% in the small
sized categories are using accounting, engineering and legal services. It is only in the architectural
services segment that only about 25% of small firms use such professional services compare to 60% of
firms in the large size category (Figure 8.2).
Figure 8.2 : Usage of professional services in Zambia by size, %
Source: World Bank Surveys of professional services in COMESA, 2013
8.6 Respondents to the World Bank Survey of Users of Professional services listed a number of
channels through which professional services affect their productivity and performance. First, basic
accounting services are important for most firms, including (formal) SMEs and microenterprises. While
many respondents indicated that they use accounting services because of statutory requirements, they also
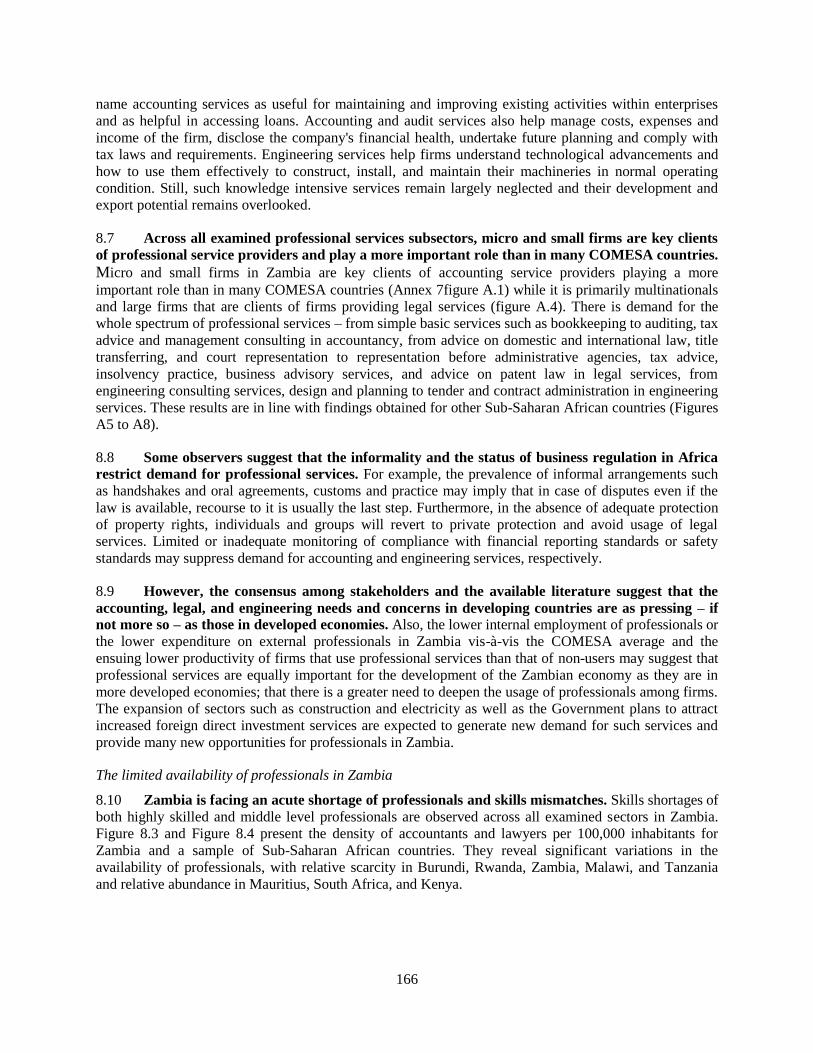
166
name accounting services as useful for maintaining and improving existing activities within enterprises
and as helpful in accessing loans. Accounting and audit services also help manage costs, expenses and
income of the firm, disclose the company's financial health, undertake future planning and comply with
tax laws and requirements. Engineering services help firms understand technological advancements and
how to use them effectively to construct, install, and maintain their machineries in normal operating
condition. Still, such knowledge intensive services remain largely neglected and their development and
export potential remains overlooked.
8.7 Across all examined professional services subsectors, micro and small firms are key clients
of professional service providers and play a more important role than in many COMESA countries. Micro and small firms in Zambia are key clients of accounting service providers playing a more
important role than in many COMESA countries (Annex 7figure A.1) while it is primarily multinationals
and large firms that are clients of firms providing legal services (figure A.4). There is demand for the
whole spectrum of professional services – from simple basic services such as bookkeeping to auditing, tax
advice and management consulting in accountancy, from advice on domestic and international law, title
transferring, and court representation to representation before administrative agencies, tax advice,
insolvency practice, business advisory services, and advice on patent law in legal services, from
engineering consulting services, design and planning to tender and contract administration in engineering
services. These results are in line with findings obtained for other Sub-Saharan African countries (Figures
A5 to A8).
8.8 Some observers suggest that the informality and the status of business regulation in Africa
restrict demand for professional services. For example, the prevalence of informal arrangements such
as handshakes and oral agreements, customs and practice may imply that in case of disputes even if the
law is available, recourse to it is usually the last step. Furthermore, in the absence of adequate protection
of property rights, individuals and groups will revert to private protection and avoid usage of legal
services. Limited or inadequate monitoring of compliance with financial reporting standards or safety
standards may suppress demand for accounting and engineering services, respectively.
8.9 However, the consensus among stakeholders and the available literature suggest that the
accounting, legal, and engineering needs and concerns in developing countries are as pressing – if
not more so – as those in developed economies. Also, the lower internal employment of professionals or
the lower expenditure on external professionals in Zambia vis-à-vis the COMESA average and the
ensuing lower productivity of firms that use professional services than that of non-users may suggest that
professional services are equally important for the development of the Zambian economy as they are in
more developed economies; that there is a greater need to deepen the usage of professionals among firms.
The expansion of sectors such as construction and electricity as well as the Government plans to attract
increased foreign direct investment services are expected to generate new demand for such services and
provide many new opportunities for professionals in Zambia.
The limited availability of professionals in Zambia
8.10 Zambia is facing an acute shortage of professionals and skills mismatches. Skills shortages of
both highly skilled and middle level professionals are observed across all examined sectors in Zambia.
Figure 8.3 and Figure 8.4 present the density of accountants and lawyers per 100,000 inhabitants for
Zambia and a sample of Sub-Saharan African countries. They reveal significant variations in the
availability of professionals, with relative scarcity in Burundi, Rwanda, Zambia, Malawi, and Tanzania
and relative abundance in Mauritius, South Africa, and Kenya.
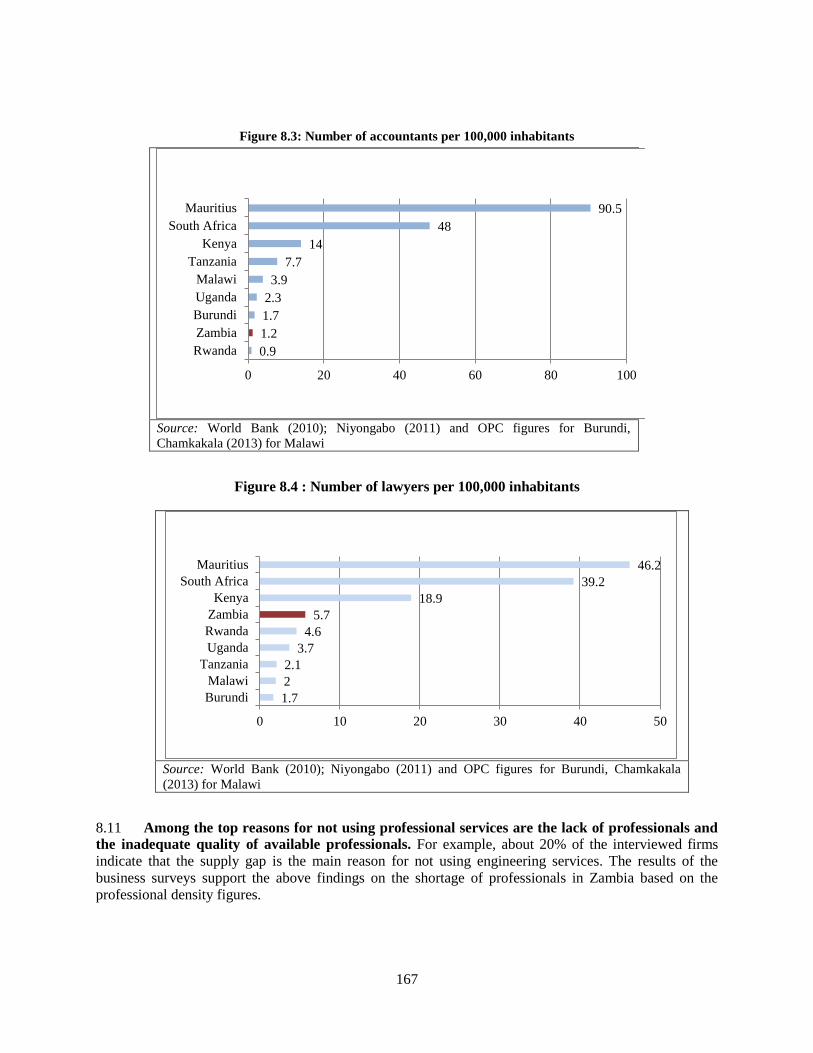
167
Figure 8.3: Number of accountants per 100,000 inhabitants
Source: World Bank (2010); Niyongabo (2011) and OPC figures for Burundi,
Chamkakala (2013) for Malawi
Figure 8.4 : Number of lawyers per 100,000 inhabitants
Source: World Bank (2010); Niyongabo (2011) and OPC figures for Burundi, Chamkakala
(2013) for Malawi
8.11 Among the top reasons for not using professional services are the lack of professionals and
the inadequate quality of available professionals. For example, about 20% of the interviewed firms
indicate that the supply gap is the main reason for not using engineering services. The results of the
business surveys support the above findings on the shortage of professionals in Zambia based on the
professional density figures.
0.9
1.2
1.7
2.3
3.9
7.7
14
48
90.5
0 20 40 60 80 100
Rwanda
Zambia
Burundi
Uganda
Malawi
Tanzania
Kenya
South Africa
Mauritius
1.7
2
2.1
3.7
4.6
5.7
18.9
39.2
46.2
0 10 20 30 40 50
Burundi
Malawi
Tanzania
Uganda
Rwanda
Zambia
Kenya
South Africa
Mauritius
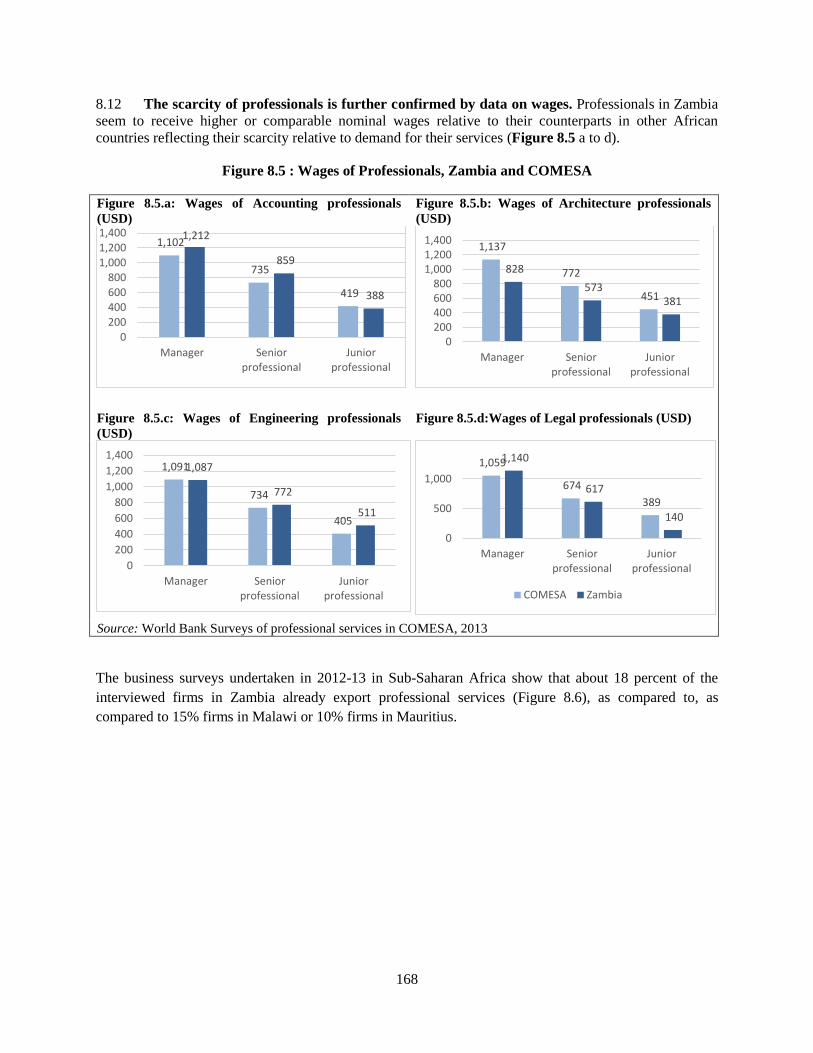
168
8.12 The scarcity of professionals is further confirmed by data on wages. Professionals in Zambia
seem to receive higher or comparable nominal wages relative to their counterparts in other African
countries reflecting their scarcity relative to demand for their services (Figure 8.5 a to d).
Figure 8.5 : Wages of Professionals, Zambia and COMESA
Figure 8.5.a: Wages of Accounting professionals
(USD)
Figure 8.5.b: Wages of Architecture professionals
(USD)
Figure 8.5.c: Wages of Engineering professionals
(USD)
Figure 8.5.d:Wages of Legal professionals (USD)
Source: World Bank Surveys of professional services in COMESA, 2013
The business surveys undertaken in 2012-13 in Sub-Saharan Africa show that about 18 percent of the
interviewed firms in Zambia already export professional services (Figure 8.6), as compared to, as
compared to 15% firms in Malawi or 10% firms in Mauritius.
1,102
735
419
1,212
859
388
0200400600800
1,0001,2001,400
Manager Seniorprofessional
Juniorprofessional
1,137
772
451
828
573 381
0200400600800
1,0001,2001,400
Manager Seniorprofessional
Juniorprofessional
1,091
734
405
1,087
772
511
0
200
400
600
800
1,000
1,200
1,400
Manager Seniorprofessional
Juniorprofessional
1,059
674
389
1,140
617
140
0
500
1,000
Manager Seniorprofessional
Juniorprofessional
COMESA Zambia
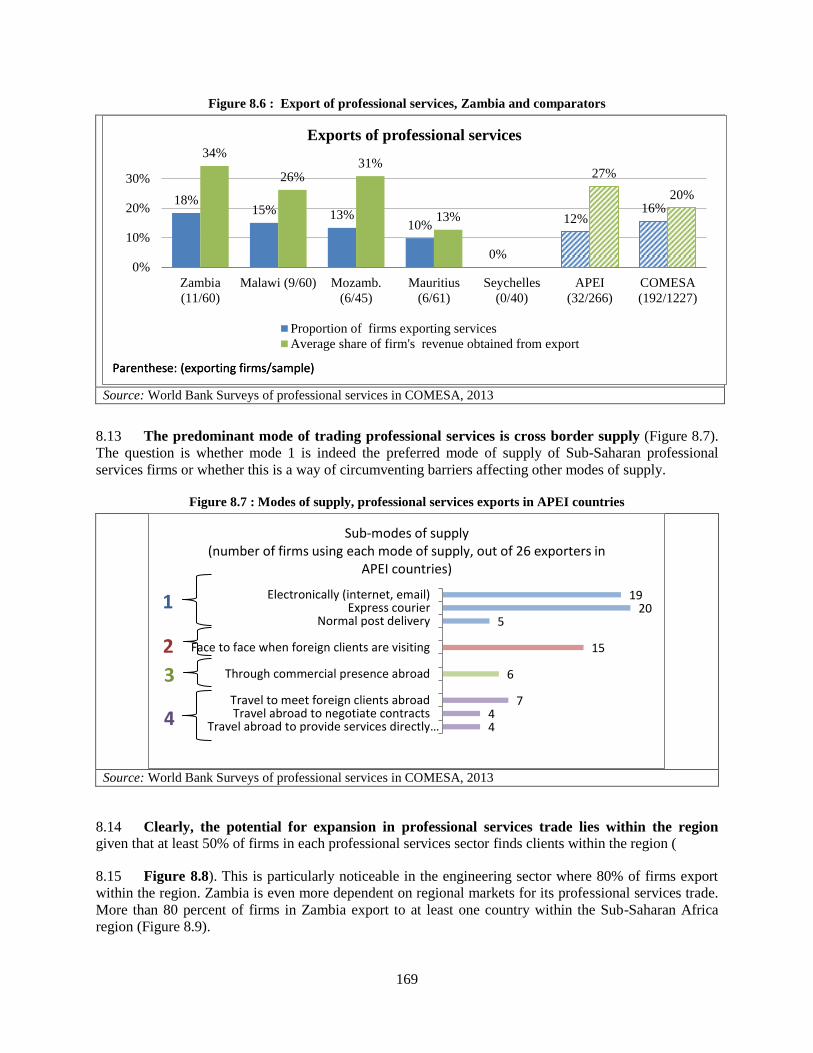
169
Figure 8.6 : Export of professional services, Zambia and comparators
Source: World Bank Surveys of professional services in COMESA, 2013
8.13 The predominant mode of trading professional services is cross border supply (Figure 8.7).
The question is whether mode 1 is indeed the preferred mode of supply of Sub-Saharan professional
services firms or whether this is a way of circumventing barriers affecting other modes of supply.
Figure 8.7 : Modes of supply, professional services exports in APEI countries
Source: World Bank Surveys of professional services in COMESA, 2013
8.14 Clearly, the potential for expansion in professional services trade lies within the region given that at least 50% of firms in each professional services sector finds clients within the region (
8.15 Figure 8.8). This is particularly noticeable in the engineering sector where 80% of firms export
within the region. Zambia is even more dependent on regional markets for its professional services trade.
More than 80 percent of firms in Zambia export to at least one country within the Sub-Saharan Africa
region (Figure 8.9).
18% 15% 13%
10%
0%
12% 16%
34%
26% 31%
13%
27%
20%
0%
10%
20%
30%
Zambia
(11/60)
Malawi (9/60) Mozamb.
(6/45)
Mauritius
(6/61)
Seychelles
(0/40)
APEI
(32/266)
COMESA
(192/1227)
Exports of professional services
Proportion of firms exporting services
Average share of firm's revenue obtained from export
Parenthese: (exporting firms/sample) Parenthese: (exporting firms/sample)
19 20
5
15
6
7 4 4
Electronically (internet, email)Express courier
Normal post delivery
Face to face when foreign clients are visiting
Through commercial presence abroad
Travel to meet foreign clients abroadTravel abroad to negotiate contracts
Travel abroad to provide services directly…
Sub-modes of supply (number of firms using each mode of supply, out of 26 exporters in
APEI countries)
1
2
3
4
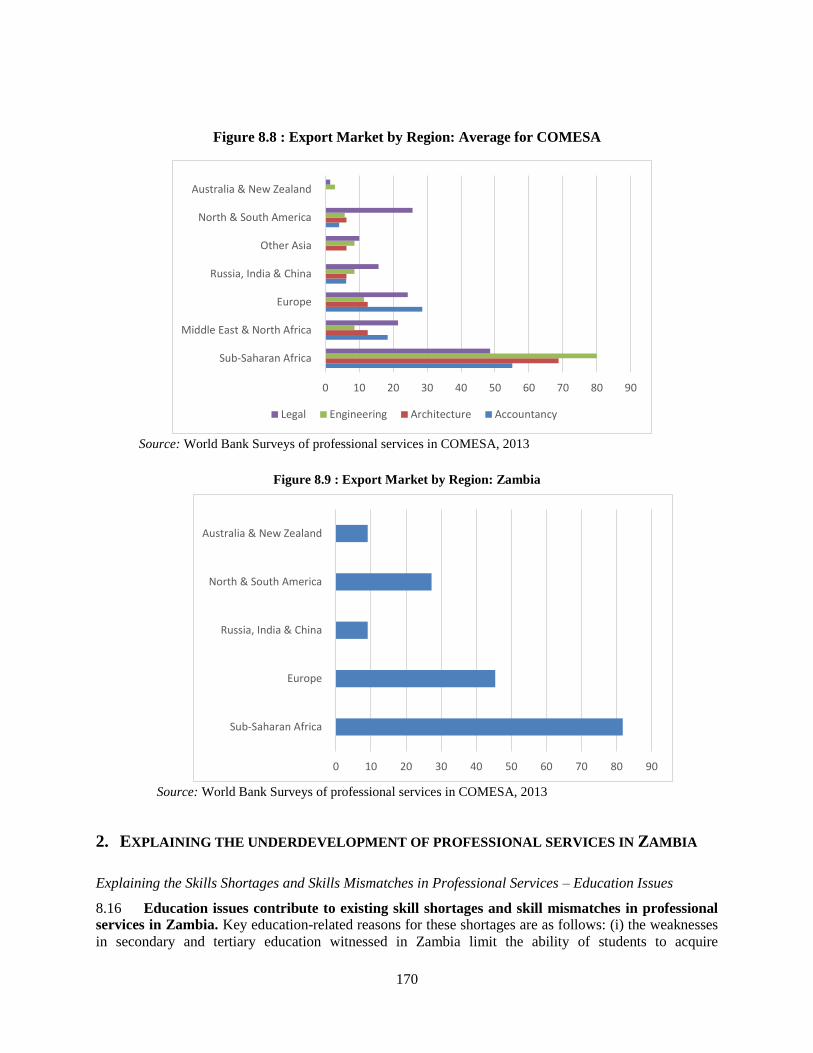
170
Figure 8.8 : Export Market by Region: Average for COMESA
Source: World Bank Surveys of professional services in COMESA, 2013
Figure 8.9 : Export Market by Region: Zambia
Source: World Bank Surveys of professional services in COMESA, 2013
2. EXPLAINING THE UNDERDEVELOPMENT OF PROFESSIONAL SERVICES IN ZAMBIA
Explaining the Skills Shortages and Skills Mismatches in Professional Services – Education Issues
8.16 Education issues contribute to existing skill shortages and skill mismatches in professional
services in Zambia. Key education-related reasons for these shortages are as follows: (i) the weaknesses
in secondary and tertiary education witnessed in Zambia limit the ability of students to acquire
0 10 20 30 40 50 60 70 80 90
Sub-Saharan Africa
Middle East & North Africa
Europe
Russia, India & China
Other Asia
North & South America
Australia & New Zealand
Legal Engineering Architecture Accountancy
0 10 20 30 40 50 60 70 80 90
Sub-Saharan Africa
Europe
Russia, India & China
North & South America
Australia & New Zealand
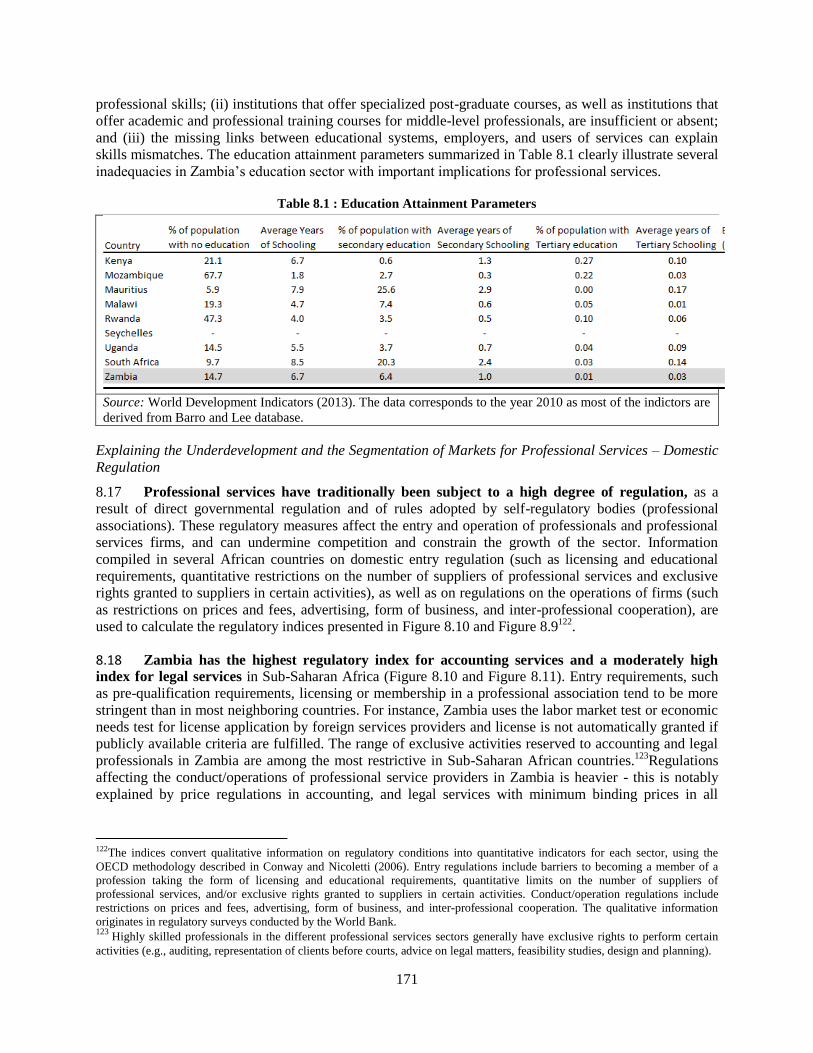
171
professional skills; (ii) institutions that offer specialized post-graduate courses, as well as institutions that
offer academic and professional training courses for middle-level professionals, are insufficient or absent;
and (iii) the missing links between educational systems, employers, and users of services can explain
skills mismatches. The education attainment parameters summarized in Table 8.1 clearly illustrate several
inadequacies in Zambia’s education sector with important implications for professional services.
Table 8.1 : Education Attainment Parameters
Source: World Development Indicators (2013). The data corresponds to the year 2010 as most of the indictors are
derived from Barro and Lee database.
Explaining the Underdevelopment and the Segmentation of Markets for Professional Services – Domestic
Regulation
8.17 Professional services have traditionally been subject to a high degree of regulation, as a
result of direct governmental regulation and of rules adopted by self-regulatory bodies (professional
associations). These regulatory measures affect the entry and operation of professionals and professional
services firms, and can undermine competition and constrain the growth of the sector. Information
compiled in several African countries on domestic entry regulation (such as licensing and educational
requirements, quantitative restrictions on the number of suppliers of professional services and exclusive
rights granted to suppliers in certain activities), as well as on regulations on the operations of firms (such
as restrictions on prices and fees, advertising, form of business, and inter-professional cooperation), are
used to calculate the regulatory indices presented in Figure 8.10 and Figure 8.9122
.
8.18 Zambia has the highest regulatory index for accounting services and a moderately high
index for legal services in Sub-Saharan Africa (Figure 8.10 and Figure 8.11). Entry requirements, such
as pre-qualification requirements, licensing or membership in a professional association tend to be more
stringent than in most neighboring countries. For instance, Zambia uses the labor market test or economic
needs test for license application by foreign services providers and license is not automatically granted if
publicly available criteria are fulfilled. The range of exclusive activities reserved to accounting and legal
professionals in Zambia are among the most restrictive in Sub-Saharan African countries.123
Regulations
affecting the conduct/operations of professional service providers in Zambia is heavier - this is notably
explained by price regulations in accounting, and legal services with minimum binding prices in all
122The indices convert qualitative information on regulatory conditions into quantitative indicators for each sector, using the
OECD methodology described in Conway and Nicoletti (2006). Entry regulations include barriers to becoming a member of a
profession taking the form of licensing and educational requirements, quantitative limits on the number of suppliers of
professional services, and/or exclusive rights granted to suppliers in certain activities. Conduct/operation regulations include
restrictions on prices and fees, advertising, form of business, and inter-professional cooperation. The qualitative information
originates in regulatory surveys conducted by the World Bank. 123
Highly skilled professionals in the different professional services sectors generally have exclusive rights to perform certain
activities (e.g., auditing, representation of clients before courts, advice on legal matters, feasibility studies, design and planning).
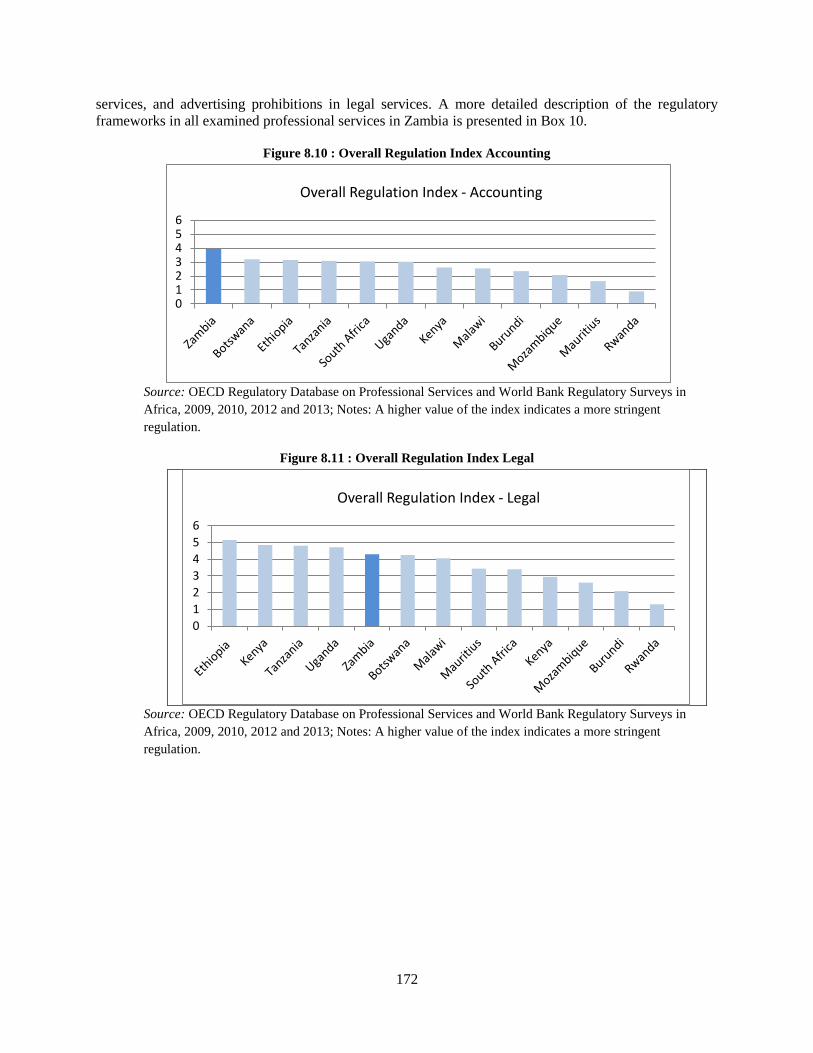
172
services, and advertising prohibitions in legal services. A more detailed description of the regulatory
frameworks in all examined professional services in Zambia is presented in Box 10.
Figure 8.10 : Overall Regulation Index Accounting
Source: OECD Regulatory Database on Professional Services and World Bank Regulatory Surveys in
Africa, 2009, 2010, 2012 and 2013; Notes: A higher value of the index indicates a more stringent
regulation.
Figure 8.11 : Overall Regulation Index Legal
Source: OECD Regulatory Database on Professional Services and World Bank Regulatory Surveys in
Africa, 2009, 2010, 2012 and 2013; Notes: A higher value of the index indicates a more stringent
regulation.
0123456
Overall Regulation Index - Accounting
0
1
2
3
4
5
6
Overall Regulation Index - Legal
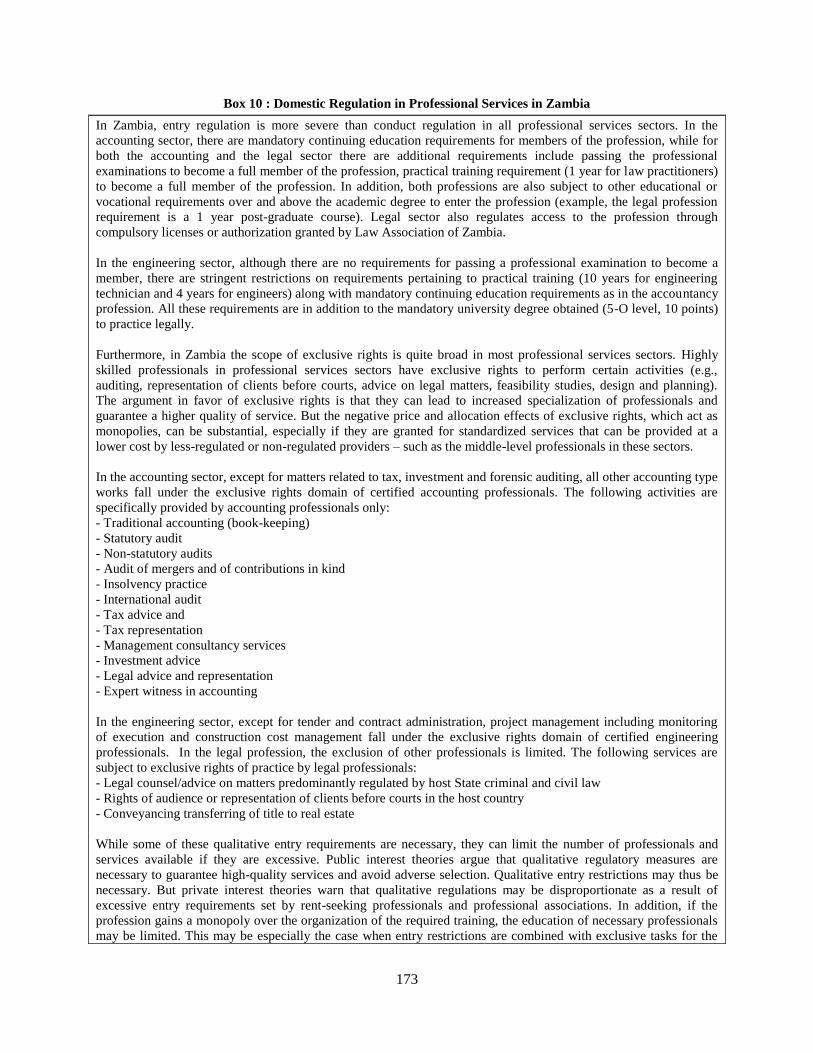
173
Box 10 : Domestic Regulation in Professional Services in Zambia
In Zambia, entry regulation is more severe than conduct regulation in all professional services sectors. In the
accounting sector, there are mandatory continuing education requirements for members of the profession, while for
both the accounting and the legal sector there are additional requirements include passing the professional
examinations to become a full member of the profession, practical training requirement (1 year for law practitioners)
to become a full member of the profession. In addition, both professions are also subject to other educational or
vocational requirements over and above the academic degree to enter the profession (example, the legal profession
requirement is a 1 year post-graduate course). Legal sector also regulates access to the profession through
compulsory licenses or authorization granted by Law Association of Zambia.
In the engineering sector, although there are no requirements for passing a professional examination to become a
member, there are stringent restrictions on requirements pertaining to practical training (10 years for engineering
technician and 4 years for engineers) along with mandatory continuing education requirements as in the accountancy
profession. All these requirements are in addition to the mandatory university degree obtained (5-O level, 10 points)
to practice legally.
Furthermore, in Zambia the scope of exclusive rights is quite broad in most professional services sectors. Highly
skilled professionals in professional services sectors have exclusive rights to perform certain activities (e.g.,
auditing, representation of clients before courts, advice on legal matters, feasibility studies, design and planning).
The argument in favor of exclusive rights is that they can lead to increased specialization of professionals and
guarantee a higher quality of service. But the negative price and allocation effects of exclusive rights, which act as
monopolies, can be substantial, especially if they are granted for standardized services that can be provided at a
lower cost by less-regulated or non-regulated providers – such as the middle-level professionals in these sectors.
In the accounting sector, except for matters related to tax, investment and forensic auditing, all other accounting type
works fall under the exclusive rights domain of certified accounting professionals. The following activities are
specifically provided by accounting professionals only:
- Traditional accounting (book-keeping)
- Statutory audit
- Non-statutory audits
- Audit of mergers and of contributions in kind
- Insolvency practice
- International audit
- Tax advice and
- Tax representation
- Management consultancy services
- Investment advice
- Legal advice and representation
- Expert witness in accounting
In the engineering sector, except for tender and contract administration, project management including monitoring
of execution and construction cost management fall under the exclusive rights domain of certified engineering
professionals. In the legal profession, the exclusion of other professionals is limited. The following services are
subject to exclusive rights of practice by legal professionals:
- Legal counsel/advice on matters predominantly regulated by host State criminal and civil law
- Rights of audience or representation of clients before courts in the host country
- Conveyancing transferring of title to real estate
While some of these qualitative entry requirements are necessary, they can limit the number of professionals and
services available if they are excessive. Public interest theories argue that qualitative regulatory measures are
necessary to guarantee high-quality services and avoid adverse selection. Qualitative entry restrictions may thus be
necessary. But private interest theories warn that qualitative regulations may be disproportionate as a result of
excessive entry requirements set by rent-seeking professionals and professional associations. In addition, if the
profession gains a monopoly over the organization of the required training, the education of necessary professionals
may be limited. This may be especially the case when entry restrictions are combined with exclusive tasks for the
174
regulated profession (OECD, 2007).
Regulation affecting the conduct/operations of professional services providers in Zambia tends to be severe in some
sectors. This result is explained by price regulations, advertising prohibitions, restrictions on firms’ business
structure and on multidisciplinary activities. In engineering services, professional services’ fees tend to be
negotiated freely between practitioners and clients, but prices are regulated in the accounting and legal sectors. In
the accounting sector, the Professional Association regulates the fees or prices that the profession charges for its
services. Further there are instruments and/or benchmarking systems to assess and monitor the quality of services
provided by professionals, which, set at high standards, could further act as regulations to hinder the growth and
operations of a firm. In the legal sector, the regulatory condition is tighter. Not only is advertising prohibited for
domestic and foreign suppliers alike, foreign suppliers are not even allowed to use the name used in their home
country or the name of their parent company. The Zambian Professional Association regulates the pricing and fees
charged for various legal services. There are minimum binding prices of all legal services while some services are
subject to maximum legal fees.
Such price regulations are introduced and supported by the government, with the argument that they help prevent
adverse selection problems. But most of the economic literature states that these regulatory instruments can
seriously harm competition by eliminating or reducing the benefits that competitive markets deliver for consumers.
Most agree that less restrictive mechanisms, such as better information on the services provided, could be
established. Public interest theories justify advertising restrictions by the need to protect consumers. But private
interest theories maintain that there is no justification for prohibiting advertising that is relevant, truthful, and not
misleading. Instead, advertising fosters competition by informing consumers about different products and allowing
them to make better-informed buying decisions. It is also stressed that advertising, especially comparative
advertising, can be a crucial competitive tool for new firms entering a market.
Source: Regulatory surveys undertaken in 2009 and 2012.
8.19 Transparency in public procurement, administrative steps for setting up a business and the
speed of licensing procedures are among the top regulatory constraints faced by professional
services providers in Zambia, as indicated by the 2012-13 World Bank business surveys presented in
Figure 8.12. Restrictions affecting competition such as advertising prohibitions and fees/price regulations
are also important barriers for business but again requirements for participation in public procurement and
the speed of accreditation and qualification procedures are much stronger binding constraints on
operations of professional service provider firms.
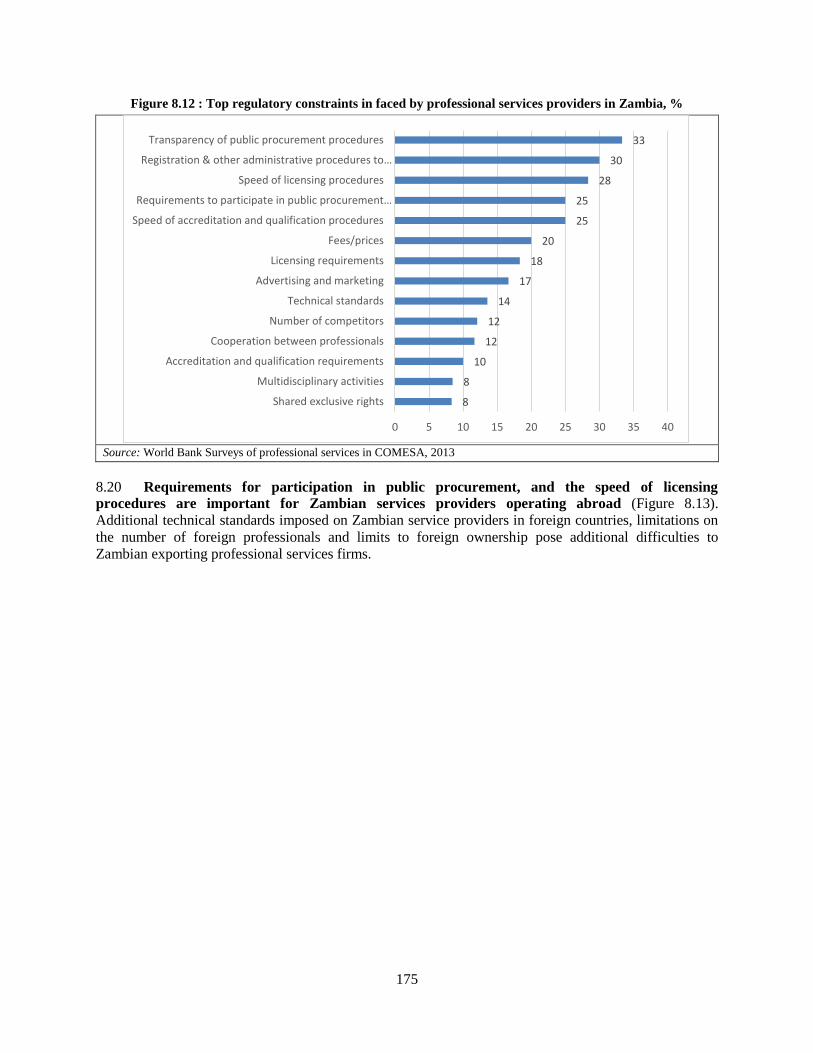
175
Figure 8.12 : Top regulatory constraints in faced by professional services providers in Zambia, %
Source: World Bank Surveys of professional services in COMESA, 2013
8.20 Requirements for participation in public procurement, and the speed of licensing
procedures are important for Zambian services providers operating abroad (Figure 8.13).
Additional technical standards imposed on Zambian service providers in foreign countries, limitations on
the number of foreign professionals and limits to foreign ownership pose additional difficulties to
Zambian exporting professional services firms.
8
8
10
12
12
14
17
18
20
25
25
28
30
33
0 5 10 15 20 25 30 35 40
Shared exclusive rights
Multidisciplinary activities
Accreditation and qualification requirements
Cooperation between professionals
Number of competitors
Technical standards
Advertising and marketing
Licensing requirements
Fees/prices
Speed of accreditation and qualification procedures
Requirements to participate in public procurement…
Speed of licensing procedures
Registration & other administrative procedures to…
Transparency of public procurement procedures
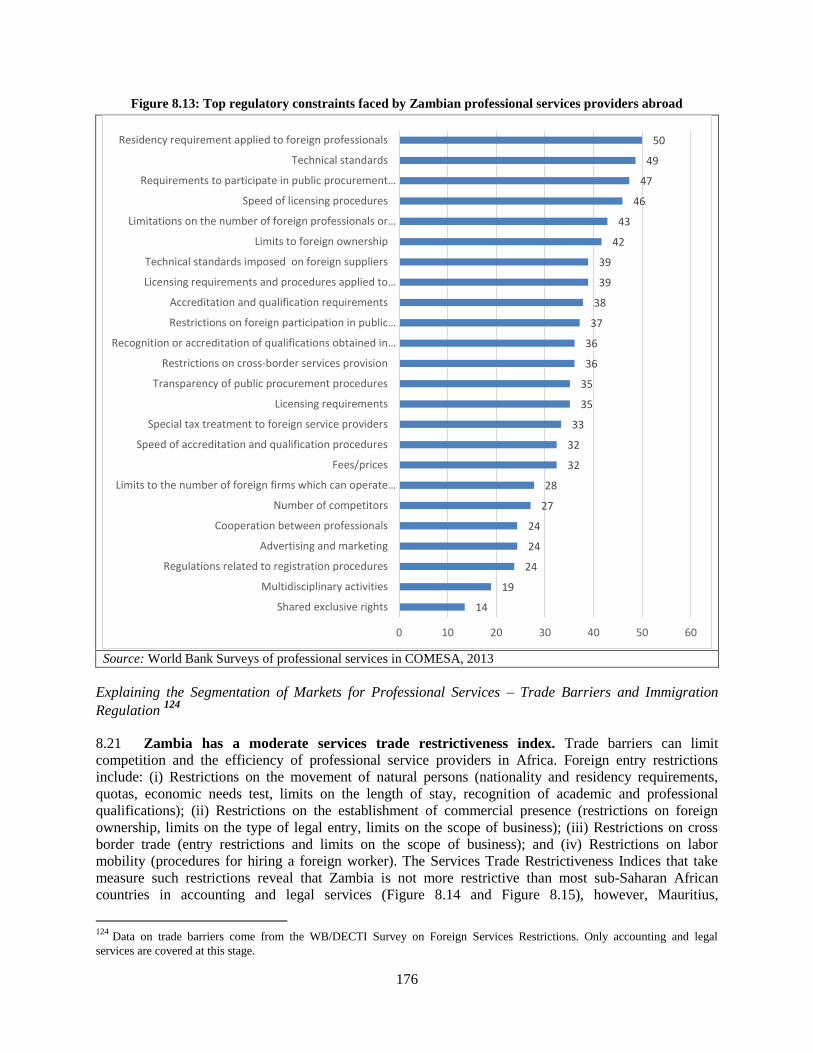
176
Figure 8.13: Top regulatory constraints faced by Zambian professional services providers abroad
Source: World Bank Surveys of professional services in COMESA, 2013
Explaining the Segmentation of Markets for Professional Services – Trade Barriers and Immigration
Regulation 124
8.21 Zambia has a moderate services trade restrictiveness index. Trade barriers can limit
competition and the efficiency of professional service providers in Africa. Foreign entry restrictions
include: (i) Restrictions on the movement of natural persons (nationality and residency requirements,
quotas, economic needs test, limits on the length of stay, recognition of academic and professional
qualifications); (ii) Restrictions on the establishment of commercial presence (restrictions on foreign
ownership, limits on the type of legal entry, limits on the scope of business); (iii) Restrictions on cross
border trade (entry restrictions and limits on the scope of business); and (iv) Restrictions on labor
mobility (procedures for hiring a foreign worker). The Services Trade Restrictiveness Indices that take
measure such restrictions reveal that Zambia is not more restrictive than most sub-Saharan African
countries in accounting and legal services (Figure 8.14 and Figure 8.15), however, Mauritius,
124
Data on trade barriers come from the WB/DECTI Survey on Foreign Services Restrictions. Only accounting and legal
services are covered at this stage.
14
19
24
24
24
27
28
32
32
33
35
35
36
36
37
38
39
39
42
43
46
47
49
50
0 10 20 30 40 50 60
Shared exclusive rights
Multidisciplinary activities
Regulations related to registration procedures
Advertising and marketing
Cooperation between professionals
Number of competitors
Limits to the number of foreign firms which can operate…
Fees/prices
Speed of accreditation and qualification procedures
Special tax treatment to foreign service providers
Licensing requirements
Transparency of public procurement procedures
Restrictions on cross-border services provision
Recognition or accreditation of qualifications obtained in…
Restrictions on foreign participation in public…
Accreditation and qualification requirements
Licensing requirements and procedures applied to…
Technical standards imposed on foreign suppliers
Limits to foreign ownership
Limitations on the number of foreign professionals or…
Speed of licensing procedures
Requirements to participate in public procurement…
Technical standards
Residency requirement applied to foreign professionals
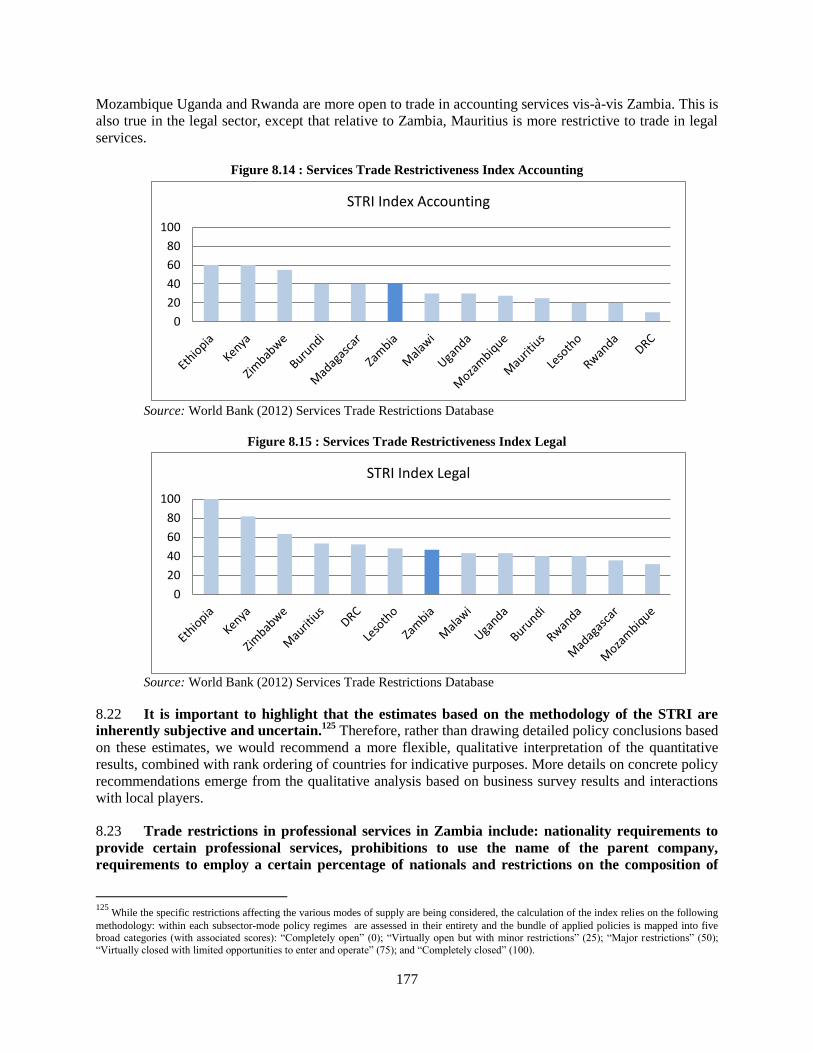
177
Mozambique Uganda and Rwanda are more open to trade in accounting services vis-à-vis Zambia. This is
also true in the legal sector, except that relative to Zambia, Mauritius is more restrictive to trade in legal
services.
Figure 8.14 : Services Trade Restrictiveness Index Accounting
Source: World Bank (2012) Services Trade Restrictions Database
Figure 8.15 : Services Trade Restrictiveness Index Legal
Source: World Bank (2012) Services Trade Restrictions Database
8.22 It is important to highlight that the estimates based on the methodology of the STRI are
inherently subjective and uncertain.125
Therefore, rather than drawing detailed policy conclusions based
on these estimates, we would recommend a more flexible, qualitative interpretation of the quantitative
results, combined with rank ordering of countries for indicative purposes. More details on concrete policy
recommendations emerge from the qualitative analysis based on business survey results and interactions
with local players.
8.23 Trade restrictions in professional services in Zambia include: nationality requirements to
provide certain professional services, prohibitions to use the name of the parent company,
requirements to employ a certain percentage of nationals and restrictions on the composition of
125
While the specific restrictions affecting the various modes of supply are being considered, the calculation of the index relies on the following
methodology: within each subsector-mode policy regimes are assessed in their entirety and the bundle of applied policies is mapped into five broad categories (with associated scores): “Completely open” (0); “Virtually open but with minor restrictions” (25); “Major restrictions” (50);
“Virtually closed with limited opportunities to enter and operate” (75); and “Completely closed” (100).
0
20
40
60
80
100
STRI Index Accounting
0
20
40
60
80
100
STRI Index Legal
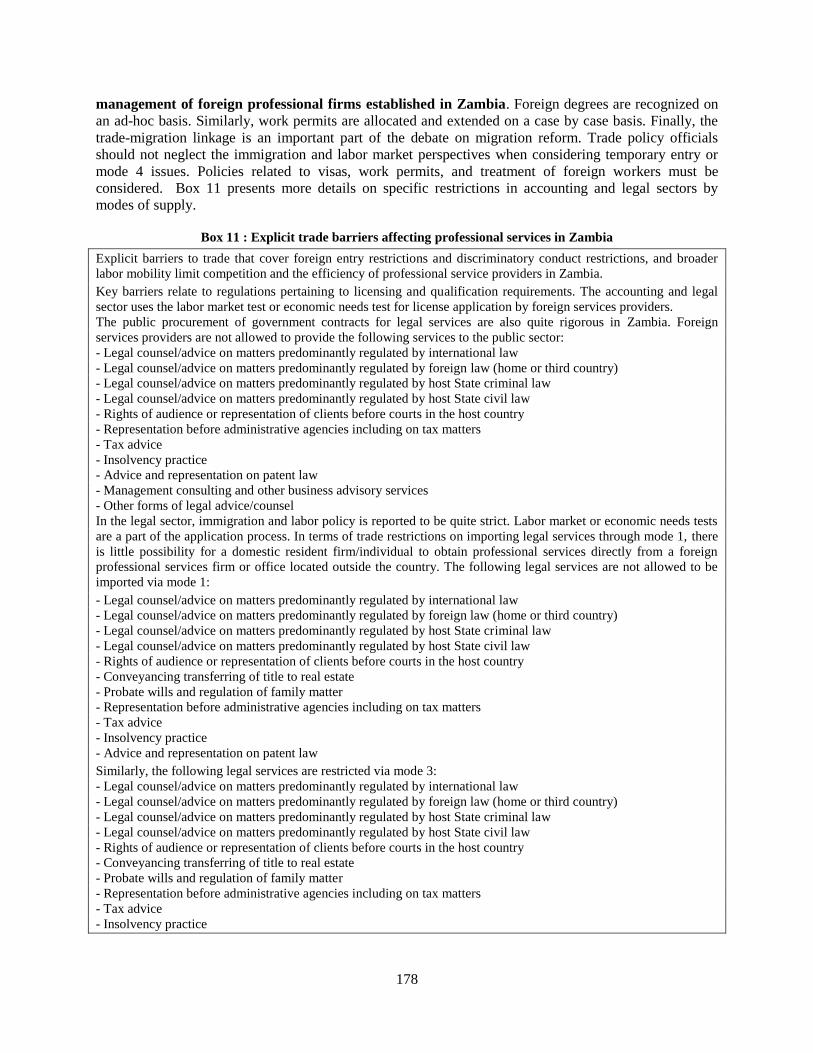
178
management of foreign professional firms established in Zambia. Foreign degrees are recognized on
an ad-hoc basis. Similarly, work permits are allocated and extended on a case by case basis. Finally, the
trade-migration linkage is an important part of the debate on migration reform. Trade policy officials
should not neglect the immigration and labor market perspectives when considering temporary entry or
mode 4 issues. Policies related to visas, work permits, and treatment of foreign workers must be
considered. Box 11 presents more details on specific restrictions in accounting and legal sectors by
modes of supply.
Box 11 : Explicit trade barriers affecting professional services in Zambia
Explicit barriers to trade that cover foreign entry restrictions and discriminatory conduct restrictions, and broader
labor mobility limit competition and the efficiency of professional service providers in Zambia.
Key barriers relate to regulations pertaining to licensing and qualification requirements. The accounting and legal
sector uses the labor market test or economic needs test for license application by foreign services providers.
The public procurement of government contracts for legal services are also quite rigorous in Zambia. Foreign
services providers are not allowed to provide the following services to the public sector:
- Legal counsel/advice on matters predominantly regulated by international law
- Legal counsel/advice on matters predominantly regulated by foreign law (home or third country)
- Legal counsel/advice on matters predominantly regulated by host State criminal law
- Legal counsel/advice on matters predominantly regulated by host State civil law
- Rights of audience or representation of clients before courts in the host country
- Representation before administrative agencies including on tax matters
- Tax advice
- Insolvency practice
- Advice and representation on patent law
- Management consulting and other business advisory services
- Other forms of legal advice/counsel
In the legal sector, immigration and labor policy is reported to be quite strict. Labor market or economic needs tests
are a part of the application process. In terms of trade restrictions on importing legal services through mode 1, there
is little possibility for a domestic resident firm/individual to obtain professional services directly from a foreign
professional services firm or office located outside the country. The following legal services are not allowed to be
imported via mode 1:
- Legal counsel/advice on matters predominantly regulated by international law
- Legal counsel/advice on matters predominantly regulated by foreign law (home or third country)
- Legal counsel/advice on matters predominantly regulated by host State criminal law
- Legal counsel/advice on matters predominantly regulated by host State civil law
- Rights of audience or representation of clients before courts in the host country
- Conveyancing transferring of title to real estate
- Probate wills and regulation of family matter
- Representation before administrative agencies including on tax matters
- Tax advice
- Insolvency practice
- Advice and representation on patent law
Similarly, the following legal services are restricted via mode 3:
- Legal counsel/advice on matters predominantly regulated by international law
- Legal counsel/advice on matters predominantly regulated by foreign law (home or third country)
- Legal counsel/advice on matters predominantly regulated by host State criminal law
- Legal counsel/advice on matters predominantly regulated by host State civil law
- Rights of audience or representation of clients before courts in the host country
- Conveyancing transferring of title to real estate
- Probate wills and regulation of family matter
- Representation before administrative agencies including on tax matters
- Tax advice
- Insolvency practice
179
In addition, for the two legal services that are explicitly allowed via mode 3, that is, - advice and representation on
patent law and management consulting and other business advisory services, these are subject to limits on ownership
or control in a foreign firm’s office in Zambia by law professionals who are not licensed to practice.
In the legal services sector, the movement of natural persons (mode 4 of trade in services in GATS) is substantially
more restricted than the establishment of foreign professional firms in comparator countries. In such cases, entry is
subject to certain conditions such as nationality requirements in subsectors such as insolvency practice. All foreign
professionals require visas to enter Zambia and a work permit to practice in the country. Also, foreign professionals
in all sectors are subject to labor market tests and economic needs tests in Zambia.
Source: Regulatory surveys carried out in 2009 and 2012
3. RECOMMENDATIONS FOR POLICY ACTION
8.24 Policy action is required to address the constraints to the development of professional
services. The national markets for professionals and professional services in Zambia are underdeveloped,
with performance indicators below the averages of countries at a similar level of development. Inadequate
domestic regulations, combined with a lack of regional coordination among countries, further constrain
foreign investment and Zambia’s integration with other Sub-Saharan African countries. These outcomes
are the result of constraints that suggest policy action in the following areas: education, regulation of
professional services, trade policy, and labor mobility. International and regional cooperation (for
example, WTO, APEI and COMESA services negotiations) would ideally complement domestic policy
reform. Trade liberalization and regional integration can be used to advance regulatory reform, enhance
competition, and deal with labor mobility issues that are crucial in professional services. The key
recommendations are highlighted in the Action Matrix.
Policy action at the national level
8.25 Reforms at the national level need to focus on the development of framework conditions that
address skills shortages and skills mismatches, and that attempt to facilitate the growth of professional
services in Zambia through regulatory reforms.
8.26 In education, there is an urgent need for improving the faculties and other training
programs. These programs need to be expanded to satisfy professional training needs, but this must be
planned and carried out in a manner that will increase not only the quantity but also the quality of
offerings. Merely certifying schools and granting more degrees or certificates to poorly-trained students
would not address the needs, and instead would worsen the overall situation in the long run by infusing
poorly equipped graduates into the system.
Box 12 : Can Regional Initiatives Help?
The SADC Protocol on Education and Training which was signed in 1997 with the key objective of
providing a framework for regional co-operation in addressing education needs. In an effort to promote
internationalization of higher education in the region, member countries agreed to reserve 5% of all
available seats for SADC member countries (Article 7). In 2002, more than 5% of all students enrolled in
South African universities and polytechnics were SADC students. This has pushed the enrollment of
SADC students as a percent of all international students from 52% in 1997 to 72% in 2011. The SADC
agreement also guaranteed that students from member states were given national treatment, thereby
ensuring that SADC students are treated like home students for purposes of fees and accommodation.
South Africa, among other countries, has progressed in implementing national treatment much more
easily.
180
8.27 International and national experiences related to quality assurance of secondary and higher
education could serve as a model for Zambia. For example, the program that is currently being
developed by the Inter-University Council for East Africa (IUCEA) in terms of designing university
curricula and research, and creating university/industry partnerships for fostering knowledge, could
provide guidance for education reforms in Zambia and other Southern African countries.
8.28 Policy actions to encourage collaboration between universities, professional associations,
and the private sector, for example through internships, could help students acquire skills and
practical training. The absence of links between educational systems, employers, and users of services
prevents young graduates from finding employment, and further explains the attrition of skills in several
professions. Several stakeholders from the private sector have emphasized the coordination problems
between employers, professional associations, and education institutions in the content of educational
programs for engineers and accountants. The Structured Engineers Apprenticeship Program (SEAP) for
Graduate Engineers developed by the Engineers Registration Board in Tanzania provides an example that
could be followed by Zambia as well.
Regulatory reforms: Reforms need to focus on incremental, qualitative improvements in
domestic regulation:
8.29 Disproportionate cumulative entry requirements need to be relaxed. For example, narrowing
the scope of exclusive tasks in certain professions would contribute to this goal. Exclusive rights can lead
to increased specialization of professionals and guarantee a higher quality of service, but if they create
monopolies they can have adverse price and allocation effects, especially when granted for services for
which adequate quality can be provided at a lower cost by less-regulated middle-level professionals. In
fact, there needs to be adequate regulations to ensure that professionals are equipped with market-relevant
skills need to be put in place.
8.30 Disproportionate restrictions that limit competition need to be eliminated. Price regulations
affecting legal services and public procurement contracts in engineering are supported and introduced by
professional associations or the government, who claim that they are useful tools to prevent adverse
selection problems. Zambia needs to adopt less restrictive mechanisms, such as better access to
information on services and services providers to accomplish the same goals at lower economic cost.
8.31 The country needs to allow advertising of professional services, which facilitates competition
by informing consumers about different products and which can be used as a competitive tool for new
firms entering the market.
8.32 The key issue regarding regulatory reform is not less regulation but better regulation; that is
regulation that more effectively achieves public policy objectives while ensuring efficiently produced low
cost services. Tools and procedures can be put in place to assist policy makers to assess whether existing
or new regulation will achieve the sector-specific public policy objectives while contributing to market
openness. Box 13 presents such regulatory tools – Zambia could learn from these experiences:
181
Box 13 : Regulatory initiatives that could be used as a model by the COMESA countries
The OECD principles on key market-oriented and trade-and-investment-friendly regulation could offer
guidance to the regulation of services sectors in Africa. Furthermore, the APEC-OECD Integrated Checklist
on Regulatory Reform (adapted to developing countries’ needs) could provide further guidance on how to
undertake such a combined assessment of regulatory and competition policies, and market openness policies.
The Checklist highlights key issues that should be considered during the process of development and
implementation of regulatory policy and could be useful in building domestic capacities for quality
regulation.
The APEC-OECD Checklist is a voluntary tool that Zambia and other African economies may use to
evaluate their respective regulatory reform efforts. The checklist has four sections including 40 specific open
questions in total. The first is a horizontal questionnaire that deals with the degree of integration of
regulatory, competition and market openness policies across levels of government, and on the accountability
and transparency mechanisms needed to ensure their success. The second is on regulatory policies which are
designed to maximize the efficiency, transparency and accountability of regulations based on an integrated
rule-making approach and the application of regulatory tools and institutions. The third is on competition
policies which promote economic growth and efficiency by eliminating or minimizing the distorting impact
of laws, regulations and administrative policies, practices and procedures on competition, and by preventing
and deterring private anti-competitive practices through effective enforcement of competition laws. The
fourth is on market openness policies which aim to ensure that an economy can reap the benefits of
globalization and international competition by eliminating or minimizing the distorting effects of border as
well as behind-the-border regulations and practices.
Other regulatory experiences such as the ASEAN Mutual Recognition Arrangement Framework on
Accountancy Services, the ASEAN Mutual Recognition Arrangements on Engineering Services and on
Architectural Services could provide further guidance to Zambia and other African countries which are
willing to engage in mutual recognition discussions. Furthermore, the experience of the EU with the internal
recognition of professional qualifications as well as the regulatory dialogues and regulatory platforms
established with third countries could give additional guidance to Zambian policy makers.
Sources: OECD, APEC, ASEAN
Policy action at the regional and multilateral levels
8.33 The fragmentation of regional markets for professional services and professional education
by restrictive policies and regulatory heterogeneity prevents Zambia from taking advantage of
gains from trade. Trade barriers would ideally be liberalized on a most favored nation (MFN) or non-
preferential basis, since this would generate the largest welfare gains, and complemented with regional
cooperation to reduce regulatory differences.
8.34 In education, Zambia is considering options to play the role of a training hub in technical
education. Zambia is considering replicating the example of the Kafue Gorge Regional Training
Centre126
that hosts a specialized training center in hydropower station operations. Initially, the center
served only the SADC region, but has since expanded to serve the whole African region.
(i) Steps need to be taken to relax the explicit trade barriers applied by Zambia to the movement of
natural persons and commercial presence of professional services.
Examples of possible reforms are:
- Articulating the economic and social motivation for nationality and residency requirements;
- Minimizing restrictions on the forms of establishment allowed;
126
http://zambiaindex.com/listing.php?idu=10770
182
- Developing a transparent and consistent framework for accepting professionals with foreign
qualifications.
The reduction of explicit trade barriers also needs to be complemented with the reform of immigration
laws and rules on the hiring of foreign workers.
(ii) Trade liberalization needs to be coordinated with regulatory reform and cooperation at the
regional level.
8.35 Deeper regional integration, through regulatory cooperation with neighboring partners
who have similar regulatory preferences, can usefully complement non-preferential trade
liberalization. Regional integration would also enhance competition among services providers, enable
those providers to exploit economies of scale in professional education, and produce a wider variety of
services. Regional integration brings further benefits in that a larger regional market is able to attract
greater domestic and foreign investment; and regionalization may help take advantage of scale economies
in regulation, particularly where national agencies face technical skills or capacity constraints.
8.36 Opening up regional boundaries and establishing Mutual Recognition Agreements (MRAs)
would facilitate Zambia’s services integration with its African partners. The free movement of
APEI/COMESA/SADC nationals without work permit requirements would be of great help to increase
business opportunities within the region and boost service exports. Regional discussions in Southern
Africa on MRAs in professional services are in a very preliminary phase with a higher progress potential
among APEI countries. Interested countries could learn from East Africa’s experience with MRAs in
account and architectural services. The EAC Common Market Protocol, adopted by the Multi Sector
Council in 2009, includes an annex on a framework agreement on MRA of academic and professional
qualifications. The five EAC countries have already signed an MRA in accounting services and
implementation focuses on the following areas: requirements for education, examinations, experience,
conduct and ethics, professional development and re-certification, scope of practice, and local knowledge.
To assist with the preparation of potential MRAs Zambia and other interested countries could benefits
from technical assistance in the context of the APEI program.
4. CONCLUSION
8.37 Zambia needs to engage in deep regulatory cooperation at the regional level and use
multilateral trade liberalization and regional integration to reform and strengthen its professional
services sectors. The government could engage with donors to secure technical and financial assistance
to strengthen the capacity of regulatory organizations, and develop appropriate regulation. The pace of
integration is largely dependent upon Zambia’s political motivation and conviction that such liberalization
is beneficial to the domestic constituencies. To improve such prospects, the promotion of more frequent
and open dialogue between the key stakeholders involved in professional services - professional bodies,
private sector providers, users of services, higher education institutions, trade negotiators – is important.
Zambia’s participation in the APEI program as well as other regional initiatives can help the country with
the development of a meaningful reform program that includes the elimination of explicit barriers and
regulatory, education and immigrating reforms.
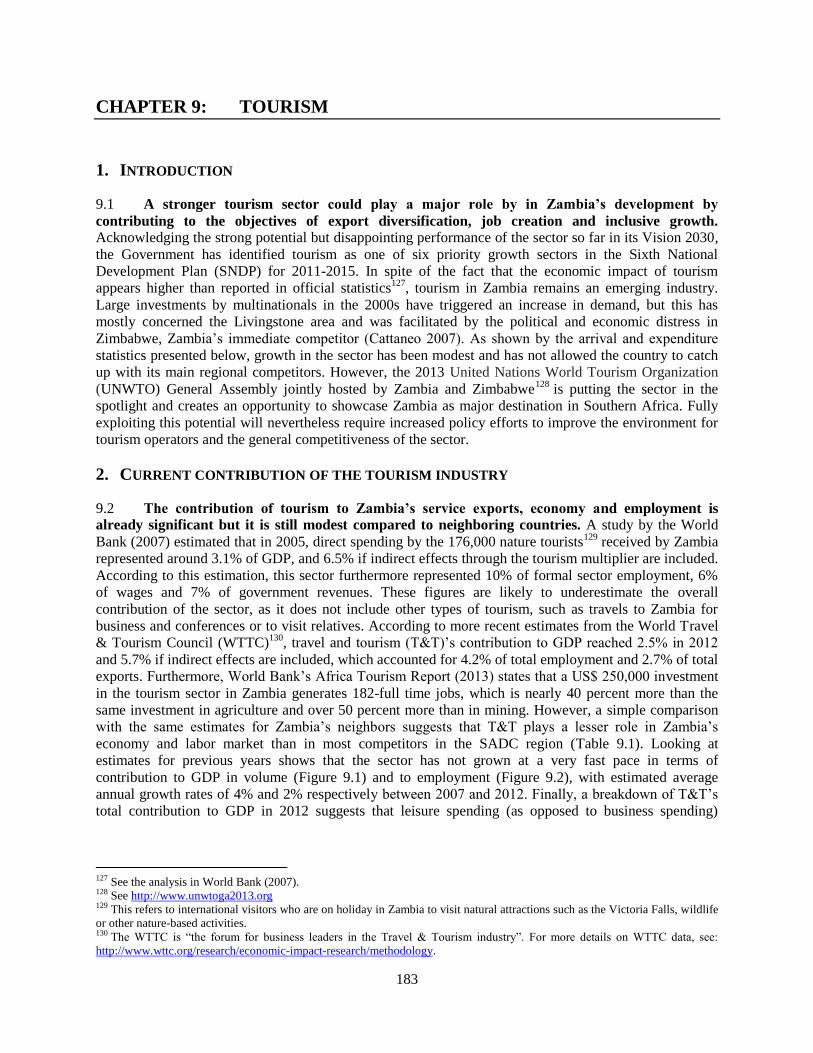
183
CHAPTER 9: TOURISM
1. INTRODUCTION
9.1 A stronger tourism sector could play a major role by in Zambia’s development by
contributing to the objectives of export diversification, job creation and inclusive growth.
Acknowledging the strong potential but disappointing performance of the sector so far in its Vision 2030,
the Government has identified tourism as one of six priority growth sectors in the Sixth National
Development Plan (SNDP) for 2011-2015. In spite of the fact that the economic impact of tourism
appears higher than reported in official statistics127
, tourism in Zambia remains an emerging industry.
Large investments by multinationals in the 2000s have triggered an increase in demand, but this has
mostly concerned the Livingstone area and was facilitated by the political and economic distress in
Zimbabwe, Zambia’s immediate competitor (Cattaneo 2007). As shown by the arrival and expenditure
statistics presented below, growth in the sector has been modest and has not allowed the country to catch
up with its main regional competitors. However, the 2013 United Nations World Tourism Organization
(UNWTO) General Assembly jointly hosted by Zambia and Zimbabwe128
is putting the sector in the
spotlight and creates an opportunity to showcase Zambia as major destination in Southern Africa. Fully
exploiting this potential will nevertheless require increased policy efforts to improve the environment for
tourism operators and the general competitiveness of the sector.
2. CURRENT CONTRIBUTION OF THE TOURISM INDUSTRY
9.2 The contribution of tourism to Zambia’s service exports, economy and employment is
already significant but it is still modest compared to neighboring countries. A study by the World
Bank (2007) estimated that in 2005, direct spending by the 176,000 nature tourists129
received by Zambia
represented around 3.1% of GDP, and 6.5% if indirect effects through the tourism multiplier are included.
According to this estimation, this sector furthermore represented 10% of formal sector employment, 6%
of wages and 7% of government revenues. These figures are likely to underestimate the overall
contribution of the sector, as it does not include other types of tourism, such as travels to Zambia for
business and conferences or to visit relatives. According to more recent estimates from the World Travel
& Tourism Council (WTTC)130
, travel and tourism (T&T)’s contribution to GDP reached 2.5% in 2012
and 5.7% if indirect effects are included, which accounted for 4.2% of total employment and 2.7% of total
exports. Furthermore, World Bank’s Africa Tourism Report (2013) states that a US$ 250,000 investment
in the tourism sector in Zambia generates 182-full time jobs, which is nearly 40 percent more than the
same investment in agriculture and over 50 percent more than in mining. However, a simple comparison
with the same estimates for Zambia’s neighbors suggests that T&T plays a lesser role in Zambia’s
economy and labor market than in most competitors in the SADC region (Table 9.1). Looking at
estimates for previous years shows that the sector has not grown at a very fast pace in terms of
contribution to GDP in volume (Figure 9.1) and to employment (Figure 9.2), with estimated average
annual growth rates of 4% and 2% respectively between 2007 and 2012. Finally, a breakdown of T&T’s
total contribution to GDP in 2012 suggests that leisure spending (as opposed to business spending)
127 See the analysis in World Bank (2007). 128 See http://www.unwtoga2013.org 129 This refers to international visitors who are on holiday in Zambia to visit natural attractions such as the Victoria Falls, wildlife
or other nature-based activities. 130 The WTTC is “the forum for business leaders in the Travel & Tourism industry”. For more details on WTTC data, see:
http://www.wttc.org/research/economic-impact-research/methodology.
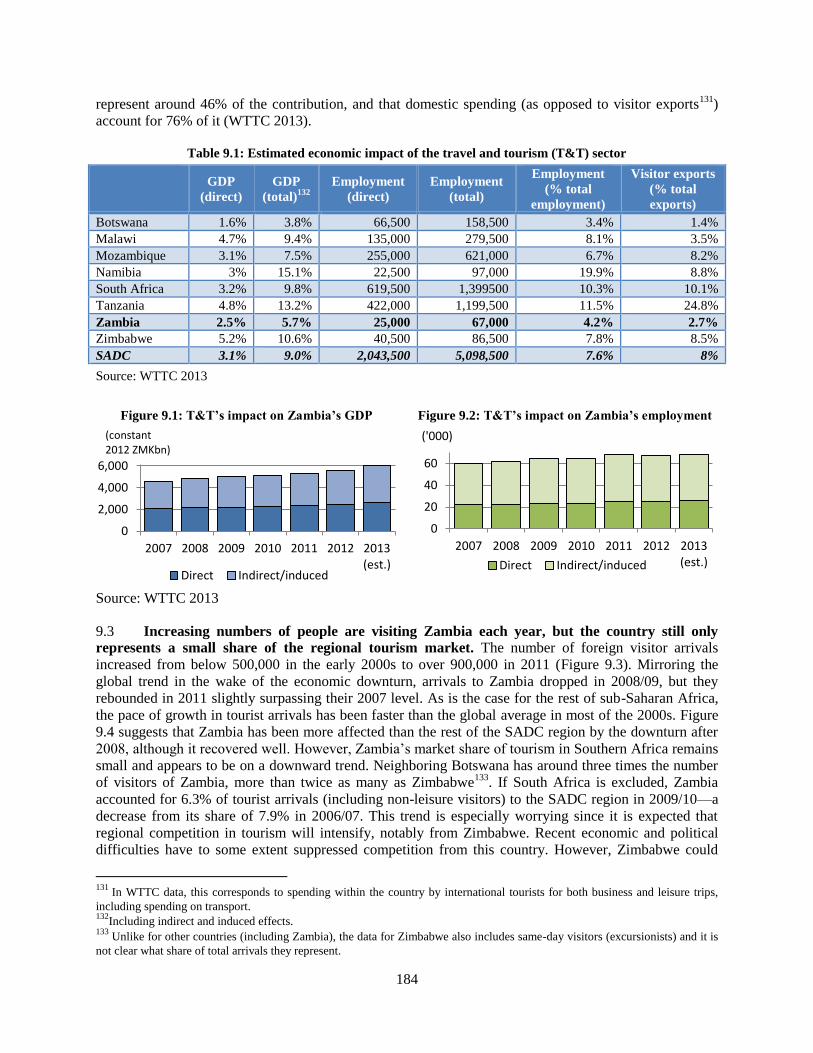
184
represent around 46% of the contribution, and that domestic spending (as opposed to visitor exports131
)
account for 76% of it (WTTC 2013).
Table 9.1: Estimated economic impact of the travel and tourism (T&T) sector
GDP
(direct)
GDP
(total)132
Employment
(direct)
Employment
(total)
Employment
(% total
employment)
Visitor exports
(% total
exports)
Botswana 1.6% 3.8% 66,500 158,500 3.4% 1.4%
Malawi 4.7% 9.4% 135,000 279,500 8.1% 3.5%
Mozambique 3.1% 7.5% 255,000 621,000 6.7% 8.2%
Namibia 3% 15.1% 22,500 97,000 19.9% 8.8%
South Africa 3.2% 9.8% 619,500 1,399500 10.3% 10.1%
Tanzania 4.8% 13.2% 422,000 1,199,500 11.5% 24.8%
Zambia 2.5% 5.7% 25,000 67,000 4.2% 2.7%
Zimbabwe 5.2% 10.6% 40,500 86,500 7.8% 8.5%
SADC 3.1% 9.0% 2,043,500 5,098,500 7.6% 8%
Source: WTTC 2013
Figure 9.1: T&T’s impact on Zambia’s GDP
Figure 9.2: T&T’s impact on Zambia’s employment
Source: WTTC 2013
9.3 Increasing numbers of people are visiting Zambia each year, but the country still only
represents a small share of the regional tourism market. The number of foreign visitor arrivals
increased from below 500,000 in the early 2000s to over 900,000 in 2011 (Figure 9.3). Mirroring the
global trend in the wake of the economic downturn, arrivals to Zambia dropped in 2008/09, but they
rebounded in 2011 slightly surpassing their 2007 level. As is the case for the rest of sub-Saharan Africa,
the pace of growth in tourist arrivals has been faster than the global average in most of the 2000s. Figure
9.4 suggests that Zambia has been more affected than the rest of the SADC region by the downturn after
2008, although it recovered well. However, Zambia’s market share of tourism in Southern Africa remains
small and appears to be on a downward trend. Neighboring Botswana has around three times the number
of visitors of Zambia, more than twice as many as Zimbabwe133
. If South Africa is excluded, Zambia
accounted for 6.3% of tourist arrivals (including non-leisure visitors) to the SADC region in 2009/10—a
decrease from its share of 7.9% in 2006/07. This trend is especially worrying since it is expected that
regional competition in tourism will intensify, notably from Zimbabwe. Recent economic and political
difficulties have to some extent suppressed competition from this country. However, Zimbabwe could
131
In WTTC data, this corresponds to spending within the country by international tourists for both business and leisure trips,
including spending on transport. 132
Including indirect and induced effects. 133
Unlike for other countries (including Zambia), the data for Zimbabwe also includes same-day visitors (excursionists) and it is
not clear what share of total arrivals they represent.
0
2,000
4,000
6,000
2007 2008 2009 2010 2011 2012 2013(est.)
Direct Indirect/induced
(constant 2012 ZMKbn)
0
20
40
60
2007 2008 2009 2010 2011 2012 2013(est.)Direct Indirect/induced
('000)
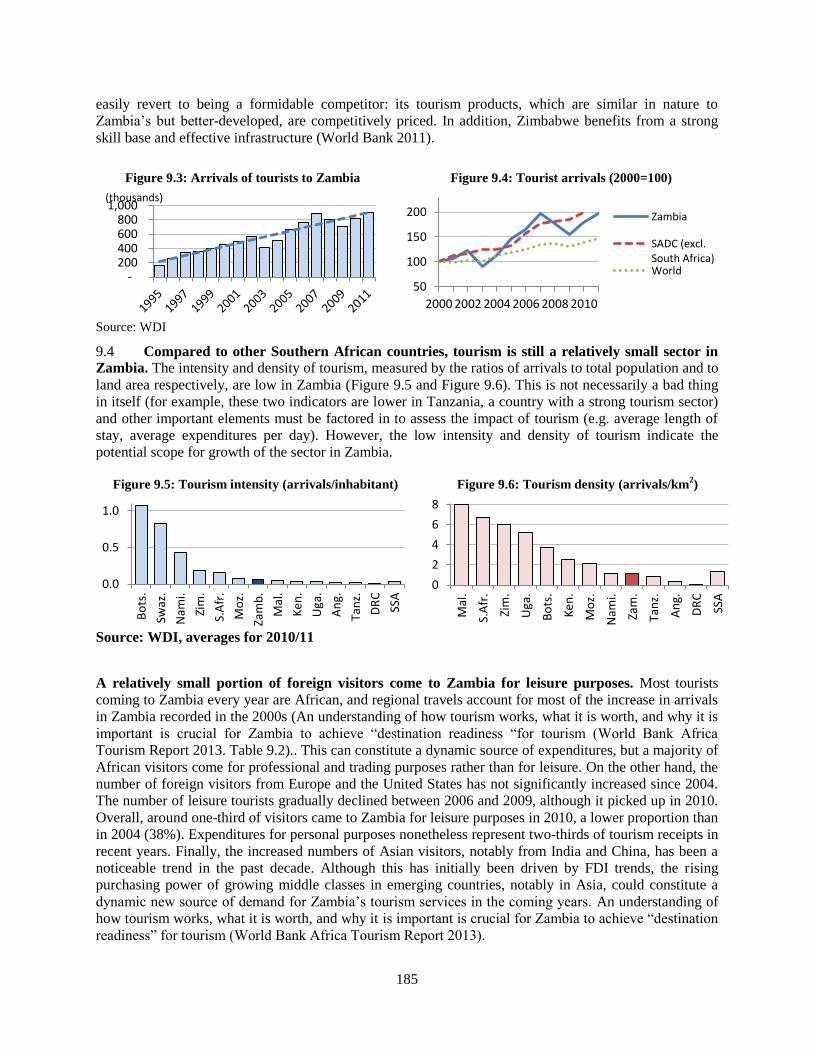
185
easily revert to being a formidable competitor: its tourism products, which are similar in nature to
Zambia’s but better-developed, are competitively priced. In addition, Zimbabwe benefits from a strong
skill base and effective infrastructure (World Bank 2011).
Figure 9.3: Arrivals of tourists to Zambia
Figure 9.4: Tourist arrivals (2000=100)
Source: WDI
9.4 Compared to other Southern African countries, tourism is still a relatively small sector in
Zambia. The intensity and density of tourism, measured by the ratios of arrivals to total population and to
land area respectively, are low in Zambia (Figure 9.5 and Figure 9.6). This is not necessarily a bad thing
in itself (for example, these two indicators are lower in Tanzania, a country with a strong tourism sector)
and other important elements must be factored in to assess the impact of tourism (e.g. average length of
stay, average expenditures per day). However, the low intensity and density of tourism indicate the
potential scope for growth of the sector in Zambia.
Figure 9.5: Tourism intensity (arrivals/inhabitant)
Figure 9.6: Tourism density (arrivals/km2)
Source: WDI, averages for 2010/11
A relatively small portion of foreign visitors come to Zambia for leisure purposes. Most tourists
coming to Zambia every year are African, and regional travels account for most of the increase in arrivals
in Zambia recorded in the 2000s (An understanding of how tourism works, what it is worth, and why it is
important is crucial for Zambia to achieve “destination readiness “for tourism (World Bank Africa
Tourism Report 2013. Table 9.2).. This can constitute a dynamic source of expenditures, but a majority of
African visitors come for professional and trading purposes rather than for leisure. On the other hand, the
number of foreign visitors from Europe and the United States has not significantly increased since 2004.
The number of leisure tourists gradually declined between 2006 and 2009, although it picked up in 2010.
Overall, around one-third of visitors came to Zambia for leisure purposes in 2010, a lower proportion than
in 2004 (38%). Expenditures for personal purposes nonetheless represent two-thirds of tourism receipts in
recent years. Finally, the increased numbers of Asian visitors, notably from India and China, has been a
noticeable trend in the past decade. Although this has initially been driven by FDI trends, the rising
purchasing power of growing middle classes in emerging countries, notably in Asia, could constitute a
dynamic new source of demand for Zambia’s tourism services in the coming years. An understanding of
how tourism works, what it is worth, and why it is important is crucial for Zambia to achieve “destination
readiness” for tourism (World Bank Africa Tourism Report 2013).
- 200 400 600 800
1,000(thousands)
50
100
150
200
2000 2002 2004 2006 2008 2010
Zambia
SADC (excl.South Africa)World
0.0
0.5
1.0
Bo
ts.
Swaz
.
Nam
i.
Zim
.
S.A
fr.
Mo
z.
Zam
b.
Mal
.
Ke
n.
Uga
.
An
g.
Tan
z.
DR
C
SSA
0
2
4
6
8
Mal
.
S.A
fr.
Zim
.
Uga
.
Bo
ts.
Ke
n.
Mo
z.
Nam
i.
Zam
.
Tan
z.
An
g.
DR
C
SSA
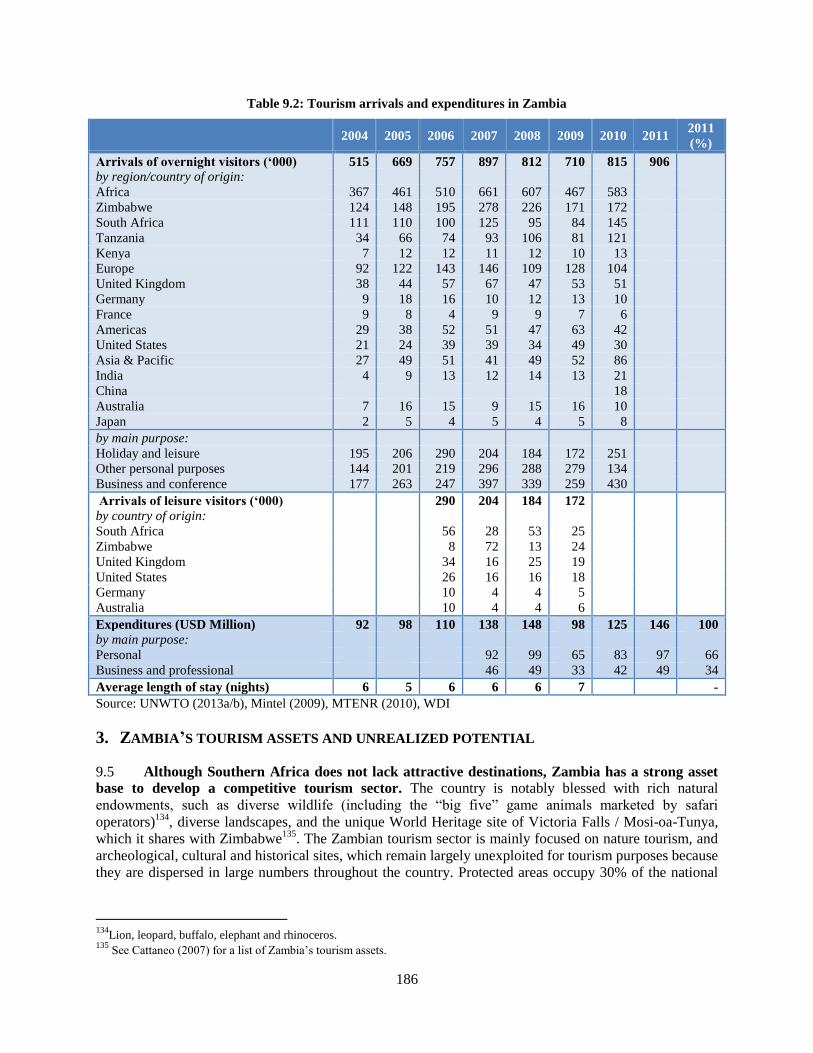
186
Table 9.2: Tourism arrivals and expenditures in Zambia
2004 2005 2006 2007 2008 2009 2010 2011
2011
(%)
Arrivals of overnight visitors (‘000) 515 669 757 897 812 710 815 906
by region/country of origin:
- Africa 367 461 510 661 607 467 583
Zimbabwe 124 148 195 278 226 171 172
South Africa 111 110 100 125 95 84 145
Tanzania 34 66 74 93 106 81 121
Kenya 7 12 12 11 12 10 13
- Europe 92 122 143 146 109 128 104
United Kingdom 38 44 57 67 47 53 51
Germany 9 18 16 10 12 13 10
France 9 8 4 9 9 7 6
- Americas 29 38 52 51 47 63 42
United States 21 24 39 39 34 49 30
- Asia & Pacific 27 49 51 41 49 52 86
India 4 9 13 12 14 13 21
China 18
Australia 7 16 15 9 15 16 10
Japan 2 5 4 5 4 5 8
by main purpose:
Holiday and leisure 195 206 290 204 184 172 251
Other personal purposes 144 201 219 296 288 279 134
Business and conference 177 263 247 397 339 259 430
1. Arrivals of leisure visitors (‘000) 290 204 184 172
by country of origin:
South Africa 56 28 53 25
Zimbabwe 8 72 13 24
United Kingdom 34 16 25 19
United States 26 16 16 18
Germany 10 4 4 5
Australia 10 4 4 6
2. Expenditures (USD Million) 92 98 110 138 148 98 125 146 100
by main purpose:
Personal 92 99 65 83 97 66
Business and professional 46 49 33 42 49 34
4. Average length of stay (nights) 6 5 6 6 6 7 -
Source: UNWTO (2013a/b), Mintel (2009), MTENR (2010), WDI
3. ZAMBIA’S TOURISM ASSETS AND UNREALIZED POTENTIAL
9.5 Although Southern Africa does not lack attractive destinations, Zambia has a strong asset
base to develop a competitive tourism sector. The country is notably blessed with rich natural
endowments, such as diverse wildlife (including the “big five” game animals marketed by safari
operators)134
, diverse landscapes, and the unique World Heritage site of Victoria Falls / Mosi-oa-Tunya,
which it shares with Zimbabwe135
. The Zambian tourism sector is mainly focused on nature tourism, and
archeological, cultural and historical sites, which remain largely unexploited for tourism purposes because
they are dispersed in large numbers throughout the country. Protected areas occupy 30% of the national
134
Lion, leopard, buffalo, elephant and rhinoceros. 135
See Cattaneo (2007) for a list of Zambia’s tourism assets.
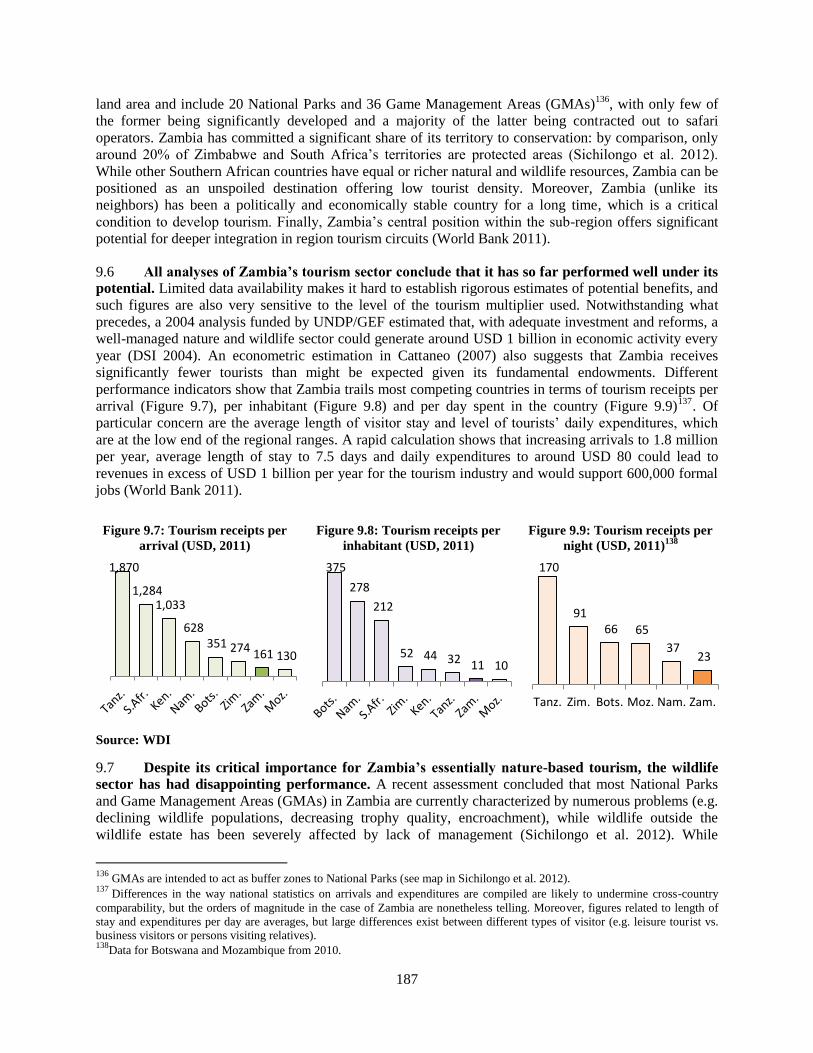
187
land area and include 20 National Parks and 36 Game Management Areas (GMAs)136
, with only few of
the former being significantly developed and a majority of the latter being contracted out to safari
operators. Zambia has committed a significant share of its territory to conservation: by comparison, only
around 20% of Zimbabwe and South Africa’s territories are protected areas (Sichilongo et al. 2012).
While other Southern African countries have equal or richer natural and wildlife resources, Zambia can be
positioned as an unspoiled destination offering low tourist density. Moreover, Zambia (unlike its
neighbors) has been a politically and economically stable country for a long time, which is a critical
condition to develop tourism. Finally, Zambia’s central position within the sub-region offers significant
potential for deeper integration in region tourism circuits (World Bank 2011).
9.6 All analyses of Zambia’s tourism sector conclude that it has so far performed well under its
potential. Limited data availability makes it hard to establish rigorous estimates of potential benefits, and
such figures are also very sensitive to the level of the tourism multiplier used. Notwithstanding what
precedes, a 2004 analysis funded by UNDP/GEF estimated that, with adequate investment and reforms, a
well-managed nature and wildlife sector could generate around USD 1 billion in economic activity every
year (DSI 2004). An econometric estimation in Cattaneo (2007) also suggests that Zambia receives
significantly fewer tourists than might be expected given its fundamental endowments. Different
performance indicators show that Zambia trails most competing countries in terms of tourism receipts per
arrival (Figure 9.7), per inhabitant (Figure 9.8) and per day spent in the country (Figure 9.9)137
. Of
particular concern are the average length of visitor stay and level of tourists’ daily expenditures, which
are at the low end of the regional ranges. A rapid calculation shows that increasing arrivals to 1.8 million
per year, average length of stay to 7.5 days and daily expenditures to around USD 80 could lead to
revenues in excess of USD 1 billion per year for the tourism industry and would support 600,000 formal
jobs (World Bank 2011).
Figure 9.7: Tourism receipts per
arrival (USD, 2011)
Figure 9.8: Tourism receipts per
inhabitant (USD, 2011)
Figure 9.9: Tourism receipts per
night (USD, 2011)138
Source: WDI
9.7 Despite its critical importance for Zambia’s essentially nature-based tourism, the wildlife
sector has had disappointing performance. A recent assessment concluded that most National Parks
and Game Management Areas (GMAs) in Zambia are currently characterized by numerous problems (e.g.
declining wildlife populations, decreasing trophy quality, encroachment), while wildlife outside the
wildlife estate has been severely affected by lack of management (Sichilongo et al. 2012). While
136
GMAs are intended to act as buffer zones to National Parks (see map in Sichilongo et al. 2012). 137
Differences in the way national statistics on arrivals and expenditures are compiled are likely to undermine cross-country
comparability, but the orders of magnitude in the case of Zambia are nonetheless telling. Moreover, figures related to length of
stay and expenditures per day are averages, but large differences exist between different types of visitor (e.g. leisure tourist vs.
business visitors or persons visiting relatives). 138
Data for Botswana and Mozambique from 2010.
1,870
1,284 1,033
628 351 274 161 130
375
278
212
52 44 32 11 10
170
91 66 65
37 23
Tanz. Zim. Bots. Moz. Nam. Zam.
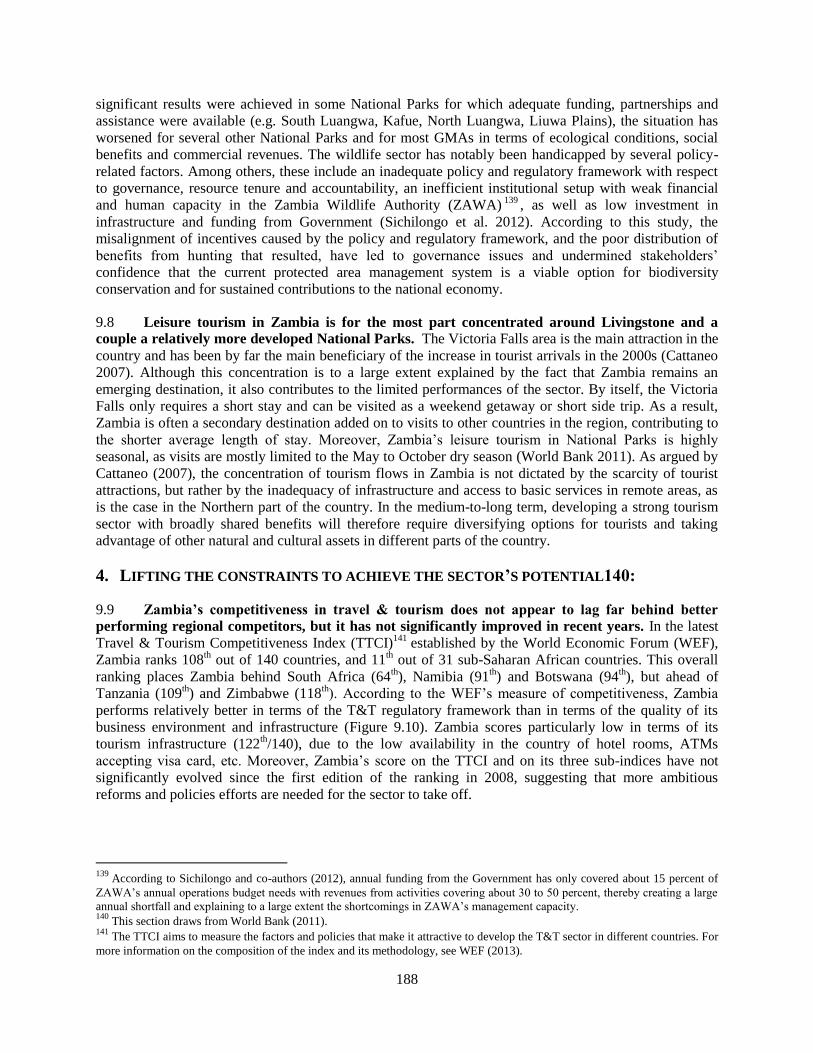
188
significant results were achieved in some National Parks for which adequate funding, partnerships and
assistance were available (e.g. South Luangwa, Kafue, North Luangwa, Liuwa Plains), the situation has
worsened for several other National Parks and for most GMAs in terms of ecological conditions, social
benefits and commercial revenues. The wildlife sector has notably been handicapped by several policy-
related factors. Among others, these include an inadequate policy and regulatory framework with respect
to governance, resource tenure and accountability, an inefficient institutional setup with weak financial
and human capacity in the Zambia Wildlife Authority (ZAWA)139
, as well as low investment in
infrastructure and funding from Government (Sichilongo et al. 2012). According to this study, the
misalignment of incentives caused by the policy and regulatory framework, and the poor distribution of
benefits from hunting that resulted, have led to governance issues and undermined stakeholders’
confidence that the current protected area management system is a viable option for biodiversity
conservation and for sustained contributions to the national economy.
9.8 Leisure tourism in Zambia is for the most part concentrated around Livingstone and a
couple a relatively more developed National Parks. The Victoria Falls area is the main attraction in the
country and has been by far the main beneficiary of the increase in tourist arrivals in the 2000s (Cattaneo
2007). Although this concentration is to a large extent explained by the fact that Zambia remains an
emerging destination, it also contributes to the limited performances of the sector. By itself, the Victoria
Falls only requires a short stay and can be visited as a weekend getaway or short side trip. As a result,
Zambia is often a secondary destination added on to visits to other countries in the region, contributing to
the shorter average length of stay. Moreover, Zambia’s leisure tourism in National Parks is highly
seasonal, as visits are mostly limited to the May to October dry season (World Bank 2011). As argued by
Cattaneo (2007), the concentration of tourism flows in Zambia is not dictated by the scarcity of tourist
attractions, but rather by the inadequacy of infrastructure and access to basic services in remote areas, as
is the case in the Northern part of the country. In the medium-to-long term, developing a strong tourism
sector with broadly shared benefits will therefore require diversifying options for tourists and taking
advantage of other natural and cultural assets in different parts of the country.
4. LIFTING THE CONSTRAINTS TO ACHIEVE THE SECTOR’S POTENTIAL140:
9.9 Zambia’s competitiveness in travel & tourism does not appear to lag far behind better
performing regional competitors, but it has not significantly improved in recent years. In the latest
Travel & Tourism Competitiveness Index (TTCI)141
established by the World Economic Forum (WEF),
Zambia ranks 108th out of 140 countries, and 11
th out of 31 sub-Saharan African countries. This overall
ranking places Zambia behind South Africa (64th), Namibia (91
th) and Botswana (94
th), but ahead of
Tanzania (109th) and Zimbabwe (118
th). According to the WEF’s measure of competitiveness, Zambia
performs relatively better in terms of the T&T regulatory framework than in terms of the quality of its
business environment and infrastructure (Figure 9.10). Zambia scores particularly low in terms of its
tourism infrastructure (122th/140), due to the low availability in the country of hotel rooms, ATMs
accepting visa card, etc. Moreover, Zambia’s score on the TTCI and on its three sub-indices have not
significantly evolved since the first edition of the ranking in 2008, suggesting that more ambitious
reforms and policies efforts are needed for the sector to take off.
139
According to Sichilongo and co-authors (2012), annual funding from the Government has only covered about 15 percent of
ZAWA’s annual operations budget needs with revenues from activities covering about 30 to 50 percent, thereby creating a large
annual shortfall and explaining to a large extent the shortcomings in ZAWA’s management capacity. 140
This section draws from World Bank (2011). 141
The TTCI aims to measure the factors and policies that make it attractive to develop the T&T sector in different countries. For
more information on the composition of the index and its methodology, see WEF (2013).
189
Figure 9.10:Competitiveness of Zambia’s travel & tourism sector in regional perspective
9.10 Reaching Zambia’s potential in tourism will require policy efforts on several dimensions of
competitiveness. As argued in a recent assessment of the sector’s competitiveness, increased investment
in tourism (both domestic and foreign), visitor numbers, length of stay and expenditures could be
achieved by addressing constraints on (i) the supply-side, by influencing businesses’ decisions on
whether/where to invest; (ii) the demand-side, by enhancing Zambia’s appeal to tourists and travel agents;
and (iii) the enabling environment, by enhancing the regulatory and authorizing environments within
which the industry operates.
5. SUPPLY-SIDE FACTORS
- Cost of supplies
9.11 The high costs of certain important inputs for the tourism sector put Zambia at a
disadvantage. In Zambia, a large proportion of the tourism industry’s supply requirements are met
through imports, mainly from South Africa, with roughly half of purchases being locally produced142
.
Zambian operators pay high premiums (largely related to customs and excise duties) for imports over
what the goods cost in South Africa. This puts the operators at a competitive disadvantage, and the
situation for small and rural operators, which are faced with additional transportation costs and/or unable
to buy in bulk, is even worse. One example is wine and spirits, which are demanded by tourists and must
be imported but attract high customs duty (25%) and excise (125%) rates143
, significantly higher than in
other countries in the region. Petrol is also much more expensive in Zambia than in South Africa. In other
cases, lack of domestic competition and non-tariff barriers have long artificially inflated the price of
major inputs for investment in tourism facilities, such as cement144
. This shows the importance of
establishing a dialogue between the authorities and tourism operators on tourism input costs in Zambia
and the impact of tariff and non-tariff measures on these costs. Several tax exemptions granted to tourism
activities or inputs in the 2013 budget145
are a step in the right direction, but they are still limited and
some are only temporary measures aimed at encouraging the upgrading/construction of tourism facilities
in light of the August 2013 UNWTO Conference in Livingstone.
142
In comparison, in Kenya around 87 percent of the industry’s purchases are locally produced. Even the estimate for Zambia
may be an overestimate, as it is thought to include goods purchased locally but which were manufactured in other countries
(World Bank 2011). 143
http://www.zra.org.zm/CH21-29.pdf 144
The market structure for cement has however recently improved, with some price convergence, although it remains expensive
in Zambia and there are still suspicions of regional entente by dominant players. 145
These include: VAT zero-rating of tour guide services; extension of VAT zero-rating of adventure tourism activities to local
tourists; removal of customs duties on water vessels used for aquatic touristic activities; temporary suspension of customs duties
on selected motor vehicles used by tourism operators and on goods to refurbish or expand tourism facilities, for the 2013
UNWTO Conference in Livingstone (http://www.zra.org.zm/BudgetHighlights_2013.pdf).
0
1
2
3
4
5
Regulatoryframework
Human, cultural &natural resources
Businessenvironment &infrastructure
South Africa (64)
Namibia (91)
Botswana (94)
Kenya (96)
Rwanda (105)
Zambia (108)
Tanzania (109)
Zimbabwe (118)
Malawi (124)Source: WEF (2013). Note: 2013 TTCI ranking in parentheses
190
9.12 Furthermore, promoting greater backward linkages and local sourcing of inputs for which
domestic capacity exists at satisfying quality and cost can also be a means of reducing the cost of
operating tourist facilities. This could benefit local producers, while lowering the cost of key inputs such
as food and beverages may also translate into lower prices and improved value-for-money for tourists,
thereby influencing the demand side of the equation as well.
- Labor productivity
9.13 Improved labor productivity could contribute to lower operating costs. As a human resource-
intensive industry, labor is a major component of the costs of operating tourism enterprises. Cost is a
function of the financial remuneration paid to employees in the form of basic wages and additional
allowances, as well as employees’ efficiency/productivity in getting tasks done. On average, basic wages
on their own are reasonable compared to those in other countries in the region. However, high benefits
remove the cost advantage that low basic wages might otherwise provide. At 9 percent, non-wage costs in
Zambia are among the highest in the region. Only Tanzania has a higher share (16 percent), while it is 4
percent or lower in Kenya, South Africa, Botswana, Namibia, Zimbabwe, and Malawi. Labor productivity
in Zambia as a whole lags behind the best international standards but is reasonable compared to other
countries in the region. There is a vast productivity gap between large and small businesses, however,
with MSMEs much less productive. A lack of motivation caused by an inadequate link between pay and
performance, and weak skills due to a lack of both training and exposure to international service
standards, are two key factors underlying poor labor productivity.
- Access to finance
9.14 Easier access to and lower cost of finance could facilitate greater investment in the tourism
industry. For Zambian non-agricultural firms, including those in the tourism industry, access to banking
services is associated with 44 percent higher productivity. Yet, while large businesses have near-universal
access to banking services and nearly half use financial credit, MSMEs (particularly those that are locally
owned) rarely have such access. Without credit, small enterprises must instead grow at a slower pace
supported by cash flow from operations, and this limits the growth of the sector. In relation to finance, the
tourism industry faces a number of problems including: (i) high interest rates; (ii) high collateral
requirements; (iii) lack of the long-term finance that would facilitate the large upfront capital investments
in facilities that have a long payback period; and (iv) banks’ limited understanding of the industry.
Encouragingly, average commercial bank lending rates reduced sharply in 2012, from 24 percent at the
beginning of the year to 16.3 in December 2012 (World Bank 2013). Private sector credit responded by
growing rapidly in the second half of this year, but this has mostly been driven by loans to the agriculture,
mining, transport and communication sectors. It remains to be seen whether tourism operators, notably
small ones, will benefit from this trend.
6. DEMAND-SIDE FACTORS
- Destination marketing
9.15 More extensive and more effective destination marketing could increase awareness and
demand. While the opportunity for tourism (especially in Africa) is large, global and regional
competition is strong and accelerating. Hence, unless Zambia can create a compelling brand and a much
greater awareness of the country worldwide, it will have difficulty competing with other, better-known
destinations in the region. Despite this, the Government’s expenditure on tourism marketing has
traditionally been low relative to other countries in the region. In 2004, the Government was spending
US$1.5 million annually on destination marketing, just a quarter of the next lowest regional competitor
(Namibia) and one twelfth of Tanzania’s investment. Although the Government budget allocation to
191
tourism marketing has recently experienced a tenfold increase, the absolute amount remains low relative
to other countries. Hence the private sector undertakes much of the marketing itself. The efficacy of
marketing is as important as the level of spending: the quality of marketing materials and campaigns is
vital to achieving a return on the marketing investment. A modernization effort was made with the
adoption of a new tourism brand – “Zambia, Let’s Explore” – in late 2011146
.In addition, Zambia does not
know enough about its existing and potential tourism source markets to support effective marketing and
sector growth, and its products and “unique selling points” are not well-defined. This suggests a need for
more market research on the tourist customer and on tour agent behavior. The latter is particularly
important, as accessing international tourist source markets depends heavily on general sales agents and
foreign tour operators.
- Upgrading and diversification of attractions
9.16 Upgrading and diversifying Zambia’s attractions and locations could help to attract more
tourists and extend their length of stay. In order to penetrate new markets, attract more returning
customers, and increase tourists’ length of stay, Zambia will need a sufficiently diverse and appealing
tourism product base. This will mean broadening the range of attractions offered, with an emphasis on
moving beyond nature-based tourism, as well as diversifying the geographic locations within Zambia that
tourists can visit. The latter will be particularly important in bringing the economic benefits of tourism to
new, rural parts of the country. Although Zambia has high-quality nature offerings and a world-class site
in Victoria Falls, several other countries in the region have national parks and safari options of
comparable quality to Zambia’s. Notably, Victoria Falls is shared with Zimbabwe. While Zambia has
potential tourism assets outside of the well-developed the Victoria Falls/Livingstone area, these have not
been developed sufficiently. Offerings that build off Zambia’s cultural and other non-wildlife assets in
outlying areas can help diversify both the type and the location of tourism, but will require investment in
building a critical mass of supply and ensuring the availability of sufficient infrastructure and facilities to
meet tourists’ needs.
- Accessibility to and within Zambia
9.17 Travel to and within Zambia could be made cheaper and more convenient, thereby
increasing demand. Domestic transportation accounts for a substantial share of tourists’ in-country
expenditures (18 percent for nature tourists). Inadequate and/or inconvenient travel options constrain
tourists’ choices of itineraries and long travel times reduce the time spent seeing sights or participating in
activities. Therefore, in order for tourists to be enticed to stay longer and travel to outlying areas of the
country, improvements in the affordability and convenience of domestic travel (both air and road) are
crucial. Domestic airfares in Zambia are more expensive than in several other countries in the region,
estimated at double those in Kenya and Botswana. Zambia has only one domestic airline (and therefore
no competitive pressure on price) and a limited number of routes and flights (adversely impacting
convenience). High costs of jet fuel, the use of small aircrafts and a lack of economies of scale (both due
to limited demand) also contribute to higher domestic airfares. However, domestic travel faces a ‘chicken-
egg’ problem: with a lack of competition contributing to high airfares, tourists are discouraged. At the
same time, the small number of tourists may not, at this point in time, justify a need for an additional
domestic airline.
9.18 For long-haul tourists, the cost and convenience of international flights to Zambia is also
important. A sample of pricing data suggests that international airfares to Zambia are mid-range in the
146
At time of DTIS preparation in May 2013, the new logo was present on the Zambia Tourism Board website
(http://www.zambiatourism.com/welcome.htm), but the new motto “Let’s Explore” was not found on the site and visitors were
invited to explore “the real Africa”, corresponding to the previous slogan.
192
region, but consistently higher than those to Kenya, Tanzania and South Africa (which compete with
Zambia as safari destinations). To improve convenience, tourism operators would like to see more direct
international flight options from key source markets in the United States and Europe.
9.19 The poor quality of domestic roads also constrains both supply and demand, particularly in
remote areas. Poor all-weather road infrastructure limits the operating season for lodges and other tourism
facilities in many areas. As a result, the period in which operators can earn revenues can be significantly
less than twelve months (for some areas, as little as six months). This has a negative impact on
profitability and/or may result in prices that are higher than they would otherwise be (to allow operators
to cover their fixed costs over a shorter, seasonal, operating period). While neighboring countries such as
South Africa and Namibia enjoy a significant volume of self-drive tourists (both domestic and
international), Zambia’s poor road infrastructure severely limits its attraction to self-drive visitors.
7. ENABLING ENVIRONMENT
- Regulatory and institutional framework
9.20 Streamlining administrative requirements and increasing the stability and predictability of
the regulatory regime should be a priority. According to Cattaneo (2007), up to 74 licenses can be
requested to operate a hotel that offers different activities, which can be a costly, complex and long
process. Given substantial investments in land, equipment and facilities and the time taken to generate
demand and revenues, tourism investments tend to have long payback periods. At the same time, prices
for international tour operators are set, and reservations made, well in advance of a tourist’s actual arrival.
Sudden changes can have a large impact on returns because many tourism businesses cannot easily adjust
their prices accordingly. Similarly, changes not anticipated at the time an investment is made, but which
occur during the long period before which the operation starts to yield a positive return, can take away
from profitability. Such changes have been problematic for tourism operators in Zambia in recent years.
For example, an announcement made in January 2010, with less than one week’s notice and no public
commentary, substantially raised fees for businesses operating around the Victoria Falls. Frequent
regulatory changes may in part be due to a lack of coordination among the multiple governing agencies
whose regulations impact the tourism industry. The institutional environment is also problematic: six
public and more than a dozen private bodies are involved in the sector’s management with only limited
efforts at coordination. Surveys of tourism businesses suggest that as many as 90 percent regard these
bodies as either unprofessional and obstructive or inefficient and unpredictable (Cattaneo 2007).
9.21 Regulatory modernization efforts underway must be pushed forward. In recent years, the
Government embarked on a Business Licensing Reform Program, designed to reduce compliance costs
for licensing businesses and encourage the regulatory—as opposed to the revenue generation—function.
Modernized versions of the Tourism & Hospitality Act and of the Tourism Policy were finalized in early
2011 but have not been passed since then, although the Government recently reemphasized its willingness
to move forward with the adoption of these texts. It is important to ensure that regulatory improvements
benefit all actors in the sectors: while compliance with rules may be easier for larger established
operators, who also often benefit from specific exemptions from certain taxes147
, complex rules are likely
to impose a larger burden on smaller actors and can discourage the entry of new ones.
9.22 At present, investment in the nature and wildlife sector remains complicated and costly. The
high number of licenses required by the current Wildlife Act is not aligned with the national licensing
reform. If the new Tourism & Hospitality Act was more aligned with this reform, it would decrease the
147
Certain tourism service providers (for example, Sun International, a foreign firm with large investments in Livingstone) have
succeeded in negotiating a lower corporate tax, and tourism in the Livingstone region is exempted from VAT (Cattaneo 2007).
193
cost of doing business in the tourism sector (Sichilongo et al. 2012). Investors in nature-tourism face, in
addition to all the general cost of doing tourism-business in Zambia, the added cost of doing tourism-
business in a protected area. While the Wildlife Act is clear on the procedure of obtaining a concession
and investing in GMAs or National Parks, it does add a layer of complication and cost. It also does not
provide sufficient investment security such as through adequate tenure, to be attractive to investors. As a
consequence, only the few flagship parks have been able to attract investors (Sichilongo et al. 2012).
Aware of the underperformance of the wildlife sector, in 2008, the Zambian Government decided to
restructure ZAWA and augment its annual budget, as well as to revise the 1998 Wildlife Policy and
corresponding legislation, although these changes have still not materialized.
- Competitive environment
9.23 Greater competition in tourism and supporting industries could generate innovation,
improve productivity and reduce costs and prices. Lack of competition contributes significantly to
Zambia’s high cost base and, therefore, the prices ultimately paid by tourists. Dominant market positions
and/or monopolies exist in key support industries such as domestic air travel and cement manufacture, as
well as in certain sub-sectors of the tourism industry itself (e.g. only a few - high-end - lodges operate in
Lower Zambezi National Park). As mentioned above, the lack of competition in the domestic airline and
cement industries is thought to have added a significant premium to prices faced by tourism operators and
tourists in Zambia, although the situation has tended to improve for cement. Political economy factors and
rent-seeking suppress the political will and public pressure for increased competition. While competition
legislation is in place, it has not achieved the desired outcome of improving the quality, coverage and cost
of goods and services.
- Public support
9.24 Stronger support from Government and the wider population could make it easier to do
business in Zambia’s tourism industry. While Government has identified tourism as one of four
industries essential to economic development in Zambia, the level of actual investment (in Kwacha terms)
and support (as measured by legislation/actions that would ease the process of starting/growing a tourism
business) have been low. Perceived by some as an exploitative industry dominated by white foreigners,
tourism has yet to be embraced in a substantive manner. The general population also does not fully
appreciate the potential benefits that the industry offers. The perceived economic impact of the industry
seems to be significantly less than the actual impact and the extent of leakages also tends to be
overestimated. As a consequence, actions are taken—or not taken—that undermine the potential of the
industry to grow and flourish. An example of such an action is the short-termism associated with the 2008
major increase in visa fees, introduced with very little notice and later reversed. Since, on a regional and
global basis, the tourism industry is highly competitive, low levels of support translate into low arrivals
and revenues—as is evident from regional comparisons. Once government and the population recognize
that the industry’s potential economic and social contributions far outweigh the perceived costs (as has
been proven in Mauritius, Namibia and elsewhere), they will have an incentive to improve the enabling
environment. In this regard, the Government could consider making permanent and extending the kind of
incentives offered to tourism operators in order to face the demand arising from the 2013 UNWTO
Conference in Livingstone / Victoria Falls.
- Regional cooperation
9.25 The regional dimension can offer opportunities for tourism development in Zambia,
especially given the country’s central location. Although the objective to become a competitive
standalone destination where tourists spent long stays is a valid one, this is likely to take time. In the
immediate term, better integrating in regional tourism circuits, beyond a simple visit to the Victoria Falls,
194
could be a way to draw more people to Zambia and to strengthen its reputation as a tourism destination.
Zambia should push for initiatives promoting this integration, such as the adoption of the SADC
Univisa148
, which has been planned for many years but continually delayed, or cooperation through the
existing and planned Trans Frontier Conservation Areas (TFCAs)149
in which Zambia participates.
Although significant regulatory obstacles impede cross-border tourism activities and service provision in
the SADC region, Zambia appears to be part of a subgroup of countries which impose few restrictions
(RETOSA 2011).
8. PRIORITIES FOR POLICY ACTION:
9.26 There is a large scope for policy action to enhance the competitiveness of tourism in
Zambia, but efforts must be prioritized. Ensuring follow-through on the Government’s stated objective
to make tourism one of the drivers of economic diversification and inclusive growth in Zambia will
require efforts on all the dimensions identified in the preceding section, regarding supply-side constraints,
demand-side factors and the establishment of a supportive regulatory and policy environment. In the
short-to-medium term, priorities for policy action should include:
- Finalization of the regulatory reform process: the final versions of key policy and legal
documents and amendments (e.g. Tourism & Hospitality Act, Tourism Policy, Wildlife Act,
Policy for National Parks and Wildlife in Zambia) that incorporate comments from all
stakeholders should be adopted and implemented, with a view to streamlining regulatory
requirements and reducing compliance costs.
- Cost of tourism inputs and investment incentives: consultations with the private sector on the
cost of inputs could be organized and exemptions of key inputs from certain taxes and duty rights
could be considered. Likewise, tax incentives granted to exports of non-traditional products
should be extended to services, including tourism150
. Moreover, incentives and exemptions
offered to certain tourism operators or in certain regions could be extended to other actors and
locations, as failing to do so would result in de facto discrimination against domestic service
providers and an accentuation of existing regional inequalities in the development of tourism.
- Management of the wildlife sector: a comprehensive set of recommendation was provided in the
recent assessment of the wildlife sector (Sichilongo et al. 2012). These notably concern the
reorganization and financing of ZAWA; improvements to the management of protected areas
system and GMAs; the development of partnerships between ZAWA and NGOs or other
institutions in the management of protected areas; the encouragement of private wildlife estates
and of the game ranching industry; the promotion of wildlife management outside of protected
areas.
- Marketing efforts and support to the sector: quantitative and qualitative improvements of
marketing efforts are needed, in line with the practices of the main regional competitors. Support
to develop tourism in other regions than Livingstone and the most successful National Parks, for
example in the Northern Provinces, could also be considered.
148
See http://www.retosa.co.za/regional-initiatives/tourist-visa 149
See http://www.peaceparks.org/ 150
See Cattaneo (2007) for an analysis of the tax regime applying to tourism and various incentives that are available or not to
tourism service providers.
195
CHAPTER 10: FINANCIAL SERVICES
1. INTRODUCTION
10.1 Financial liberalization undertaken by successive governments has facilitated competition
and entry of foreign banks. Prior to the liberalization that began in 1992, the sector was characterized by
underdevelopment, inefficient patterns of lending, and many administrative controls (Mudenda 2008). In
the early 1990s, the government decided to put in place a competitive and well-functioning financial
system and enabled the entry of domestic and foreign banks, deregulated borrowing and lending rates and
fully liberalized transactions on the capital account. Financial liberalization led to a credit boom between
1993 and 1995 followed by a series of bank failures in 1995 and 1996 given that the financial opening
was undertaken without an effective legal, regulatory and supervisory framework. Following the bank
failures, Zambia implemented improvements in regulatory supervision and strengthened the legal and
regulatory frameworks in financial services. The Financial Sector Development Plan (FSDP) was devised
in 2004 to address existing weaknesses in the Zambian financial system.
10.2 Today, a striking feature of Zambia’s services trade policy is its relatively high level of
openness in financial services. The reforms included the liberalization of the interest rate, removal of
exchange rate controls and a shift to a market determined interest rate, development of money and capital
markets, improvements to the payments system and improvements of the regulatory framework.
Liberalization also permitted up to 100% foreign ownership with restrictions only placed on the
requirement to be locally registered. Cross-border lending and deposit were also allowed. In fact, the
results of a World Bank survey of applied trade policies suggest that Zambia is completely open in
banking services.
10.3 Despite liberalization and reform, Zambia’s financial services remains shallow and
concentrated. The expected benefits of an open financial system are yet to be fully realized. Real lending
rates remain high and the penetration of financial services is low. Generally access is low in Zambia and
concentrated around the urban areas or the mining towns. In fact, access to financial services and
penetration levels have remained largely unchanged since the 2005 DTIS. According to Finscope, only
21.1% of the Zambian population does business with a bank and 23.3% of the population has access to
banking services. 13.6%of the Zambian population has access to insurance services with only 4% being
insured.
2. BRIEF SKETCH OF THE ZAMBIAN FINANCIAL SECTOR
10.4 Despite liberalization and regulatory reforms, the contribution of financial services to GDP
and employment creation is limited. The contribution of financial services to GDP at current market
prices has remained in the 7.3% - 9.5% range and has experienced a slight increase in the last years, from
7.33% in 2012 to 7.73% in 2013151. The financial services sector contributed about 0.13% to overall
employment. According to the Bank of Zambia, employment in the financial sector doubled between
2004 and 2010. The financial sectors employed 8470 Zambians and 37 foreigners in 2010. Most
foreigners were employed as executives or as senior managers.
10.5 The banking sector in Zambia consists of 19 registered commercial banks, is dominated by
foreign banks and is highly concentrated. As of 2013 the banking system consisted of the Bank of
Zambia and 19 commercial banks—sixteen foreign owned, 2 owned by local private investors, and 1
151
2013 Annual Economic Report.Ministry of Finance.Republic of Zambia.
196
jointly owned by the Zambian Government and the Indian Government. 5 new banks have been registered
since September 2008. The size of the market in terms in assets at the end of 2012 was ZMK Trillion
36,617, 951. However, the banking sector is highly concentrated amongst the top 4 banks—Barclays
Bank, Standard Chartered Bank, Stanbic Bank and the Zambia National Commercial Bank (Zanaco)—
which hold approximately 63% of the total bank assets Further, there are many reports on the lack of
competitiveness of the banking sector (e.g., because of similarities in interest rates, fees and products).
10.6 Non-bank financial institutions (NBFIs) complement and compete with commercial banks
and are dominated by microfinance institutions (MFIs), which target retail clients, including micro
entrepreneurs and salaried employees. Prior to issuing the Microfinance Regulations in 2006, Zambia
had only four licensed MFIs. Currently, there are 31 MFIs licensed by the BoZ, with total assets
representing around 3 percent of the regulated financial sector. NBFIs provide financial services that
commercial banks may be unable or unwilling to offer. For example, the Building Societies were set up to
provide housing finance given that the mortgage industry could not develop due to high interest rates.
NBFIs also provide much needed competition to commercial banks to be more efficient and responsive to
customer needs. Some NBFIs were created to address the poor credit culture in Zambia (for example, the
Credit Reference Bureau).Several examples of NBFIS152
in Zambia are provided below:
Leasing Companies provide finance leases and short-term loans. The number of leasing
companies has fluctuated between 7 and 12 over the period 2005 - 2013.
Development Finance Institutions (DFIs) provide medium to long-term finance. Currently, there
is only one DFI, the Development Bank of Zambia (DBZ).
Microfinance and Rural banking institutions deal directly with the public, take deposits, and make
loans to individuals.
Bureau de Change are foreign exchange shops that buy and sell foreign currency in small
quantities and do not take deposits.
Building Societies provide housing finance.
The Credit Reference Bureau facilitates the credit granting process by providing precise
information on borrowers from and to all financial institutions.
10.7 Zambia’s insurance sector is small. Presently, the industry is composed of 2153
Re- Insurance
companies (one local and one foreign), 23 Insurance companies (10 foreign owned and 1 mixed), 1
foreign reinsurance broker, 43 insurance brokers (2 foreign), 252 insurance Agents, 6 loss adjusters, 5 risk
surveyors, 9 motor assessors and 9 claims agents. Nine companies started to operate in 2012. Neither the
life nor the non-life sector is dominated by a single company. Domestic and foreign providers offer
insurance services in Zambia. All entities are licensed and supervised by the Pensions and Insurance
Authority (PIA). The primary insurance companies are divided into two categories, General Insurance
companies and Life Assurance companies. Brokers are excluded from this categorization and are allowed
to offer both life and non-life services. The Insurance Agents are tied to one insurance company whom
they represent in the market. The re-insurance companies provide protection to the primary insurers on
mega risks beyond their retention capacities. There are other auxiliary service providers who offer
specialized services to the industry and they include Loss Adjusters, Risk Surveyors, Motor Assessors,
and Claims Agents.
152
Non-bank Financial Institutions as of January 1 2013 totaled of 8 leasing companies, 4 building societies, 1 development bank,
1 savings and credit bank, 1 Development Finance Institution, 57 Bureaux de Change, 1 Credit Reference Bureau and 35 micro-
finance institutions. These institutions are regulated and supervised by the Bank of Zambia.
153
A third reinsurance company, ZepRe, operates in Zambia, it owned by COMESA member states.
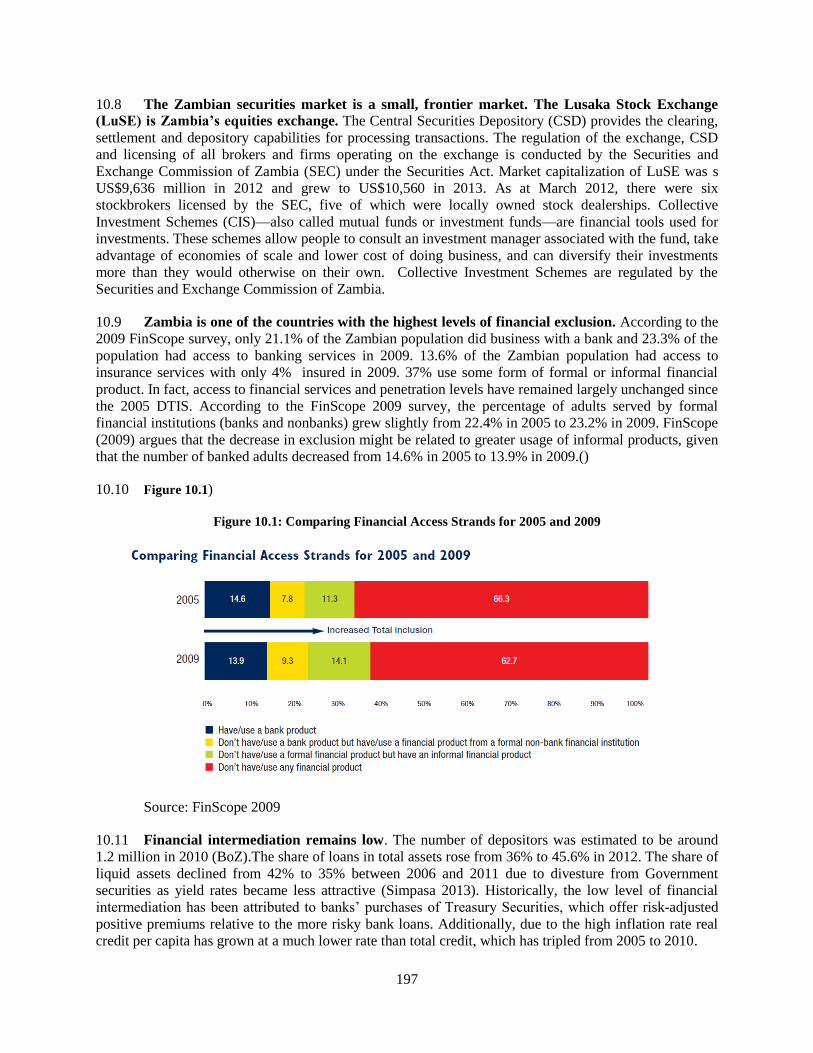
197
10.8 The Zambian securities market is a small, frontier market. The Lusaka Stock Exchange
(LuSE) is Zambia’s equities exchange. The Central Securities Depository (CSD) provides the clearing,
settlement and depository capabilities for processing transactions. The regulation of the exchange, CSD
and licensing of all brokers and firms operating on the exchange is conducted by the Securities and
Exchange Commission of Zambia (SEC) under the Securities Act. Market capitalization of LuSE was s
US$9,636 million in 2012 and grew to US$10,560 in 2013. As at March 2012, there were six
stockbrokers licensed by the SEC, five of which were locally owned stock dealerships. Collective
Investment Schemes (CIS)—also called mutual funds or investment funds—are financial tools used for
investments. These schemes allow people to consult an investment manager associated with the fund, take
advantage of economies of scale and lower cost of doing business, and can diversify their investments
more than they would otherwise on their own. Collective Investment Schemes are regulated by the
Securities and Exchange Commission of Zambia.
10.9 Zambia is one of the countries with the highest levels of financial exclusion. According to the
2009 FinScope survey, only 21.1% of the Zambian population did business with a bank and 23.3% of the
population had access to banking services in 2009. 13.6% of the Zambian population had access to
insurance services with only 4% insured in 2009. 37% use some form of formal or informal financial
product. In fact, access to financial services and penetration levels have remained largely unchanged since
the 2005 DTIS. According to the FinScope 2009 survey, the percentage of adults served by formal
financial institutions (banks and nonbanks) grew slightly from 22.4% in 2005 to 23.2% in 2009. FinScope
(2009) argues that the decrease in exclusion might be related to greater usage of informal products, given
that the number of banked adults decreased from 14.6% in 2005 to 13.9% in 2009.()
10.10 Figure 10.1)
Figure 10.1: Comparing Financial Access Strands for 2005 and 2009
Source: FinScope 2009
10.11 Financial intermediation remains low. The number of depositors was estimated to be around
1.2 million in 2010 (BoZ).The share of loans in total assets rose from 36% to 45.6% in 2012. The share of
liquid assets declined from 42% to 35% between 2006 and 2011 due to divesture from Government
securities as yield rates became less attractive (Simpasa 2013). Historically, the low level of financial
intermediation has been attributed to banks’ purchases of Treasury Securities, which offer risk-adjusted
positive premiums relative to the more risky bank loans. Additionally, due to the high inflation rate real
credit per capita has grown at a much lower rate than total credit, which has tripled from 2005 to 2010.
198
10.12 Many Zambians use informal lending and borrowing arrangements to save. The most
common informal savings mechanism are the ROSCA (rotating saving and credit association), locally
referred to as chilimba. Chilimbas can be used to generate the necessary credit to buy household goods. In
addition to using chilimbas to save and as a mechanism to absorb extra liquidity in the house, friends,
neighbors or colleagues can call for a chilimba to get money for business, school fees, or medicine,
naming themselves as the designated first recipient (FinMarkTrust, 2012)
10.13 While the insurance sector has more than doubled over the last five years, insurance
coverage remains low. In fact, access to insurance services has decreased between 2005 and 2009. In
2009 life-related policies stood at 2.9%, while non-life was at 1.6% of the population. Insurance covers
predominantly the employed or those with a regular income.
10.14 There is a substantive rural urban divide in terms of access to financial services. Bank
product penetration is more than twice as high among urban adults compared to rural adults. The analysis
shows that 22.6 percent of adults in urban areas use a bank product, compared to only 8.6 percent of
adults in rural areas. The informal sector is an important driving force of financial inclusion – with 16.5%
of adults in rural areas and 10.2% of urban adults using only informal products. In urban areas
transactions and savings products are prevalent while in rural credit products are predominant.
10.15 Regional and sectoral dimensions. Lusaka and Copperbelt provinces have the highest numbers
of depositors and borrowers, with Western and Luapula provinces lagging behind. Very few adults (7.5
percent) who rely on farming as an income generating activity use bank products. In fact, 62 percent of
adults who earn money from farming alone do not actually use any formal financial product.
10.16 High levels of financial exclusion seem to be associated with high costs of obtaining financial
products. Among the unbanked population surveyed by the FinScope, more than 5% said they did not
have a bank account because service charges were too high, whereas 14% said they could not maintain
the minimum balance. In the case of insurance, 13% of the uninsured said they could not afford it.
10.17 Interest rates are perceived to be generally high but they are decreasing. Over the last ten
years, average interest rates ranged between 10% and 30%. The volume of lending from the four
dominant banks allowed these institutions to make loans at a lower interest rates, approximately 8
percentage points lower than most banks. The availability of cheaper credit from the big banks to the
smaller banks helped decrease the weighted interbank lending rates, which had a positive impact on
lending rates to consumers. On average lending rates have decreased from 27.5% in 2008 to 17% in 2013
(Figure 10.2). Microfinance institutions (MFIs) generally charged higher rates - some exceeding 100%
per annum. BoZ has introduced interest caps on all Non-Bank Financial institutions (NBFI’s): 42% per
annum for NBFIs classified as microfinance institutions and 30% per annum for other NBFI’s.
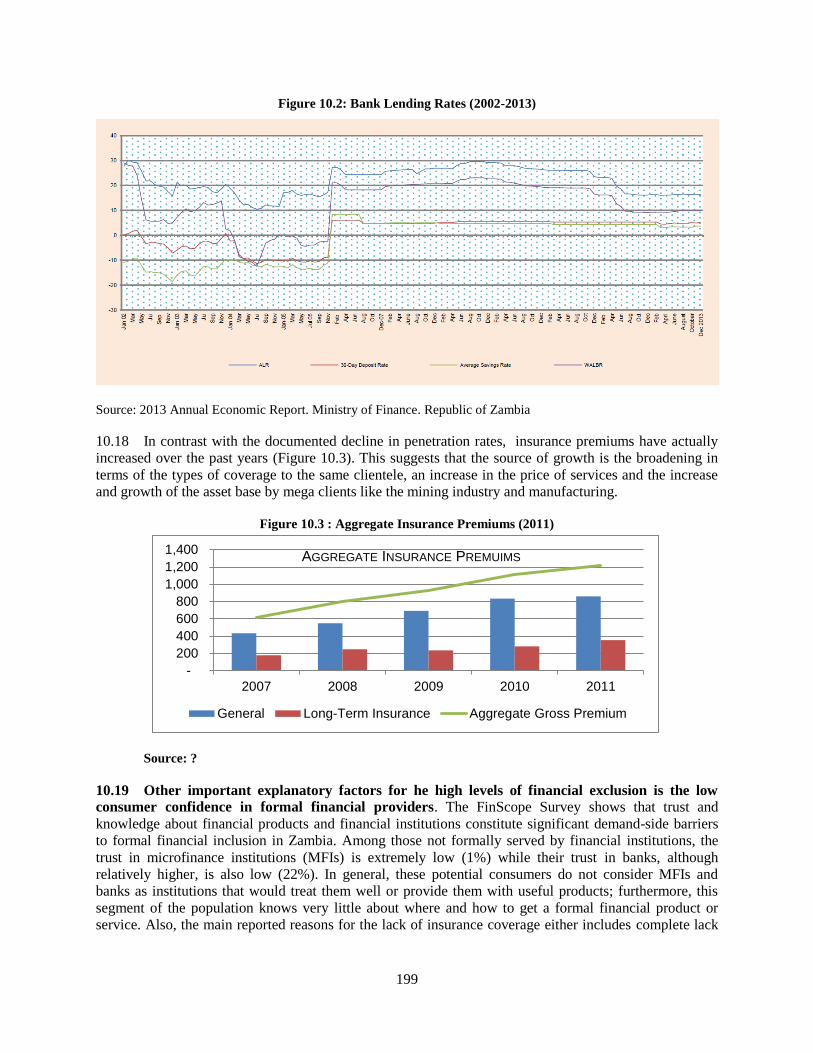
199
Figure 10.2: Bank Lending Rates (2002-2013)
Source: 2013 Annual Economic Report. Ministry of Finance. Republic of Zambia
10.18 In contrast with the documented decline in penetration rates, insurance premiums have actually
increased over the past years (Figure 10.3). This suggests that the source of growth is the broadening in
terms of the types of coverage to the same clientele, an increase in the price of services and the increase
and growth of the asset base by mega clients like the mining industry and manufacturing.
Figure 10.3 : Aggregate Insurance Premiums (2011)
Source: ?
10.19 Other important explanatory factors for he high levels of financial exclusion is the low
consumer confidence in formal financial providers. The FinScope Survey shows that trust and
knowledge about financial products and financial institutions constitute significant demand-side barriers
to formal financial inclusion in Zambia. Among those not formally served by financial institutions, the
trust in microfinance institutions (MFIs) is extremely low (1%) while their trust in banks, although
relatively higher, is also low (22%). In general, these potential consumers do not consider MFIs and
banks as institutions that would treat them well or provide them with useful products; furthermore, this
segment of the population knows very little about where and how to get a formal financial product or
service. Also, the main reported reasons for the lack of insurance coverage either includes complete lack
-
200
400
600
800
1,000
1,200
1,400
2007 2008 2009 2010 2011
AGGREGATE INSURANCE PREMUIMS
General Long-Term Insurance Aggregate Gross Premium
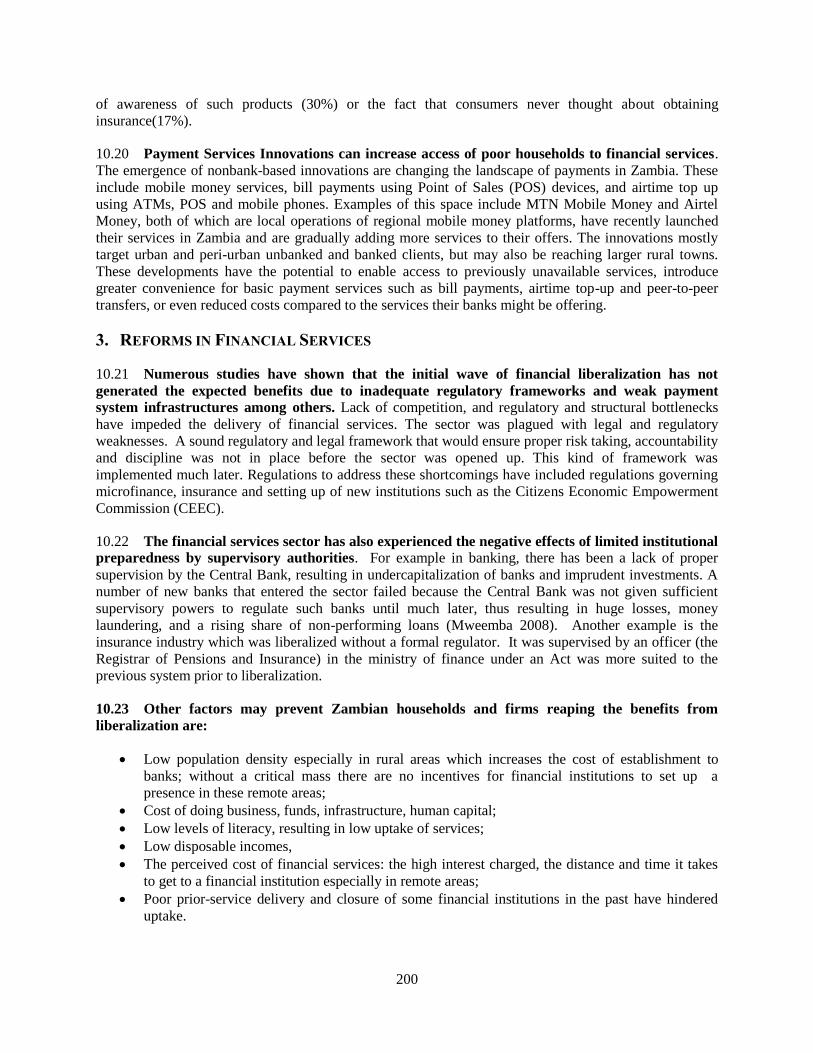
200
of awareness of such products (30%) or the fact that consumers never thought about obtaining
insurance(17%).
10.20 Payment Services Innovations can increase access of poor households to financial services.
The emergence of nonbank-based innovations are changing the landscape of payments in Zambia. These
include mobile money services, bill payments using Point of Sales (POS) devices, and airtime top up
using ATMs, POS and mobile phones. Examples of this space include MTN Mobile Money and Airtel
Money, both of which are local operations of regional mobile money platforms, have recently launched
their services in Zambia and are gradually adding more services to their offers. The innovations mostly
target urban and peri-urban unbanked and banked clients, but may also be reaching larger rural towns.
These developments have the potential to enable access to previously unavailable services, introduce
greater convenience for basic payment services such as bill payments, airtime top-up and peer-to-peer
transfers, or even reduced costs compared to the services their banks might be offering.
3. REFORMS IN FINANCIAL SERVICES
10.21 Numerous studies have shown that the initial wave of financial liberalization has not
generated the expected benefits due to inadequate regulatory frameworks and weak payment
system infrastructures among others. Lack of competition, and regulatory and structural bottlenecks
have impeded the delivery of financial services. The sector was plagued with legal and regulatory
weaknesses. A sound regulatory and legal framework that would ensure proper risk taking, accountability
and discipline was not in place before the sector was opened up. This kind of framework was
implemented much later. Regulations to address these shortcomings have included regulations governing
microfinance, insurance and setting up of new institutions such as the Citizens Economic Empowerment
Commission (CEEC).
10.22 The financial services sector has also experienced the negative effects of limited institutional
preparedness by supervisory authorities. For example in banking, there has been a lack of proper
supervision by the Central Bank, resulting in undercapitalization of banks and imprudent investments. A
number of new banks that entered the sector failed because the Central Bank was not given sufficient
supervisory powers to regulate such banks until much later, thus resulting in huge losses, money
laundering, and a rising share of non-performing loans (Mweemba 2008). Another example is the
insurance industry which was liberalized without a formal regulator. It was supervised by an officer (the
Registrar of Pensions and Insurance) in the ministry of finance under an Act was more suited to the
previous system prior to liberalization.
10.23 Other factors may prevent Zambian households and firms reaping the benefits from
liberalization are:
Low population density especially in rural areas which increases the cost of establishment to
banks; without a critical mass there are no incentives for financial institutions to set up a
presence in these remote areas;
Cost of doing business, funds, infrastructure, human capital;
Low levels of literacy, resulting in low uptake of services;
Low disposable incomes,
The perceived cost of financial services: the high interest charged, the distance and time it takes
to get to a financial institution especially in remote areas;
Poor prior-service delivery and closure of some financial institutions in the past have hindered
uptake.
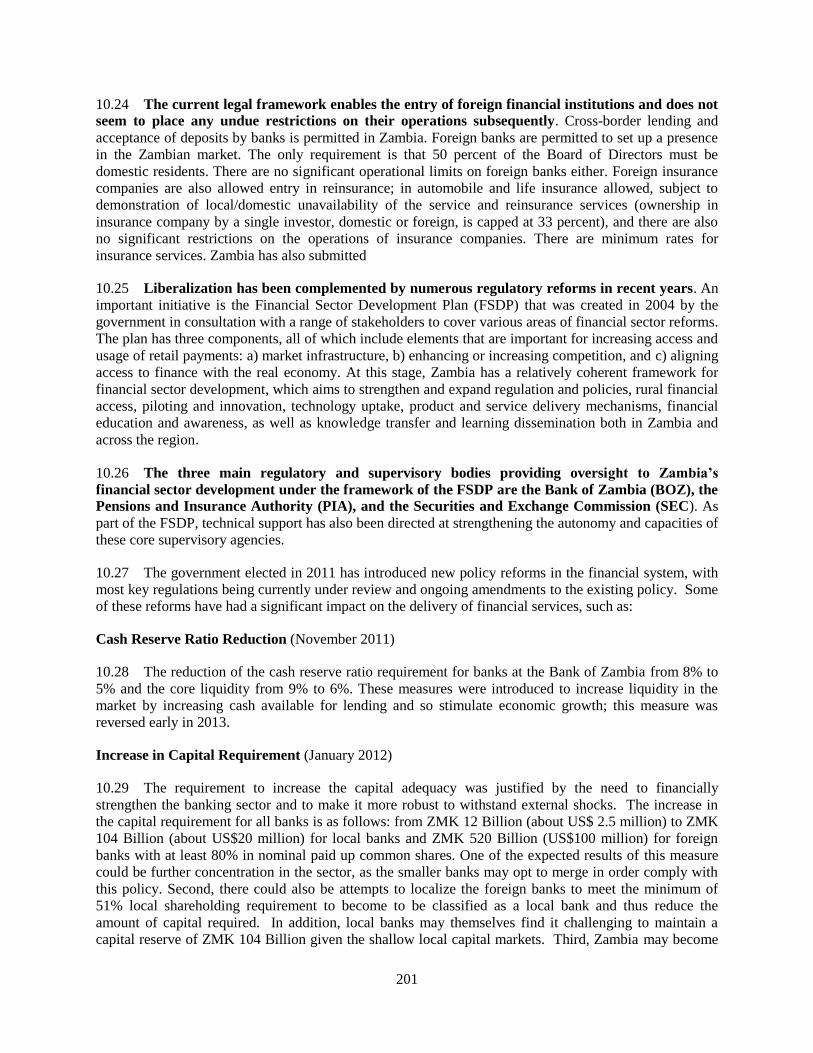
201
10.24 The current legal framework enables the entry of foreign financial institutions and does not
seem to place any undue restrictions on their operations subsequently. Cross-border lending and
acceptance of deposits by banks is permitted in Zambia. Foreign banks are permitted to set up a presence
in the Zambian market. The only requirement is that 50 percent of the Board of Directors must be
domestic residents. There are no significant operational limits on foreign banks either. Foreign insurance
companies are also allowed entry in reinsurance; in automobile and life insurance allowed, subject to
demonstration of local/domestic unavailability of the service and reinsurance services (ownership in
insurance company by a single investor, domestic or foreign, is capped at 33 percent), and there are also
no significant restrictions on the operations of insurance companies. There are minimum rates for
insurance services. Zambia has also submitted
10.25 Liberalization has been complemented by numerous regulatory reforms in recent years. An
important initiative is the Financial Sector Development Plan (FSDP) that was created in 2004 by the
government in consultation with a range of stakeholders to cover various areas of financial sector reforms.
The plan has three components, all of which include elements that are important for increasing access and
usage of retail payments: a) market infrastructure, b) enhancing or increasing competition, and c) aligning
access to finance with the real economy. At this stage, Zambia has a relatively coherent framework for
financial sector development, which aims to strengthen and expand regulation and policies, rural financial
access, piloting and innovation, technology uptake, product and service delivery mechanisms, financial
education and awareness, as well as knowledge transfer and learning dissemination both in Zambia and
across the region.
10.26 The three main regulatory and supervisory bodies providing oversight to Zambia’s
financial sector development under the framework of the FSDP are the Bank of Zambia (BOZ), the
Pensions and Insurance Authority (PIA), and the Securities and Exchange Commission (SEC). As
part of the FSDP, technical support has also been directed at strengthening the autonomy and capacities of
these core supervisory agencies.
10.27 The government elected in 2011 has introduced new policy reforms in the financial system, with
most key regulations being currently under review and ongoing amendments to the existing policy. Some
of these reforms have had a significant impact on the delivery of financial services, such as:
Cash Reserve Ratio Reduction (November 2011)
10.28 The reduction of the cash reserve ratio requirement for banks at the Bank of Zambia from 8% to
5% and the core liquidity from 9% to 6%. These measures were introduced to increase liquidity in the
market by increasing cash available for lending and so stimulate economic growth; this measure was
reversed early in 2013.
Increase in Capital Requirement (January 2012)
10.29 The requirement to increase the capital adequacy was justified by the need to financially
strengthen the banking sector and to make it more robust to withstand external shocks. The increase in
the capital requirement for all banks is as follows: from ZMK 12 Billion (about US$ 2.5 million) to ZMK
104 Billion (about US$20 million) for local banks and ZMK 520 Billion (US$100 million) for foreign
banks with at least 80% in nominal paid up common shares. One of the expected results of this measure
could be further concentration in the sector, as the smaller banks may opt to merge in order comply with
this policy. Second, there could also be attempts to localize the foreign banks to meet the minimum of
51% local shareholding requirement to become to be classified as a local bank and thus reduce the
amount of capital required. In addition, local banks may themselves find it challenging to maintain a
capital reserve of ZMK 104 Billion given the shallow local capital markets. Third, Zambia may become
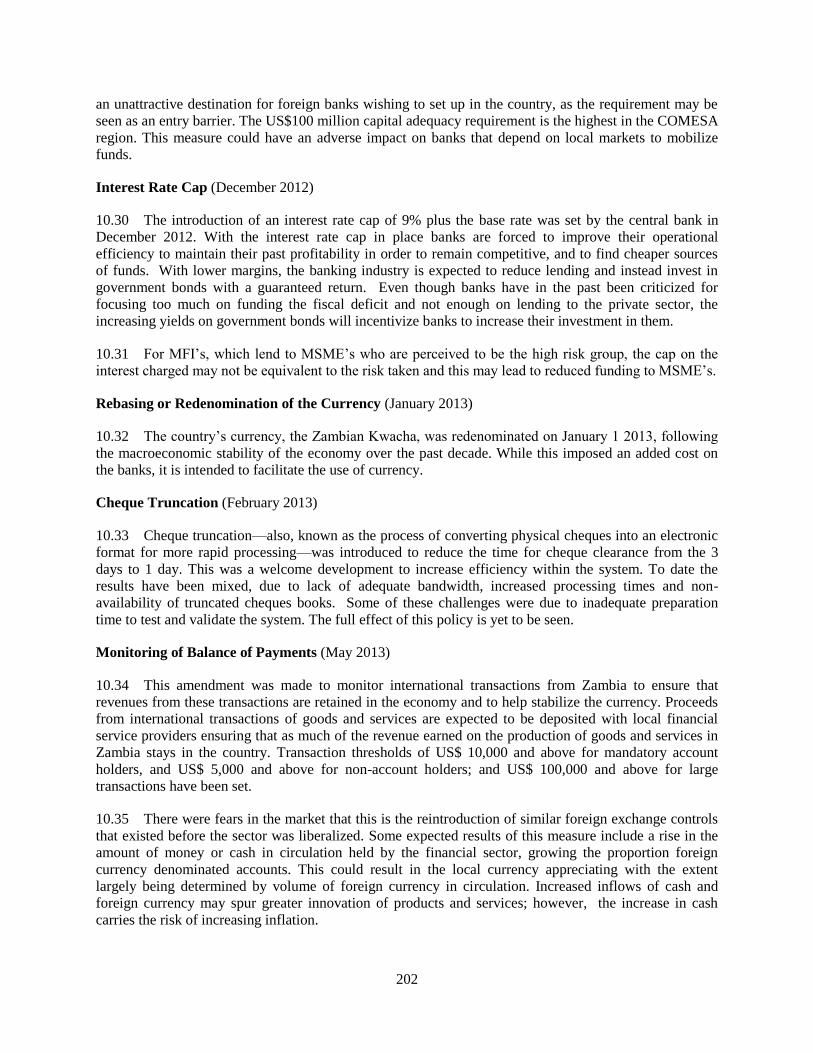
202
an unattractive destination for foreign banks wishing to set up in the country, as the requirement may be
seen as an entry barrier. The US$100 million capital adequacy requirement is the highest in the COMESA
region. This measure could have an adverse impact on banks that depend on local markets to mobilize
funds.
Interest Rate Cap (December 2012)
10.30 The introduction of an interest rate cap of 9% plus the base rate was set by the central bank in
December 2012. With the interest rate cap in place banks are forced to improve their operational
efficiency to maintain their past profitability in order to remain competitive, and to find cheaper sources
of funds. With lower margins, the banking industry is expected to reduce lending and instead invest in
government bonds with a guaranteed return. Even though banks have in the past been criticized for
focusing too much on funding the fiscal deficit and not enough on lending to the private sector, the
increasing yields on government bonds will incentivize banks to increase their investment in them.
10.31 For MFI’s, which lend to MSME’s who are perceived to be the high risk group, the cap on the
interest charged may not be equivalent to the risk taken and this may lead to reduced funding to MSME’s.
Rebasing or Redenomination of the Currency (January 2013)
10.32 The country’s currency, the Zambian Kwacha, was redenominated on January 1 2013, following
the macroeconomic stability of the economy over the past decade. While this imposed an added cost on
the banks, it is intended to facilitate the use of currency.
Cheque Truncation (February 2013)
10.33 Cheque truncation—also, known as the process of converting physical cheques into an electronic
format for more rapid processing—was introduced to reduce the time for cheque clearance from the 3
days to 1 day. This was a welcome development to increase efficiency within the system. To date the
results have been mixed, due to lack of adequate bandwidth, increased processing times and non-
availability of truncated cheques books. Some of these challenges were due to inadequate preparation
time to test and validate the system. The full effect of this policy is yet to be seen.
Monitoring of Balance of Payments (May 2013)
10.34 This amendment was made to monitor international transactions from Zambia to ensure that
revenues from these transactions are retained in the economy and to help stabilize the currency. Proceeds
from international transactions of goods and services are expected to be deposited with local financial
service providers ensuring that as much of the revenue earned on the production of goods and services in
Zambia stays in the country. Transaction thresholds of US$ 10,000 and above for mandatory account
holders, and US$ 5,000 and above for non-account holders; and US$ 100,000 and above for large
transactions have been set.
10.35 There were fears in the market that this is the reintroduction of similar foreign exchange controls
that existed before the sector was liberalized. Some expected results of this measure include a rise in the
amount of money or cash in circulation held by the financial sector, growing the proportion foreign
currency denominated accounts. This could result in the local currency appreciating with the extent
largely being determined by volume of foreign currency in circulation. Increased inflows of cash and
foreign currency may spur greater innovation of products and services; however, the increase in cash
carries the risk of increasing inflation.
203
10.36 An important implication of this measure on trade and financial services is the requirement of
pre-authorization of transactions above the thresholds. Additional documentation must be submitted
including audited accounts, credit scores, and proof of payment of taxes on certain items such as
dividends. These pre-authorization procedures are a cost to the financial institutions in terms of staffing,
infrastructure which will in turn have to be borne by the end-users. The Statutory Instrument (S55I) that
required all importers and exporters to report transactions above $20k to BOZ was revoked in
March 2014.
4. THE PATH AHEAD
10.37 The current legal framework enables the entry of foreign financial institutions and provides
a sound regulatory framework for financial services. Also, while some recent policy actions have been
interpreted as being anti-liberalization—such as the new Minimum Capital Requirement, which has been
considered to discriminate smaller financial institutions in favor or larger ones, and the interest rate cap,
which some say may reduce the incentive for microfinance institutions to finance, and take on the risk of
MSMEs and lend to this important sector of the economy – the country has made significant progress in
strengthening the regulatory framework in financial services.
10.38 Zambia is continuing the implementation of regulatory reforms as part of the second phase
of the Financial Sector Development Plan (FSDP) that will last until December 2014. Key reforms
include the strengthening the autonomy and enhancing the capacities of the three regulatory authorities
namely, the Bank of Zambia (BoZ), Pensions and Insurance Authority (PIA) and Securities and Exchange
Commission (SEC); improving corporate governance among institutions; enhancing the payments
systems; developing appropriate professional information databases, among others. Also, in the context of
low financial inclusion, financial consumer protection and education have rightly emerged among
priorities for financial sector development in Zambia.
10.39 Regional integration and regulatory collaboration and information sharing could support
Zambia’s efforts to strengthen its financial sector. Zambia is committed to regional integration in
financial services. For example, has submitted the schedule of commitments for banking and insurance
services as part of the COMESA services negotiations. It is for the first time that the country is binding its
level of liberalization. Of particular interest in the area of regional integration is regulatory cooperation to
strengthen supervisory capacity, build financial skills among market participants, and modernize
interoperable payments and other financial infrastructure. The COMESA Financial System Development
and Stability Plan and the APEI could offer platforms for such regulatory collaboration initiatives.

204
REFERENCES
Ackello-Ogutu, C. (1996). Methodologies for Estimating Informal Cross border Trade in Eastern and
Southern Africa. Report prepared by Technoserve for the USAID.
Ahmad, L. and M. Walker (2005). Zambia Copperbelt supply chain assessment. IFC.
APEC-OECD (2005). “APEC-OECD Integrated Checklist on Regulatory Reform: A Policy Instrument
for Regulatory Quality, Competition Policy and Market Openness,” Accessed at
http://www.oecd.org/dataoecd/41/9/34989455.pdf
Arvis, JF.., Shepherd, B., Duval, Y., and C. Utoktham (2013). "Trade Costs and Development: A New
Data Set," World Bank - Economic Premise, The World Bank, issue 104, pages 1-4, January.
ASEAN (2004). “ASEAN Mutual Recognition Arrangement Framework on Accountancy Services,”
Accessed at http://vacpa.org.vn/upload/infodoc/mraaccountancy (feb09).pdf.
ASEAN (2005). “ASEAN Mutual Recognition Arrangement on Engineering Services,” Accessed at
http://www.thaifta.com/trade/ascorner/asser_11.pdf.
ASEAN (2007). “ASEAN Mutual Recognition Arrangement on Architectural Services,” Accessed at
http://www.aseanarchitectcouncil.org/pdf/amra.pdf.
Bank of Zambia (2012). Foreign Private Investment and investor perceptions in Zambia – 2012. Lusaka,
Zambia. Retrieved on 15/04/2013 from http://www.boz.zm/
Bartos, P. J. (2007). Is mining a high-tech industry? Investigations into innovation and productivity
advance. Resources Policy, 32(4), 149-158.
Beghin, J., Disdier, A.C., Marette, S., and F. van Tongeren (2011). “Measuring Costs and Benefits of
Non-Tariff Measures in Agri-Food Trade”; Iowa State University working paper 11001.
Benjamin, N. and A. Ahmadou (2012). The Informal Sector in Francophone Africa: Firm Size,
Productivity and Institutions. Washington DC: The World Bank / Paris: Agence Française de
Développement.
Borchert, I., B. Gootiiz and A. Mattoo (2009). “Policy Barriers To International Trade in Services: New
Empirical Evidence”, Policy Research Working Paper 4917, Washington D.C.: The World Bank.
Borchert, I., B. Gootiiz, Goswami-Grover, A. and A. Mattoo (2010). “Landlocked or Policy Locked?
How Services Trade Protection Deepens Economic Isolation”, Policy Research Working Paper 5942,
Washington D.C.: The World Bank.
Bumb, B. L., Johnson, M. E. and P. Fuentes (2011). Policy Options for Improving Regional Fertilizer
Markets in West Africa, IFPRI Discussion Paper, 01084, International Food Policy Research Institute
(IFPRI), Development Strategy Governance Division, Washington DC.
Cattaneo, O. (2007). Tourism: Unfulfilled Promise, in Aditya Mattoo and Lucy Payton (eds.). Services
Trade & Development: The Experience of Zambia. p.214. Washington, DC.
205
Central Statistical Office (2012). Census of Population and Housing: Population Summary Report,
Central Statistical Office (CSO), Lusaka.
Chamber of Mines of Zambia (2005). Survey of the Zambian mining industry 1995 to 2004. Ndola,
Zambia: Mission Press.
Chanda Commission of Enquiry (2011). Report of the Commission of Enquiry into the Operations of the
Zambia Revenue Authority, Lusaka.
Chapoto, A. (2012). The Political Economy of Food Prices Policy: the Case of Zambia. UNU-WIDER
Working Paper No. 2012/100. Helsinki: United Nations University.
Chapoto, A., Govereh, J., Haggblade, S. and J. Thomas (2010). Staple Food Prices in Zambia, paper
prepared for the COMESA policy seminar on “Variation in Staple Food Prices: Causes, Consequences,
and Policy Options”, 25-26 January, Maputo.
Chewe, N., Mason, N., Sitko, N. and T. Jayne (2011). Who Gained and Who lost from Zambia’s 2010
Maize Marketing Policies? Working Paper No. 49. Lusaka: Food Security Research Project.
COMESA (2011a). Report of the Meeting of Ministers on the Operations of the COMESA Simplified
Trade Regime (STR) for Cross Border Traders. Document CS/IPPSD/REFORM/MIN-STR/I/7.
Lusaka: COMESA Secretariat.
COMESA (2011b). Cross Border Trade Bulletin – “Making the CBTA sustainable”. Quarterly magazine
from the REFORM project. Available at http://cbtcomesa.com/
Conway, P. and G. Nicoletti (2006). “Product Market Regulation in the Non-Manufacturing Sectors of
OECD Countries: Measurement and Highlights”, OECD Economics Department Working Papers No.
530.
Dorosh, P. A., Dradri, S. and S. Haggblade (2007). “Alternative Instruments for Ensuring Food Security
and Price Stability in Zambia”. Michigan State University, Department of Agricultural, Food, and
Resource Economics, Food Security Collaborative Working Papers 54488.
DPC & Associates (2010). Final Report on the Evaluation of the COMESA Simplified Trade Regime.
Report prepared for the COMESA Secreatriat, accessible at www.cbtcomesa.com/downloads.php
DSI (2004). A Financial and Economic Analysis of the Costs and Benefits of Managing the Protected
Area Estate. UNDP/GEF Funded Project on Reclassification and Sustainable Management of
Zambia’s Protected Area Systems.
EAC (2006). EAC Mechanism for the elimination of non-tariff barriers ; Arusha, Tanzania : EAC
Secretariat Ellis, Karen; Singh, Rohit; and Musonda, Chiwama (2010). Assessing the Economic
Impact of Competition: Findings from Zambia, Overseas Development Institute (ODI), London.
Engman, M. (2009). The Role of Trade and Transport Issues in the Competitiveness of Zambia’s Copper
Industry, mimeo.
206
Fessehaie, J. (2012a). The dynamics of Zambia’s copper value chain. (Unpublished PhD Thesis).
University of Cape Town, South Africa.
Fessehaie, J. (2012b). What determines the breadth and depth of Zambia’s backward linkages to copper
mining? The role of public policy and value chain dynamics. Resources Policy 37 (4), p. 443 – 451.
FEWS Net. (2012). Zambia Food Security Outlook Update: Government centralizes maize export permit
process (September 2012). Lusaka.
FSRP (2011). Technical Compendium: Descriptive Agricultural Statistics and Analysis for Zambia in
Support of the USAID Mission’s Feed the Future Strategic Review, by Nicholas J. Sitko, Antony
Chapoto, Steven Kabwe, Solomon Tembo, Munguzwe Hichaambwa, Rebecca Lubinda, Harrison
Chiwawa, Mebelo Mataa, Simon Heck, and Dorothy Nthani. Food Security Research Project (FSRP)
Working Paper 52 (WP52), FSRP, Lusaka.
Finscope (2009). Retrieve from: http://www.finscope.co.za/pages/default.aspx.
Fitzmaurice, M. and O. Hartmann (2013). Border Crossing Monitoring along the Northern Corridor.
Washington, DC: Sub-Saharan Africa Transport Policy Program, Working Paper No. 96. Available at
http://www4.worldbank.org/afr/ssatp/Resources/SSATPWP96-border-crossing.pdf
Gereffi, G. (1999). International trade and industrial upgrading in the apparel commodity chain. Journal
of International Economics, 48(1), 37-70.
Gillson, I. (2011). Non-Tariff Barriers to Sub-Saharan African Trade in Food Staples : Opening Regional
Markets to Promote Food Security and Price Stabilization. The World bank, Washington, DC.
Hanlin, R. and C. Hanlin (2012). The view from below: ‘lock-in’ and local procurement in the African
gold mining sector. Resources Policy 37 (4), p. 468 – 474.
Humphrey, J. and H. Schmitz (2002). How does insertion in global value chains affect upgrading in
industrial clusters? Regional Studies, 36(9), 1017-1027.
Imani Development (2009), Non-tariff barrier impact study for COMESA region; mimeo.
IMF. (2012). Zambia 2012 Article IV Consultations (IMF Country Report No. 12/200).
Inter-University Council for East Africa (2011), “Rolling Strategic Plan 2011/12- 2015/16”.
Ityavayar, S. (2013). Women Cross-Border Traders, Challenges and Behavior Change Communications.
Africa Trade Policy Note No. 41. Washington, DC: The World Bank.
Jacobs Consultancy (2010). Chapter 2 Passenger and Cargo Demand FORECAST, Draft Prepared for
National Airports Corporation Limited, Lusaka.
Jensen, M., and J. Keyser (2012). “Standards Harmonization and Trade: The Case of the East African
Dairy Industry”; in O. Cadot and M. Malouche, eds., Non-tariff measures: A fresh look at trade
policy’s new frontier; London/Washington, D.C.: CEPR/The World Bank.
207
Kasanga, J. (2012). Leveraging Zambia’s industrialization with growth of copper mining investments:
Strategy for expanding local manufacturing capacities to supply the Zambian mining industry.
Discussion Paper prepared for the Zambia Mining Local Content Initiative. Lusaka, Zambia.
Keyser, J.C. (2008). Agricultural Competitiveness, Synthesis of Quantitative Results from Mozambique,
Nigeria, Zambia, Brazil, and Thailand, Competitive Commercial Agriculture in Africa (CCAA) Study,
The World Bank, Environmental, Rural, and Social Development Unit, Washington DC.
Kirk, R. (2010), “Addressing Trade Restrictive Non-Tariff Measures on Goods Trade in the East African
Community”; Washington, D.C.: The World Bank, Africa Trade Policy Note #7.
Kunaka, C. and R. Carruthers (2013). Trade and Transport Corridor Management Toolkit, World Bank,
Washington, DC (forthcoming).
Lall, S. (1992). Technological capabilities and industrialization. World Development, 20(2), 165-186.
Lesser, C. and ML. Evdokia (2009). Informal Cross-border Trade and Trade Facilitation Reform in Sub-
Saharan Africa. OECD Trade Policy Working Paper No. 86. Paris: OECD.
LMC International Ltd (2005). The LMC World Wide Survey of Sugar and HFCS Production Costs,
LMC International, Oxford.
Lusaka Times. (2007). Comply with presidential directive. May 22, 2007. MCCM advised.
Mattoo, A. and L. Payton (ed) (2007), “Services Trade and Development: The experience of Zambia”, co-
publication of Palgrave Macmillan and the World Bank.
MINTEL (2009). Zambia Travel & Tourism Intelligence. London.
Ministry of Finance and National Planning (2004). Financial Sector Development Plan for Zambia: 2004-
2009. Bank of Zambia.
Morris, M., Binswanger-Mkhize H., and D. Byrele (2009). Awakening Africa’s Sleeping Giant: Prospects
for Commercial Agriculture in the Guinea Savannah Zone and Beyond, Agriculture and Rural
Development Unit, Sustainable Development Network, The World Bank, Washington, DC.
Morris, M., Kaplinsky, R., and D. Kaplan (2012). One thing leads to another: Promoting industrialisation
by making the most of the commodity boom in sub-Saharan Africa. Raleigh: North Carolina.
Lulu.com.
MTENR (2009). Visitors Arrivals Analytical Report. Lusaka : Ministry of Tourism, Environment and
Natural Resources.
MTENR (2010). Visitors Arrivals Analytical Report. Lusaka : Ministry of Tourism, Environment and
Natural Resources.
Nathan Associates (2011). Definition and Investment Strategy for a Core Strategic Transport Network for
Eastern and Southern Africa, World Bank.
208
Newton Lungu and Associates (2010). Independent Evaluation Report of the CSSDP. Report prepared for
IFC. Lusaka, Zambia.
Njiwa, D. (2012). Informal Cross Border Trade: Challenges and Opportunities – A Case of COMESA and
its STR Implementing Borders. Lusaka: COMESA Secretariat.
Njiwa, D., Nthambi, T., and J. Chirwa (2011). Reconnaissance Survey Report of Informal Cross-Border
Trade at STR Implementing Borders of Zambia, Malawi and Zimbabwe. Unpublished report prepared
by the CBT/REFORM project team. Lusaka: COMESA Secretariat.
Njiwa, D. and P. Oldham (2011). Analysis of the COMESA Simplified Trade Regime (STR) in Practice.
Unpublished paper prepared by the CBT/REFORM project team. Lusaka: COMESA Secretariat.
NKC (2010). The Role of Burley Tobacco in Selected African Economies and the Expected Impact of a
Decline in the Crop’s Production, NKC Independent Economists, Paarl.
Odoki, JB., Anyala, M. and R. Akena (2009). Economic Benefits of an Efficient North-South Corridor:
Strategic Level Analysis of Investments in the North-South Corridor Using HDM-4, University of
Birmingham, Birmingham.
ODI (2010). Competition in Zambia; London, UK.
OECD (1997).The OECD Report on Regulatory Reform: Synthesis. Paris, France.
OECD (2009). Is Informal Normal? Towards more and Better Jobs in Developing Countries. Paris,
France.
PASI The Paralegal Advisory Service Institute (2007). “Changing the Landscape,” Evaluation Report
March 2007, Lilongwe, Malawi.
Raballand, G. and A. Whitworth (2011). Should the Zambian Government Invest in Railways? ZIPAR
Working Paper No. 3, Lusaka.
Raballand, G. F. R., Kunaka, C. and B. Giersing (2008). The Impact of Regional Liberalization and
Harmonization in Road Transport Services: A Focus on Zambia and Lessons for Landlocked
Countries, World Bank Policy Research Working Paper 4482.
RETOSA (2011). Identification of Bottlenecks to Free Trade in Tourism Services in Southern Africa –
Proposed Action Plan. Johannesburg.
SADC (2008). Technical Agreements on Harmonization of Seed Regulations in the SADC Region: Seed
Variety Release, Seed Certification and Quality Assurance, and Quarantine and Phytosanitary
Measures for Seed, Southern Africa Development Community (SADC), SADC Secretariat, Gaborone.
Schlumberger, C. E. (2007). “Air Transport: Revitalizing Yamoussoukro”, chapter 5 in: Aaditya Mattoo
and Lucy Payton (ed), “Services Trade and Development: The experience of Zambia”, co-publication
of Palgrave Macmillan and the World Bank, pp. 191-211.
209
Schneider, F., Buehn, A., and C. Montenegro (2010). New Estimates for the Shadow Economies all over
the World. International Economic Journal 24(4): 443-461.
RDA (2010). Road Condition Report, 2011, Road development Agency, Lusaka.
Republic of Zambia (2011). Sixth national Development Plan: 2001-2015.
Republic of Zambia (2013). Annual Economic Report. Ministry of Finance.
SCCI (2012). Zambia Seed Control and Certification Institute (2011). Annual Report, Ministry of
Agriculture and Livestock (MAL), Seed Control and Certification Institute (SCCI), Chilanga.
Schlumberger, C. (2008). Air Transport: Revitalizing Yamoussoukro, Chapter 5 in Mattoo, A. and L.
Payton (Editors), Services Trade and Development: The Experience of Zambia.
Sichilongo, M., Mulozi, P., Mbewe, B., Machala, C. and J-M. Pavy (2012). Zambia Wildlife Sector
Policy : Situation Analysis and Recommendations for a Future Policy. World Bank, Washington, DC.
Teravaninthorn, S. and G. Raballand (2009). Transport Prices and Costs in Africa: A Review of the Main
International Corridors. World Bank, Washington, DC.
TEVETA (2011). Annual Report 2011. Lusaka, Zambia
Titeca, K. and C. Kimanuka (2012). Walking in the Dark: Informal Cross-border Trade in the Great Lakes
Regions. Report prepared by International Alert for UN Women.
Trolliet, C. and J. Hegarty (2003). “Regulatory Reform and Trade Liberalization in Accountancy
Services”, in Domestic Regulation & Services Trade Liberalization edited by Mattoo, A. and P. Sauve,
World Bank and Oxford University Press, 2003.
UNESCO (2010). Science report: The current status of science around the world. Paris, France.
UNWTO (2013a). Yearbook of Tourism Statistics – Data 2007-2011. Madrid, Spain.
UNWTO (2013b). Compendium of Tourism Statistics – Data 2007-2011. Madrid, Spain.
van Eglen A., Malope P., Keyser J., and N. David (2012). Botswana Agriculture Value Chain Project:
Beef Value Chain Study. Food and Agriculture Organization (FAO). Rome and Botswana Ministry of
Agriculture, Gaborone.
World Bank (2007). Zambia: Economic and Poverty Impact of Nature-based Tourism. Washington, DC.
World Bank (2008). Report on the Observance of Standards and Codes: Zambia. Washington, DC.
World Bank (2010). Trade and Transport Facilitation Assessment: A Practical Toolkit for Country
Implementation. Washington, DC.
World Bank (2010). Reform and Regional Integration of Professional Services in East Africa: Time for
Action. Washington, DC.
210
World Bank (2010). Zambia Impact Assessment of the Fertilizer Support Program, Analysis of
Effectiveness and Efficiency, Report No. 54864-ZM Sustainable Development Department,
Agriculture and Rural Development, Africa Region. Washington, DC.
World Bank (2010a). Democratic Republic of Congo: Diagnostic Trade Integration Study. Washington,
DC.
World Bank (2010b). Enabling Private Sector Development in the land locked Regions of the North-
South Corridor. Washington, DC.
World Bank (2011a).Harnessing Regional Integration for Trade and Growth in Southern Africa.
Washington, DC.
World Bank (2011b). More Jobs and Prosperity in Zambia: What Would it Take? – Based on the Jobs and
Prosperity: Building Zambia’s Competitiveness Program. Washington, DC.
World Bank (2012a). Burundi: Diagnostic Trade Integration Study. Washington, DC.
World Bank (2012b). De-fragmenting Africa: Deepening Regional Trade Integration in Goods and
Services. Washington, DC.
World Bank (2012c). Report on the Implementation of the Accountancy Professional Mutual Recognition
Agreement in the East African Community. Washington, DC.
World Bank (2012d).Streamlining NTMs: A toolkit for policy makers. Washington, DC.
World Bank (2013a).Africa Tourism Report - Tourism in Africa: Harnessing Tourism for Growth and
Improved Livelihoods. Washington, DC.
World Bank, IFC. (2013b). Doing Business 2013 – Zambia. Washington, DC.
World Bank (2013c). Light Manufacturing in Zambia Targeted Policies to Enhance Private Investment
and Create Jobs. Washington, DC.
World Bank (2013d).Project Concept Note for First Regional Development Policy Operation for the
Accelerated Program for Economic Integration. Washington, DC.
World Bank (2013e).Survey on Professional Services. Washington, DC.
World Bank (2013f). Zambia Economic Update, March 2013. Lusaka.
World Copper Output (2012). Retrieved on 15/04/2013 from:
http://minerals.usgs.gov/minerals/pubs/commodity/copper/mcs-2013-coppe.pdf
World Economic Forum (2012). Global Competitiveness Report 2012. Geneva.
World Economic Forum (2013). The Travel & Tourism Competitiveness Report 2013. Geneva.
WTTC (2013). Travel & Tourism Economic Impact 2013 – Zambia. London: World Travel & Tourism
Council.
211
Zambia’s Mines and Minerals Development Act (2008). Retrieved from:
http://www.revenuewatch.org/sites/default/files/MINES_AND_MINERALSDEVELOPMENT_ACT,
2008-4.pdf
Zambia (2011). National Quality Policy. Lusaka, Zambia: Ministry of Commerce, Trade and Industry
Zambia Customs and Forwarding Agents Association (2012). Letter to ZRA dates 23 September, 2012
ZNFU (2012). A Review of Council Fees and Charges on Livestock Sector in Zambia. Zambia National
Farmers Union (ZNFU), Lusaka.